Article

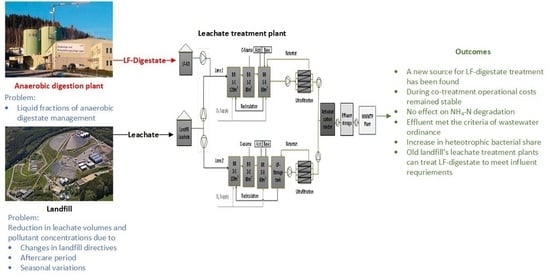
Co-Treatment of Landfill Leachate and Liquid Fractions of Anaerobic Digestate in an Industrial-Scale Membrane Bioreactor System

by
Nitesh Babu Annepogu
1,*,
Pascal F. Beese-Vasbender
2,
Himanshu Himanshu
1,
Christian Wolf
1 and
Astrid Rehorek
1
1
Metabolon Institute, TH Köln (University of Applied Sciences), Am Berkebach 1, 51789 Lindlar, Germany
2
Bergischer Abfallwirtschaftsverband Braunswerth 1-3, 51766 Engelskirchen, Germany
*
Author to whom correspondence should be addressed.
Processes 2022, 10(6), 1140; https://doi.org/10.3390/pr10061140
Submission received: 6 April 2022 / Revised: 26 May 2022 / Accepted: 31 May 2022 / Published: 6 June 2022

Abstract

:
The management of the liquid fraction of digestate produced from the anaerobic digestion of biodegradable municipal solid waste is a difficult affair, as its land application is limited due to high ammonium concentrations and the municipal waste that water treatment plants struggle to treat due to high pollutant loads. The amount of leachate and the pollutant load in the leachate produced by landfills usually decreases with the time, which increases the capacity of landfill leachate treatment plants (LLTPs) to treat additional wastewater. In order to solve the above two challenges, the co-treatment of landfill leachate and the liquid fraction of anaerobic digestate in an industrial-scale LLTP was investigated along with the long-term impacts of the liquid fraction of anaerobic digestate on biocoenosis and its impact on LLTP operational expenses. The co-treatment of landfill leachate and liquid fraction of anaerobic digestate was compared to conventional leachate treatment in an industrial-scale LLTP, which included the use of two parallel lanes (Lane-1 and Lane-2). The average nitrogen removal efficiencies in Lane-1 (co-treatment) were 93.4%, 95%, and 92%, respectively, for C/N ratios of 8.7, 8.9, and 9.4. The average nitrogen removal efficiency in Lane-2 (conventional landfill leachate treatment), meanwhile, was 88%, with a C/N ratio of 6.5. The LLTP’s average chemical oxygen demand (COD) removal efficiencies were 63.5%, 81%, and 78% during phases one, two, and three, respectively. As the volume ratios of the liquid fraction of anaerobic digestate increased, selective oxygen uptake rate experiments demonstrated the dominance of heterotrophic bacteria over ammonium and nitrite-oxidising organisms. The inclusion of the liquid fraction of anaerobic digestate during co-treatment did not cause a significant increase in operational resources, i.e., oxygen, the external carbon source, activated carbon, and energy.

Graphical Abstract

1. Introduction

The world produces about 2.01 billion tons of municipal solid waste annually, which is expected to increase by at least 50% by 2050 [1]. The traditional method used for municipal solid waste management since industrial revolution has been landfill, leading to a high number of landfills spread across the world, with the EU alone having more than 500,000 landfills [2,3]. Although most of developed economies are moving towards a circular economy, with aim to completely stop the practice of landfills, the existing landfills require constant and active management to stop potential environment disasters, e.g., the gaseous and liquid emissions of landfills deposited with municipal solid waste need to be managed in order to avoid the emission of GHGs and the contamination of natural waterways [4]. The liquid emission from landfills, i.e., landfill leachate (LL), needs to be treated in a separate wastewater treatment plant due to the high levels of biological oxygen demand (BOD), the chemical oxygen demand (COD), the presence of chloride, a low pH, the presence of heavy metals, and its high ammonium content [2].
Although LL characteristics may vary from landfill to landfill and over time and space at a particular landfill [5], a general trend has been observed in most landfills, i.e., the volume of leachate produced by landfills is larger in the first 5 to 10 years and decreases as the landfill ages [6]. Also, the pollutant concentrations in landfills reduce over time due to several reasons, e.g., organic leachate concentrations will decrease due to the anaerobic degradation of organic materials, resulting in the production of methane and carbon dioxide and a reduction in the C/N ratio [7]. Furthermore, the implementation of both the Landfill Directive (1999/31/EC) and its follow-up amendments and the Waste Framework Directive (2008/98/EC) (EU, 2018a) [8], which, by the year 2035, aims to reduce the amount of municipal solid waste going to landfill by 55% and the amount of biodegradable municipal waste by 90% compared to the levels in 1995, has also contributed to a decrease in the total amount of waste going to landfill, pollutant loads, and the volume of leachate produced per tonne of waste that is landfilled [6]. Thus, this has increased the capacity of landfill leachate treatment plants (LLTPs) to treat additional wastewater. These LLTPs can potentially accept external wastewater from a wide variety of sources including LL from landfill classes I–III, process water from mechanical-biological treatment plants, and biowaste fermentation wastewater.
In several EU countries, e.g., Germany, the landfilling of biodegradable municipal waste has subsequently been replaced with more substantial processes, e.g., anaerobic digestion, and several former municipal solid waste landfills have setup industrial anaerobic digestion facilities to treat biodegradable municipal waste, with the logistics of waste collection and presence of free land making this possible. Although anaerobic digestion is a more sustainable method for biodegradable municipal waste treatment, it has its own challenges, including the management of digestates [9]. The digestate produced from the anaerobic digestion of biodegradable municipal waste is rich in recyclable compounds, e.g., water, undigested carbon, nitrogen, phosphorus, and many other nutrients, and thus can be used as soil conditioner/fertilizer. However, the digestate of biodegradable municipal waste is considered to be ‘waste’, prohibiting its use on land, with the recommended management route being treatment in a wastewater treatment plant (EU Waste Framework Directive (2008/98/EC)). Also, the majority of nitrogen in digestate comes in the form of ammonium, which limits its land applications (European Nitrates Directive). Maria and Sisani [10] investigated the sustainability and associated economic costs of the digestate of biodegradable municipal waste in terms of land applications and its treatment in a municipal wastewater treatment plant and reported that the wastewater treatment plant option has a lower contribution to global warming and acidification potential but that the economic cost of this option is about ten times higher compared to land applications.
In order to meet the EU Waste Framework Directive (2008/98/EC), the digestate from the anaerobic digestion of biodegradable municipal waste is usually separated into liquid and solid fractions, whereby the solid fraction is used for land applications and the liquid fraction is co-treated with sewage in a municipal wastewater treatment plant in a conventionally activated sludge process that comprises nitrification and denitrification [10,11]. However, the inclusion of the liquid fraction increases the amount of energy and materials consumed by municipal wastewater treatment plants, as these plants are typically built to handle the low levels of organic matter and nutrients present in household effluents [12]. Furthermore, other pollutants, e.g., heavy metals and anthropogenic organic compounds, may not be effectively dealt with by the biological processes of the wastewater treatment plant and will be present in the plant’s discharge or sludge. Some researchers have investigated other biological methods such as deammonification or anaerobic ammonium oxidation (anammox) at a lab scale for the treatment of the liquid fractions of anaerobic digestate (LF-AD), with these studies showing promising results, but the challenges associated with high salinity, the inhibitory potential of the digestate, anammox bacteria’s low tolerance to environmental changes, and the limitations placed on the maximal nitrogen removal efficiency (NRE) have to be overcome before their industrial application [9]. As an alternative to biological methods, different physical and chemical treatments methods for LF-AD treatment, e.g., membrane filtration, evaporation, or combinations of different procedures, have also been investigated, and while these methods are effective, they can also be expensive [13,14]. For example, membrane-based treatment methods are efficient but are highly expensive due to their high capital costs, high cleaning costs due to fouling, and associated short membrane lifespans [15]. To overcome the limitations of individual physical, chemical, or biological treatments methods, some researchers have tested a combination of biological and physical/chemical methods and reported satisfactory performance. For example, Fang et al. [16], in pilot-scale study, demonstrated how the combination of a membrane bioreactor system and a granular activated carbon (GAC) filter removed a broader range of micropollutants, such as phenolic compounds, bacteria, and microplastic particles, at very low concentrations and highlighted the method’s greater potential for improvement in terms of environmental impact and cost. These results suggest that a combination of biological and chemical/physical methods can yield better results in a cost-effective manner.
An alternative strategy for LF-AD treatment is co-treatment with LL in a LLTP which is designed to handle high pollutant loads and in which the activated sludge is already adapted to higher concentrations of NH4-N, COD, and BOD and is generally equipped with additional physical/chemical treatment methods which are usually not present in municipal wastewater treatment plants. Previous research which examined the co-treatment of LL and LF-AD at an on-site membrane bioreactor pilot plant (1.5 m3) indicated that gradually increasing the LF-AD volume ratios resulted in successful ammonium removal [17]. However, no long-term industrial-scale study on the co-treatment of LL and LF-AD has been reported. Thus, the core aim of the present study was to investigate, at an industrial scale and in the long term, the co-treatment of LF-AD and LL at an LLTP. Furthermore, the proportions of metabolically active microbial groups in the activated sludge and the specific operational costs, i.e., the energy required, the external carbon source, and the amount of activated carbon and oxygen, were also measured and compared to the solo treatment of LL.

2. Materials and Methods

The study was conducted at an industrial LLTP which treats approximately 120,000 m3–190,000 m3 of LL per year [18], LL which originates from Leppe landfill, Lindlar, North Rhine-Westphalia, Germany. This landfill became operational in 1982 and has received about 9 million m3 of municipal solid waste (including organic and green waste, household waste, bulky waste, paper, and packaging), inert materials (including cover materials and construction waste), and incineration ash on an area of 29 ha [19]. Since 2005, only incineration ash has been deposited in the landfill. Meanwhile, biodegradable municipal waste is now treated at an on-site industrial-scale anaerobic digestion plant.
As shown in Figure 1, the Leppe landfill is divided into different landfill sections (LS) based on the chronological order of waste deposition. LS 1-5 corresponds to the deposition of municipal waste in the lower and middle layers, with ash from municipal solid waste incineration in the upper layer, while LS 6.1 contains only non-hazardous waste with very low organic content and demonstrated a very low pollutant release in a leaching test. The leachate to be treated at the facility comes from various LSs, extraction wells (ETW), associated stream drainage, sealing wall water, and stream piping. The leachate from LS 1-3, LS 4/5, and LS 6.1 are routed independently to storage tanks. Each storage tank has a 1500 m3 capacity. Depending on the storage tanks’ free capacities and the leachate’s NH4-N and COD contents, the leachate is then pumped to the LLTP.
The LF-AD was obtained from the onsite industrial anaerobic digestion plant, which digests approximately 300,000 tonnes of biodegradable municipal waste every year under mesophilic conditions (37 °C), with a hydraulic retention time of about 25 days, and generates 20,000 m3/year of wastewater, i.e., LF-AD, annually. The LF-AD is generated by a two-stage sludge dewatering process using screw presses and belt filters to separate large-grained particles, and then the liquid fractions of this wastewater are discharged into a wastewater tank. About 50% of the LF-AD is sold as liquid fertilizer and the remaining 50% is treated at a separate municipal wastewater treatment plant at an additional treatment cost [18]. For the present study, a portion of the LF-AD was stored regularly in an additional storage tank (250 m3) at the LLTP. The relevant physical and chemical parameters of the LL and LF-AD were analysed daily and, according to the required ammonium load, both wastewaters were pumped as influent into the LLTP.
Table 1 shows the chemical and physical characteristics of the LL and the LF-AD. The wide ranges that are observable in the case of the LL, as shown in Table 1, are due to the qualities of the different kinds of water collected at the Leppe landfill. The lower end of the depicted range is water collected in the drainage layer beneath the basis liner, and the upper end is LL collected directly from the MSW waste body (LS 1–3 and LS 4–5). LF-AD concentrations vary due to differences in biowaste material types as well as seasonal changes in vegetation.

2.1. Estimating the Potential Additional Inflow Rate through LF-AD

The theoretically available additional influent capacity as a result of the co-treatment of LF-AD and LL was calculated using data from the previous three years on the available free influent capacity and available free COD load at the LLTP, according to [20]. The LLTP has a maximum COD loading rate of 787 kg/d and a 580 m3/d influent capacity. As a result, using an average influent rate and the COD values of the LLTP and LF-AD, the possible free influent volume capacity was projected (Table 2). Theoretically, the estimated free influent volume capacity corresponding to the situation was 20%.

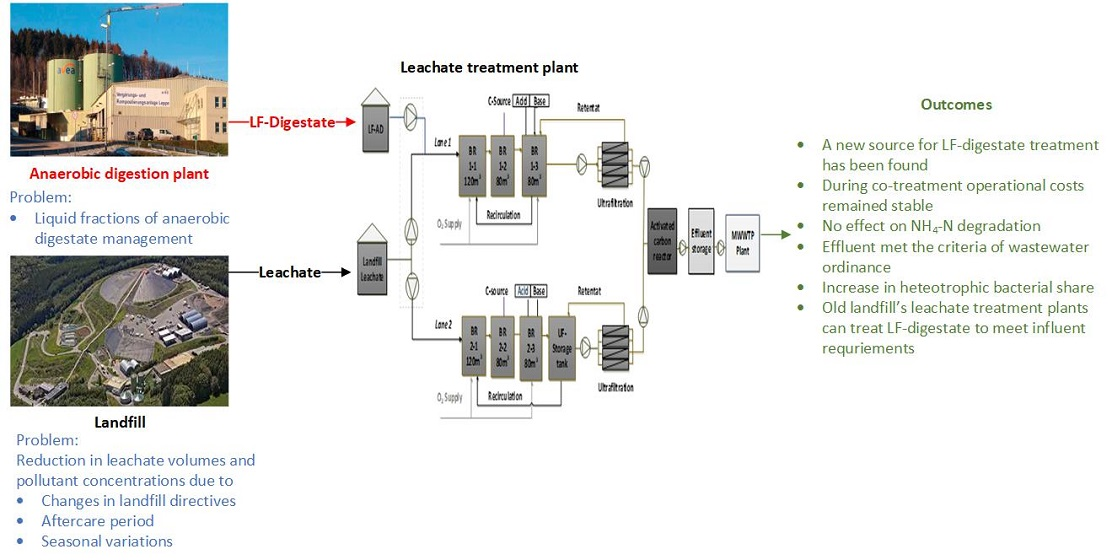
2.2. Experimental Plant Operation

The process flow of the Leppe LLTP is shown in Figure 2. The LLTP has a total capacity of 560 m3, with two parallel lanes (280 m3 each). Lane-1 (L-1) and Lane-2 (L-2) of the LLTP can be supplied with maximum influent capacities of 150 and 323 m3/d, respectively. The first treatment is the activated sludge process, which includes six bioreactors with capacities of two times 120 m3 and four times 80 m3.
The bioreactors are arranged in two lanes based on a scheme of nitrification, denitrification, and nitrification. In addition, there is an ultrafiltration (UF) storage tank; in this study, the UF storage tank was used only for L-2 to avoid the possibility of mixing sludge from the two lanes. After biological treatment in the two lanes, the activated sludge is pumped to a UF unit. The purpose of the UF is to separate the treated leachate from the biomass and the decomposed content. The concentrate is returned to the bioreactors as retentate to maintain bacterial density in the biology. The sludge that is no longer needed for degradation is removed from the system in defined quantities. This sludge is commonly referred to as excess sludge or surplus sludge. The permeate from UF is then fed into five GAC filters. The activated carbon filters are used for the adsorptive retention of dissolved substances that are very difficult or impossible to biodegrade, such as inert COD compounds and AOX components [21]. The pretreated wastewater is then discharged to the Bickenbach municipal wastewater treatment plant in accordance with the requirements of Wastewater Ordinance [22].

2.3. Physico-Chemical and Statistical Data Analysis

Nitrogen components (NH4-N, NO2-N, NO3-N), orthophosphate (PO4-P), and COD were measured in the influent (LL and LF-AD), bioreactors, permeate, and final effluent. The pH, dissolved oxygen, and electrical conductivity were regularly monitored in the bioreactors to ensure a stable process. According to You et al. [23], the heavy metals (copper, zinc, lead, nickel, and silver) and calcium in LF-AD and LL can be examined using a SeptraA50 Atomic Absorption Spectrometer to determine their influence on LLTP biocoenosis. The digital image analysis of the activated sludge particles was carried out using a dynamic image analyser (EyeTech, Ankersmid). The daily measurements of NH4-N, NO2-N, NO3-N, COD, and PO4-P were based on German standards using Hach Lange cuvette test kits and a Hach Lange spectrophotometer (DR6000, Hach, USA). The total nitrogen (TN) per mg/L in the effluent was estimated to be the sum of NH4-N, NO3-N, and NO2-N expressed as mg/L. For the influent, only NH4-N was measured, as NO2-N and NO3-N were insignificant. To determine the performance efficiency of the LLTP treatment process, the nitrogen removal efficiencies were calculated for the daily values using the Equation (1), based on Niu et al. [24].
N R E = 100 × T N i T N o T N i
where TNi in mg/L is the total nitrogen concentration in the influent and TNo in mg-N L−1 is the total nitrogen concentration in the effluent. The COD removal efficiencies were calculated based on Equation (2).
C O D R E = 100 × C O D i C O D o C O D i

2.4. Selective Oxygen Uptake Rate (SOUR)

This study used the DIMA-CenoTOX® (DIMATEC Analysentechnik GmbH), a device that allows for the early detection of changes in the biomass of the LLTP by monitoring the respiratory activity of different groups of organisms (ammonium oxidizing organisms (AOO), nitrite oxidizing organisms (NOO), and heterotrophs). The activity of carbon oxidizing (heterotrophic) and nitrifying organisms (AOO and NOO) in the aerobic biomass of the LLTP (BR1-1 and BR2-1) was determined. To obtain a homogeneous mixture before measurement and to reduce residual nitrogen sources, a 15-L sample of the activated sludge was taken from the LLTP and continuously stirred and aerated in a separate 20-L tank overnight at 100 RPM. Measurements were then performed according to Steiner et al. [25]. In addition, the aeration time was increased from 360 s to 720 s during the measurement in Phase 2 of this study to account for the increased NH4-N concentration in the bioreactor. Groups of microorganisms can be inhibited in terms of their oxygen consumption by the inhibitory compounds allylthiourea and azide. Allylthiourea is known to inhibit ammonia oxidation at concentrations of between 8 and 80 μM, and azide (N3) is a selective bacteriostatic active in Gram-negative bacteria and is known to inhibit nitrite oxidation [26]. The concentrations derived from the literature and the self-applied concentrations and volumes are shown below in Table 3. The inhibitor concentrations used by Ginestet et al. [26] (allylthiourea = 86 μM; azide = 24 μM) did not result in the complete inhibition of ammonium oxidizing and nitrite oxidizing organisms in the activated sludge of the LLTP; therefore, inhibitor concentrations of 120 μM ATU and 86 μM azide were used in this study.

2.5. Operational Resources

During co-treatment and conventional LL treatment, the operational resources required for the treatment and the performance efficiency of the LLTP were assessed. The specific operational resources, i.e., the energy required, the external carbon, the activated carbon, and the oxygen of the LLTP were calculated using data from six years of conventional LL treatment and two years of combination treatment.

3. Results and Discussion

Both LLTP lanes were operated independently to the compare the performances of the two lanes in terms of treatment. Figure 3 provides the concentrations of NH4-N, COD, and PO4-P in the LL and LF-AD. Compared to the LL, the concentrations of NH4-N and COD in the LF-AD were approximately 5 and 10 times higher, respectively. There was a significant difference in terms of total phosphorus concentration between the LL and LF-AD. Therefore, as shown in Table 4, different phases were implemented in this study to slowly adapt the microorganisms in the active sludge of L-1, the lane with LF-AD. Throughout the investigation, the NH4-N and COD concentrations in the LL varied from 300 to 600 mg/L and 500 to 1100 mg/L, respectively. The concentration of NH4-N in the LF-AD ranged from 1500 to 3000 mg/L, whereas the COD was between 5000 and 11,000 mg/L. The LL contained 468 mg/L NH4-N and 821 mg/L COD on average throughout the study, while the LF-AD contained 2109 mg/L NH4-N and 8633 mg/L COD. The variation in the LF-AD concentrations was caused by differences in the biowaste material types as well as seasonal changes in vegetation. The NH4-N concentration in the influent has a decisive influence on oxygen demand and the external carbon source (acetic acid). According to [27,28], each mole of NH4-N oxidized to nitrate nitrogen requires two moles of O2, resulting in an oxygen requirement of 4.571 g O2/g NO3-N generated. Therefore, the O2 requirement was expected to be higher during the combined treatment since the NH4-N concentration in the LF-AD was high.
Furthermore, denitrification necessitates the inclusion of an external carbon source, which raises the operational costs along with increasing the amount of sludge. In addition, the non-biodegradable COD loading in the LF-AD has a significant impact on the activated carbon stage. The main factors that can influence activated carbon treatment are the activated carbon capacity, the kg of COD removed per kg of activated carbon, and the concentration of organic matter in the wastewater exposed to the activated carbon [29]. Consequently, in the combined treatment at higher COD loads, the consumption of activated carbon was anticipated to be higher than in conventional LL treatment. Taking all these factors into consideration, a gradual increase in the proportion of the LF-AD was planned to achieve long-term stable operation with constant nitrogen loading. Table 4 depicts the influent flow rates during the experiments in both lanes, average nitrogen load (N Load), COD load from the influent, and C/N ratios throughout the study. The C/N ratios were calculated based on the COD load from the external carbon source (60% acetic acid) and the COD load in the influent. Based on the amount of LL collected and the required ammonium load, the influent rate in both lanes was adjusted. In this investigation, L-1 was used for the combined treatment (LL + LF-AD) in phases 1 and 2, while L-2 was used for the conventional LL treatment (Table 4).
  • Phase 0: both lanes were provided with LL.
  • Phase 1: Preliminary phase for the LF-AD in the LLTP; the substitution of 10% of the NH4-N load (v/v) with LF-AD.
  • Phase 2: An increase in the volume percentage of the NH4-N load from the LF-AD; the substitution of 20% of the NH4-N load (v/v) with LF-AD.

3.1. Nitrification Activity in the Bioreactors of the Leachate Treatment Plant

In Phase 1, the biocoenosis in L-1 was first slowly acclimated to a 2.5% volumetric influent rate (10% NH4-N load) from the LF-AD before being increased to 5% in Phase 2. Figure 4a,b display the overall concentrations of NH4-N, NO2-N, and NO3-N in the first nitrification bioreactors (BR 1-1 and BR 2-1) of both lanes during the different phases of the experiment. No detrimental effect on NH4-N elimination in L-1 during phases 0 and 1 was observed. This was almost identical to the conventional LL treatment. In both lanes, the NH4-N concentrations remained below 3 mg/L in the bioreactors. However, during phase 2, the NH4-N concentration in the BR 1-1 increased significantly and averaged 8 mg/L throughout the trial, which was attributed to technical issues affecting the oxygen supply in L-1 and inconsistencies in the proportions of metabolically active groups (Figure 5) caused by the high COD load in the LF-AD, resulting in a high C/N ratio and the dominance of heterotrophic bacteria over nitrifying organisms. According to CenoTox results, the proportion of heterotrophic species in the activated sludge mixed culture increased during Phase 2. The effect of increasing the C/N ratio, leading to the dominance of heterotrophic bacteria over nitrifying bacteria, was previously discovered by HU et al. [30], who performed 16s gene fragment analysis. According to a recent study by Chuda and Ziemiski [31] on treating the LF-AD with an activated sludge process in lab scale experiments, an increase in the COD/NO3–N ratio in the influents resulted in a decrease in the quantity of nitrifying bacteria. This was most likely due to the nitrifiers’ inability to compete for oxygen with heterotrophs at high COD concentrations. Carrera et al. [32] also showed that changing the COD/N ratio in the influent from 2.6 to 3.4 resulted in a reduction in autotrophic bacteria from 2 to 1.5% during the process of removing biological nitrogen from high-strength ammonium industrial wastewater. However, despite the high C/N ratio and preponderance of heterotrophic communities in the current study, nitrifying bacteria thrived at the same time, and the nitrification process was able to coexist. Aside from that, until the end of Phase 1, the NO2-N concentration was close to zero throughout the trial. A modest increase in the NO2-N concentration was found during Phase 2. The above-mentioned dominance of heterotrophic bacteria in bioreactors was also responsible for the variations in NO2-N concentrations, as the share of NOO reduced during Phase 2 (Figure 5). Furthermore, NO3-N concentrations in L-1 for the most part remained below 60 mg/L. Since the C/N ratio was higher in L-1, the NO3-N concentration was lower than in L-2, resulting in better denitrification. The biodegradable carbon source in the LF-AD might have supported denitrification to some extent. Zhang et al. [33] studied the prospect of utilizing the LF-AD as a carbon source for improving denitrification. The total NRE was 98%, which was nearly equal to sodium acetate. The LF-AD took longer to attain 98% NRE than sodium acetate because of the presence of slowly biodegradable COD. One of the key parameters impacting the denitrification process, according to Choubert et al. [34], is the concentration of biodegradable COD. Quan et al. [35] observed that the highest denitrification rates are achieved when readily biodegradable organic matter is used. The readily biodegradable COD and slowly biodegradable COD in the LF-AD could be utilized to enhance denitrification in L-1 by extending the denitrification phase’s residence time. This approach should result in stable NO3-N elimination as well as a reduction in the COD load on activated carbon filters.
In L-2, the NH4-N and NO2 concentrations were nearly constant throughout the experiment. The NH4-N load in L-2 was higher than in L-1 in order to handle the daily leachate treatment volumes, as stated in Table 4. Obaja et al. [36] and Dosta et al. [37] achieved the highest specific ammonium utilisation activity in lab scale SBR reactors when treating the liquid fraction of digested piggery wastewater and centrifuged reject water from an anaerobic digester with high NH4-N concentrations. This indicates that a high ammonia nitrogen content in the influent stimulates strong nitrifier activity in the activated sludge [38]. The SOUR test findings from L-2 revealed a steady AOO and NOO microbial population (Figure 5). Moreover, due to a pH electrode malfunction, there was a slight increase in the NH4-N concentration in Phase 2. An abrupt drop in pH in the bioreactor generated an increase in the NH4-N concentration, which was stabilized after recalibration. Since the C/N ratio was low, there was no evidence of heterotrophic bacteria dominance in L-2 (Figure 5). But due to the low C/N ratio and high NH4-N load, the NO3-N concentration in L-2 was relatively high. Chuda and Ziemiski [31], who worked with a variety of carbon sources and COD/NO3–N ratios for the LF-AD treatment in a lab scale activated sludge process, found that as the COD/NO3–N ratio in the influents declined from 8.5 to 6.2 and 5.2, the number and activity of denitrifying bacteria in the activated sludge decreased as well. Therefore, the low C/N ratio in L-2 could be a possible reason for the reduced activity of heterotrophic bacteria when compared to L-1, which could have resulted in the accumulation of NO3-N in the bioreactors.

3.2. Selective Oxygen Uptake Rate in the Nitrification Bioreactors

SOUR analyses were conducted to evaluate the toxicity of the LF-AD with regard to biocoenosis in L-1 and to analyse the stability of the first nitrification stage in both lanes. Figure 6 illustrates the average share of bacterial groups in the bioreactors (BR 1-1 and BR 2-1) of both lanes of the LLTP over the three treatment phases. The mean percentages of heterotrophic bacteria, NOO, and AOO in L-1 during Phase 0 were 33.61%, 23.20%, and 43.20%, respectively. During Phase 1, the concentration of NOO decreased to 17.50%, whereas the concentrations of AOO and heterotrophic bacteria increased to 49.25% and 45%, respectively. Furthermore, the amounts of AOO, NOO, and heterotrophic bacteria in Phase 2 were 36%, 7.35%, and 62.65%, respectively. Figure 5 shows the dominance of the heterotrophic bacterial population over the nitrifying bacterial population in Phases 1 and 2. The proportion of heterotrophic organisms in L-1 increased as the proportion of the LF-AD increased. The presence of more heterotrophic bacteria in L-1 was most likely due to the high COD content in the LF-AD (Figure 3), which might have resulted in high C/N ratios in L-1. The C/N ratio influences the amount and activity of bacteria in activated sludge as well as the efficiency of the nitrification and denitrification processes [39]. Chuda and Ziemiski [31], when treating the LF-AD in an activated sludge process with a separate denitrification chamber, revealed an increase in denitrifying bacteria counts from 3 × 10¹⁰ cells/L to 6.1 × 10¹⁰ cells/L to 8.8 × 10¹⁰ cells/L with C/N ratios of 5.2, 6.2, and 7.5, respectively, in an RT-PCR test. As a result, as the COD/NO3–N ratio in the influents increased, the number of denitrifying bacteria in the activated sludge increased. Carrera et al. [32] and Wu et al. [40] also showed that, at high C/N ratios, heterotrophic bacteria outnumber nitrifying bacteria, resulting in a decrease in the amount of ammonium removed. However, in this study, despite the high C/N ratios and the dominance of heterotrophic bacteria, the amount of nitrifying bacteria also grew and nitrification coexisted in the biocoenosis. This indicates the high functional reserve capacity of the site adapted the activated sludge biocoenosis concerning ammonium oxidation. On the other hand, the inhibition of nitrifying bacteria by heavy metals in the LL and LF-AD may also be a possible reason for the decrease in AOO and NOO shares. Several studies [40,41,42] have found a wide range of heavy metals in landfill leachate and LF-AD, including cadmium (Cd), chromium (Cr), cobalt (Co), copper (Cu), iron (Fe), lead (Pb), manganese (Mn), arsenic (As), nickel (Ni), and zinc (Zn). However, the amount and concentration of heavy metals in leachate varies by landfill. Kapoor et al. [43] looked at the transcriptional responses of amoA, hao, nirK, and norB, as well as the specific oxygen uptake rate for nitrifying enrichment cultures subjected to different metals (Ni (II), Zn(II), Cd(II), and Pb(II)). With increasing quantities of Ni (II) (0.03–3 mg/L), Zn (II) (0.1–10 mg/L), and Cd (II) (0.03–1 mg/L), they found a substantial decrease in the SOUR. When exposed to Ni (II) doses, the transcript levels of amoA and hao reduced, according to RT-PCR results. After exposure to 0.3–3 mg/L Zn (II), amoA, hao, and nirK expression increased slightly (0.5–1.5-fold), though it reduced for 10 mg/L Zn (II). A SOUR test performed by Liu et al. [44] to determine nitrification kinetics under CU(II) and AS (III) stress showed a significant decrease in the SOUR of the sludge with an increase in heavy metals concentrations. Therefore, to rule out possible heavy metal effects as a possible cause for the decrease in NOO and AOO content in the biocoenosis of L-1, atomic absorption spectroscopic measurements were performed for the LL and LF-AD. The amounts of various heavy metals in the landfill leachate and LF-AD examined in this investigation are shown in Table 5. In both the LL and LF-AD, the data showed 2–3 mg/L lead, and there was 41.20 mg/L calcium in the LL. In the LF-AD, however, only 12.27 mg/L calcium was observed. In a comparable concentration range, Huang et al. [23] found that lead (Pb), cadmium (Cd), or nickel (Ni) had no significant influence on nitrification. Furthermore, Zhang et al. [45] discovered that calcium concentrations ranging from 0 to 150 mg/L increased nitrification and denitrification. The toxic heavy metal concentrations in the LF-AD and LL were found to be low using atomic absorption spectroscopy. Taking all of the preceding studies [22,44] into account, the obtained results indicate that heavy metals in LL and the LF-AD are not toxic to nitrification.
Furthermore, as illustrated in Figure 5, the proportions of all of functional metabolic groups remained nearly constant throughout all phases of lane 2. During the experiment, 36.03% AOO, 18.57% NOO, and 43.45% heterotrophic bacteria were found in L-2 on average. These values are nearly identical to those obtained in L-1 during Phase 0. In L-2, there was no dominance in terms of heterotrophic bacteria, but there was a slight reduction in the share of heterotrophic bacteria, and a corresponding increase in the NO3-N concentration in BR2-1 (Figure 4b) was noticed. Due to a high NH4-N load and the insufficient availability of biodegradable carbon sources for denitrification, the NO3-N concentration in L-2 might have increased. Ma et al. [46] demonstrated the domination of AOO and NOO over heterotrophs at low C/N ratios. Therefore, C/N imbalances should be corrected in a subsequent study by increasing the acetic acid dosage in L-2, so that a comparable C/N ratio can be maintained in both lanes and stable nitrification and denitrification can be achieved. Analysing the microbial communities of activated sludge samples collected at various stages of the experiment could provide more information on the impact of different C/N ratios on nitrifying and denitrifying organisms.

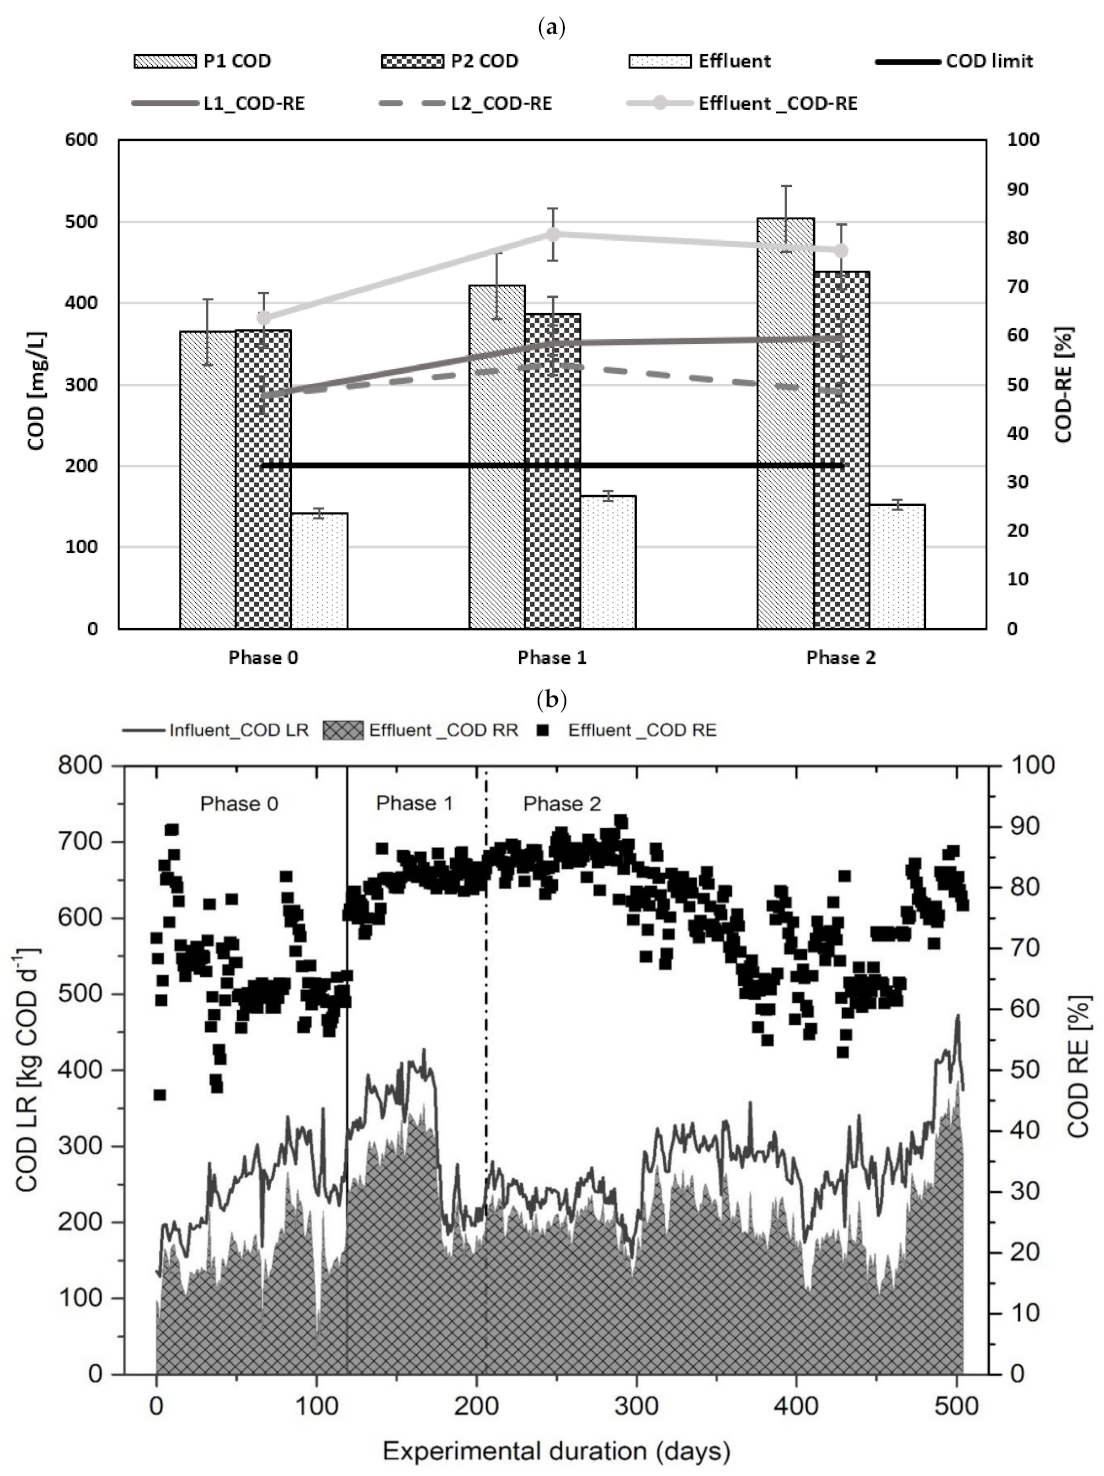
3.3. Performance Analysis of Long-Term Nitrogen and COD Removal

Nitrogen removal capacity: the LLTP was operated continuously and stably between temperatures of 23 to 35 °C without serious failures. The pH in the bioreactors was maintained between 6.9 and 7.8. The dissolved oxygen concentration in the nitrification reactors was maintained between 3 and 5 mg/L. Figure 6 represents the variations in the nitrogen loading rate (NLR), nitrogen removal rate (NRR), and NRE of the LLTP with respect to the activated sludge process over 500 days. In L-1, an average NRE of 93.4%, 95%, and 92% was observed in Phases 0, 1, and 2, respectively. The NRE in L-2 was found to be 88%, 90%, and 86.1% in the respective phases. No literature data were found on the co-treatment of the LF-AD and LL in an industrial-scale LLTP with nitrification, denitrification, and nitrification processes. However, several studies have focused solely on the biological treatment of the LF-AD on a laboratory scale, e.g., Chuda and Ziemiski [31] used the activated sludge method with a separate denitrification chamber for the treatment of the LF-AD and achieved an NRE of 83.73%. Dosta et al. [37] achieved an NRE of nearly 100% in a lab scale sequencing batch reactor when treating centrifuged reject water from a wastewater treatment plant’s anaerobic digester. Obaja et al. [36] processed liquid fractions of digested piggery effluent in a lab size sequencing batch reactor packed with activated sludge and achieved NH4–N removal rates of 99.7%. An NH4–N removal efficiency of 99.9% in phase 1 and 99.8% in phase 2 was achieved in the current study using an activated sludge process and UF treatment during the co-treatment of the LF-AD and LL (Figure 7). The concentration of NH4–N in the permeate of L-2 (P2) after UF was also nearly zero throughout the investigation, with an NH4–N removal efficiency of 99.9%. The results of the lab scale research suggest that a conventional activated sludge system could be used to treat the LF-AD. This study shows that the LF-AD can also be co-treated with LL in an industrial-scale LLTP with different volume ratios. Chiumenti et al. [14] attempted to treat the LF-AD using a full scale physical separation process that included liquid/solid separation, centrifugation, UF, and reverse osmosis processes but were unable to meet the criteria limit imposed by the Water Framework Directive and Urban Wastewater Treatment Regulations for surface-water discharge (NH4-N = 25 mg/L, limit 15 mg/L). The full-scale physical separation process required approximately 25 kWh/m3 [44] of energy consumption. As previously stated, the treatment and maintenance costs for physical treatment processes are significantly higher than those for activated sludge treatment [15]. The feasibility of commercial membrane filtration is influenced by the capital cost of the equipment, the membrane lifespan replacement cost, and cleaning operations [14]. On the other hand, the autotrophic nitrogen removal process, which is based on the coupling of two biological processes, partial nitritation (PN), and anammox (A), was used in a study [9] for the treatment of the LF-AD diluted with water (50% and 30%) and demonstrated an acceptable NRR. However, its application was hampered by the high salinity and inhibitory potential of the digestate. Anammox bacteria are highly sensitive to environmental changes and have a low cell yield of 10–14 d at 30–40 °C; the complexity of the LF-AD and other industrial WW compositions makes the anammox process more difficult to initiate [47]. Therefore, treating the LF-AD in an LLTP where the activated sludge is already adapted to the high salinity of leachate may be advantageous.
In this study, the daily average NLR over the entire study period during the respective phases in L-1 was 49.7, 61, and 53.9 kg-N/d, respectively. Of this amount, 46, 58, and 50 kg N/d nitrogen present in the influent was eliminated by the activated sludge process during each phase. In L-2, mean NLRs of 95, 104, 94 kg-N/d were determined for the three phases, and of this amount, i.e., 84, 91, and 79 kg-N/d NRR were observed. Prior to the start of this study, the LLTP was running in a solo mode, with both lanes used for LL treatment; however, in order to use L-1 for the co-treatment of the LF-AD and LL and L-2 for LL alone, they were separated. As a result of these changes, there were some unexpected disruptions to the biology of the plant and technical failures, which may have resulted in fluctuations in the NRE efficiencies of both lanes during the initial phase of the experiment (Figure 6). Furthermore, compared to L-1, L-2 showed minimum NRE during days 80 to 155, which was due to the high NLR and low biodegradable carbon sources available to the denitrifying bacteria to reduce NO3-N to N2. The C/N ratio was comparatively low in L-2. This scenario did not affect NH4-N removal, but it resulted in an increase in the NO3-N concentration in the bioreactors (Figure 4b) and permeate (Figure 7). The rate of NH4–N removal in activated sludge is proportional to the activity of AOO bacteria [48]. According to SOUR data (Figure 5), the percentage of AOO bacteria increased slightly from phase 0 to phase 1, then stayed nearly constant throughout the study, with no major fluctuations. As a result, no negative consequences associated with the removal of NH4-N were discovered. However, NO3-N build-up was seen in the system as a result of C/N imbalances, which were produced by seasonal variations in influent volumes and insufficient external biodegradable carbon source input. The volume of leachate produced in a landfill is usually higher in the winter and lower in the summer [49]. The maximum influent capacity of the LLTP in this investigation was 450 m3/d in the winter and 280 m3/d in the summer. In comparison to L-1, which was kept at a constant influent rate for the duration of the study, the NLR was higher in L-2 due to higher influent volumes in winter. However, due to the low LL influent rate in the summer, the NLR was reduced later in the study, and the NO3-N concentration in the bioreactors was also dramatically reduced. Imbalances in the C/N ratio have led to poor NO3-N removal in several studies, Nguyen et al. investigated nitrate removal from wastewater at various C/N ratios and discovered that when the C/N ratios decreased, the rate of nitrate reduction also decreased. Choubert et al. [34] also noticed an accumulation of NO3-N due to a lack of biodegradable COD. During LL treatment with an activated sludge process, Tan et al. [49] experienced poor denitrification due to a significant imbalance in the COD/NH4-N ratio. Thus, operating the LLTP’s L-2 with the optimal C/N ratio could assist in improving the denitrification process, lowering the NO3-N concentration in the process. Moreover, there were fluctuations in the NRE in L-1 during Phase 2. These disturbances were due to NH4-N and NO2-N accumulation in the bioreactors (Figure 4a). As discussed previously, heterotrophic bacteria were found to dominate over AOO and NOO during this period due to the abundant carbon source in the LF-AD.
Chemical oxygen demand removal capacity: During the treatment of industrial wastewaters with high COD, the most successful and cost-effective technique to obtain the desired result is to remove organic materials using an activated sludge process. However, due to the complex composition of LL and the LF-AD, considerable volumes of organic matter remain in the effluent discharged following these biological treatments, making regulatory compliance problematic. As a result, an additional treatment step, such as activated carbon filtration, is required [49]. Organic matter, nutrients, micropollutants, and AOX components in the LL and LF-AD are typically too much for wastewater treatment plants with conventional activated sludge systems to handle [16]. Industrial wastewater can impair plant efficiency by interfering with biological functions, especially when wastewater treatment plants were not designed to handle specific types of industrial effluent and/or when the characteristics of industrial effluents alter over time. Toxicity, a higher nutrient content, and a larger concentration of organic waste can all cause changes in terms of microbial balance during the treatment process [50]. A membrane bioreactor system with a UF unit in combination with a GAC filter was used in this study to overcome the barriers of conventional wastewater treatment plants. Figure 8a shows the overall COD-RE (COD removal efficiency) in L-1 and L-2 after the activated sludge process and in the effluent after GAC treatment. It also shows the average COD concentration in the permeate of L-1 and L-2 after UF treatment and in the effluent after GAC treatment. L-1, which was used to treat the LF-AD, showed a COD-RE of 48%, 58%, and 60% in Phases 0, 1, and 2, respectively, after the activated sludge and UF processes, while L-2 showed a COD-RE of 47%, 54%, and 51%, respectively. After the UF process, the permeate from both lanes were combined and filtered using activated carbon filters. After activated carbon treatment, a COD-RE of 63.5%, 81%, and 78% was noticed in Phases 0, 1, and 2, respectively. Rico et. al. [51] investigated the treatment of the liquid fraction of dairy manure in a lab scale upflow anaerobic sludge blanket reactor and found that the COD removal efficiency was 70% with a HRT of less than 1 day and 80% with a HRT greater than 1 and 2 days. Gao et al. [52] used an integrated system of activated sludge, ozonation and activated carbon filtration to treat LL and achieved a COD-RE of 82.6%. Światczak et al. [13] evaluated the treatment of liquid phase digestate from an agricultural biogas plant mixed with municipal wastewater in a lab size SBR reactor with aerobic granules and UF system, which resulted in a COD-RE of 88%. The COD-REs from these several lab scale studies using different treatment methods for LL and the LF-AD (treated separately) were almost identical to the COD-REs from phases 1 and 2 of this industrial-scale study featuring the combined treatment of LL and the LF-AD.
Compared to L-2, the L-1 COD-RE was slightly higher, which could be due to the high percentage of heterotrophic bacteria in the mixed activated sludge (Figure 5). A portion of the biodegradable COD present in the LF-AD and LL might have been degraded thanks to the dominated heterotrophic bacteria in the activated sludge of L-1. When readily biodegradable organic matter is used, Quan et al. [35] reported that the maximum denitrification rates are attained. Thus, increasing the residence time of the activated sludge in the anaerobic phase by modifying the current recirculation ratio between bioreactors can further reduce the concentrations of biodegradable COD of the LF-AD while also enhancing the denitrification process. Although L-1 showed higher a COD-RE in Phases 1 and 2, the COD concentration in the permeate (P1-COD) of L-1 was proportionally higher than the L-2 permeate (P2-COD). This non-biodegradable COD could have originated from the LF-AD, and the presence of higher concentrations of non-biodegradable COD in the influent might have had a negative impact on the activated carbon filtration process. Im et al. [53] used a respirometric approach to study the COD fractions in the LF-AD and concluded that 80% of the organic molecules were non-biodegradable. Despite the fact that COD fractions in the LF-AD vary depending on factors such as the types of biowaste material and seasonal variations in vegetation, it is essential to track non-biodegradable COD fractions in the LF-AD before treating it in an industrial-scale plant to avoid negative outcomes. To maintain the adsorptive capacities, the activated carbon reactors at the LLTP are refilled with reactivated granular carbon every three months (approximately), depending on the loading. During this experiment, the average specific GAC usage for the LLTP was 0.8 kg/m3, which was the same amount of GAC used for the six years preceding the combined treatment at the LLTP, Leppe (Section 3.6). According to Bergischer Abfall-wirtschaftsverband (BAV Waste Management Association) information, no additional cost requirements have been identified to date for the co-treatment of the LF-AD and LL at the LLTP. Moreover, Figure 8b depicts the COD-LR (COD load rate), COD-RR (COD removal rate), and COD-RE of the LLTP (L1 and L2) throughout the experiment with respect to the different phases. The COD-LR of the LLTP was 243, 315, and 273.3 kg COD/d during the respective phases; of this load, a COD-RR of 154, 254, and 204 kg COD/d was determined for each phase. Due to high influent rates, the COD-LR to the LLTP was higher during the winter, i.e., days 30 to 160 and 335 to 504; thus, the COD-RE was minimal during this time period.
In the following study, an increase in the influent flow rate of the LF-AD from a 5% volumetric influent rate to one of 10% (NH4-N load (40% v/v)) was planned. Therefore, the effects of this on process stability, possible side effects on the microbiocoenosis, and its effect on activated carbon were investigated. The total organic matter in the wastewater COD can be divided into four categories: readily biodegradable COD, slowly biodegradable COD, non-biodegradable soluble COD, and non-biodegradable particulate COD [11]. The presence of a large amount of non-biodegradable soluble COD and non-biodegradable particulate COD in the LF-AD results in the frequent reactivation of activated carbon, which leads to an increase in operating costs. Therefore, nonbiodegradable concentrations need to be closely monitored during Phase 3 to avoid additional costs.

3.4. Performance of the Leachate Treatment Plant, Leppe

Figure 9 shows the measurements for COD, NH4-N, and PO4-P in the effluent of the LLTP after activated carbon treatment and the trigger criteria of Annex 51 AbwV. The results obtained for COD, NH4-N, and PO4-P met the desired criteria (German Wastewater Ordinance AbwV Annex 51) over the entire test period. Despite significant COD concentrations in the L-1 permeate (Figure 8a), the COD values following activated carbon treatment were always below the maximum permissible. The study demonstrated stable LLTP operation and no adverse effects on the performance of the combined treatment of LL and the LF-AD at a volumetric flow rate of 2.5% and 5% (Figure 9).
By treating the LF-AD in an LLTP, reduced volumes of LL during the aftercare periods can be substituted in the future. Pollutant concentrations in leachate not only vary over different phases at a landfill (e.g., acidic, methanogenic) but also over different seasons. However, for pre-treated wastes, changes in both the amount and consistency of leachate are mainly influenced by seasonal variations rather than by the landfill phase, as the pre-treated wastes have already undergone stabilization reactions during pre-treatment [54]. To certain extent, the co-treatment strategy can compensate for volume losses and lower leachate concentrations caused by seasonal variations and different phases of landfill, respectively. The LL quality typically indicates a nutrient imbalance; concentrations of organic matter, ammonium nitrogen, and heavy metals are high, but phosphorus levels are very low. The challenge of the effective biological treatment of leachate is exacerbated by the low phosphorus content and the presence of concentrated heavy metals [49]. The increased phosphorus load from the LF-AD during Phase-2 has advantages and partially stabilizes its susceptibility to nitrification. The PO4-P concentration in the effluent of the LLTP was below 2 mg/L throughout the study (Figure 9). The PO4-P content in the LF-AD (Figure 3) was also retained and utilized during the biological treatment stage. A positive effect of the high phosphorus load in the LF-AD was the partial saving of the phosphoric acid dose in the LLTP. The long-term goal of the LLTP is to investigate the 20% volumetric flow (i.e., 80% v/v NH4-N load) of the LF-AD in the current project. Higher volumes of the LF-AD also mean higher COD loads and higher stress on the activated carbon filters, which in turn leads to a shorter plant life and higher costs. Thus, the proper monitoring of COD loads and gradual adaptation phases are necessary when treating the LF-AD in an LLTP.

3.5. Particle Size Distribution of the Biomass in the LLTP

To investigate the influence of particles in the LF-AD and landfill leachate on activated sludge flocs, the particle size distribution of the biomass in the first nitrification reactors of both lanes was studied. Monitoring the changes in particle size of the activated sludge helps in the timely detection of biomass changes that may lead to the clogging of the UF system. Figure 10 shows the average Feret diameter of the activated sludge particles in the bioreactors during Phases 0, 1, and 2.
During Phase 0, the average feret diameter of the particles in both reactors ranged from 0 to 120 μm. This shows that there was an identical particle size distribution of biomass in both lanes. During Phase 1, a significant difference was observed in the activated sludge of L-1 and L-2. The average feret diameter of activated sludge flocs in L-1 was comparatively higher than that of the particles in L-2. The average ferret diameter of the particles in the lane without the LF-AD ranged from 0 to 120 μm, whereas in the lane with the LF-AD, this ranged from 0 to 200 μm. The presence of large waste particles and some plant fibres that were not removed by screw and conveyor belt filters in the LF-AD could explain the increase in the average feret diameter of the activated sludge particles in L-1. The increase in the average feret diameter of the sludge particles did not show any negative effect on the nitrogen removal in the LLTP in L-1. Moreover, after increasing the volume of the LF-AD in Phase 2, a difference in the average feret diameter of sludge particles was still observed between the two lanes. Additionally, particles in the range of 500 μm to 600 μm and around 800 μm particles were also observed. This could be due to a further increase in the amount of the LF-AD and its particle sizes. Akhiar et al. [55] studied the particle size distribution of digestate liquid fractions following separation with a screw press, vibrating screen, and centrifuge using data from eleven full-scale AD plants processing solid wastes from various sources (crop residues, pet food, fruits, sludge, manure, and vegetables). They reported that the particle size of the LF-AD from 11 AD plants was less than 1500 m. After screw pressing, the majority of the particles were in the range of 10–1000 μm, which is similar to in our investigation. So far, no negative effect on ammonium removal and the UF system has been observed throughout Phase 2. However, the total suspended solids concentration in the LF-AD may also increase excess sludge production. During this investigation, the total suspended solids concentrations in the LF-AD and LL were 2 and 0.05 g/L, respectively. If these values are exceeded, this could affect the aerobic sludge age, resulting in decreased nitrification. It needs to be clarified whether these solids can be integrated into the sludge matrix. If solid particles do not sediment in the LF-AD tank or in the biological treatment stages, this will certainly have a negative impact on UF, with an increased cleaning effort being required. However, the pilot plant test conducted on site with the same combination of effluents showed no negative influence on UF [56]. Yue et al. [57] investigated the UF membrane’s purification efficiency for the treatment of the LF-AD, which had already been filtered using sedimentation and a 200-mesh sieve (75 m). Membrane fouling posed a significant technical challenge in the UF purification of the LF-AD. They discovered, however, that membrane cleaning with NaOH and NaClO resulted in higher flux recovery rates. In future studies, in order to prevent membrane fouling and lower permeate flux, it would be preferable to carry out frequent chemical cleaning cycles for UF membranes with NaOH and NaClO while aiming to raise the volume ratios of the LF-AD.

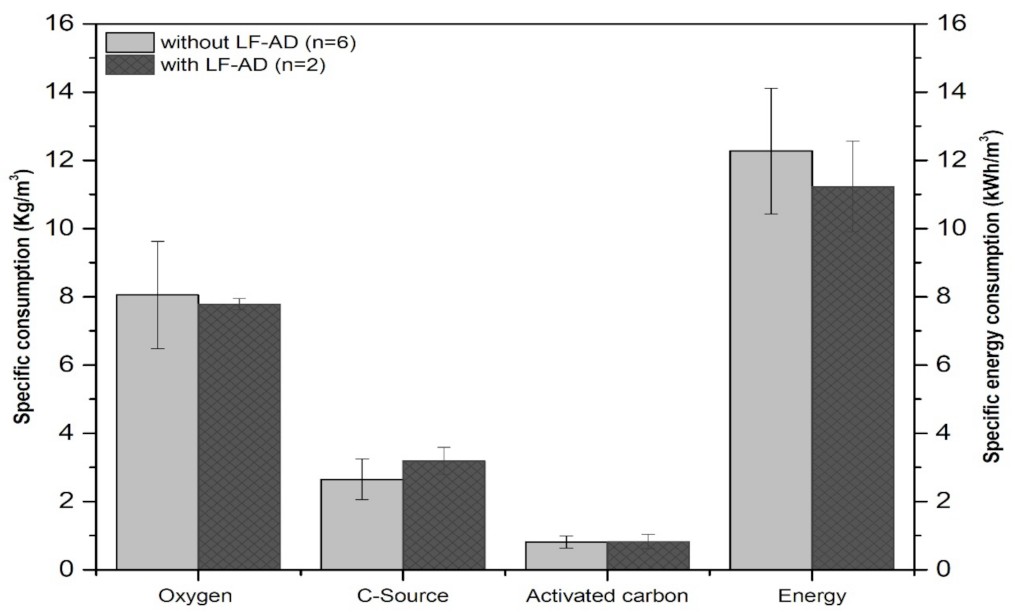
3.6. Annual Specific Consumption of the Operational Resources of the LLTP in Leppe

The operational resources required for treatment and the performance efficiency of the plants dealing with pollutants influence the actual feasibility of combined treatment at industrial-scale leachate treatment plants or wastewater treatment plants. One of the most widely used solutions for the treatment of the digestate’s liquid fraction is to treat it with civil sewage in a wastewater treatment plant [10]. However, wastewater treatment plants frequently experience operational capacity, treatment level, integrity, and operational issues when accepting additional industrial wastewaters [50].
As shown in Figure 11, the co-treatment of two high-strength wastewaters was performed in this study, with no significant changes in operational resources. The specific consumption of the LLTP was evaluated using data from six years of conventional LL treatment and two years of combined treatment (present study). The study’s findings revealed that, except for a slight increase in carbon source usage, there was no additional need for operational resources to treat the LF-AD in an LLTP. With gradual adaptation phases and consistent NH4-N loads, no additional oxygen requirement was observed. Despite the presence of higher COD levels in the L-1 permeate compared to L-2 after activated sludge and UF treatment, no effect on activated carbon specific consumption was observed during the combined treatment. The presence of non-biodegradable soluble COD and non-biodegradable particulate COD in the LF-AD, in addition to their impact on activated carbon, will be investigated in future studies with higher influent flowrates from the LF-AD. The energy required for the treatment of digestate with a full-scale physical separation process, which included liquid/solid separation, centrifugation, UF, and reverse osmosis, was approximately 25 kWh/m3 [14], whereas in this study, the energy required for the treatment of the LF-AD at different volume ratios (10% and 20% v/v NH4-N load) with LL in a membrane bioreactor system with a GAC filter was 11.23 kWh. The permeate flowrate of the UF system was projected to be lower than that during the last six years of conventional LL treatment due to the high fraction of solid particles in the LF-AD, as mentioned in Section 3.5. Thus, an increase in electrical energy consumption was projected. During this study, however, no negative effects on the permeate flowrate or energy consumption were observed. The specific energy required for the treatment of 1 m3 wastewater in the LLTP was even lower during the combined treatment than during the six years of conventional treatment, which could be attributed to the replacement of two of the old 37 kW engines from the UF system with newer, more energy-efficient engines during this investigation.

4. Conclusions

This study has revealed that the LF-AD can be successfully co-treated with LL in an industrial-scale LLTP. This has provided industrial anaerobic digestion plants, which are struggling to treat LF-AD sustainably and are unable to disperse it on the field as a fertiliser due to European Nitrates Directive, a new treatment option. The co-treatment of LF-AD in an LTP can also compensate for volume losses and variations in leachate concentrations produced by changes in landfill directives, aftercare periods, and seasonal changes. The high COD concentration in the LF-AD has been found to have a substantial impact on the amount and activity of activated sludge bacteria and thus on the NRE. However, by gradually raising the LF-AD influent rate from a volume of influent of 2.5–5%, the biological treatment was not overloaded, and stable long-term operation was possible without any additional operational costs. The concentrations of COD, NH4-N, and PO4-P in the LTP effluent after activated carbon treatment met the criteria of Annex 51 AbwV. The impact of high COD concentrations in the LF-AD on metabolic activity and activated carbon will be explored in a future study by gradually increasing the LF-AD influent volume to 20% (i.e., 80% v/v NH4-N load). The treatment of industrial wastewaters with high ammonium concentrations appears to be more promising in leachate treatment plants than in wastewater treatment plants because their process combinations are already designed to remove high ammonium and COD concentrations. However, mixing ratios with regard to LL and other wastewaters must be investigated separately.

Author Contributions

Conceptualization, N.B.A., P.F.B.-V. and A.R.; methodology, N.B.A. and P.F.B.-V.; software, N.B.A.; validation, N.B.A.; formal analysis, N.B.A. and P.F.B.-V.; investigation, N.B.A.; resources, N.B.A., P.F.B.-V. and A.R.; data curation, N.B.A.; writing—original draft preparation, N.B.A.; writing—review and editing, N.B.A., H.H., P.F.B.-V., A.R. and C.W.; visualization, N.B.A.; supervision, A.R. and P.F.B.-V.; project administration, N.B.A., A.R. and P.F.B.-V.; funding acquisition, A.R. and P.F.B.-V. All authors have read and agreed to the published version of the manuscript.

Funding

This work was carried out in cooperation with the Teaching and Research Centre: metabolon, a consortium of the TH Koln and BAV. The research project is funded in 50 % by the European Regional Development Fund (ERDF), in 40 % by the Ministry for Environment, Agriculture, Conservation, and Consumer Protection of the State of North Rhine-Westphalia (MULNV), and in 10 % by the: metabolon institute with a funding number EFRE-0500033.

Institutional Review Board Statement

Not applicable.

Informed Consent Statement

Not applicable.

Data Availability Statement

Not applicable.

Conflicts of Interest

The authors declare that they have no known competing financial interests or personal relationships that could have appeared to influence the work reported in this paper.

Abbreviations

The following abbreviations are used in this manuscript.
ADAnaerobic digestate
AOOAmmonia oxidizing organisms
C/N Carbon/nitrogen
CODChemical oxygen demand
COD-LRChemical oxygen demand load rate
COD-REChemical oxygen demand removal efficiency
GACGranular activated carbon
L-1Lane-1
L-2Lane-2
LF-ADLiquid fractions of anaerobic digestate
LLLandfill leachate
LLTPLandfill leachate treatment plant
NLRNitrogen loading rate
NOONitrite oxidizing organisms
NRENitrogen removal efficiency
NRRNitrogen removal rate
P1 CODCOD in permeate of Lane-1
P2 CODCOD in permeate of Lane-2
SOURSelective oxygen uptake rate
UFUltrafiltration

References

  1. Kaza, S.; Yao, L.C.; Bhada-Tata, P.; Van Woerden, F. What a Waste 2.0: A Global Snapshot of Solid Waste Management to 2050. Urban Development; World Bank: Washington, DC, USA, 2018; ISBN 9781464813290. [Google Scholar]
  2. Tałałaj, I.A.; Biedka, P.; Bartkowska, I. Treatment of landfill leachates with biological pretreatments and reverse osmosis. Environ. Chem. Lett. 2019, 17, 1177–1193. [Google Scholar] [CrossRef] [Green Version]
  3. The Landfill Situtation in the EU-28, European Enhanced Landfill Minning Consortium. 2018. Available online: https://eurelco.org/2018/09/30/data-launched-on-the-landfill-situation-in-the-eu-28/ (accessed on 23 May 2022).
  4. Eggen, T.; Moeder, M.; Arukwe, A. Municipal landfill leachates: A significant source for new and emerging pollutants. Sci. Total Environ. 2010, 408, 5147–5157. [Google Scholar] [CrossRef] [PubMed]
  5. John, D. Keenan, R. Lee Steiner, A.A.F. Landfill Leachate Treatment. Curr. Dev. Biotechnol. Bioeng. Solid Waste Manag. 2017, 56, 391–406. [Google Scholar] [CrossRef]
  6. Cheremisinoff, N.P. Treating Contaminated Groundwater and Leachate. Groundw. Remediat. Treat. Technol. 1997, 259–308. [Google Scholar] [CrossRef]
  7. Brennan, R.B.; Healy, M.G.; Morrison, L.; Hynes, S.; Norton, D.; Clifford, E. Management of landfill leachate: The legacy of European Union Directives. Waste Manag. 2016, 55, 355–363. [Google Scholar] [CrossRef]
  8. European Parliament and Council Directive (EU) 2018/850 of the European Parliament and of the Council of 30 May 2018 amending Directive 1999/31/EC on the landfill of waste. Off. J. Eur. Union 2018, 2018, 100–108.
  9. Lotti, T.; Burzi, O.; Scaglione, D.; Ramos, C.A.; Ficara, E.; Pérez, J.; Carrera, J. Two-stage granular sludge partial nitritation/anammox process for the treatment of digestate from the anaerobic digestion of the organic fraction of municipal solid waste. Waste Manag. 2019, 100, 36–44. [Google Scholar] [CrossRef]
  10. Di Maria, F.; Sisani, F. A sustainability assessment for use on land or wastewater treatment of the digestate from bio-waste. Waste Manag. 2019, 87, 741–750. [Google Scholar] [CrossRef] [PubMed]
  11. Choi, Y.Y.; Baek, S.R.; Kim, J.I.; Choi, J.W.; Hur, J.; Lee, T.U.; Park, C.J.; Lee, B.J. Characteristics and biodegradability of wastewater organic matter in municipal wastewater treatment plants collecting domestic wastewater and industrial discharge. Water 2017, 9, 409. [Google Scholar] [CrossRef] [Green Version]
  12. Di Maria, F.; Sisani, F.; Lasagni, M.; Borges, M.S.; Gonzales, T.H. Replacement of energy crops with bio-waste in existing anaerobic digestion plants: An energetic and environmental analysis. Energy 2018, 152, 202–213. [Google Scholar] [CrossRef]
  13. Światczak, P.; Cydzik-Kwiatkowska, A.; Zielińska, M. Treatment of liquid phase of digestate from agricultural biogas plant in a system with aerobic granules and ultrafiltration. Water 2019, 11, 104. [Google Scholar] [CrossRef] [Green Version]
  14. Chiumenti, A.; Da Borso, F.; Teri, F.; Chiumenti, R.; Piaia, B. Full-scale membrane filtration system for the treatment of digestate from a co-digestion plant. Appl. Eng. Agric. 2013, 29, 985–990. [Google Scholar] [CrossRef]
  15. Camilleri-Rumbau, M.S.; Briceño, K.; Søtoft, L.F.; Christensen, K.V.; Roda-Serrat, M.C.; Errico, M.; Norddahl, B. Treatment of manure and digestate liquid fractions using membranes: Opportunities and challenges. Int. J. Environ. Res. Public Health 2021, 18, 3107. [Google Scholar] [CrossRef]
  16. Baresel, C.; Harding, M.; Fang, J. Applied sciences Ultrafiltration/Granulated Active Carbon-Biofilter: Efficient Removal of a Broad Range of Micropollutants. Appl. Sci. 2019, 9, 710. [Google Scholar] [CrossRef] [Green Version]
  17. Annepogu, N.B.; Steiner, C.; Rehorek, A. Process development and process monitoring of landfill leachate treatment in combination with complementary long- term addition of process water from fermenter. In Book of Proceedings of STEPsCON; Rosenwinkel: Leverkusen, Germany, 2018; Volume 150, p. 2018. [Google Scholar]
  18. Steiner, C. Entwicklung Einer Halbtechnischen Deponiesickerwasserreinigungsanlage und Analyse des Metaproteoms in Belebtschlamm. Ph.D. Thesis, Universität Duisburg-Essen, Duisburg, Germany, 2019; pp. 1–192. [Google Scholar]
  19. Debouny, T.; Catherina, D.; Isunza Manrique, I.; Beese-Vasbender, P.; Nguyen, F. Landfill Characterization by Multi-Method Geophysical Investigation: The Case Study of Leppe (Germany). EGU General Assembly 2020, Online, 4–8 May 2020; EGU2020-18151. Available online: https://doi.org/10.5194/egusphere-egu2020-18151. [CrossRef]
  20. Gallenkemper, B.; Lohse, M.; Böning, T.; Rosenwinkel, K.-H.; Weichgrebe, D.; Märker, S. Prozesswassermanagement auf MBA-Anlagen am Beispiel der MBA-Gescher. 2007, p. 107. Available online: https://www.lanuv.nrw.de/fileadmin/forschung/wasser/klaeranlage_abwasser/Abschlussberichtprozesswassermanagement.pdf (accessed on 5 March 2022).
  21. Dahm, W.; Kollback, J.S.; Gebel, J. Sickerwasserreinigung, Stand der Technik 1993/94, Zukünftige Entwicklungen, 1st ed.; EF-Verlag für Energie-und Umwelttechnik GmbH: Berlin, Germany, 1994. [Google Scholar]
  22. Bundesministerium der Justiz. Verordnung über Anforderungen an das Einleiten von Abwasser in Gewässer (Abwasserverordnung - AbwV). [Gesetz]. 1997. Available online: https://www.gesetze-im-internet.de/abwv/BJNR056610997.html (accessed on 3 January 2022).
  23. You, S.J.; Tsai, Y.P.; Huang, R.Y. Effect of heavy metals on nitrification performance in different activated sludge processes. J. Hazard. Mater. 2009, 165, 987–994. [Google Scholar] [CrossRef] [PubMed]
  24. Niu, Q.; Zhang, Y.; Ma, H.; He, S.; Li, Y.-Y. Reactor kinetics evaluation and performance investigation of a long-term operated UASB-anammox mixed culture process. Int. Biodeterior. Biodegradation 2016, 108, 24–33. [Google Scholar] [CrossRef]
  25. Steiner, C.; Annepogu, N.; Schluckebier, L.; Rehorek, A. Nitrification monitoring—Determination of bacterial groups in a biocoenosis with selective inhibition and oxygen uptake rate measurements. In Book of Proceedings of STEPsCON 2018; International Scientific Conference on Sustainability and Innovation: Leverkusen, Germany; p. 2018.
  26. Ginestet, P.; Audic, J.M.; Urbain, V.; Block, J.C. Estimation of nitrifying bacterial activities by measuring oxygen uptake in the presence of the metabolic inhibitors allylthiourea and azide. Appl. Environ. Microbiol. 1998, 64, 2266–2268. [Google Scholar] [CrossRef] [PubMed] [Green Version]
  27. Nogueira, R.; Lazarova, V.; Manem, J.; Melo, L.F. Influence of dissolved oxygen on the nitrification kinetics in a circulating bed biofilm reactor. Bioprocess Eng. 1998, 19, 441–449. [Google Scholar] [CrossRef] [Green Version]
  28. Daigger, G.T. Oxygen and Carbon Requirements for Biological Nitrogen Removal Processes Accomplishing Nitrification, Nitritation, and Anammox. Water Environ. Res. 2014, 86, 204–209. [Google Scholar] [CrossRef]
  29. Harrison, W.; Flotard, R.D.; Ford, D. Assessment of Activated Carbon for Environmental Control of Trace Organics in Petroleum Refinery Wastewater; Argonne National Lab.: Lemont, IL, USA, 1979. [Google Scholar]
  30. HU, J.; LI, D.; LIU, Q.; TAO, Y.; HE, X.; WANG, X.; LI, X.; GAO, P. Effect of organic carbon on nitriffication efficiency and community composition of nitrifying bioffilms. J. Environ. Sci. 2009, 21, 387–394. [Google Scholar] [CrossRef]
  31. Chuda, A.; Ziemiński, K. Challenges in treatment of digestate liquid fraction from biogas plant. Performance of nitrogen removal and microbial activity in activated sludge process. Energies 2021, 14, 7321. [Google Scholar] [CrossRef]
  32. Carrera, J.; Vicent, T.; Lafuente, J. Effect of influent COD/N ratio on biological nitrogen removal (BNR) from high-strength ammonium industrial wastewater. Process Biochem. 2004, 39, 2035–2041. [Google Scholar] [CrossRef]
  33. Zhang, Y.; Wang, X.C.; Cheng, Z.; Li, Y.; Tang, J. Effect of fermentation liquid from food waste as a carbon source for enhancing denitrification in wastewater treatment. Chemosphere 2016, 144, 689–696. [Google Scholar] [CrossRef]
  34. Choubert, J.M.; Marquot, A.; Stricker, A.E.; Racault, Y.; Gillot, S.; Héduit, A. Anoxic and aerobic values for the yield coefficient of the heterotrophic biomass: Determination at full-scale plants and consequences on simulations. Water SA 2009, 35, 103–110. [Google Scholar] [CrossRef] [Green Version]
  35. Quan, Z.X.; Jin, Y.S.; Yin, C.R.; Lee, J.J.; Lee, S.T. Hydrolyzed molasses as an external carbon source in biological nitrogen removal. Bioresour. Technol. 2005, 96, 1690–1695. [Google Scholar] [CrossRef] [PubMed]
  36. Obaja, D.; Macé, S.; Costa, J.; Sans, C.; Mata-Alvarez, J. Nitrification, denitrification and biological phosphorus removal in piggery wastewater using a sequencing batch reactor. Bioresour. Technol. 2003, 87, 103–111. [Google Scholar] [CrossRef]
  37. Dosta, J.; Galí, A.; Benabdallah El-Hadj, T.; Macé, S.; Mata-Álvarez, J. Operation and model description of a sequencing batch reactor treating reject water for biological nitrogen removal via nitrite. Bioresour. Technol. 2007, 98, 2065–2075. [Google Scholar] [CrossRef]
  38. Dinçer, A.R.; Kargi, F. Kinetics of sequential nitrification and denitrification processes. Enzym. Microb. Technol. 2000, 27, 37–42. [Google Scholar] [CrossRef]
  39. Xu, J.; Wang, P.; Li, Y.; Niu, L.; Xing, Z. Shifts in the microbial community of activated sludge with different COD/N ratios or dissolved oxygen levels in Tibet, China. Sustainability 2019, 11, 2284. [Google Scholar] [CrossRef] [Green Version]
  40. Wu, G.; Rodgers, M.; Zhan, X. Nitrification in sequencing batch reactors with and without glucose addition at 11 °C. Biochem. Eng. J. 2008, 40, 373–378. [Google Scholar] [CrossRef]
  41. Edokpayi, J.N.; Durowoju, O.S.; Odiyo, J.O. Assessment of Heavy Metals in Landfill Leachate: A Case Study of Thohoyandou Landfill, Limpopo Province, South Africa. Heavy Met. 2018, 16, 214–227. [Google Scholar] [CrossRef] [Green Version]
  42. Flyhammar, P. Heavy Metals in Municipal Solid Waste Deposits; Lund University: Lund, Sweden, 1997. [Google Scholar]
  43. Afangideh, C.; Nnaji, C.; Onuora, C.; Okafor, C. Comparative Study of the Leachability of Heavy Metals from Sewage Sludge, Sawdust and Organic Fraction of Municipal Solid Waste. Br. J. Appl. Sci. Technol. 2015, 10, 1–13. [Google Scholar] [CrossRef]
  44. Kapoor, V.; Li, X.; Elk, M.; Chandran, K.; Impellitteri, C.A.; Santo Domingo, J.W. Impact of Heavy Metals on Transcriptional and Physiological Activity of Nitrifying Bacteria. Environ. Sci. Technol. 2015, 49, 13454–13462. [Google Scholar] [CrossRef]
  45. Sun, M.; Wang, H.; Zhang, H. Effect of Ca2+ and Fe3+ addition on nitrification-denitrification process in a membrane bioreactor. Adv. Mater. Res. 2013, 610–613, 422–427. [Google Scholar] [CrossRef]
  46. Ma, J.; Wang, Z.; Zhu, C.; Liu, S.; Wang, Q.; Wu, Z. Analysis of Nitrification Efficiency and Microbial Community in a Membrane Bioreactor Fed with Low COD/N-Ratio Wastewater. PLoS ONE 2013, 8, e63059. [Google Scholar] [CrossRef]
  47. Xie, H.; Ji, D.; Zang, L. Effects of Inhibition Conditions on Anammox process. IOP Conf. Ser. Earth Environ. Sci. 2017, 100, 012149. [Google Scholar] [CrossRef]
  48. Jiang, X.; Wang, H.; Wu, P.; Wang, H.; Deng, L.; Wang, W. Nitrification performance evaluation of activated sludge under high potassium ion stress during high-ammonia nitrogen organic wastewater treatment. J. Environ. Sci. 2022, 111, 84–92. [Google Scholar] [CrossRef]
  49. Wang, K.; Li, L.; Tan, F.; Wu, D. Treatment of landfill leachate using activated sludge technology: A review. Archaea 2018, 2018, 1039453. [Google Scholar] [CrossRef] [Green Version]
  50. European Environment Agency. Industrial Waste Water Treatment—Pressures on Europes’s Environment; European Environment Agency: Maastricht, The Netherlands, 2019. [Google Scholar]
  51. Rico, C.; Rico, J.L.; Lasa, C. Anaerobic digestion of the liquid fraction of dairy manure separated by screw pressing and centrifugation in a upflow anaerobic sludge blanket reactor at 25 °C. Biosyst. Eng. 2012, 112, 344–351. [Google Scholar] [CrossRef]
  52. Gao, J.L.; Oloibiri, V.; Chys, M.; De Wandel, S.; Decostere, B.; Audenaert, W.; He, Y.L.; Van Hulle, S.W.H. Integration of autotrophic nitrogen removal, ozonation and activated carbon filtration for treatment of landfill leachate. Chem. Eng. J. 2015, 275, 281–287. [Google Scholar] [CrossRef]
  53. Im, J.; Kim, D.; Gil, K. COD fraction analysis of anaerobic digester supernatant and piggery wastewater, using respirometric method. Environ. Earth Sci. 2016, 75, 47. [Google Scholar] [CrossRef]
  54. Pajooh, E.M.; Weichgrebe, D.; Cuff, G. Municipal landfill leachate characteristics and feasibility of retrofitting existing treatment systems with deammonification—A full scale survey. J. Environ. Manag. 2016, 187, 354–364. [Google Scholar] [CrossRef] [PubMed]
  55. Akhiar, A.; Battimelli, A.; Torrijos, M.; Carrere, H. Comprehensive characterization of the liquid fraction of digestates from full-scale anaerobic co-digestion. Waste Manag. 2017, 59, 118–128. [Google Scholar] [CrossRef]
  56. Steiner, C.; Beese-vasbender, P.; Annepogu, N.; Steensen, M.; Rehorek., A. Kombinierte Behandlung von Deponiesickerwasser und Vergärungsabwasser Membranbelebungsreaktoren im halbtechnischen und betrieblichen Maßstab. Müll und Abfall 2019, 500–504. [Google Scholar] [CrossRef]
  57. Yue, C.; Dong, H.; Chen, Y.; Shang, B.; Wang, Y.; Wang, S.; Zhu, Z. Direct purification of digestate using ultrafiltration membranes: Influence of pore size on filtration behavior and fouling characteristics. Membranes 2021, 11, 179. [Google Scholar] [CrossRef] [PubMed]
Figure 1. Landfill sections of Leppe landfill. LS: landfill section; ETW: extraction well [18].
Processes 10 01140 g001
Figure 2. Flow diagram of the leachate treatment plant in Leppe.
Processes 10 01140 g002
Figure 3. (a) Overview of NH4-N, COD, and (b) PO4-P concentrations in the LL and LF-AD over the course of the entire experiment.
Processes 10 01140 g003
Figure 4. Overview of the NH4-N, NO2-N, and NO3-N concentrations over the entire experiment in the BR 1-1 (a) and BR 2-1 (b).
Processes 10 01140 g004
Figure 5. Average shares of bacterial groups in both lanes of the LLTP during the three phases of treatment.
Processes 10 01140 g005
Figure 6. NRE, NLR, and NRR in L-1 and L-2 of the LLTP after the UF process.
Processes 10 01140 g006
Figure 7. Overall TN (NH4-N and NO3-N) concentration and NH4-N removal efficiency in the permeate of L-1 and L-2 after activated sludge and UF process in their respective phases.
Processes 10 01140 g007
Figure 8. (a) COD in L-1 permeate (P1 COD), COD in L-2 permeate (P1 COD) after activated sludge and UF treatment, COD in the effluent after GAC treatment, COD limit, COD removal efficiency (COD-RE) in L-1, L-2, and effluent. (b) COD load rate (COD LR), COD removal rate (COD-RR), COD-RE in the effluent after GAC treatment.
Processes 10 01140 g008
Figure 9. The process variables COD, NH4-N, NO3-N, and PO4-P in the outlet after activated carbon in the LLTP. (Limit values Annex 51: COD: 200 mg/L, NH4-N: 80 mg/L, and PO4-P: 3 mg/L).
Processes 10 01140 g009
Figure 10. Average Feret diameter of activated sludge particles in B 1-1 (L-1) and B 2-1 (L-2) during the three phases of the experiment.
Processes 10 01140 g010
Figure 11. Annual operational resource consumption before and during the combined treatment of LL and the LF-AD.
Processes 10 01140 g011
Table 1. Characteristics of the landfill leachate and LF-AD in Leppe.
Analysis ParametersLandfill LeachateLF-AD
Conductivity [μS/cm]500–21,40018,010–19,110
Total organic carbon (TOC) [mg/L]61–1250
Total suspended solids [mg/L]1310–84101210–2000
Chemical oxygen demand [mg/L]560–37607200–12,510
Biochemical oxygen demand (BOD5) [mg/L]3.8–13002000–2860
Total phosphor [mg/L]0.45–6.2338–107
Total nitrogen [mg/L]4102–23002110–3760
Organic nitrogen [mg/L]0.4–165
Ammonium nitrogen [mg/L]323–22801200–2870
pH7.5–8.58.0–8.5
Table 2. Available free influent capacities for LF-AD in the LLTP.
Influent Capacity [m3/d]Average
Influent Rate (LL)
[m3/d]
Available
Influent Capacity
[m3/d]
Max. Possible COD Load [kg/d]Average COD-Load (LL) [kg/d]Available COD Load [kg/d]COD in LF-AD [kg/m3]Max Treatable
LF-AD Quantity [m3/d]
LL:LF-AD Ratio [%]
5803002807872295589.55920
Table 3. Concentration and volumes for selective OUR measurements.
ChemicalsGinestet et al. [26]Own Tests
Concentration in the Measuring VolumeConcentration in the Measuring VolumeAdded Volume
[mL]
Acetic acid10 mg C/litre10 mg C/litre10
Ammonium, Nitrite10 mg N/litre10 mg N/litre10
Allylthiourea86 μM120 μM14
Azide24 μM86 μM3.6
Table 4. The three phases of the study and the influent volumes, N-loads, COD loads, and C/N ratios of the respective phases.
Phase 0Influent Volume [m3/d]NH4-N Load from LF-AD
% (v/v)
N-Load
[kg/d]
COD-Load
[kg/d]
C/N
Ratio
Phase 0
L-1 (LL)116.90504358.7
L-2 (LL)235.30965886.1
Phase 1
L-1 (LL + LF-AD)123.410615488.9
L-2 (LL)225.801046526.2
Phase 2
L-1 (LL + LF-AD)9420545109.4
L-2 (LL)2000946807.2
Table 5. Heavy metals and calcium concentrations in landfill leachate and LF-AD.
SourceCopper
(mg/L)
Zinc (mg/L)Lead
(mg/L)
Calcium
(mg/L)
Nickel
(mg/L)
Silver
(mg/L)
LL002.6541.2000
LF-AD002.3112.271.850
Publisher’s Note: MDPI stays neutral with regard to jurisdictional claims in published maps and institutional affiliations.

