Article

Optimization of Hemp Bast Microfiber Production Using Response Surface Modelling

by
Jessica Tsakani Mhlongo
1,
Yannick Nuapia
2,
Boitumelo Tlhaole
1,
Oranso Themba Mahlangu
3 and
Anita Etale
4,*
1
Molecular Sciences Institute, School of Chemistry, University of the Witwatersrand, Johannesburg 2000, South Africa
2
Pharmacy Department, School of Healthcare Sciences, Turfloop Campus, University of Limpopo, Polokwane 0727, South Africa
3
Institute for Nanotechnology and Water Sustainability, University of South Africa, Florida Science Campus, Johannesburg 1709, South Africa
4
Department of Aerospace Engineering, University of Bristol, Bristol BS8 1TH, UK
*
Author to whom correspondence should be addressed.
Processes 2022, 10(6), 1150; https://doi.org/10.3390/pr10061150
Submission received: 11 May 2022 / Revised: 31 May 2022 / Accepted: 6 June 2022 / Published: 8 June 2022

Abstract

:
Non-wood biomass is particularly attractive as a cellulose source because of the lower lignin content. However, optimal cellulose extraction conditions are required as lignin content varies between plant sources. Further, the use of organic acids in place of harsh mineral acids is of interest in “greening” the cellulose production process. This study sought to establish optimum parameters for the extraction of cellulose microfibers (CMFs) from hemp (Cannabis sativa) biomass, using maleic and formic acids. Hemp fibers were pre-treated in NaOH (4 wt%) and aqueous chlorite in acetate buffer before ultrasonic treatment to break down bundles. The CMFs produced were compared with those generated from sulfuric acid hydrolysis. Response surface methodology (RSM) was used to determine combinations of three processing conditions, including acid concentration (45–64%), hydrolysis time (30–90 min), and temperature (45–65 °C). A central composite design (RSM-CCD) model with 21 experimental runs was optimized using MODDE 13.1 software. The model suitably described the data (R2 = 0.99; R2adj = 0.96). Microfibers with an average width of 6.91 µm, crystallinity range 40–75%, and good thermal stability were produced. Crystallinity was influenced by all three factors. The optimal crystallinity predicted by the model was 83.21%, which could be achieved using formic acid 62 wt% formic acid, 36 min hydrolysis time, and 47 °C hydrolysis temperature. These conditions resulted in a crystallinity degree of 82%. These data suggest formic acid can be used as an alternative to sulfuric acid for synthesis of cellulose microfibers from biodegradable hemp waste fibers.

1. Introduction

Agricultural biomass is increasingly recognized as a valuable source of cellulose due to the low lignin content and the wide range of plant sources. With an estimated global annual production of 214 × 103 tonnes, hemp (Cannabis sativa L.) is one of the most cultivated industrial crops from which fibrous (bast) fibers and granular fibers can be extracted [1,2]. Hemp bast fibers comprise approximately 76% cellulose, 14% hemicellulose, 5% lignin, 1% pectin, and 6% of other non-cellulosic substances [3,4]. The use of hemp fibers as an alternative to synthetic fibers for reinforcement of polymer composites is of interest because hemp fibers are lower in cost, renewable, biodegradable, and environmentally friendly [5,6,7]. Hemp fibers also have applications in paper processing, medicine, cosmetics, pharmaceuticals, food manufacturing, detergent, and bio-composites [4,6,8].
Micro- and nano-cellulose materials can be extracted by chemical and mechanical methods. Cellulose microfibers (CMFs) with diameters of 10 µm and several micrometers in length have been obtained using chemical, mechanical, or a combination of both processes [9,10,11]. Acid hydrolysis breaks the glycosidic bonds of the crystalline regions and amorphous regions of cellulose [12,13]. This can be achieved by using a variety of organic and mineral acids, including sulfuric acid [11], hydrochloric acid, phosphoric acid [14], hydrobromic acid, or mixtures of different acids [15]. Cellulose nanofibers (CNFs), on the other hand, have been extracted using mechanical treatment, ultrasonic treatment, cryo-crushing, and high-pressure homogenization to produce fibers of diameters ranging from 10–100 nm and lengths up to several microns [16]. However, for some applications, including water treatment, there is evidence suggesting that it may not be necessary to process cellulose all the way to the nanoscale. Chen et al. [17] calculated a maximum adsorption of As(III) as 344.82 and 357.14 mg g−1, for nanofibrillated and microfibrillated cellulose, respectively. Periodate oxidation resulted in functionalization of a large surface area within the fibers, providing high surface areas for adsorption.
Finding more sustainable green approaches for the extraction and purification of cellulose is also a matter of increasing concern for upholding the sustainability credentials of cellulose-derived materials. In this endeavor, response surface methodology (RSM) can be a useful tool for comparing quantitative data from experiments in order to determine conditions that may be applied to achieve desired results; in this case conditions that may be used with organic acids, to achieve fiber properties similar to those obtained using mineral acids [18,19]. Further, RSM allows for achieving this goal with a minimal number of experiments, thus reducing cost and time [20,21,22]. RSM has been extensively applied in the modeling and optimization of numerous acid hydrolysis experiments using cellulose extracted from plant material. Commonly used RSM designs include the Box–Behnken design (BBD), and central composite design (CCD) [23].
Guo et al., used a CCD to determine optimal conditions for the extraction of cellulose nanocrystals (CNCs) from tea stalk using sulfuric acid [24]. The maximum yield of 50.96% was achieved at an acid concentration of 62.20%, hydrolysis time of 123.35 min, and hydrolysis temperature of 45 °C. The predicted yield was closer to the experimental yield of 49.8%. Akhabue et al., used RSM to determine optimal conditions for maximum yield of microcrystalline cellulose (MCC) powder from orange peel waste (OPW) [25]. They found that a maximum experimental yield of 14.12% was predicted when the hydrolysis temperature of 100.53 °C and 16.28 min hydrolysis time was applied. Chowdhury et al., studied the extraction of CNCs from African baobab tree leaves [26]. Optimum conditions were determined as: 200 watts sonication, 43.11 min, 94 °C. The extracted CNCs (15–20 nm diameter) were found to have high crystallinity index of 86.46%. Similarly, the production of cellulose nanocrystals and nanofibers from pine kraft pulp using sulfuric acid hydrolysis was found to require 60% acid concentration, 58 °C hydrolysis temperature, 60 min hydrolysis time for a 60% yield [27].
These studies suggest that the properties of cellulose microfibers are influenced by hydrolysis conditions where various parameters can be optimized to obtain fibers with desired properties.
The aim of this study was to investigate the extraction and synthesis of cellulose microfibers (CMFs) with high crystallinity index from hemp bast fibers. Three-factors: acid concentration, reaction time, and temperature, were used in a rotatable composite design. To our knowledge, no studies have compared the performance of the selected acids (sulfuric, maleic, and formic acids) in the extraction of CMFs. Thus, this study presents an opportunity for comparing the chemical and physical properties of CMFs produced from organic and mineral acids.

2. Materials and Methods

2.1. Materials

All chemicals used were of analytical grade. Sodium hydroxide (NaOH), sodium chlorite (NaClO2), glacial acetic acid (CH3COOH) were from Ace Chemicals (Johannesburg, South Africa). Sulfuric acid (H2SO4), formic acid (CH₂O₂), and maleic acid (C4H4O4) were purchased from Sigma-Aldrich, South Africa. Hemp fibers were obtained locally, and all solutions were prepared with double deionized water. Glassware and polypropylene vials were washed, soaked in 1 M HNO3 acid for at least 24 h, and rinsed with deionized water before use.

2.2. Cellulose Pre-Treatment

Dried hemp stems and branches were soaked in water overnight and the barks were peeled off the woody cores. The barks were then treated with 4 wt% NaOH at 80 °C for 2 h. The treatment was repeated 3 times, and this was followed by bleaching with equal parts of NaClO2 (1.7 wt%) and acetate buffer (pH 4.8) for 1 h at 100 °C until the fibers were white in color. After bleaching, the fibers were washed with distilled water and dried.

2.3. Acid Hydrolysis

The bleached fibers were acid hydrolyzed by exposing them to sulfuric acid, formic acid, and maleic acids in different experiments. The hydrolysis conditions were pre-determined by an experimental design, which was derived using response surface methodology (RSM). At the end of the experiments, chilled distilled water was added to the reaction (10-fold dilution) to stop the hydrolysis process. The fibers were washed with water by centrifugation for 20 min at 4000 rpm to remove excess acid. This cycle was repeated several times until pH 7 samples were homogenized for 10 min using a Scilogex D500 homogenizer (Scilogex, Kuala Lumpur, Malaysia) and freeze dried (LABCONCO CORP. 811, Kansas City, MO, USA) before characterization (Figure 1).

2.4. RSM Experimental Design

Physical and chemical characteristics of cellulose microfibers are influenced by several variables, including acid concentration, hydrolysis time, temperature, and type of acid used. These variables were optimized using RSM. Table 1 presents process variables chosen. A full factorial design comprising 21 experiment runs was created in MODDE 13.1 (Sartorius Stedim Biotech, Malmö, Sweden) to assess CMF hydrolysis. The expected response from the experiments involved fiber length, fiber thickness and surface functional groups. The partial least square regression was applied to evaluate the fitting of the model and response surface. The adequacy of the model was evaluated by the R2 (model fit) and Q2 (estimate of the future prediction precision) values.

2.5. Characterization

Scanning electron microscopy (SEM, Jeol JSM IT300, Tokyo, Japan) at an acceleration voltage of 10 kV was used to examine the morphology of the untreated and acid hydrolyzed cellulose samples. Before analysis, the samples were coated with 5 µm gold in an SCD 005 Cool Sputter Coater (BalTec, Heidelberg, Germany) at a current of 25 µA, which was applied for 50 s. Fourier transform infrared (FTIR) spectroscopy was performed on a Tensor 27 Infrared Spectrometer (Ettlingen, Germany). The spectra were collected in the range 500–4500 cm−1 in the absorption mode. Thermal stability fibers were determined on a thermal analyzer (STA 6000; Perkin Elmer, Waltham, MA, USA). Approximately 10 mg of the fiber samples were weighed and heated from 35 °C to 900 °C at a heating rate of 10 °C min−1 in nitrogen gas, at a flow rate of 20 mL min−1. X-ray diffraction (XRD) patterns of CMFs were collected on a Bruker D2 phase diffractometer (Billerica, MA, USA) with a Cu-Kα (λ = 0.154 nm) radiation source fitted with a LynxEye detector, using a 30 kV X-ray tube at a current of 30 mA. The scan range was 5° ≤ 2θ ≤ 90° in a 0.02° measurement step. The crystallinity of fibers was determined by applying Segal’s Equation (1).
Cr I ( % ) = I 002 I a m I 002 × 100

3. Results and Discussion

3.1. Characterization of Acid Hydrolysed Fibers

3.1.1. Morphology of Cellulose Microfibrils

Hemp bast fibers were subjected to alkaline treatment (4 wt% NaOH) to aid the removal of hemicellulose and other non-cellulosic content, resulting in brown hemp fibers [28,29]. This process was achieved by carrying out three subsequent alkaline treatment rounds to help reduce any non-cellulosic content. Jiang et al. studied the effects of various concentrations of alkali treatments and found that 3 wt% NaOH was effective in the removal of non-cellulosic material [30]. Furthermore, lignin removal was achieved after several rounds of bleaching to remove any hemicellulose and lignin content, resulting in white cellulose fibers [28,31]. Micrographs of the dried cellulose fibers (1000× magnification) show that the fibers have smooth flat surfaces with average diameters of 9.18 ± 3.17 µm (Figure 2). Further, the fibers were 1 micrometer thick as seen in the SEM micrographs. The results correspond to native cellulose SEM images reported in many studies using cellulose extracted from palm tree trunk [32] and recycled Tetra Pak Food Packaging Waste [33].
Hydrolysis altered the morphology of the extracted fibers (Figure 3a–r). The fibers (1SA, 2SA) extracted using 45% H2SO4 at temperatures below 55 °C were hundreds of micrometers in length and had rod-like morphologies (Figure 3a,b), whereas when the temperature was increased to 65 °C (3SA) shorter fibers were obtained as the material was much more degraded. The fibers from the 5SA experimental conditions were degraded the most. These fibers were rod-like in morphology and differed from fibers obtained under the 2SA experimental conditions due to higher acid concentrations and a longer reaction time in the 5SA experiments.
In contrast, the CMFs produced using formic acid had the same morphology despite variations in the treatment conditions (Figure 3g–l). FA–CMFs showed signs of incomplete hydrolysis and inhomogeneity, resulting in a mixture of fibers of varying sizes. This can be attributed to the higher pKa value (3.745) of formic acid, compared to sulfuric acid. Similar results were recorded when Du and colleagues studied the preparation and characterization of thermally stable cellulose nanocrystals via a sustainable approach of FeCl3-catalyzed formic acid hydrolysis [34]. The results obtained showed that when hydrolysis was carried out using formic acid with low catalyst concentration, the hydrolysis was incomplete and inhomogeneous [34]. Previous studies observed that hydrolysis using formic acid resulted in incomplete hydrolysis, larger sized CNFs/CNCs.
Maleic acid is also a weak organic acid that can be used for hydrolysis to produce CMFs as shown in Figure 3m–r. Figure 3m representing 1MA–CMFs hydrolysis at low acid concentration and temperature was characterized by interwoven web-like structural features. As the hydrolysis conditions were increased (e.g., higher acid concentrations, higher temperature, and longer reaction time), improvement in structural morphology was observed where fibers with rod-like structures were formed. Formic acid and maleic acid hydrolyzed fibers showed similarities in morphologies, although fibers formed from hydrolysis with maleic acid showed more advanced degradation and this was likely because maleic acid is a stronger acid (pKa = 1.9).

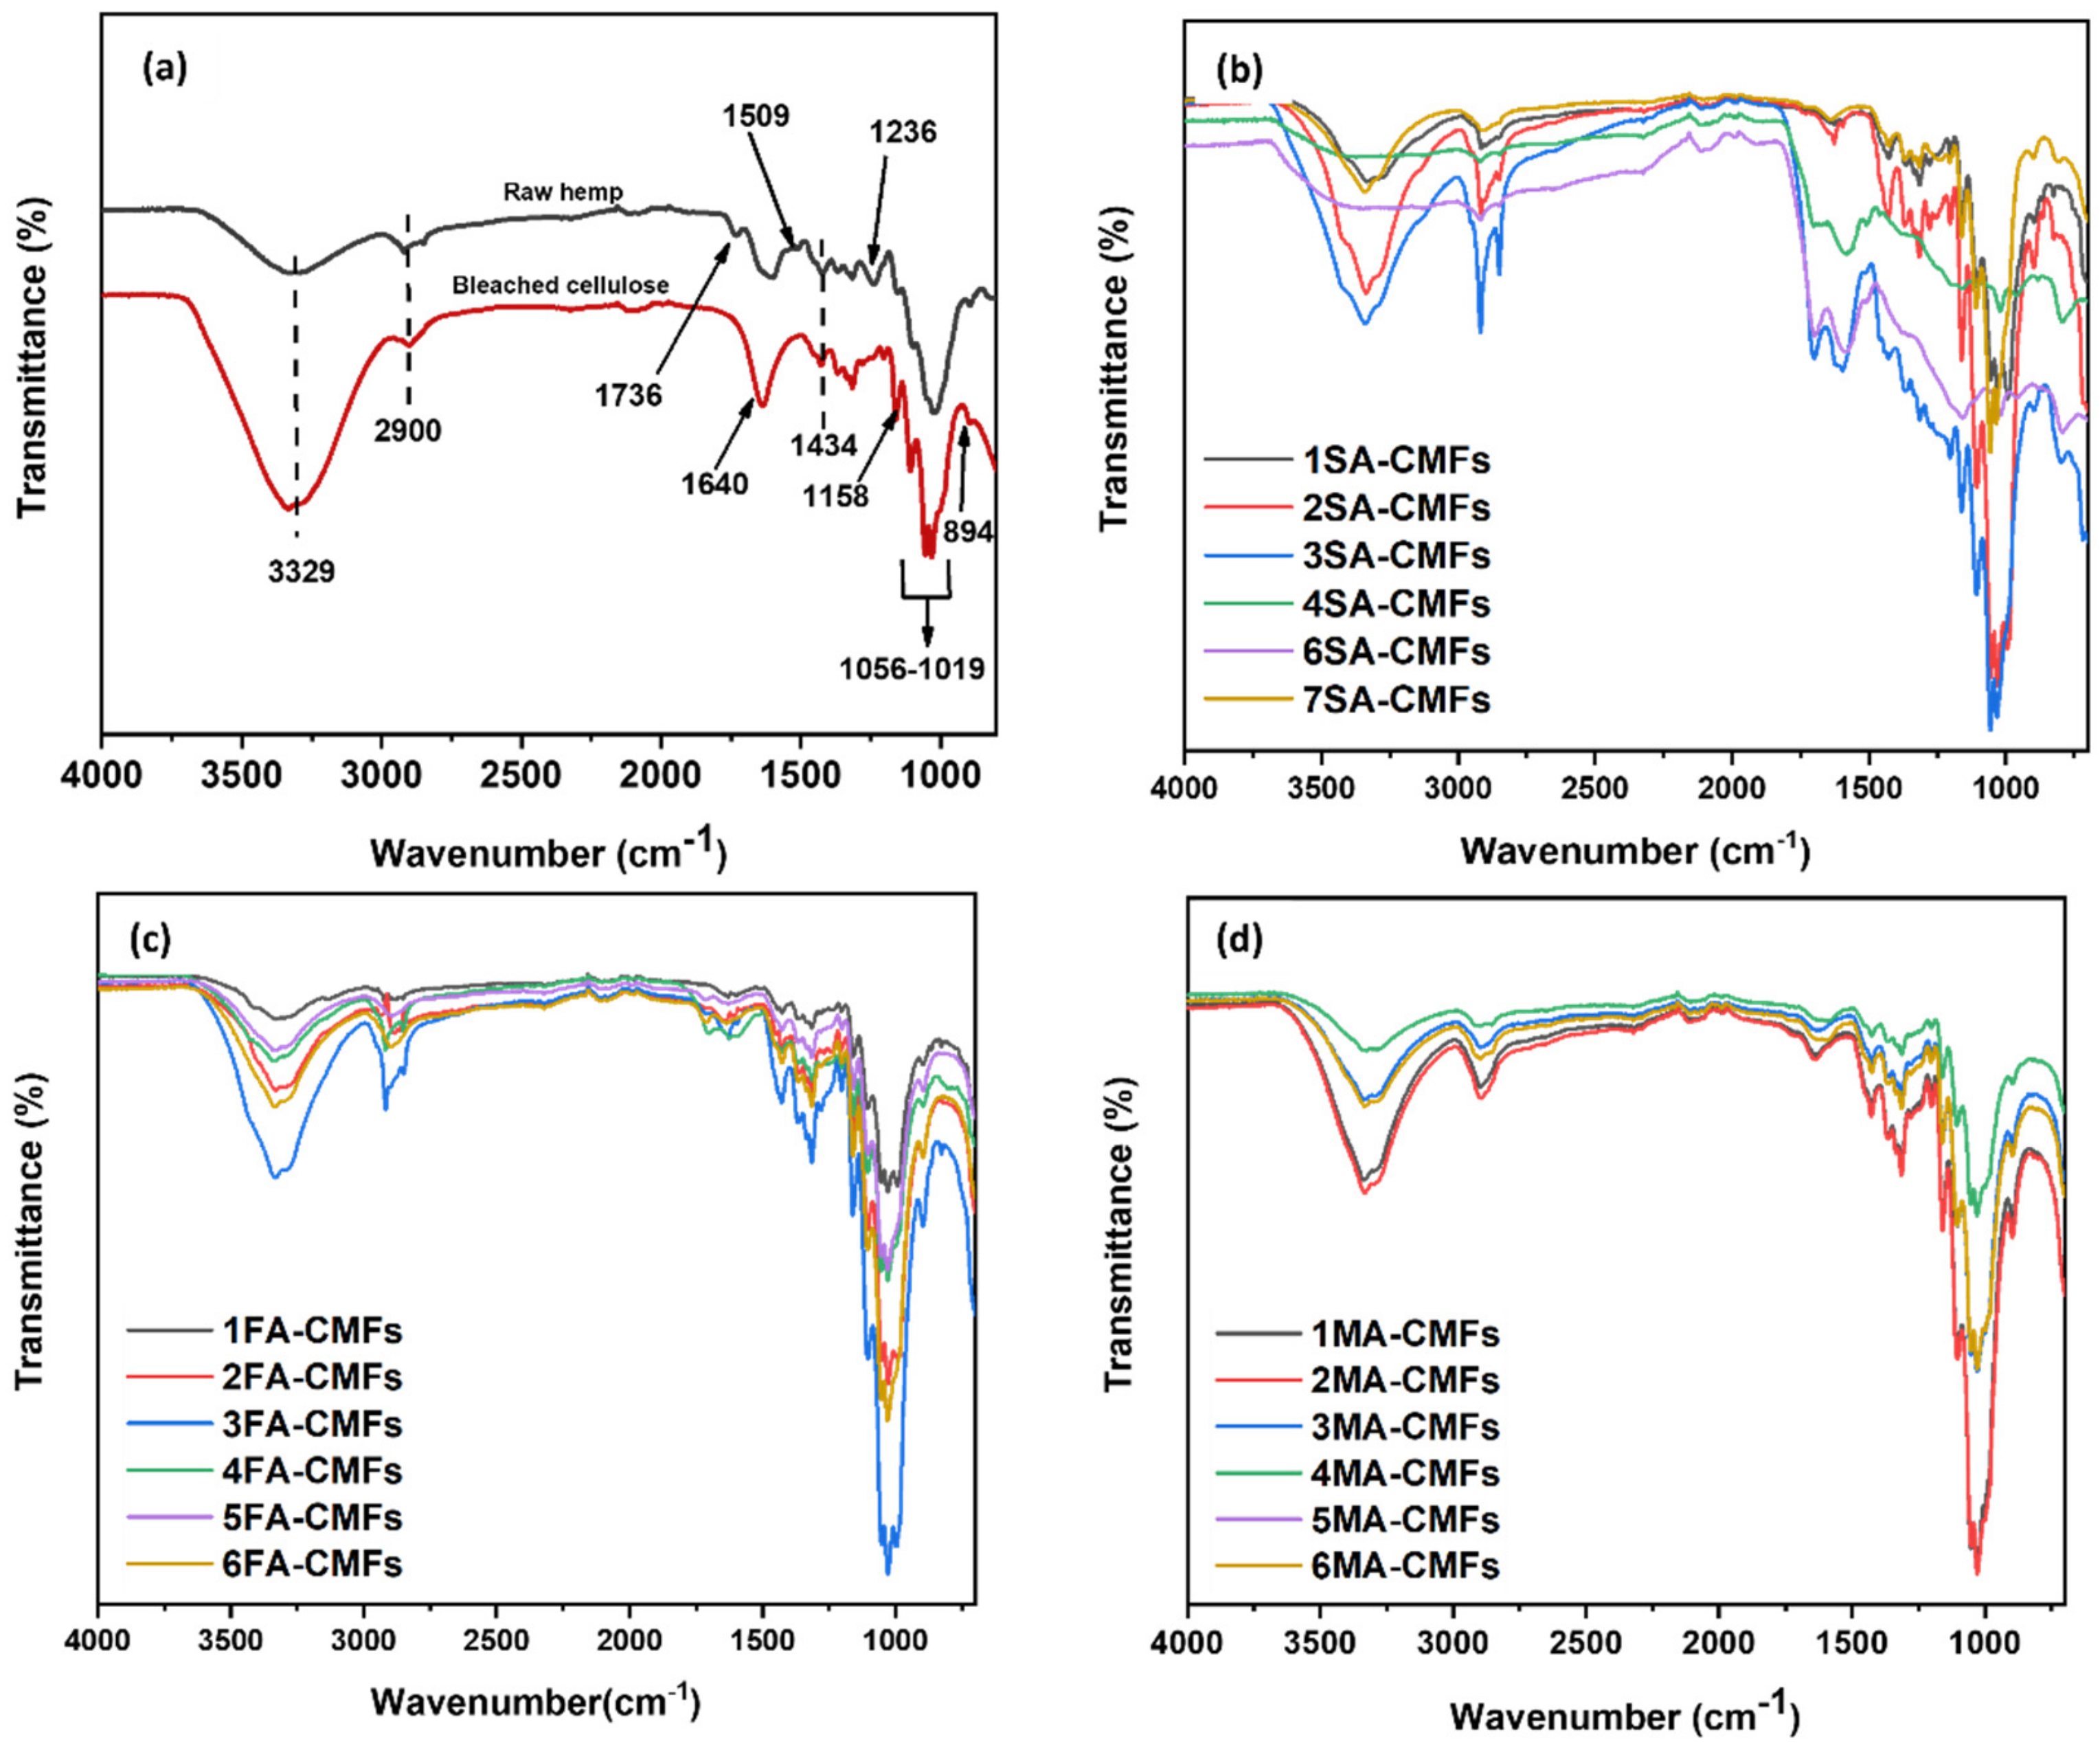
3.1.2. Surface Chemical Groups of CMFs

The FTIR spectra of raw fibers and bleached cellulose are represented in Figure 4. Some peaks observed on the raw hemp fiber spectrum did not appear on the spectra of bleached fibers at 1736, 1509, and 1236 cm−1. The peak at 1736 cm−1 is likely from vibrations of acetyl and uronic ester groups of hemicellulose or from the ester linkages between carboxylic group of the ferulic and p-coumaric acids of lignin [35,36,37]. The absence of the above-mentioned peaks in the bleached cellulose spectra, this can be attributed to the removal of hemicellulose and lignin content. Similar findings were reported for banana peels [38], sugarcane bagasse [39], and bamboo [40]. The peaks at 1509 and 1236 cm−1 on the untreated hemp fiber spectrum could be attributed to C=C aromatic ring skeletal vibrations and guaiacyl ring breathing with stretching C=O of lignin, respectively [38,41,42]. These groups were greatly weakened in the bleached cellulose spectrum, and as a result, no peaks were detected. This indicated a complete removal of lignin components after bleaching treatment of raw hemp fibers.
FTIR spectra of bleached cellulose was compared to that of acid-hydrolyzed CMFs (Figure 4b–d). Absorption bands observed at 3329 and 2900 cm−1 were due to OH stretching vibrations and C–H stretching vibration in the CH2 and CH3 groups of cellulose type 1, respectively [43,44,45,46]. The characteristic absorption band at 1640 cm−1 was due to absorbed moisture [47,48]. The characteristic absorption peaks at 1434, 1368, and 894 cm−1 could be attributed to C6 C–H and C–O bonds in the polysaccharide aromatic ring and β-glycosidic linkages between anhydroglucose units, respectively [31,35,38,48]. The absorption peaks at 1158, 1056, and 1019 cm−1 were due to the C–O–C asymmetric stretching linkages, C–O stretching vibrations, and C–H pyranose ring stretching vibrations, respectively [30,49,50].
Figure 4b, which represents sulfuric acid hydrolyzed CMFs shows that with less harsh hydrolysis conditions, CMFs showed weak chemical changes, whereas higher acid conditions revealed advanced chemical changes. Figure 4c,d represent formic acid and maleic acid hydrolyzed CMFs and the absorption peak at 1714 cm−1 spectra corresponds to C=O stretching vibrations in the carbonyl group from cellulose [51]. However, the hydrolysis effects on the fibers can be observed with the peak strength varying between the low and moderate esterification taking place. The results show that the main molecular structure of cellulose was not altered during extraction except in the 5SA/6SA-CMFs spectrum, which can be attributed to high sulfuric acid concentration leading to the breakdown of cellulose chain to glucose [52].

3.1.3. Crystallinity

XRD analysis is widely used to determine the crystallinity in individualized microfibers, which plays an important role to determine the mechanical and thermal properties of microfibers. XRD spectra suggest that oxidative treatments did not alter the crystalline structure of cellulose in the fibers as 2θ angles of 14–18°, 22–24°, and 34.6° corresponding to (101), (002), and (004) regions of Cellulose-I structure were observed.
The crystallinity index (CrI) of fibers, as determined using the Segal method, are shown in Table 2. Raw hemp fiber and bleached cellulose (Figure 5) showed an increase in CrI from 60% to 73% with improved peak intensity due to the removal of hemicellulose, and lignin [53]. XRD spectra of bleached cellulose has been studied to have a well-defined crystalline structure due to hydrogen bonding and Van der Waals interactions existing between adjacent cellulose molecules compared to raw hemp fibers, which have hemicellulose and lignin content and are amorphous in nature [54]. A similar trend was observed for coir cellulose fibers where crystallinity increased from 35.8% to 57.2% due to the removal of lignin and hemicellulose [55].
The CrI values for sulfuric acid hydrolyzed CMFs ranged between 52 and 75%, 1SA-CMF had a higher CrI value than 6SA-CMFs. This suggests that the more harsh hydrolysis conditions (higher acid concentration and temperature and longer reaction time), resulted in more advanced degradation of fibers by the removal of both amorphous and crystalline regions of cellulose [56].
As expected, the CrI values of formic and maleic acid hydrolyzed CMFs were lower than those of CMFs synthesized using sulfuric acid. They ranged from 50–70% for the former and 40–67% for the latter. Formic and maleic acids are relatively weak acids, therefore, changes in hydrolysis conditions seem not to have influenced the thermal and mechanical stability of the extracted CMFs to a great extent. This is similar to findings by Du et al. [57], who found that crystallinity of fibers from bleached softwood kraft pulp (BSKP) increased only slightly, i.e., from 49–52.9% using formic acid, despite increasing the hydrolysis time from 2 h to 6 h.

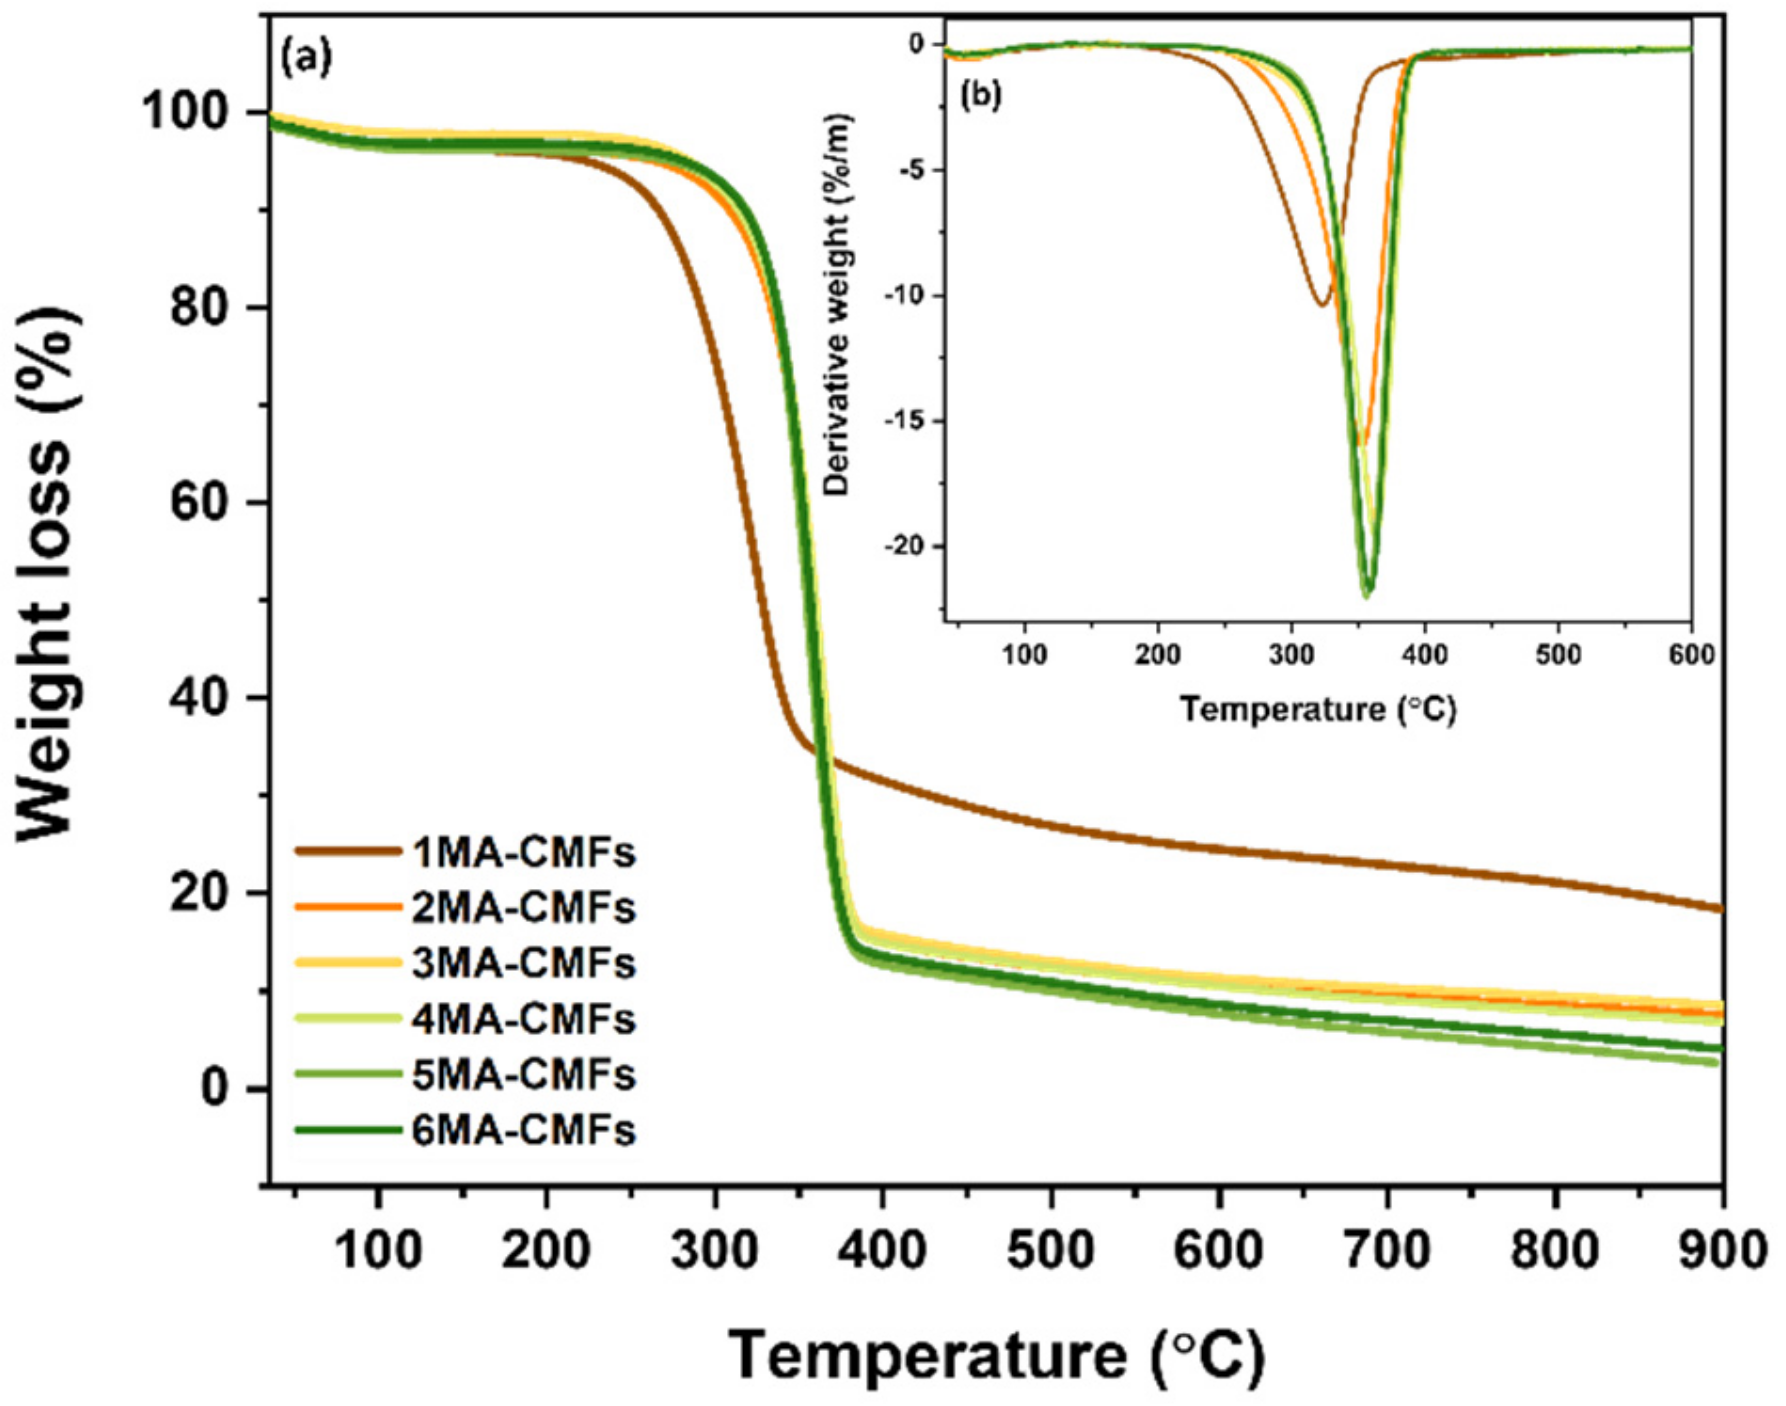
3.1.4. Thermogravimetric Analysis

The thermal stability of cellulose microfibers was determined to evaluate their potential use in high-temperature applications such as thermoplastics reinforcement. The thermal degradation onset temperatures (Tonset), maximum thermal degradation temperatures (Tmax), weight loss (%), and residual ash amount at maximum temperature (900 °C) for all samples are listed in Table 2. All samples showed an initial weak weight loss of less than 5% at a temperature range between 45 °C and 100 °C, mostly caused by vaporization of absorbed water [54,57]. Figure 6 shows that the thermal decomposition of raw hemp and bleached cellulose occurs in two stages. The first stage of thermal decomposition is from 220 °C to 300 °C, where β-glycosidic bonds of cellulose were broken down. This was attributed to thermal depolymerization of hemicellulose and lignin content. The second stage of decomposition occurred between 300 and 450 °C, which was attributed to cellulose decomposition as a result of released gases (CO2, CO, H2O) contributing to the formation of solid char residue at maximum temperature (900 °C) [55,58,59].
The thermal degradation of raw hemp fiber began at 207 °C while that of bleached cellulose fiber began at 232 °C. This upward shift can be attributed to the absence of lignin in pre-treated cellulose [54]. After chemical treatment, the weight loss (%) increased from 72% (raw hemp fiber) to 82% (bleached cellulose fiber) and ash residue amount at 900 °C was 14% and 10% for raw hemp fiber and bleached cellulose fiber, respectively. This suggests that the thermal stability of bleached cellulose fiber is greater than that of raw hemp fiber. Similar thermal decomposition profiles were reported for pineapple leaf nanocellulose (Tonset at 215 °C) and raw pineapple fiber (Tonset at 230 °C) [43].
As shown in Figure 7a,b, the thermal stability of sulfuric acid hydrolyzed CMFs followed the order: 1SA-CMFs < 4SA-CMFs < 5SA-CMFs < 7SA-CMFs < 6SA-CMFs < 2SA-CMFs < 3SA-CMFs. The highest thermal stability was found in 1SA-CMFs with an onset decomposition temperature of 268 °C and maximum decomposition temperature of 387 °C. High thermal stability of CMFs can be attributed to the removal of amorphous regions of cellulose, e.g., hemicellulose, lignin and other non-cellulose content after hydrolysis and the homogenizing treatment of cellulose samples [16,60]. Sulfuric acid extracted CMFs, however, e.g., 3SA-CMFs had a reduced thermal stability and a lower Tonset at 152 °C. Two mechanisms can be considered to contribute to this phenomenon; the first is that sulfuric acid already leads to greater depolymerization of the cellulose chains and the shorter cellulose chains are more easily degraded [51,61]. Secondly, the presence of sulphate half ester groups leads to the generation of sulfuric acid in the initial dehydration step. This stronger acid catalyzes greater cellulose dehydration than the weaker carboxylic acid (generated from the dehydration of maleic and formic acid treated cellulose).
The weight loss (%) of 1SA-CMFs and 3SA-CMFs were determined to be 78% and 74%, respectively. Moreover, the ash residue amount at 900 °C of the previously mentioned CMFs were also determined to be 11% and 19%, respectively. The high weight loss (%) and low ash residue recorded in 1SA-CMFs signifies the lack of any non-cellulose contents (hemicellulose, lignin, wax). Chirayil et al. [54], investigated and found similar results on acid treated cellulose extracted from Helicteres isora plant, which had low carbon residue at maximum temperature 800 °C.
The thermal stability of CMFs extracted using formic acid was in the following descending order: 6FA-CMFs > 3FA-CMFs > 2FA-CMFs > 4FA-CMFs > 5FA-CMFs > 1FA-CMFs as seen in Figure 8a,b. Both the Tonset and Tmax of 6FA-CMFs were determined to be higher than the Tonset and Tmax of 1FA-CMFs (see Table 2). High thermal stability can be attributed to the removal of disordered regions of cellulose and hemicellulose during hydrolysis, whereas low thermal stability can be attributed to insufficient hydrolysis by weaker formic acid [51,62]. This is also in line with the relatively low crystallinity index of 1FA-CMFs showed on the XRD spectra and the high ash residue of 28% at maximum temperature 900 °C.
Figure 9a,b, show the TG and DTG curves of maleic acid hydrolyzed microfibers. The data show that 1MA-CMFs had the lowest initial degradation temperature (203 °C) while 6MA-CMFs had the highest (265 °C). Furthermore, 1MA-CMFs had a lower crystallinity and higher ash residue than 6MA-CMFs. The lower acid concentration and lower temperature in 1MA-CMFs likely resulted in less hemicellulose removal, leading to lower thermal stability and crystallinity [63,64]. Seemingly, the thermal behavior of the materials is related to their crystallinity.

4. Model Fit

The model parameters are presented in Table 3. They show that the regression model was significant at a 0.05 significance threshold (i.e., p = 0.034) and the R2 value and adjusted R2 value was 0.985, suggesting the predicted residuals closely resembled the experimental values. The coefficient of variation (CV) of the model was determined to be 4.07%. A lower CV value signifies high accuracy and reliability of the experimental model [65], and the standard deviation value of 2.84 indicated that the experimental model has satisfying precision, reliability, and reproducibility. Finally, the adequate precision values, which is a measure of the “signal and noise ratio”, was also examined. Values above four signify a desirable model [18]. From the data (Table 3), adequate precision value was given as 9.59, which indicated adequate signal.

4.1. Regression Model and Coefficients Plot

All three factors investigated had a significant effect on the crystallinity of the CMFs (p-value < 0.05). A positive regression coefficient indicates a direct proportionality effect to crystallinity, whereas a negative coefficient value indicates the effect of an inverse relationship with crystallinity [66]. From Figure 10, it is illustrated that the linear factors (various types of acids and temperature) show that there is both a positive and negative correlation with the crystallinity, whereas other linear factors, acid concentration, and reaction time show positive and negative effects, respectively.
An increase in acid concentration resulted in an increase in crystallinity degree of CMFs extracted from hemp bast fibers and vice versa. However, the regression coefficients interactions between acid concentration and acid type varied, i.e., a positive interaction was seen for sulfuric acid, but the opposite effect was possible when maleic or formic acid were used. The regression coefficients of the quadratic form of the acid concentration (aci*aci) had a strong significant negative effect on CMFs, whereas the reaction time (rea*rea) had a positive effect [25,67]. Therefore, from the observed trends an increase in the interaction of factors and squares between each factor can result in a decrease in crystallinity degree or vice versa [66,68]. The observed and predicted responses of the 21 cellulose hydrolysis experiments care summarized in Table A1 and Figure 11. The results show that the model is valid because differences between predicted and observed mean values of crystallinity degree (%) were not significant. The model was, therefore, accurate for optimizing the experimental conditions.

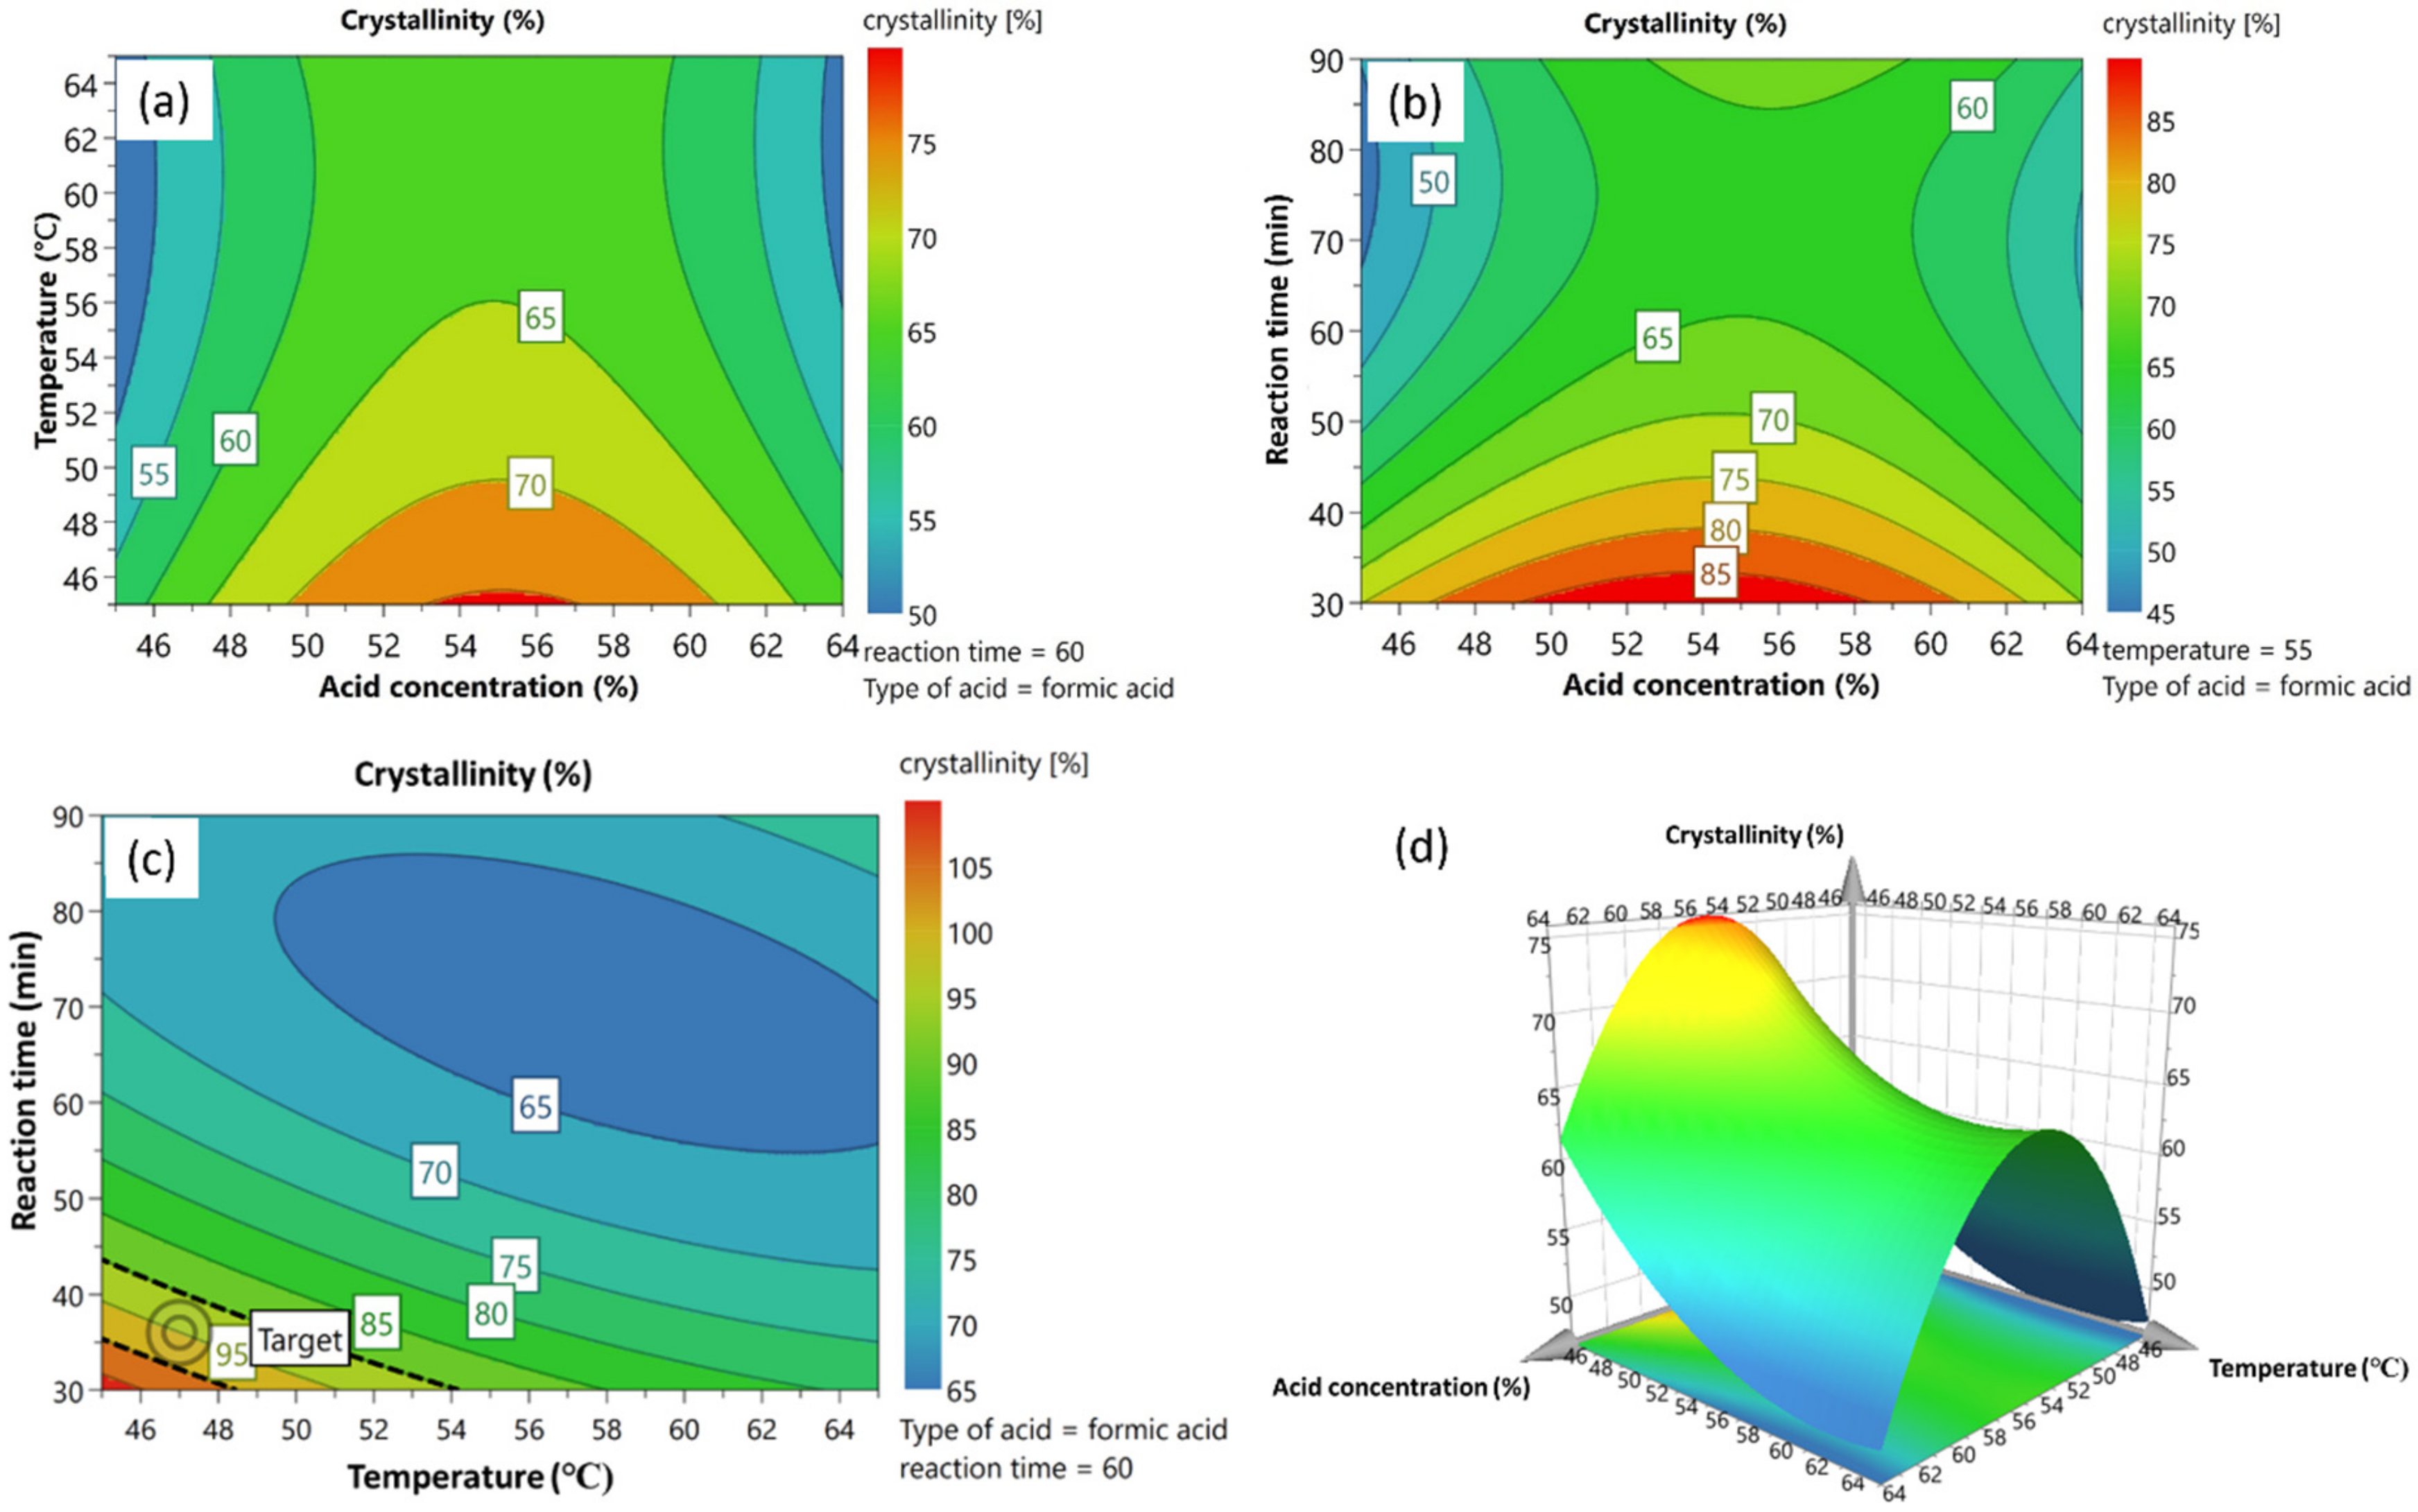
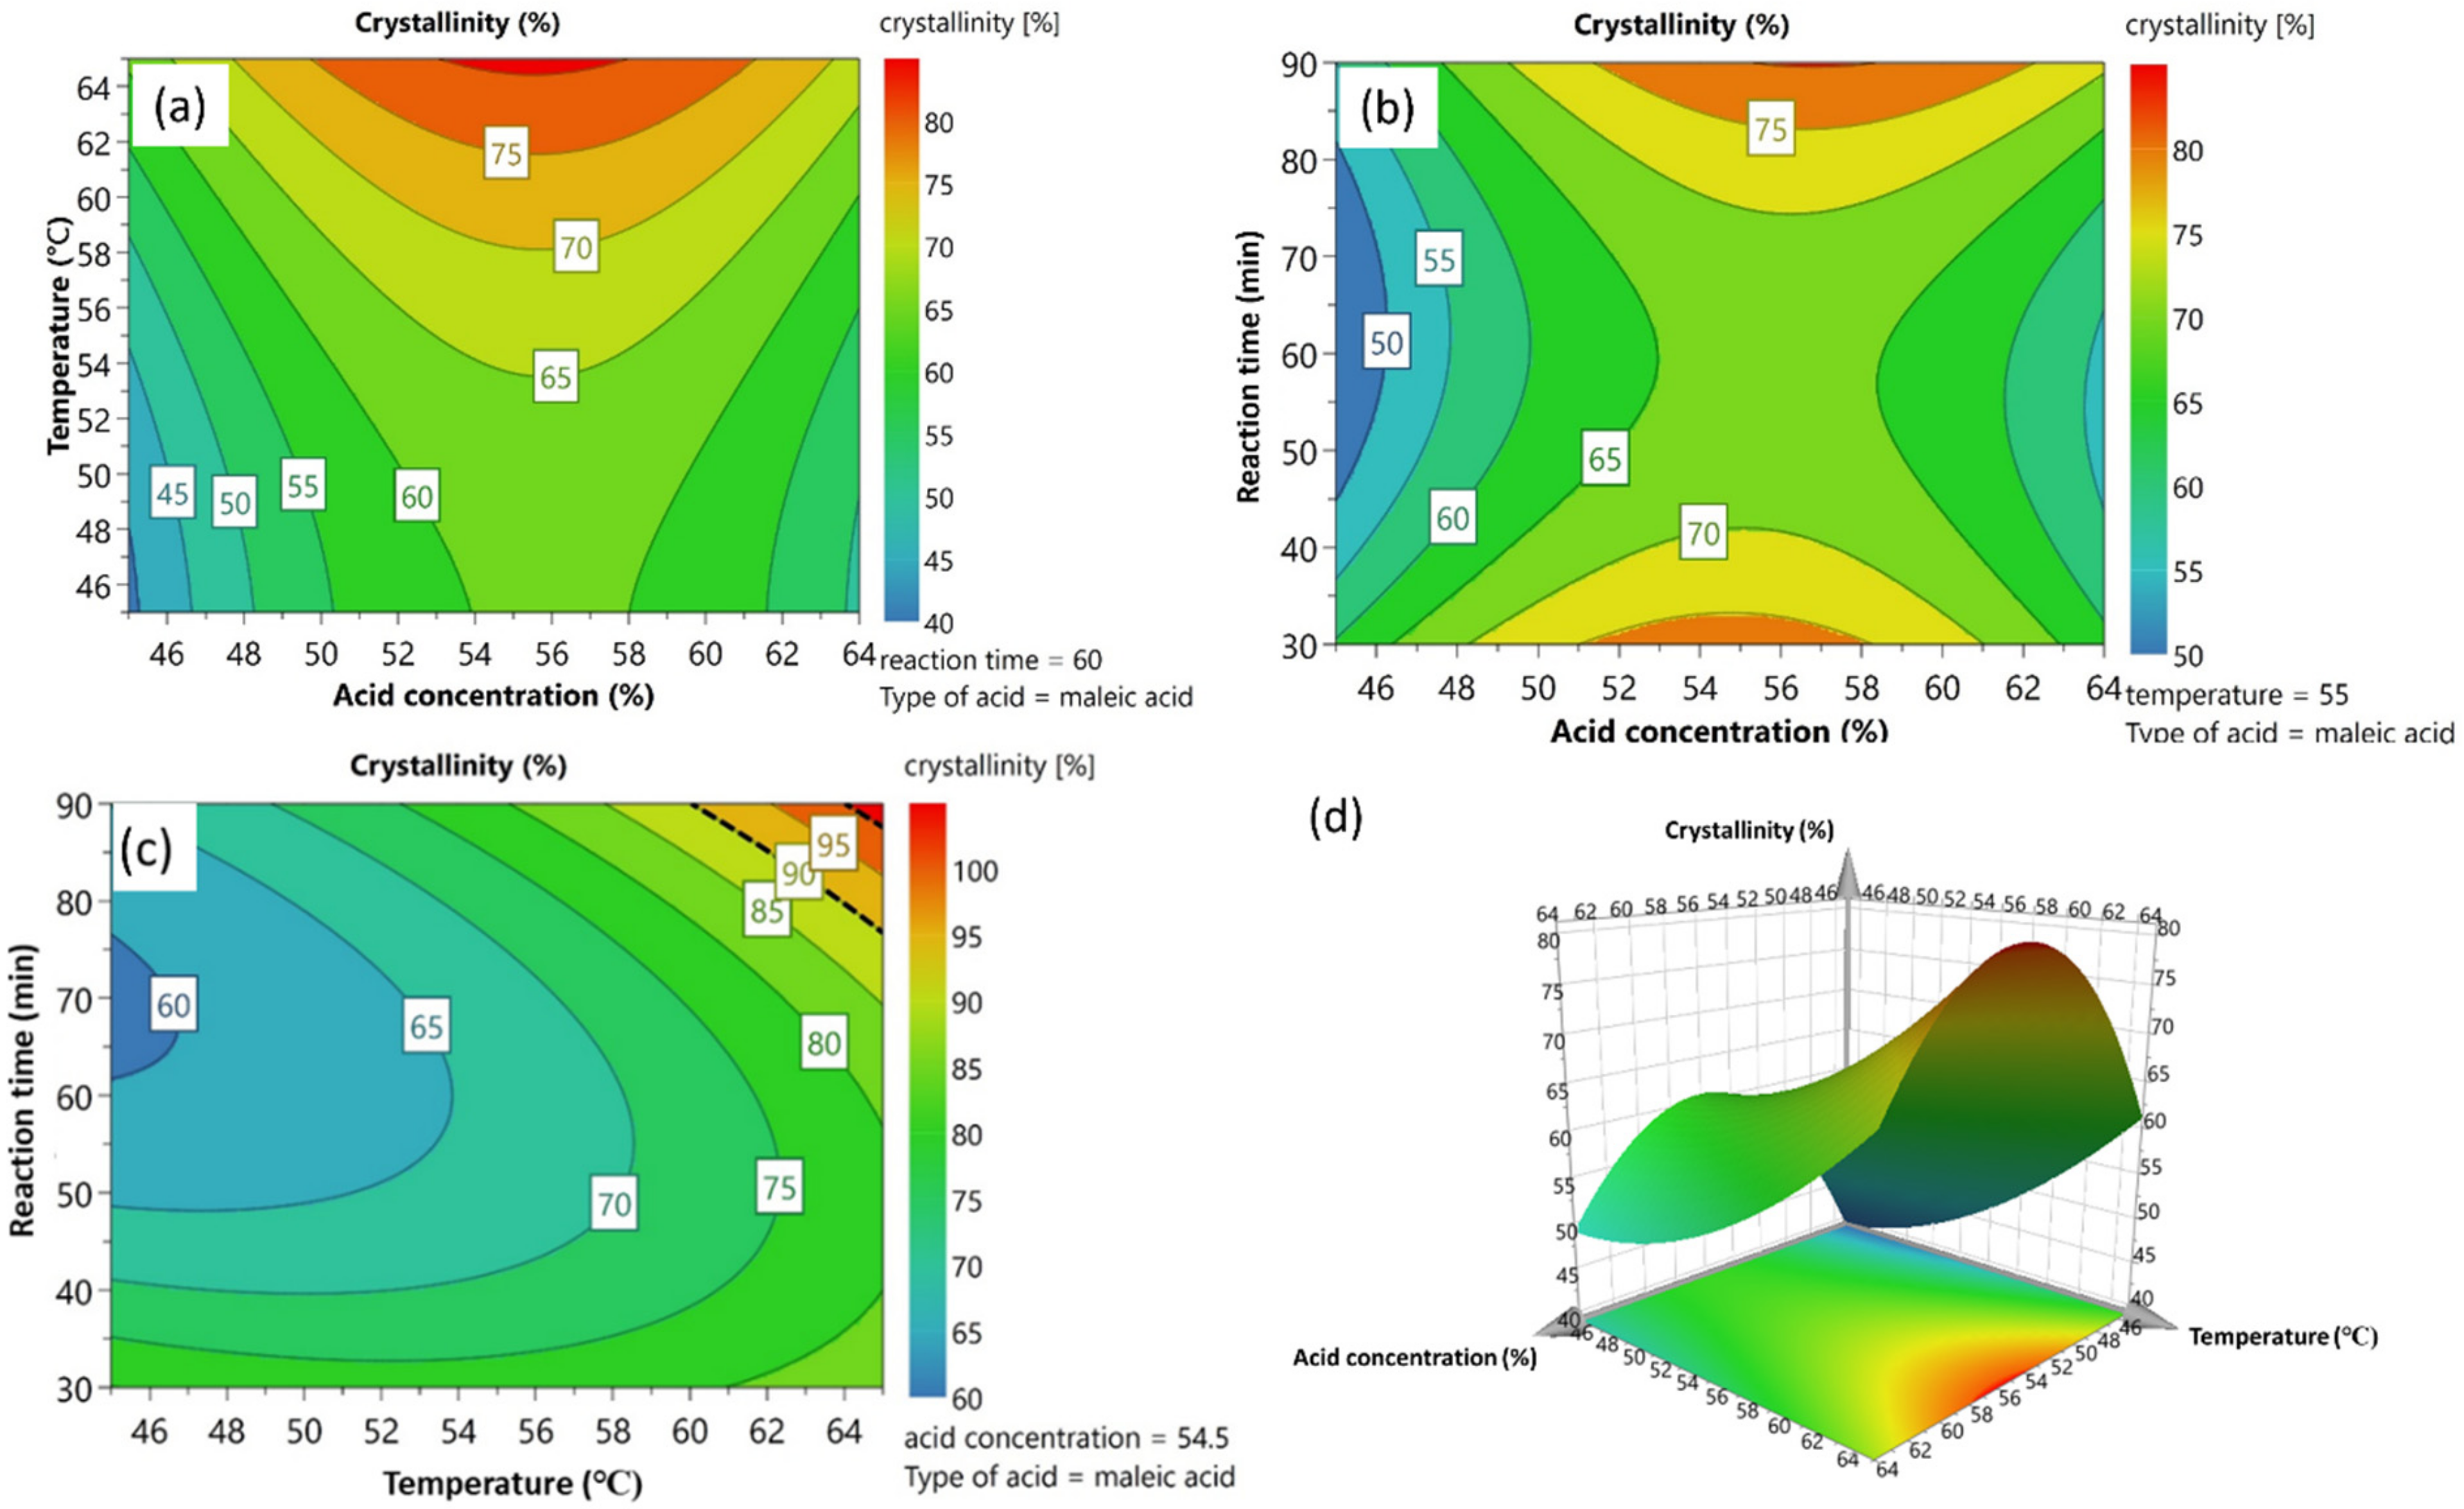
4.2. Response Contour and Surface Plot Analysis

Response contour plots as well as surface plot analysis (Figure 12, Figure 13 and Figure 14) were used to describe the relationship between varying factors within the experimental range, while one factor was kept constant at the center point. The shapes of the contour plots indicate the nature and scope of the interactions. Circular plots describe insignificant interaction between two variables, whereas non-circular (elliptical) plots represent a significant interaction [69]. The response contour plot for sulfuric acid (Figure 12) suggest that for microfibers produced using sulfuric acid, the degree of crystallinity was high when hemp cellulose was exposed to an acid concentration range of 51–65%, and temperature of about ~50 °C for 60 min (Figure 12a). In general, crystallinity seemed to be maximized when acid concentration was higher than 52% regardless of the reaction time (Figure 12b), and by manipulation of reaction time and hydrolysis temperature (Figure 12c), at low reaction time and low temperature, the crystallinity degree increased. Figure 12d shows the surface plots of sulfuric acid hydrolysis and confirmed the same trend shown in the contour plots that an increase in crystallinity is influenced by an increase in acid concentration to a certain degree even at low temperatures. Furthermore, from the results obtained, the crystallinity degree decreases when high sulfuric acid concentrations are adopted, and this can be attributed to complete hydrolysis of cellulose to soluble sugars and other by-products [25]. Song et al. [70], reported that excessive treatment using H2SO4 either in higher concentration or longer treatment conditions NCC yield percentage did not improve but rather NCC would be degraded into other products. The contour plots show non-circular lines, and this can be attributed to a significant interaction between variables.
In accordance with the contour plots results, Figure 13a–c shows non-circular contour lines representing a significant interaction between the formic acid concentration and hydrolysis temperature, acid concentration and reaction time, and reaction time and hydrolysis temperature. From the surface plot (Figure 13d), higher crystallinity was observed with an increase in formic acid concentration in the range of 50–62% and at lower temperatures as also shown by the contour plot (Figure 13a).
In the contour plots (Figure 14a–c), the relationships between maleic acid concentration and hydrolysis temperature, maleic acid concentration and reaction time, and reaction time and hydrolysis temperature are presented. The results show a non-circular nature of the plots, and this can be attributed to significant interaction between two variables. From Figure 14a, the crystallinity is highly influenced by an increase in temperature and an increase in acid concentration. The reaction time and hydrolysis temperature contour plot shows that the crystallinity degree is highly influenced by extreme hydrolysis conditions (temperature and time). Figure 14d, shows the surface plot relationship to crystallinity and an increase in crystallinity degree was observed at low temperatures and a maleic acid concentration range of 50–61%.

4.3. Optimization and Model Verification

To select the optimum conditions and their respective levels, the RSM-CCD model was analyzed. The maximum crystallinity degree of CMFs predicted from the model was determined to be 83.69% with the optimum hydrolysis conditions as detailed in Table 4. To confirm the validity of the model for predicting the maximum crystallinity degree for CMFs, experiments were repeated three times using the optimum conditions. From the three replicate experiments, the results obtained showed an average crystallinity degree of 82%, which is significantly closer to the predicted optimum value. Therefore, the results verified the validity of the model to produce CMFs extracted from cellulose.

5. Conclusions

The extraction of cellulose microfibers (CMFs) has been successfully carried out from Hemp (Cannabis Sativa) bast fibers. Bast fibers underwent alkali pre-treatment followed by subsequent bleaching processes. Fibers were then acid hydrolyzed using varied conditions (acid type, acid concentration, reaction time, and hydrolysis temperature) followed by homogenization. The surface morphology, chemical, crystalline, and thermal properties of the untreated, treated, and acid hydrolyzed fibers was determined using SEM, FTIR, XRD, and TGA. SEM confirmed that hydrolysis produced cellulose microfibers of varying size and morphology. FTIR spectra showed that the main chemical structure of cellulose was not altered during the hydrolysis process. TGA also showed that CMFs with high crystallinity resulted in good thermal stability, which is a favorable property for high temperature applications. To optimize the experimental conditions of acid hydrolysis for the production of highly crystalline cellulose microfibers, a central composite design (CCD) model was employed under response surface methodology (RSM). For acid hydrolysis processes using sulfuric acid, formic acid and maleic acid, the acid concentration, hydrolysis temperatures, and hydrolysis time within the ranges 45–64 wt%, 45–65 °C, and 30–90 min, respectively. Therefore, this study allows the following conclusions, for sulfuric acid hydrolysis the model showed that the crystallinity strongly depended on the acid concentration even at low hydrolysis time and hydrolysis temperature. Whereas, for formic acid hydrolysis, interaction between acid concentration and hydrolysis temperature was more favorable to obtain maximized crystallinity degree. For maleic acid hydrolysis, crystallinity was highly influenced by an increase in temperature and in acid concentration 50–61%. Under the optimum hydrolysis conditions, the predicted crystallinity degree of 82% predicted by the model agreed with the experimental results of ~84% of crystallinity and validated by the model generated by CCD-RSM. This optimum crystallinity degree was obtained by applying the following hydrolysis conditions, using formic acid at 62% acid concentration, 47 °C hydrolysis temperature and 36 min of reaction time. This study established that the wide available bast fiber can be regarded as a greener and sustainable waste for the preparation of cellulose microfibers, and RSM-CCD can be used to optimize extraction conditions.

Author Contributions

Conceptualization, J.T.M., Y.N. and A.E.; methodology, J.T.M., Y.N. and A.E.; software, J.T.M. and Y.N.; validation, J.T.M., Y.N. and A.E.; formal analysis, J.T.M., B.T. and O.T.M.; investigation, J.T.M., Y.N. and A.E.; resources, Y.N. and A.E.; data curation, J.T.M., B.T., O.T.M. and Y.N.; writing—original draft preparation, J.T.M.; writing—review and editing, J.T.M., Y.N. and A.E.; visualization, J.T.M., Y.N. and A.E.; supervision, Y.N. and A.E.; project administration, J.T.M., Y.N. and A.E.; funding acquisition, J.T.M. and A.E. All authors have read and agreed to the published version of the manuscript.

Funding

This research was funded by the National Research Foundation South Africa (Grant No. 123493) and the Royal Society Foundation, United Kingdom (Grant No. FLR/R1/190087).

Institutional Review Board Statement

Not applicable.

Informed Consent Statement

Not applicable.

Data Availability Statement

Not applicable.

Conflicts of Interest

The authors declare no conflict of interest.

Appendix A

Table A1. Results from the RSM-CCD experimental design and response data for sulfuric, formic, and maleic acid hydrolysis of cellulose extracted from Cannabis sativa bast fibers.
Sample IDCrystallinity Degree (%)
PredictedObserved
1SA-CMFs72.875
1FA-CMFs57.255
1MA-CMFs4040
2SA-CMFs54.252
2FA-CMFs47.850
2MA-CMFs5555
3FA-CMFs6666
3MA-CMFs6161
3SA-CMFs5353
4MA-CMFs6565
4SA-CMFs72.171
4FA-CMFs57.959
5FA-CMFs7070
5MA-CMFs5454
5SA-CMFs7676
6MA-CMFs6767
6SA-CMFs57.959
6FA-CMFs62.161
7SA-CMFs6666
7SA-CMFs6666
7SA-CMFs6666
62.161

References

  1. Sachelaru, A. Cellulose Fibers from Hemp for Textile Industry; Bachelors Research Project; University of Groningen: Groningen, The Netherlands, 2019; Available online: https://fse.studenttheses.ub.rug.nl/20256/1/Andreea%20-%20Report%20bachelor%20research%20project%20-%20Isolation%20of%20cellulose%20fibers%20from%20hemp%20for%20textile%20industry.pdf (accessed on 10 May 2022).
  2. Morin-Crini, N.; Loiacono, S.; Placet, V.; Torri, G.; Bradu, C.; Kostić, M.; Cosentino, C.; Chanet, G.; Martel, B.; Lichtfouse, E.; et al. Hemp-Based Materials for Metal Removal. In Green Adsorbents for Pollutant Removal, Environmental Chemistry for a Sustainable World; Springer: Berlin/Heidelberg, Germany, 2018; pp. 1–34. ISBN 9783319921624. [Google Scholar]
  3. Väisänen, T.; Batello, P.; Lappalainen, R.; Tomppo, L. Modification of hemp fibers (Cannabis Sativa L.) for composite applications. Ind. Crops Prod. 2018, 111, 422–429. [Google Scholar] [CrossRef]
  4. Salami, A.; Raninen, K.; Heikkinen, J.; Tomppo, L.; Vilppo, T.; Selenius, M.; Raatikainen, O.; Lappalainen, R.; Vepsäläinen, J. Complementary chemical characterization of distillates obtained from industrial hemp hurds by thermal processing. Ind. Crops Prod. 2020, 155, 112760. [Google Scholar] [CrossRef]
  5. Abraham, R.E.; Wong, C.S.; Puri, M. Enrichment of cellulosic waste hemp (Cannabis sativa) hurd into non-toxic microfibres. Materials 2016, 9, 562. [Google Scholar] [CrossRef] [PubMed] [Green Version]
  6. Jarabo, R.; Fuente, E.; Monte, M.C.; Savastano, H.; Mutjé, P.; Negro, C. Use of cellulose fibers from hemp core in fiber-cement production. Effect on flocculation, retention, drainage and product properties. Ind. Crops Prod. 2012, 39, 89–96. [Google Scholar] [CrossRef] [Green Version]
  7. Pejić, B.M.; Kramar, A.D.; Obradović, B.M.; Kuraica, M.M.; Žekić, A.A.; Kostić, M.M. Effect of plasma treatment on chemical composition, structure and sorption properties of lignocellulosic hemp fibers (Cannabis sativa L.). Carbohydr. Polym. 2020, 236, 116000. [Google Scholar] [CrossRef]
  8. Kassab, Z.; Abdellaoui, Y.; Salim, M.H.; Bouhfid, R.; Qaiss, A.E.K.; El Achaby, M. Micro- and nano-celluloses derived from hemp stalks and their effect as polymer reinforcing materials. Carbohydr. Polym. 2020, 245, 116506. [Google Scholar] [CrossRef] [PubMed]
  9. Tanpichai, S.; Witayakran, S.; Boonmahitthisud, A. Study on structural and thermal properties of cellulose microfibers isolated from pineapple leaves using steam explosion. J. Environ. Chem. Eng. 2019, 7, 102836. [Google Scholar] [CrossRef]
  10. Reddy, K.O.; Maheswari, C.U.; Dhlamini, M.S.; Kommula, V.P. Exploration on the characteristics of cellulose microfibers from Palmyra palm fruits. Int. J. Polym. Anal. Charact. 2016, 21, 286–295. [Google Scholar] [CrossRef]
  11. Elanthikkal, S.; Gopalakrishnapanicker, U.; Varghese, S.; Guthrie, J.T. Cellulose microfibres produced from banana plant wastes: Isolation and characterization. Carbohydr. Polym. 2010, 80, 852–859. [Google Scholar] [CrossRef]
  12. Wang, S.; Wang, F.; Song, Z.; Song, X.; Yang, X.; Wang, Q. Preparation of cellulose nanocrystals using highly recyclable organic acid treated softwood pulp. BioResources 2019, 14, 9331–9351. [Google Scholar] [CrossRef]
  13. Frost, B.A.; Johan Foster, E. Isolation of thermally stable cellulose nanocrystals from spent coffee grounds via phosphoric acid hydrolysis. J. Renew. Mater. 2020, 8, 187–203. [Google Scholar] [CrossRef]
  14. Sherif, N.; Gadalla, M.; Kamel, D. Acid–hydrolysed furfural production from rice straw bio-waste: Process synthesis, simulation, and optimisation. S. Afr. J. Chem. Eng. 2021, 38, 34–40. [Google Scholar] [CrossRef]
  15. Rehman, N.; Alam, S.; Amin, N.U.; Mian, I.; Ullah, H. Ecofriendly isolation of cellulose from eucalyptus lenceolata: A novel approach. Int. J. Polym. Sci. 2018, 2018, 8381501. [Google Scholar] [CrossRef] [Green Version]
  16. Du, H.; Liu, C.; Wang, D.; Zhang, Y.; Yu, G.; Si, C.; Li, B.; Mu, X.; Peng, H. Sustainable preparation and characterization of thermally stable and functional cellulose nanocrystals and nanofibrils via formic acid hydrolysis. J. Bioresour. Bioprod. 2017, 2, 10–15. [Google Scholar] [CrossRef]
  17. Chen, H.; Sharma, S.K.; Sharma, P.R.; Yeh, H.; Johnson, K.; Hsiao, B.S. Arsenic(III) Removal by Nanostructured Dialdehyde Cellulose-Cysteine Microscale and Nanoscale Fibers. ACS Omega 2019, 4, 22008–22020. [Google Scholar] [CrossRef] [Green Version]
  18. Amenaghawon, A.N.; Balogun, A.A.; Agbonghae, E.E.; Ogbeide, S.E.; Okieimen, C.O. Statistical Optimisation of Dilute Acid Pre-Treatment of Corn Stover using Response Surface Methodology. J. Environ. 2013, 2, 34–40. [Google Scholar]
  19. Ferreres, F.; Grosso, C.; Gil-Izquierdo, A.; Valentão, P.; Mota, A.T.; Andrade, P.B. Optimization of the recovery of high-value compounds from pitaya fruit by-products using microwave-assisted extraction. Food Chem. 2017, 230, 463–474. [Google Scholar] [CrossRef]
  20. Chang, C.W.; Yen, C.C.; Wu, M.T.; Hsu, M.C.; Wu, T.Y. Microwave-assisted extraction of cannabinoids in hemp nut using response surface methodology: Optimization and comparative study. Molecules 2017, 22, 1894. [Google Scholar] [CrossRef] [Green Version]
  21. Goudarzi, L.; Kasra Kermanshahi, R.; Jahed Khaniki, G. Response Surface Design for Removal of Lead by Different Lactic Acid Bacteria. Health Scope 2020, 9, e101049. [Google Scholar] [CrossRef]
  22. Murray, L.; Mason, R.L.; Gunst, R.F.; Hess, J.L. Statistical Design and Analysis of Experiments: With Applications to Engineering and Science; John Wiley & Sons: Hoboken, NJ, USA, 1990; Volume 85, ISBN 3175723993. [Google Scholar]
  23. Dean, A.; Morris, M.; Stufken, J.; Bingham, D. Handbook of Design and Analysis of Experiments; Chapman & Hall/CRC Press: Boca Raton, FL, USA, 2015; ISBN 9781466504349. [Google Scholar]
  24. Guo, Y.; Zhang, Y.; Zheng, D.; Li, M.; Yue, J. Isolation and characterization of nanocellulose crystals via acid hydrolysis from agricultural waste-tea stalk. Int. J. Biol. Macromol. 2020, 163, 927–933. [Google Scholar] [CrossRef]
  25. Akhabue, C.E.; Osubor, N.T. Optimization of extraction of microcrystalline cellulose from orange peel waste using response surface methodology. Ife J. Sci. 2017, 19, 227–235. [Google Scholar] [CrossRef] [Green Version]
  26. Chowdhury, Z.Z.; Chandran, R.R.R.; Jahan, A.; Khalid, K.; Rahman, M.M.; Al-Amin, M.; Akbarzadeh, O.; Badruddin, I.A.; Khan, T.M.Y.; Kamangar, S.; et al. Extraction of cellulose nano-whiskers using ionic liquid-assisted ultra-sonication: Optimization and mathematical modelling using Box-Behnken design. Symmetry 2019, 11, 1148. [Google Scholar] [CrossRef] [Green Version]
  27. Kandhola, G.; Djioleu, A.; Rajan, K.; Labbé, N.; Sakon, J.; Carrier, D.J.; Kim, J.W. Maximizing production of cellulose nanocrystals and nanofibers from pre-extracted loblolly pine kraft pulp: A response surface approach. Bioresour. Bioprocess. 2020, 7, 19. [Google Scholar] [CrossRef]
  28. Abiaziem, C.V.; Williams, A.B.; Inegbenebor, A.I.; Onwordi, C.T.; Ehi-Eromosele, C.O.; Petrik, L.F. Isolation and Characterisation of Cellulose Nanocrystal Obtained From Sugarcane Peel. Rasayan J. Chem. 2020, 13, 177–187. [Google Scholar] [CrossRef]
  29. Malucelli, L.C.; Matos, M.; Jordão, C.; Lomonaco, D.; Lacerda, L.G.; Carvalho Filho, M.A.S.; Magalhães, W.L.E. Influence of cellulose chemical pretreatment on energy consumption and viscosity of produced cellulose nanofibers (CNF) and mechanical properties of nanopaper. Cellulose 2019, 26, 1667–1681. [Google Scholar] [CrossRef]
  30. Jiang, F.; Hsieh, Y. Lo Cellulose nanocrystal isolation from tomato peels and assembled nanofibers. Carbohydr. Polym. 2015, 122, 60–68. [Google Scholar] [CrossRef] [Green Version]
  31. Ilyas, R.A.; Sapuan, S.M.; Ishak, M.R. Isolation and characterization of nanocrystalline cellulose from sugar palm fibres (Arenga pinnata). Carbohydr. Polym. 2018, 181, 1038–1051. [Google Scholar] [CrossRef]
  32. Abd Hamid, S.B.; Chowdhury, Z.Z.; Karim, M.Z. Catalytic extraction of microcrystalline cellulose (MCC) from Elaeis guineensis using central composite design (CCD). BioResources 2014, 9, 7403–7426. [Google Scholar] [CrossRef] [Green Version]
  33. Akgün, D. Optimization and Characterization of Cellulose Nanocrystal Production from Aseptic Tetra Pak Food Packaging Waste. J. Turk. Chem. Soc. Sect. A Chem. 2022, 9, 131–148. [Google Scholar] [CrossRef]
  34. Du, H.; Liu, C.; Mu, X.; Gong, W.; Lv, D.; Hong, Y.; Si, C.; Li, B. Preparation and characterization of thermally stable cellulose nanocrystals via a sustainable approach of FeCl3-catalyzed formic acid hydrolysis. Cellulose 2016, 23, 2389–2407. [Google Scholar] [CrossRef]
  35. Matebie, B.Y.; Tizazu, B.Z.; Kadhem, A.A.; Venkatesa Prabhu, S. Synthesis of Cellulose Nanocrystals (CNCs) from Brewer’s Spent Grain Using Acid Hydrolysis: Characterization and Optimization. J. Nanomater. 2021, 2021, 7133154. [Google Scholar] [CrossRef]
  36. Ventura-Cruz, S.; Tecante, A. Extraction and characterization of cellulose nanofibers from Rose stems (Rosa spp.). Carbohydr. Polym. 2019, 220, 53–59. [Google Scholar] [CrossRef] [PubMed]
  37. Zhang, G.; Wu, F.; Ma, T.; Zhang, B.; Manyande, A.; Du, H. Preparation and characterization of cellulose nanofibers isolated from lettuce peel. Cellul. Chem. Technol. 2019, 53, 677–684. [Google Scholar] [CrossRef]
  38. Pelissari, F.M.; Sobral, P.J.D.A.; Menegalli, F.C. Isolation and characterization of cellulose nanofibers from banana peels. Cellulose 2014, 21, 417–432. [Google Scholar] [CrossRef]
  39. Wulandari, W.T.; Rochliadi, A.; Arcana, I.M. Nanocellulose prepared by acid hydrolysis of isolated cellulose from sugarcane bagasse. IOP Conf. Ser. Mater. Sci. Eng. 2016, 107, 012045. [Google Scholar] [CrossRef]
  40. Xie, J.; Hse, C.Y.; De Hoop, C.F.; Hu, T.; Qi, J.; Shupe, T.F. Isolation and characterization of cellulose nanofibers from bamboo using microwave liquefaction combined with chemical treatment and ultrasonication. Carbohydr. Polym. 2016, 151, 725–734. [Google Scholar] [CrossRef]
  41. Tibolla, H.; Pelissari, F.M.; Menegalli, F.C. Cellulose nanofibers produced from banana peel by chemical and enzymatic treatment. LWT-Food Sci. Technol. 2014, 59, 1311–1318. [Google Scholar] [CrossRef]
  42. Dominic, M.C.D.; Joseph, R.; Begum, P.M.S.; Joseph, M.; Padmanabhan, D.; Morris, L.A.; Kumar, A.S.; Formela, K. Cellulose nanofibers isolated from the Cuscuta Reflexa plant as a green reinforcement of natural rubber. Polymers 2020, 12, 814. [Google Scholar] [CrossRef] [Green Version]
  43. Mahardika, M.; Abral, H.; Kasim, A.; Arief, S.; Asrofi, M. Production of nanocellulose from pineapple leaf fibers via high-shear homogenization and ultrasonication. Fibers 2018, 6, 28. [Google Scholar] [CrossRef] [Green Version]
  44. Tian, Z.; Chen, J.; Ji, X.; Wang, Q.; Yang, G.; Fatehi, P. Dilute sulfuric acid hydrolysis of Pennisetum (sp.) Hemicellulose. BioResources 2017, 12, 2609–2617. [Google Scholar] [CrossRef] [Green Version]
  45. Syafri, E.; Kasim, A.; Abral, H.; Sudirman; Sulungbudi, G.T.; Sanjay, M.R.; Sari, N.H. Synthesis and characterization of cellulose nanofibers (CNF) ramie reinforced cassava starch hybrid composites. Int. J. Biol. Macromol. 2018, 120, 578–586. [Google Scholar] [CrossRef] [PubMed]
  46. Tang, Y.; Yang, S.; Zhang, N.; Zhang, J. Preparation and characterization of nanocrystalline cellulose via low-intensity ultrasonic-assisted sulfuric acid hydrolysis. Cellulose 2014, 21, 335–346. [Google Scholar] [CrossRef]
  47. Li, M.; Wang, L.J.; Li, D.; Cheng, Y.L.; Adhikari, B. Preparation and characterization of cellulose nanofibers from de-pectinated sugar beet pulp. Carbohydr. Polym. 2014, 102, 136–143. [Google Scholar] [CrossRef] [PubMed]
  48. Rana, V.; Malik, S.; Joshi, G.; Rajput, N.K.; Gupta, P.K. Preparation of alpha cellulose from sugarcane bagasse and its cationization: Synthesis, characterization, validation and application as wet-end additive. Int. J. Biol. Macromol. 2021, 170, 793–809. [Google Scholar] [CrossRef]
  49. Saurabh, C.K.; Mustapha, A.; Masri, M.M.; Owolabi, A.F.; Syakir, M.I.; Dungani, R.; Paridah, M.T.; Jawaid, M.; Abdul Khalil, H.P.S. Isolation and characterization of cellulose nanofibers from gigantochloa scortechinii as a reinforcement material. J. Nanomater. 2016, 2016, 4024527. [Google Scholar] [CrossRef] [Green Version]
  50. Widiarto, S.; Pramono, E.; Suharso; Rochliadi, A.; Arcana, I.M. Cellulose nanofibers preparation from cassava peels via mechanical disruption. Fibers 2019, 7, 44. [Google Scholar] [CrossRef] [Green Version]
  51. Liu, C.; Li, B.; Du, H.; Lv, D.; Zhang, Y.; Yu, G.; Mu, X.; Peng, H. Properties of nanocellulose isolated from corncob residue using sulfuric acid, formic acid, oxidative and mechanical methods. Carbohydr. Polym. 2016, 151, 716–724. [Google Scholar] [CrossRef]
  52. Yang, X.; Han, F.; Xu, C.; Jiang, S.; Huang, L.; Liu, L.; Xia, Z. Effects of preparation methods on the morphology and properties of nanocellulose (NC) extracted from corn husk. Ind. Crops Prod. 2017, 109, 241–247. [Google Scholar] [CrossRef]
  53. Nagarajan, K.J.; Balaji, A.N.; Ramanujam, N.R. Extraction of cellulose nanofibers from cocos nucifera var aurantiaca peduncle by ball milling combined with chemical treatment. Carbohydr. Polym. 2019, 212, 312–322. [Google Scholar] [CrossRef]
  54. Chirayil, C.J.; Joy, J.; Mathew, L.; Mozetic, M.; Koetz, J.; Thomas, S. Isolation and characterization of cellulose nanofibrils from Helicteres isora plant. Ind. Crops Prod. 2014, 59, 27–34. [Google Scholar] [CrossRef]
  55. Wu, J.; Du, X.; Yin, Z.; Xu, S.; Xu, S.; Zhang, Y. Preparation and characterization of cellulose nanofibrils from coconut coir fibers and their reinforcements in biodegradable composite films. Carbohydr. Polym. 2019, 211, 49–56. [Google Scholar] [CrossRef] [PubMed]
  56. Revati, R.; Majid, M.S.A.; Ridzuan, M.J.M.; Nasir, N.F.M. Characterisation of structural and physical properties of cellulose nanofibers from Pennisetum purpureum. IOP Conf. Ser. Mater. Sci. Eng. 2019, 670, 012043. [Google Scholar] [CrossRef]
  57. Du, H.; Liu, C.; Zhang, Y.; Yu, G.; Si, C.; Li, B. Preparation and characterization of functional cellulose nanofibrils via formic acid hydrolysis pretreatment and the followed high-pressure homogenization. Ind. Crops Prod. 2016, 94, 736–745. [Google Scholar] [CrossRef]
  58. Santmarti, A.; Lee, K. Crystallinity and Thermal Stability of Nanocellulose. In Nanocellulose and Sustainability: Production, Properties, Applications, and Case Studies; CRC Press: Boca Raton, FL, USA, 2018; pp. 67–86. ISBN 9781351262927. [Google Scholar]
  59. Shaikh, H.M.; Anis, A.; Poulose, A.M.; Al-Zahrani, S.M.; Madhar, N.A.; Alhamidi, A.; Alam, M.A. Isolation and characterization of alpha and nanocrystalline cellulose from date palm (Phoenix dactylifera L.) trunk mesh. Polymers 2021, 13, 1893. [Google Scholar] [CrossRef]
  60. Lv, D.; Du, H.; Che, X.; Wu, M.; Zhang, Y.; Liu, C.; Nie, S.; Zhang, X.; Li, B. Tailored and Integrated Production of Functional Cellulose Nanocrystals and Cellulose Nanofibrils via Sustainable Formic Acid Hydrolysis: Kinetic Study and Characterization. ACS Sustain. Chem. Eng. 2019, 7, 9449–9463. [Google Scholar] [CrossRef]
  61. Sofla, M.R.K.; Brown, R.J.; Tsuzuki, T.; Rainey, T.J. A comparison of cellulose nanocrystals and cellulose nano fi bres extracted from bagasse using acid and ball milling methods. Adv. Nat. Sci. Nanosci. Nanotechnol. 2016, 7, 035004. [Google Scholar] [CrossRef]
  62. Seta, F.T.; An, X.; Liu, L.; Zhang, H.; Yang, J.; Zhang, W.; Nie, S.; Yao, S.; Cao, H.; Xu, Q.; et al. Preparation and characterization of high yield cellulose nanocrystals (CNC) derived from ball mill pretreatment and maleic acid hydrolysis. Carbohydr. Polym. 2020, 234, 115942. [Google Scholar] [CrossRef]
  63. Peretz, R.; Sterenzon, E.; Gerchman, Y.; Kumar, V.; Luxbacher, T.; Mamane, H. Nanocellulose production from recycled paper mill sludge using ozonation pretreatment followed by recyclable maleic acid hydrolysis. Carbohydr. Polym. 2019, 216, 343–351. [Google Scholar] [CrossRef]
  64. Bian, H.; Luo, J.; Wang, R.; Zhou, X.; Ni, S.; Shi, R.; Fang, G.; Dai, H. Recyclable and Reusable Maleic Acid for Efficient Production of Cellulose Nanofibrils with Stable Performance. ACS Sustain. Chem. Eng. 2019, 7, 20022–20031. [Google Scholar] [CrossRef]
  65. Ahmadi, M.; Vahabzadeh, F.; Bonakdarpour, B.; Mofarrah, E.; Mehranian, M. Application of the central composite design and response surface methodology to the advanced treatment of olive oil processing wastewater using Fenton’s peroxidation. J. Hazard. Mater. 2005, 123, 187–195. [Google Scholar] [CrossRef]
  66. Sartika, D.; Syamsu, K.; Warsiki, E.; Fahma, F. Optimization of Sulfuric Acid Concentration and Hydrolysis Time on Crystallinity of Nanocrystalline Cellulose: A Response Surface Methodology Study. In Proceedings of the IOP Conference Series: Earth and Environmental Science, South Sulawesi, Indonesia, 6–8 August 2019; Volume 355, pp. 1–9. [Google Scholar]
  67. Shet, V.B.; Sanil, N.; Bhat, M.; Naik, M.; Mascarenhas, L.N.; Goveas, L.C.; Rao, C.V.; Ujwal, P.; Sandesh, K.; Aparna, A. Acid hydrolysis optimization of cocoa pod shell using response surface methodology approach toward ethanol production. Agric. Nat. Resour. 2018, 52, 581–587. [Google Scholar] [CrossRef]
  68. Yadav, S.P.; Ray, A.K.; Ghosh, U.K. Optimization of Rice Straw Acid Hydrolysis Using Response Surface Methodology. Am. J. Environ. Eng. 2016, 6, 174–183. [Google Scholar] [CrossRef]
  69. Chen, X.; Wei, Z.; Zhu, L.; Yuan, X.; Wei, D.; Peng, W.; Wu, C. Efficient approach for the extraction and identification of red pigment from zanthoxylum bungeanum maxim and its antioxidant activity. Molecules 2018, 23, 1109. [Google Scholar] [CrossRef] [PubMed] [Green Version]
  70. Song, Y.K.; Leng Chew, I.M.; Yaw Choong, T.S.; Tan, J.; Tan, K.W. Isolation of Nanocrystalline Cellulose from oil palm empty fruit bunch—A response surface methodology study. MATEC Web Conf. 2016, 60, 04009. [Google Scholar] [CrossRef]
Figure 1. Schematic showing steps for the extraction and preparation of cellulose microfibers from hemp bast fibers through acid hydrolysis coupled with ultrasonic homogenization.
Processes 10 01150 g001
Figure 2. SEM images of bleached hemp cellulose at varying magnification.
Processes 10 01150 g002
Figure 3. Scanning electron micrographs of hemp cellulose microfibers (CMFs) after acid hydrolysis.
Processes 10 01150 g003
Figure 4. FTIR spectra of (a) raw hemp fiber and bleached cellulose, (b) Sulfuric acid hydrolyzed CMFs, (c) Formic acid hydrolyzed CMFs, and (d) Maleic acid hydrolyzed CMFs.
Processes 10 01150 g004
Figure 5. XRD spectra of (a) fibers (raw hemp fiber-red and bleached cellulose fiber-black), (b) sulfuric acid hydrolyzed CMFs, (c) Formic acid hydrolyzed CMFs, and (d) Maleic acid hydrolyzed CMFs produced from hemp fibers.
Processes 10 01150 g005
Figure 6. TG (a) and DTG (b) curves of raw hemp fiber and bleached cellulose fibers extracted from hemp fiber waste.
Processes 10 01150 g006
Figure 7. TG (a) and DTG (b) curves of sulfuric acid hydrolyzed microfibers extracted from hemp fiber waste.
Processes 10 01150 g007
Figure 8. TG (a) and DTG (b) curves of formic acid hydrolyzed microfibers extracted from hemp fiber waste.
Processes 10 01150 g008
Figure 9. TG (a) and DTG (b) curves of maleic acid hydrolyzed microfibers extracted from hemp fiber waste.
Processes 10 01150 g009
Figure 10. Coefficients plot for acid hydrolyzed CMFs crystallinity degree (%).
Processes 10 01150 g010
Figure 11. Plot of observed vs. predicted crystallinity indexes (%) in the regression model.
Processes 10 01150 g011
Figure 12. Response contour plots for the response between (a) hydrolysis temp vs. acid conc., (b) reaction time vs. acid conc., (c) reaction time vs. hydrolysis temp, and (d) response surface plot from sulfuric acid hydrolysis.
Processes 10 01150 g012
Figure 13. Response contour plots for the response between (a) hydrolysis temp vs. acid conc., (b) reaction time vs. acid conc., (c) reaction time vs. hydrolysis temp, and (d) response surface plot from formic acid hydrolysis.
Processes 10 01150 g013
Figure 14. Response contour plots for the response between (a) hydrolysis temp vs. acid conc., (b) reaction time vs. acid conc., (c) reaction time vs. hydrolysis temp, and (d) response surface plot from maleic acid hydrolysis.
Processes 10 01150 g014
Table 1. Experimental conditions and the types of acids to achieve optimum cellulose microfibers extraction.
Exp NoTemperature
(°C)
Hydrolysis Time
(minutes)
Acid Concentration
(%)
AcidSample ID
1453045Sulfuric acid1SA-CMFs
2456045Formic acid1FA-CMFs
3459045Maleic acid1MA-CMFs
4553045Sulfuric acid2SA-CMFs
5556045Formic acid2FA-CMFs
6559045Maleic acid2MA-CMFs
7653045Formic acid3FA-CMFs
8656045Maleic acid3MA-CMFs
9659045Sulfuric acid3SA-CMFs
10453064Maleic acid4MA-CMFs
11456064Sulfuric acid4SA-CMFs
12459064Formic acid4FA-CMFs
13553064Formic acid5FA-CMFs
14556064Maleic acid5MA-CMFs
15559064Sulfuric acid5SA-CMFs
16653064Maleic acid6MA-CMFs
17656064Sulfuric acid6SA-CMFs
18659064Formic acid6FA-CMFs
19556055Sulfuric acid7SA-CMFs
20556055Sulfuric acid7SA-CMFs
21556055Sulfuric acid7SA-CMFs
Table 2. Thermal degradation onset temperature (Tonset), max degradation temperature (Tmax) and CrI (%) obtained from the TGA, DTG, XRD curves, respectively.
Sample IDCrI (%)Main Thermal DegradationChar Residue Amount
at 900 °C (%)
Tonset (°C)Tmax (°C)Weight Loss (%)
Raw hemp fiber602073867214
Bleached cellulose fiber732323598210
1SA-CMFs752683877811
2SA-CMFs521784107018
3SA-CMFs531524897419
4SA-CMFs71256377855
5SA-CMFs76244373854
6SA-CMFs591905224848
7SA-CMFs662443235322
1FA-CMFs552083647218
2FA-CMFs50247378819
3FA-CMFs66252380838
4FA-CMFs59238387867
5FA-CMFs70235389819
6FA-CMFs61262370855
1MA-CMFs402033686718
2MA-CMFs55244386848
3MA-CMFs61253385848
4MA-CMFs65245389847
5MA-CMFs54261385873
6MA-CMFs67265384864
Table 3. Analysis of variance estimated by ANOVA and statistical information for the crystallinity index (%) as a response from the optimization of hydrolysis treatment using sulfuric, formic, and maleic acid.
SourceDFSum of SquaresMean SquareFp
Regression171564.0992.005111.410.034 *
Residual324.28.8.67
Lack of fit124.224.2--
Pure error20.000
Total corrected211588.21
R20.985 Coefficient of variance (CV) (%)4.07
Adjusted R20.961 Adequate precision9.59
Std.Dev2.84
* p < 0.050 is significant.
Table 4. Observed vs. predicted results of the optimum crystallinity degree (%).
Observed ResultsPredicted Results
Acid typeFormic acidFormic acid
Acid concentrations62%62.1%
Hydrolysis temperature47 °C47 °C
Reaction time36 min36 min
Maximum crystallinity82%83.69%
Publisher’s Note: MDPI stays neutral with regard to jurisdictional claims in published maps and institutional affiliations.

