Article

Numerical Simulation Approach for a Dynamically Operated Sorption-Enhanced Water-Gas Shift Reactor

by
Tabea J. Stadler
1,
Jan-Hendrik Knoop
1,
Simon Decker
2 and
Peter Pfeifer
1,*
1
Institute for Micro Process Engineering (IMVT), Karlsruhe Institute of Technology (KIT), Hermann-von-Helmholtz-Platz 1, 76344 Eggenstein-Leopoldshafen, Germany
2
Elektrotechnisches Institut (ETI), Karlsruhe Institute of Technology (KIT), Kaiserstr. 12, 76131 Karlsruhe, Germany
*
Author to whom correspondence should be addressed.
Processes 2022, 10(6), 1160; https://doi.org/10.3390/pr10061160
Submission received: 19 May 2022 / Revised: 3 June 2022 / Accepted: 7 June 2022 / Published: 9 June 2022
(This article belongs to the Special Issue Numerical Simulation of Nonlinear Dynamical Systems)

Abstract

:
A dynamically operated sorption-enhanced water–gas shift reactor is modelled to leverage its performance by means of model-based process design. This reactor shall provide CO2-free synthesis gas for e-fuel production from pure CO. The nonlinear model equations describing simultaneous adsorption and reaction are solved with three numerical approaches in MATLAB: a built-in solver for partial differential equations, a semi-discretization method in combination with an ordinary differential equation solver, and an advanced graphic implementation of the latter method in Simulink. The novel implementation in Simulink offers various advantages for dynamic simulations and is expanded to a process model with six reaction chambers. The continuous conditions in the reaction chambers and the discrete states of the valves, which enable switching between reactive adsorption and regeneration, lead to a hybrid system. Controlling the discrete states in a finite-state machine in Stateflow enables automated switching between reactive adsorption and regeneration depending on predefined conditions, such as a time span or a concentration threshold in the product gas. The established chemical reactor simulation approach features unique possibilities in terms of simulation-driven development of operating procedures for intensified reactor operation. In a base case simulation, the sorbent usage for serial operation with adjusted switching times is increased by almost 15%.

Graphical Abstract

1. Introduction

In November 2021, the participants of the Conference of the Parties COP26 in Glasgow agreed on a stronger commitment to the aims set in the Paris Agreement back in 2015: reducing the limitation of global warming to 1.5   C [1,2]. To reach this ambitious goal, anthropogenic greenhouse gas emissions must be drastically reduced. Potential for reduction is especially possible in the transport sector, where fossil fuels must be replaced by sustainable alternatives. A promising substitute in the case of aviation is synthetic jet fuel produced in so-called Power-to-Liquid processes [3].
Such a process is developed in the Kerogreen project. In this project, a container-sized pilot plant is being built, in which captured CO2, H2O, and renewable energy are converted to the target product kerosene [4]. One unit operation within the process chain comprises a compact sorption-enhanced water–gas shift (SEWGS) reactor. Here, purified CO from a plasma reactor is partly converted with steam to produce hydrogen. Two main targets are pursued in this process step:
1.
Providing synthesis gas (syngas) with a H2/CO ratio of approximately two for the subsequent Fischer–Tropsch synthesis.
2.
Removing the by-product CO2 and refeeding it to the plasma reactor.
In sorption-enhanced reactors, or, in other words, adsorptive reactors, a chemical reaction and an adsorptive separation of one product component are carried out simultaneously [5]. Simultaneous reaction and adsorption usually take place in fixed bed reactors filled with solid catalyst and sorbent material.
In our case of the SEWGS reactor, the exothermic water–gas shift reaction (WGS, Equation (1)) on a Cu-based catalyst is combined with in-situ adsorption of CO2 on a potassium-impregnated hydrotalcite sorbent (K-HTC). Many experimental studies have proven the feasibility of this technology [6,7,8]; a comprehensive overview is given in [9]. According to Le Chatelier’s principle, the selective removal of the product component CO2 (Equation (2)) shifts the reaction equilibrium towards the product side. Hence, higher yields of the desired product component H2 can be obtained, and the undesired product component CO2 can be recycled. Depending on prevailing operating conditions, H2O is also adsorbed on K-HTC (Equation (3)).
CO + H 2 O CO 2 + H 2 Δ H R = 41.2 k J mol 1
CO 2 + CO 2
H O 2 + H O 2
Due to its limited adsorption capacity, the sorbent gets saturated with adsorbate during the reactive adsorption phase and needs to be regenerated for further use. Regeneration can either be realized by temperature swing (temperature swing adsorption, TSA), pressure swing (pressure swing adsorption, PSA), or a combination thereof (PTSA) and is often stimulated by a concentration change (purge flow). The adsorption capacity of the sorbent is lowered by changing the prevailing process conditions: increasing the temperature or decreasing the pressure releases the adsorbate from the sorbent. To ensure continuous flow and concentration of product gas, several (at least two) parallel reactors must be operated in periodically switching modes: at least one in reactive adsorption mode and one (or more) in regeneration (desorption) mode [10]. Usually, the required regeneration time is longer than the time span of reactive adsorption. Hence, sorption-enhanced reactor systems consist of multiple (about six to nine) equivalent reactors [11], which are operated in periodically switching modes. Depending on the process concept, these modes may include for a PSA:
  • pressurization (feed: reactants);
  • reactive adsorption (feed: reactants);
  • depressurization (no feed, often purged);
  • regeneration (feed: purge gas).
A periodic reactive adsorption and regeneration cycle consists of a consecutive sequence of all relevant steps and is repeated continuously. To enhance performance and efficiency, ideal operating conditions for periodic cycles must be ensured.
Modeling and simulation techniques are precious tools to develop optimized process strategies. They aim to perform simulative parameter studies based on sorption-enhanced reactor models to gather deeper understanding of the interior states of the reactor system. Several approaches for reactive adsorption models were developed over the last years, and detailed studies on the intrinsic adsorption and reaction behavior are available for specific applications.
Sorption-enhanced processes are time- and space-dependent and can be described by a system of coupled partial differential equations (PDE). Although single PDEs might be solved analytically, numerical solvers are needed to compute coupled PDEs. Besides the complex and time-consuming development of a customised solving algorithm for a special problem, more general commercial numeric tools, such as built-in solvers in MATLAB (The MathWorks Inc., USA), COMSOL Multiphysics (COMSOL Inc., Sweden), or gPROMS (Siemens PSE, UK) are available for solving PDE systems. Furthermore, semi-discretization methods (Method-of-Lines, MoL) can be used to transform a PDE into a system of ordinary differential equations (ODE) [12], which can then be solved by well-established ODE solving algorithms. Table 1 gives a short overview of selected studies employing those methods for (reactive) adsorption processes.
Whereas most studies focus on the model description of simultaneous adsorption and reaction in one reactor, the dynamic modeling of multiple interconnected reactors has received less attention. Only few studies have investigated full-cycle behavior [15,16,18,23,24].
Najmi et al., for example, developed a multi-train SEWGS model that consists of eight parallel reactors [15]. They implemented a set of PDEs describing reactive adsorption, regeneration, and various PSA process cycle steps in gPROMS (axial discretization in 600 elements by centered finite difference method (CFDM), time integration by DASOLV solver) and created an operating schedule that switches the set of equations between reactive adsorption and desorption after defined cycle times.
Recently, van Kampen et al. presented an elaborated model study on the sorption-enhanced dimethyl-ether synthesis, in which they demonstrated a full-cycle design for a three column PTSA system [18]. The numerical solution was realized by means of spatial discretization according to MoL with 30 finite differences (FD) and time integration with MATLAB ode15s solver for pre-defined time spans of reactive adsorption/regeneration steps.
In this contribution, we apply a novel numerical solution approach that has not been described previously for dynamic sorption-enhanced reactor modeling. It is based on the graphical implementation of the ODE system obtained via MoL in the MATLAB Simulink programming environment. Simulink enables the implementation and analysis of the SEWGS reactor as a dynamic system. The cyclic process operation procedure is implemented with the Simulink add-on Stateflow. Stateflow is a tool to create state-machines and flow-charts in Simulink. With Simulink and Stateflow, the hybrid system consisting of parallel and periodically operated fixed beds and the discrete switches between different modes can be fully described.
With this model, switching times for reactive adsorption and regeneration no longer need to be predefined. Instead, they can be adjusted automatically during run time according to a defined threshold, e.g., the CO2 content in the reaction chamber outlet.

2. SEWGS Model

2.1. Model Development

A one-dimensional, time- and space resolved dynamic reactor model was developed to investigate numerical approaches and process configurations. The packed bed reactor dimensions and operating conditions were chosen in accordance with the pilot plant reactor in the Kerogreen project. This reactor consists of six individually fed reaction chambers embedded in one diffusion-bonded apparatus (Figure 1).
In cyclic operation, the chambers can be operated in parallel or in series: The outlet of one reaction chamber can be coupled with the inlet of the next reaction chamber for a serial configuration. Each reaction chamber consists of seven rectangular slits ( h =   4 mm , w =   50 mm , l =   300 mm ). The slits are filled with a homogeneous mixture of K-HTC and Cu/ZnO-Al2O3 catalyst particles. Due to the rather low adsorption capacity of K-HTC, the SEWGS reactor in the Kerogreen pilot plant employs a PSA concept with fast switching times for continuous H2 production. Contrary to concepts with large, thick vessels as reactor compartments, where severe back-mixing can occur, the slits are assumed to behave like ideal plug flow reactors.
The SEWGS reactor merges several elements of process intensification [25,26]. In terms of processing methods, it can be classified as a multi-functional reactor for dynamically operated reactive separation processes. In terms of equipment, the SEWGS reactor exhibits excellent heat transfer properties due to adjacent tempering micro-channels between the slits that basically form a micro heat-exchanger and enable isothermal operation conditions in the reaction chambers. Sending purge gas (N2 with steam) through the tempering channels prior to entering the chambers in desorption mode leads to a negligible temperature difference between adsorption and desorption slits. The model is based on the following assumptions and considerations:
  • Homogeneous distribution of uniformly sized catalyst and sorbent particles according to their weight fraction assumed as one phase
  • Uniform gas distribution in the reaction chambers
  • Isothermal conditions in the slits
  • Negligible pressure drop in the slits
  • Constant superficial velocity (which is only the case for sufficient dilution, [27])
  • No gradients rectangular to flow direction
  • Axial dispersion considered with axial dispersion coefficient
  • External mass transfer limitations neglected (Maers criterion)
  • Internal mass transfer limitations considered (Weisz–Prater criterion) and implemented with linear driving force (LDF) model (Glueckauf criterion)
  • WGS reaction [28] and simultaneous adsorption of CO2 and H2O on three different sorption sites (A: H2O only, B: CO2 only, C: H2O and CO2 comparatively) [29]
  • Equilibrium-based desorption of H2O and CO2.

2.2. Model Equations

The mole balances for species i = CO, H2O, CO2, H2, N2 in the bulk gas phase are given in Equation (4). A heterogeneous LDF approximation was used for intraparticle mass transfer limitations to account for the porous character of the particles.
ε b c i t = u c i z + ε b D ax , i 2 c i z 2 + 1 ε b k LDF , i c ¯ i c i
The required initial conditions are implemented according to the prevailing conditions in the reaction chambers before the switch (e.g., end of desorption mode before reactive adsorption) and the boundary conditions according to Equation (5) at the inlet (Dirichlet) and Equation (6) at the outlet (Neumann) of the reaction chambers. The initial conditions for the first reactive adsorption step result from a 2 h regeneration step to represent a fresh sorbent.
at z = 0 c i = c i , feed t > 0
at z = l c i z = 0 t > 0
The mole balances for species i = CO, H2O, CO2, H2, N2 in the particle void phase, where reaction and adsorption or desorption are assumed to take place on the solid surface, are given in Equation (7) for an axial dependent averaged particle concentration. The stoichiometric reaction coefficient ν i is 1 for the reactants (CO and H2O), 1 for the products (CO2, H2), and 0 for inert N2. The adsorption rates of H2O and CO2 are given in Equation (8) and Equation (9), respectively. Initial conditions are defined analogous to the bulk phase.
ε p c ¯ i t = ε p k LDF , i c i c ¯ i + w cat ρ ν i r WGS 1 w cat ρ a ads , i
a ads , H 2 O = q A , H 2 O t + q C , H 2 O t
a ads , CO 2 = q B , CO 2 t + q C , CO 2 t
The adsorption kinetics of adsorbate species H2O and CO2 on adsorption site A (H2O only), B (CO2 only), and C (H2O and CO2) of K-HTC sorbent are taken from Coenen et al. and are specified in Equation (10) (identical approach for q A , H 2 O ) and Equation (11) (identical approach for q C , H 2 O ), respectively [29]. The initial conditions are chosen according to the prevailing conditions in the reaction chambers before the switch.
q B , CO 2 t = k B , ads · q B , CO 2 eq q B , CO 2 with q B , CO 2 eq = k B · p CO 2 n B
q C , CO 2 t = k C , ads · p CO 2 m · q C , max q C , H 2 O q C , CO 2 + k C , rep 1 · q C , H 2 O · p CO 2 m k C , rep 2 · q C , CO 2 · p H 2 O m k C , des , CO 2 · q C , CO 2
The desorption of site A and B was modelled with an equilibrium-dependent desorption coefficient (Equation (12), identical approach for q A , H 2 O ). For site C, comparative replacement of CO2 by H2O takes place (Equation (11)). The heterogeneity of the surface is considered by a modified Elovich approach, shown for site B in Equation (13) (identical approach for site A and C) [29].
q B , CO 2 t = k B , des · q B , CO 2 eq q B , CO 2
k B , des = k B , des 1 · exp β B , des · q B , CO 2 q B , max R · T
The WGS reaction rate expression over a Cu/ZnO-Al2O3 catalyst is taken from Choi et al. and presented in Equation (14) [28]. The reaction equilibrium constant results from Equation (15) [30].
r WGS = k · exp E a R · T · p H 2 O · p CO p H 2 · p CO 2 K eq
K eq = exp 4577.8 T 4.33
The axial dispersion coefficient was determined with Equation (16) [19] with gas mixture diffusion coefficients from [31].
D ax , i = D mix , i · ε b + u · r p
The linear driving force approximation coefficients were calculated according to Equation (17) [32] with effective diffusion coefficients from [31].
k LDF , i = 15 · D eff , i r p 2

2.3. Model Parameters

For the comparison of numerical solution approaches, a base case was investigated. The operating conditions and parameters for this base case are listed in Table 2. An overview of the kinetic coefficients is given in Appendix A, Table A1.

3. Numerical Simulation Approaches

Three practical numerical simulation approaches for solving the SEWGS model are presented in the following sections. The simulations were performed on one core of the multi core processor Intel(R) Core(TM) i7-6700HQ CPU @ 2.60 GHz, with 8 GB of installed RAM memory using MATLAB version R2020b, 64-bit.

3.1. Built-In Solver

The system of coupled PDEs was solved with MATLAB’s built-in solver pdepe for parabolic and elliptic PDEs in one dimension. This solver solves initial-boundary value problems in the form of Equation (18) with two independent variables: one spatial variable and time. The coefficients of Equation (18) have to be provided in the function handle pdefun, whereas initial and boundary conditions are specified in icfun and bcfun. The boundary conditions must be coded according to Equation (19) [33]. At least one PDE must be parabolic. Therefore, the axial dispersion term in Equation (4) is required for the applicability of pdepe and the proper definition of boundary conditions.
c * z , t , v , v z v t = z m * z z m * f * z , t , v , v z + s * z , t , v , v z
p * ( z , t , v ) + q * ( z , t ) f * z , t , v , v z = 0
The pdepe solver transforms the system of PDEs into a system of ODEs by means of spatial discretization with a piecewise Petrov–Galerkin method on a set of user-defined nodes (xmesh) [34]. The resulting ODE system is integrated in time with the built-in solver ode15s for stiff differential algebraic equations (DAEs). DAEs arise from elliptic equations in the PDE system. The variable time step integration of ode15s delivers the numerical solution at specified points of time, defined in tspan. With this procedure, both time step and computing formula are adapted dynamically to obtain high accuracy in short computational time [35]. The pdepe solver provides a user-friendly implementation and is capable of solving nonlinear and coupled equations reliably for suitably defined meshes [36].

3.2. Method-of-Lines (MoL)

Another approach for solving coupled PDE systems is the MoL, a semi-discretization method [12]. Spatial derivatives in the PDEs are substituted by algebraic approximations to obtain a set of ODEs that can be solved with well-established solving algorithms. Here, spatial discretization is realized on a uniform grid in an axial direction (z-direction) with FD. For the first-order convective terms, a backward FD is used (Equation (20)), and for the second-order dispersion terms, implicit central differences are defined (Equation (21)). The resulting error O is neglected. The MoL resembles a CSTR cascade: with decreasing length of Δ z , the number of cells N in the cascade increases and the error diminishes.
v z v n v n 1 Δ z + O ( Δ z ) with n = 1 , , N
2 v z 2 v n + 1 2 v n + v n 1 Δ z 2 + O ( Δ z 2 ) with n = 1 , , N 1
The boundary conditions are implemented as differential equations on the first node ( n = 0 , Dirichlet), and on the last node ( n = N , Neumann), analogous to Equation (5) and Equation (6) (method of false boundaries).
The obtained ODE system of N + 1 equations is numerically solved in time with MATLAB’s ode15s for best comparability with the pdepe results. This variable-step, variable-order solver is based on numerical differentiation formulas and is recommended for stiff problems and DAEs. A convergence analysis with up to 250 cells is performed to examine the adequacy of the spatial discretization.

3.3. Simulink

Simulink is a graphical programming environment used for modeling, simulation, and analysis of dynamical systems that is based on MATLAB [37].

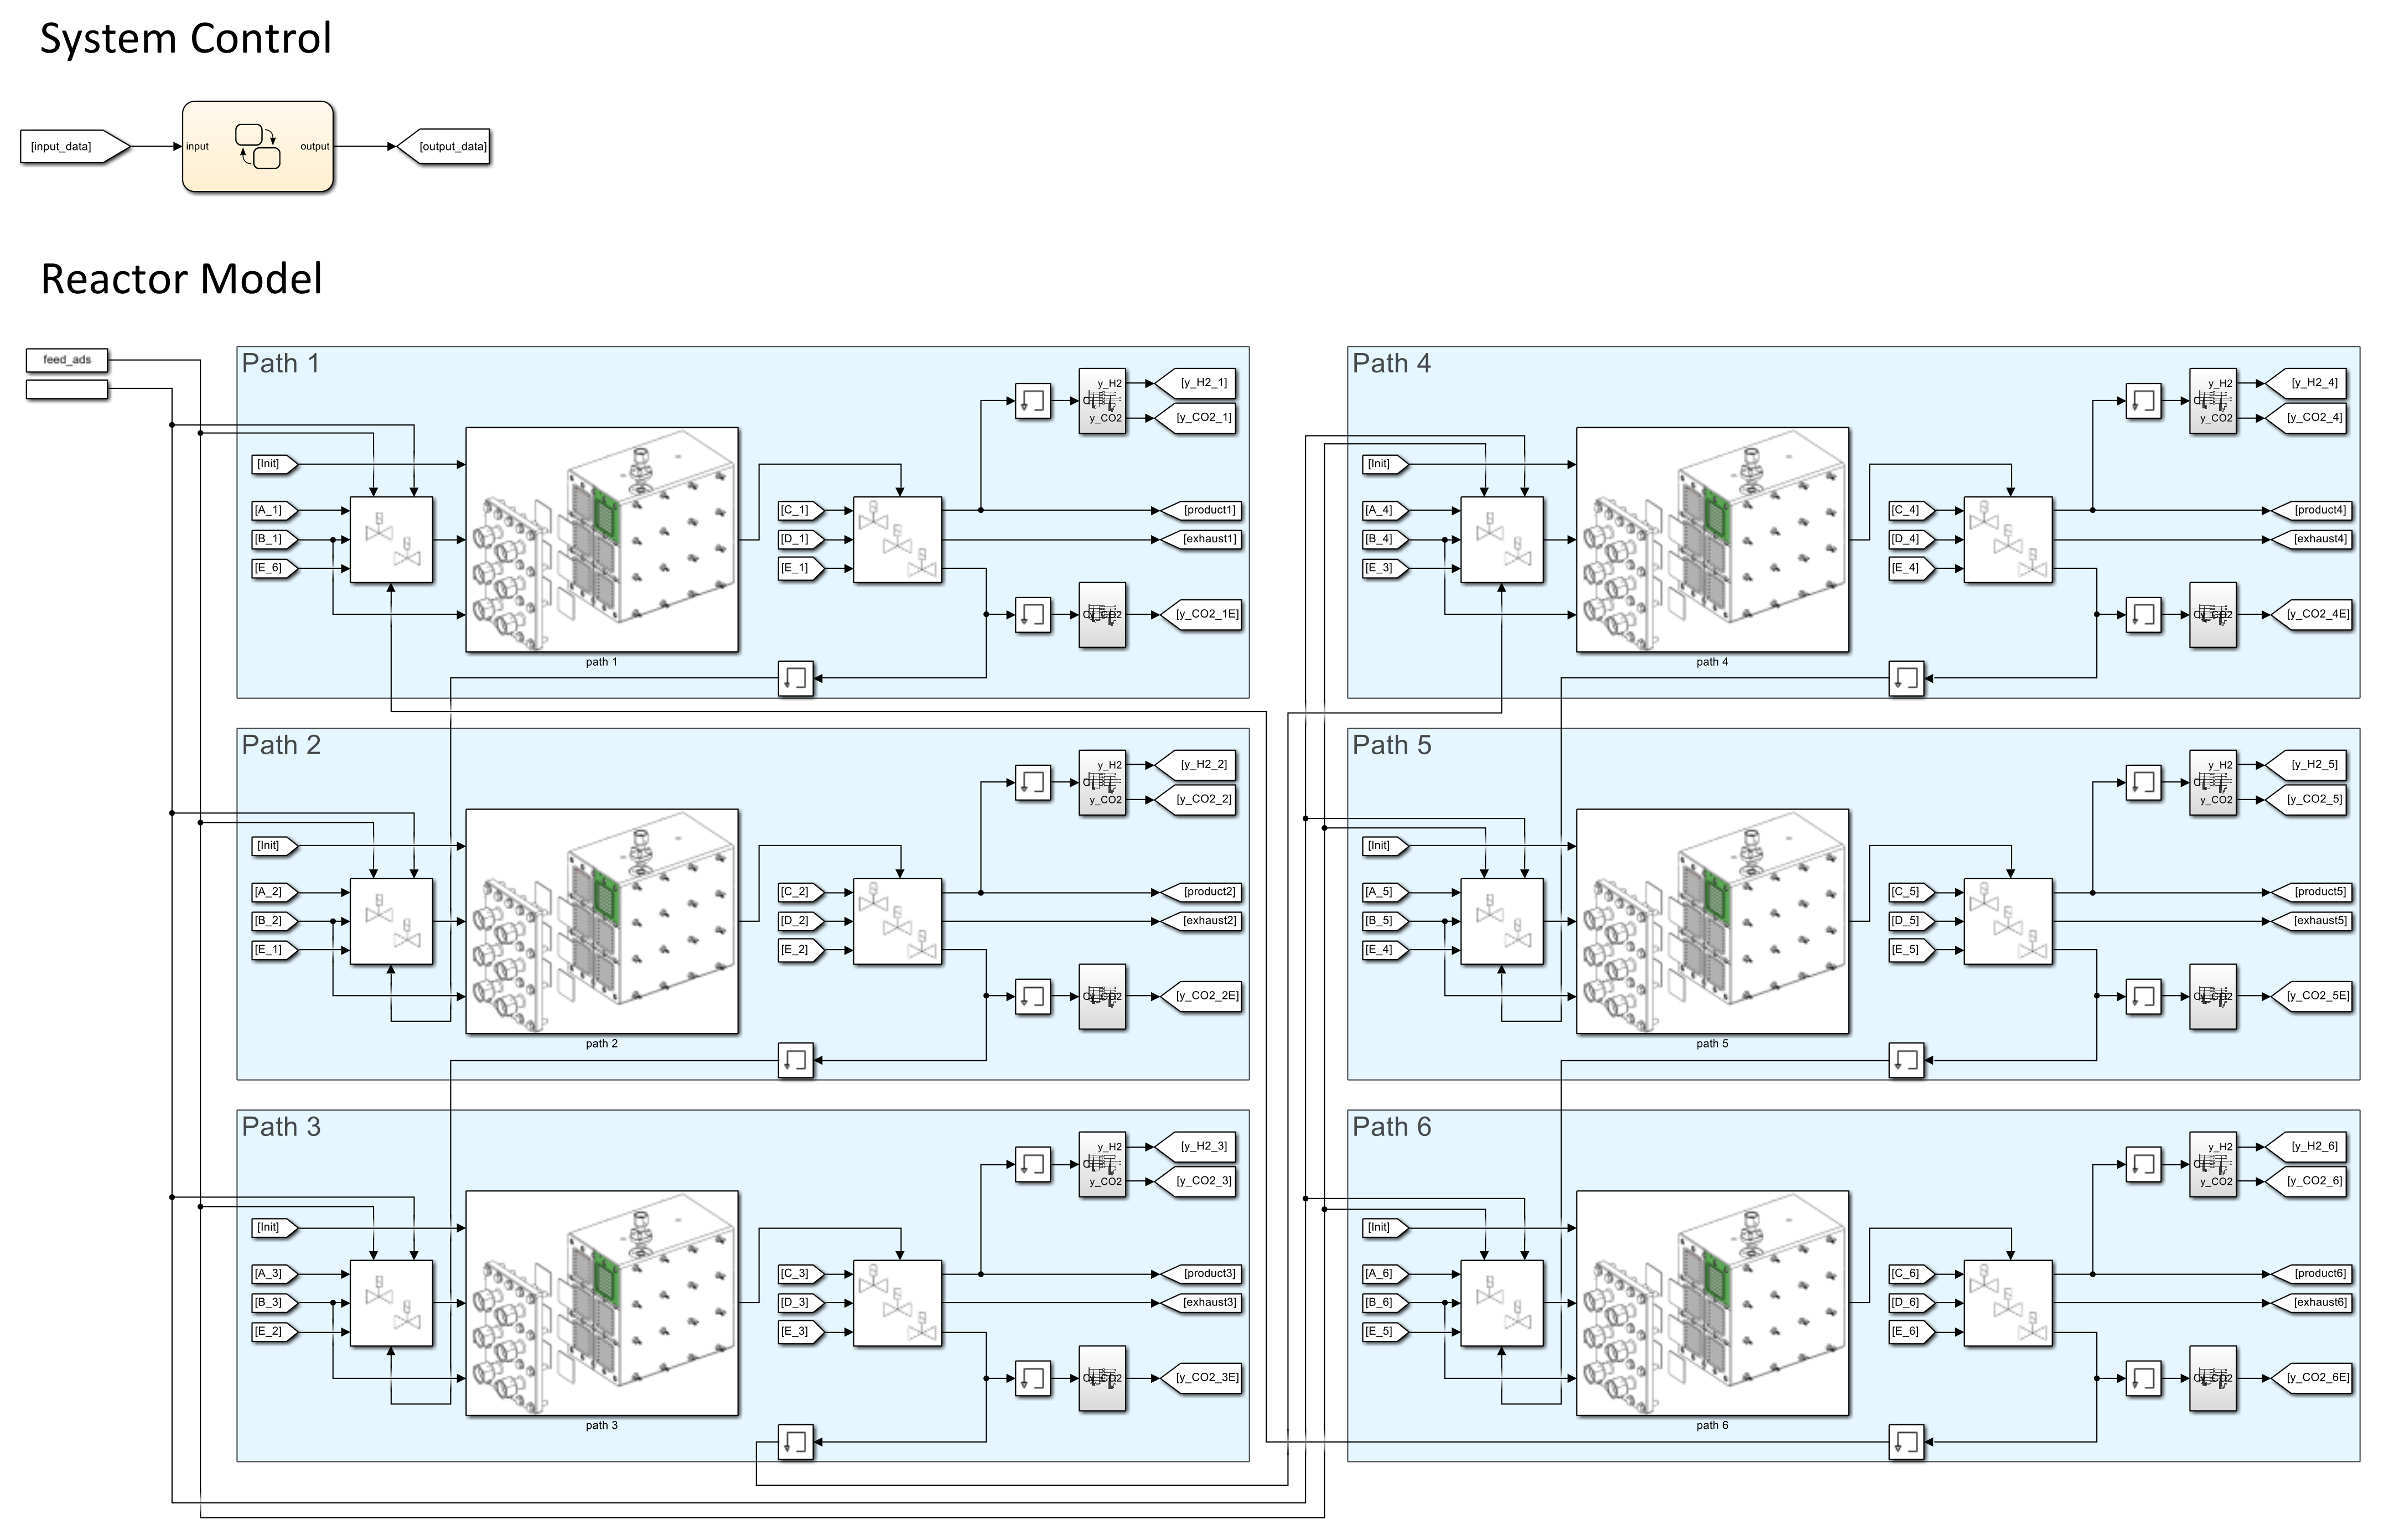
3.3.1. Model Implementation and Data Structure

In the third approach presented in this paper, the model equations are implemented in Simulink based on the idea of the MoL. In Simulink, the model is constructed in hierarchical block diagrams in the graphical editor, where libraries of predefined blocks of elementary model components for continuous-time and discrete-time systems are available [37]. Those blocks are connected with signal lines to visually build the model.
The SEWGS model equations are discretized in space to obtain ODEs for N cells, as described in Section 3.2. The ODEs are implemented in a block diagram as shown in Figure 2 for the bulk concentration of CO [38]. Fourteen ODEs are needed to describe one cell (Figure 2). All ODEs of one cell have to be evaluated as a time-dependent single unit. Therefore, they are classified as one atomic subsystem. For simplified programming, the cell subsystem is stored in a separate file to be used multiple times as a referenced subsystem in the main model file, the so-called parent model. Ten subsequent cells are arranged in a group subsystem to enable easy scale-up and data storage. A reaction chamber comprises the desired number of groups in a cascade, as shown in Figure 2 for N = 50 .
The integrator block (marked in yellow in Figure 2) provides the selected solver (Section 3.3.2) with an initial condition that is used to compute the block’s initial state at the start of the simulation and outputs the value of the integral of its time-dependent input signal at every time step.
A comprehensive bus object structure had to be developed for user-friendly and reliable data access. Simulink bus objects are equivalent to a structure definition in C. All relevant data belonging to one cell are stored together in one cell bus object. Ten cells are grouped in a superordinated group bus object. The desired number of groups form the whole reaction chamber and are contained in a chamber bus object. Each data point in every cell can easily be accessed via dot notation: e.g., the CO2 concentration leaving the 25th cell is addressed as N20.N05.CCO2. This structure simplifies data handling enormously, compared to the methods presented in Section 3.1 and Section 3.2, where the overall time- and space dependent solution is contained in one voluminous matrix.

3.3.2. Solver Selection

The solver choice depends on the dynamics of the system, the solution stability, the solver robustness, and especially the computation speed when solving complex systems [39]. The different solvers suggested by the MATLAB solver library for ODEs were tested for the SEWGS model, with the aim to solve the model successfully within specified tolerance limits and in a reasonable duration. Figure 3 shows the required computation time for appropriate solvers depending on the implemented number of cells for the base case: reactive adsorption in one reaction chamber. Computation times below 0 indicate that a simulation did not converge, and a smaller error tolerance was required. With solver ode23t, the computation time was reduced by almost half compared to the commonly used solver ode15s with sufficient precision (relative error tolerance of 10 3 ). This solver is used to speed-up all Simulink simulations presented in this paper.

3.3.3. Cyclic Process Design

A complex model, consisting of six parallel reaction chambers, is developed for continuous H2 production. The automated switching logic from reactive adsorption to regeneration mode is realized with a finite-state-machine implemented in the Simulink tool Stateflow. Stateflow enables mode logic, fault management, and task scheduling in discrete or hybrid systems. A Stateflow machine contains Stateflow charts with objects such as states, events, transitions, etc. [40].
For the implemented periodic process, the valve positions (corresponding to the real plant) for either reactive adsorption or regeneration are triggered after an initialization step in all chambers by the Stateflow machine. One reaction chamber starts in reactive adsorption mode, while the other chambers are in regeneration mode. As soon as a specified event triggers the Stateflow machine, such as reaching a threshold concentration in the outlet flow or a predefined time span, the valve positions are changed in a way that the next reaction chamber starts its reactive adsorption period. A graphical overview of the SEWGS Simulink model is given in Figure 4.
In this paper, the dynamic adaptation of switching times depending on the CO2 content in the reaction chamber outlet is investigated for a partly serial reaction chamber configuration.

4. Results and Discussion

In the following sections, the simulation results for reactive adsorption in one reaction chamber are compared for three numerical approaches. Furthermore, the cyclic process design for the SEWGS reactor consisting of six reaction chambers is presented.

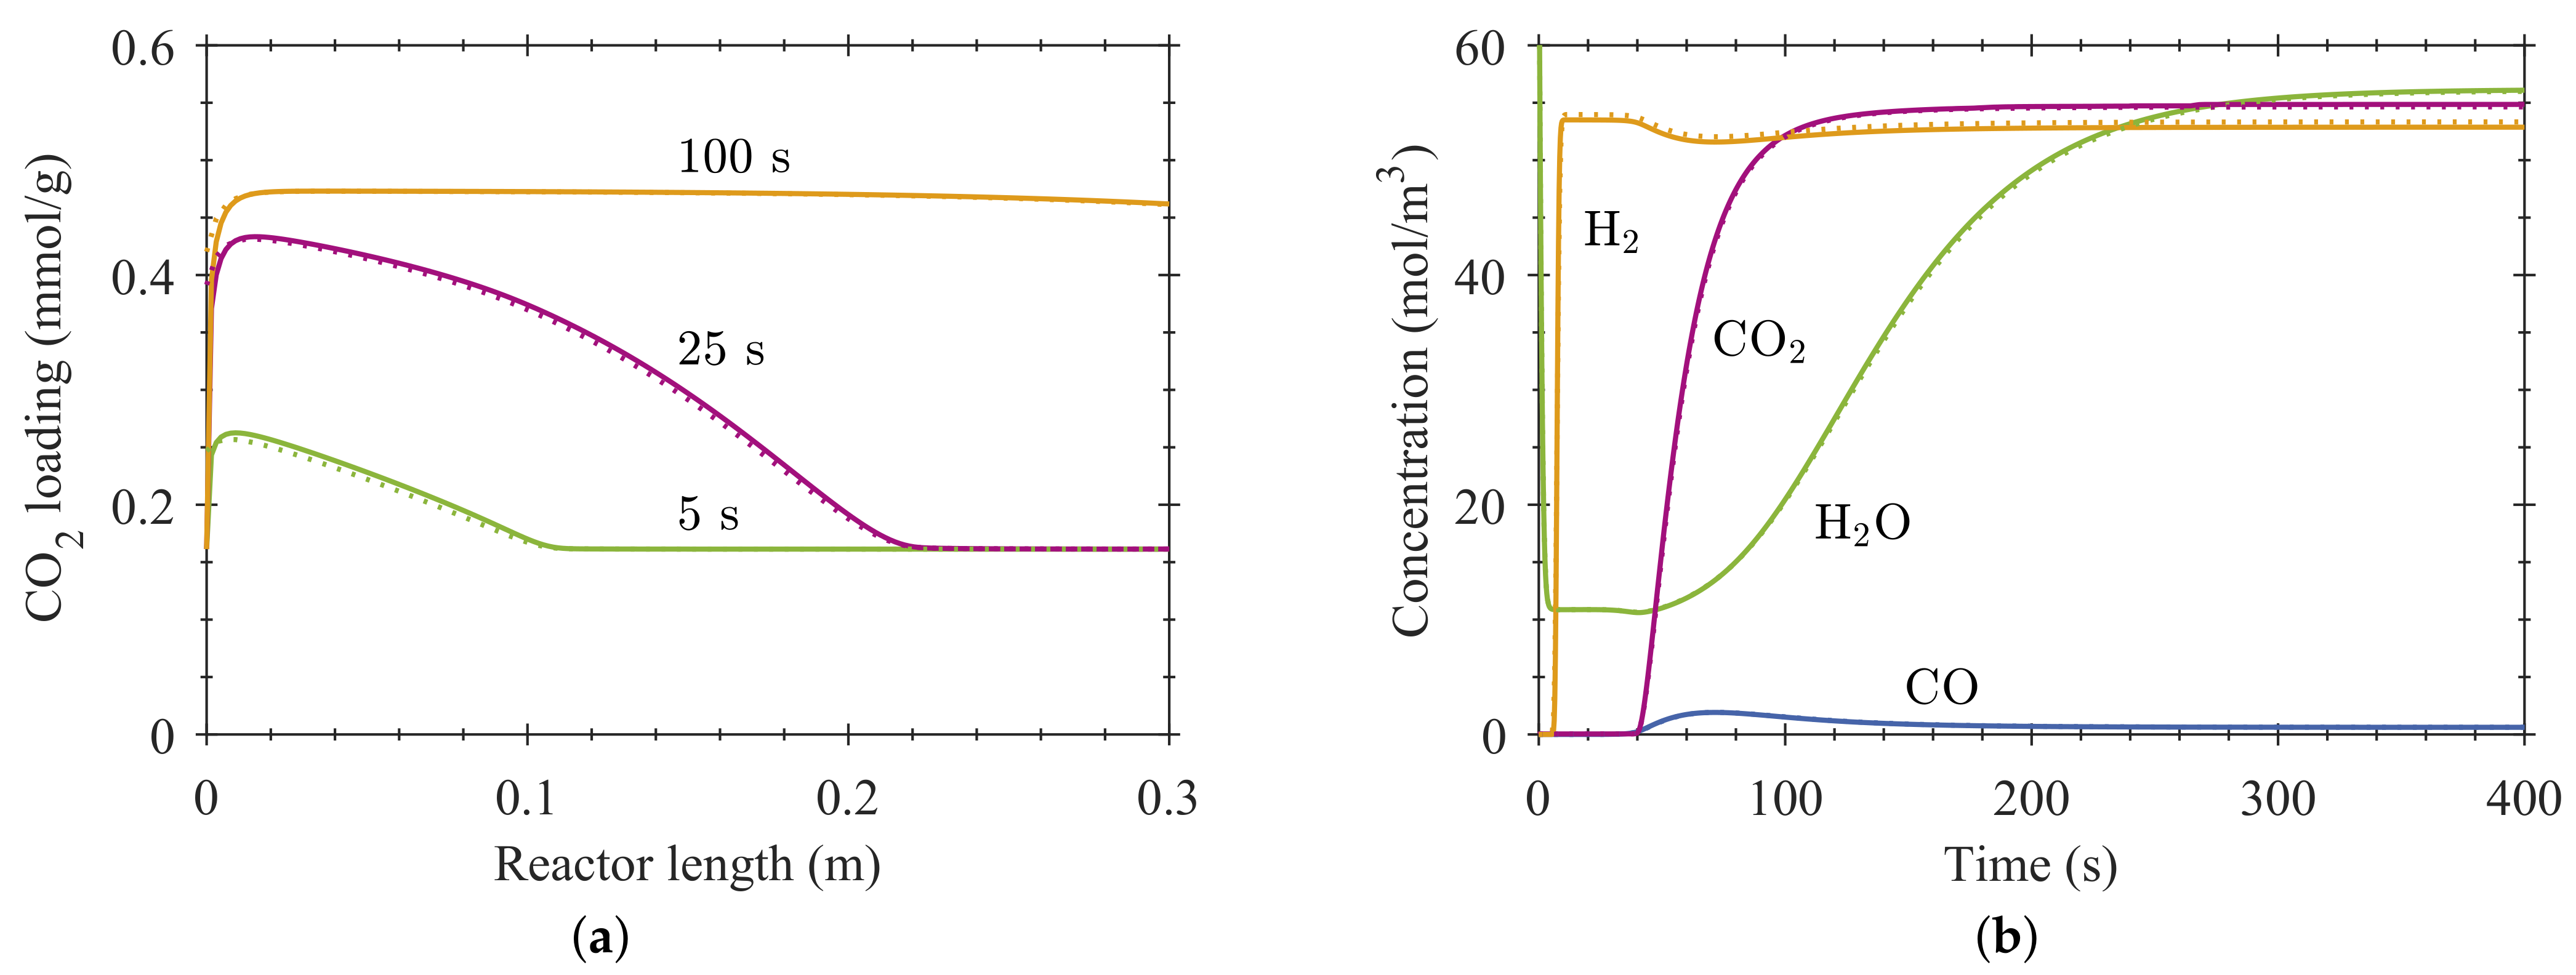
4.1. Reactive Adsorption
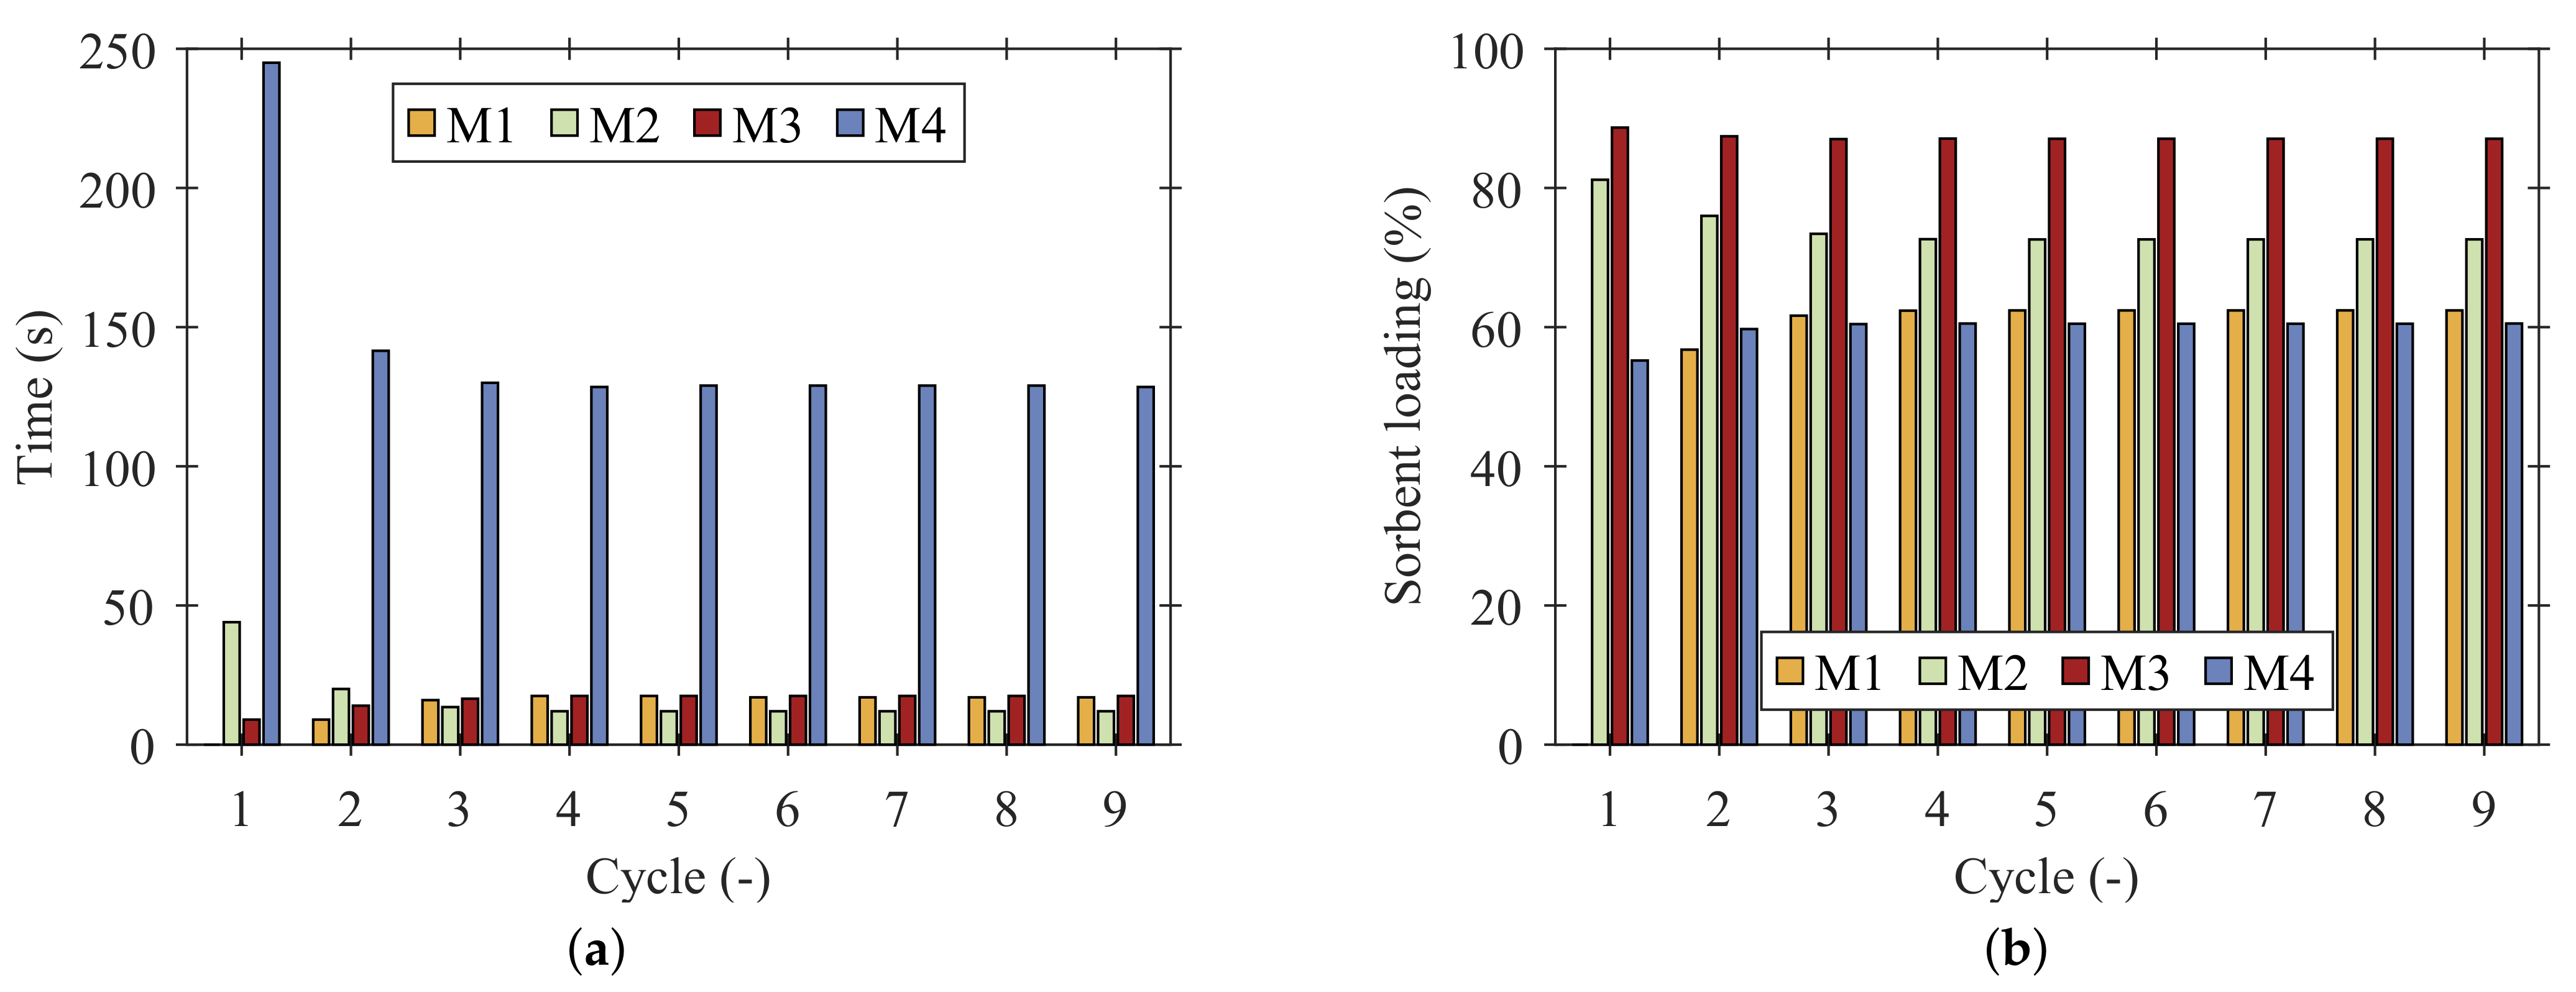
The accuracy of the MoL simulations depends primarily on the adequacy of the grid discretization. In Figure 5a, the sorbent loading with CO2 over the reactor length is shown for 10 to 250 cells at t = 25   s . The curves exhibit steep steps for simulations with few cells, and the smoothness increases significantly for N > 100 . The grid (in)dependence is depicted in Figure 5b. For N > 100 , the deviation from N = 250 is less than 5%, except for the initial conditions in the differently sized first cell.
The required computation time increased almost exponentially with the number of cells (see Appendix A, Table A2). Therefore, a trade-off between accuracy and computation time must be made, and N = 100 was chosen for the following MoL simulations.
The pdepe simulations have proven to be extremely sensitive to initial conditions. A sufficiently high number of mesh points in time and space needs to be chosen to ensure numerical stability and to avoid oscillations. The computation time for pdepe was significantly lower compared to MoL simulations with a comparable number of mesh points due to pdepe’s run-time optimization (see Appendix A, Table A2). For both methods, MoL and pdepe, convergence could be reached with appropriate mesh settings.
In the base case, the CO2 loading of the sorbent over the reactor length increases with time until it reaches full saturation after approximately 100 s (Figure 6a). At the same time, the CO2 concentration at the reactor outlet approaches its steady-state value (Figure 6b). The defined breakthrough (CO2 volume fraction in the product > 0.05) of CO2 at the reactor outlet can be noticed after approximately 40 s . Prior to that point, CO is fully converted in excess of H2O in the feed, and the produced CO2 is adsorbed completely.
In order to access the conservation properties of the numerical solution algorithms, the deviation from the molar balance depending on time and space was calculated (see Appendix A, Figure A1). Both methods, pdepe and MoL, exhibit only minor deviations from a closed molar balance (< 2%). The deviation is more pronounced for pdepe close to the reactor inlet at t < 50 s . For MoL, the deviation emerges for a longer period of time at the reactor outlet. In both cases, it approaches zero as soon as steady-state conditions are reached. The deviations were attributed to the adsorption process and could—especially for undiluted feeds—possibly be improved by taking into account prevailing velocity changes, as suggested by DiGiuliano et al. [27].
After having shown that both approaches, pdepe as well as simple uniform semi-discretization with MoL, lead to satisfying results for the SEWGS simulation, the MoL results were compared with the corresponding Simulink results for N = 100 . As expected, hardly any deviation between the curves of the two methods can be distinguished (Figure 7). Therefore, it was concluded that the graphical approach in Simulink performs with sufficient precision and reliability and can be expanded to a more complex hybrid process model.

4.2. Process Design

The hybrid Simulink Stateflow model consisting of six reaction chambers, switching opportunities (valves), and process control (Stateflow machine) (Figure 4) is used to simulate cyclic SEWGS process operation. An interconnected reaction chamber configuration was investigated for optimized sorbent usage (Figure 8): chamber 1 starts in reactive adsorption mode (M2) with fresh feed (CO + H2O) and produces CO2-free WGS product, whereas all other chambers are in regeneration mode (M4). The regeneration feed consists of N2 and H2O to increase CO2 desorption from both sorption sites (B and C). As soon as the sorbent in chamber 1 is no longer capable of adsorbing all produced CO2 and the gas flow leaving chamber 1 reaches a CO2 volume fraction of 5%, a switch to M3 is triggered. In M3, the gas flow leaving chamber 1 is fed into chamber 2, which is then in M1. While the sorbent loading in chamber 1 is still increasing, CO2-free WGS product is produced in chamber 2. Chamber 1 switches from M3 to M4 when a threshold of 20% CO2 volume fraction is reached. The cycle then continues in chamber 2 with M2.
A typical operation scheme is depicted in Figure 9a for the first 900 s for all chambers. According to the operational concept, the interconnected chambers in M1 and M3 are dependent on each other. The resulting time span for M4 is the limiting factor for the sorbent regeneration. As always one chamber is either in M1 or M2, a constant product gas flow is ensured, and a nearly CO2-free product flow leaves the reactor. Figure 9b shows the H2 volume fraction in the product flow of the total reactor (six chambers) and of chamber 1. The H2 volume fraction approaches a constant value of about 0.62 after the first cycle; the rest of the product gas flow consists of inert N2 and unreacted H2O.
The time span in which a chamber stays in each mode and the resulting sorbent loading at the end of each mode as a function of the cycle number is shown for chamber 1 in Figure 10. The relative sorbent loading refers to the maximum loading after 400 s reactive adsorption. A significant reduction of the cycle time span by almost 50% is visible after the first cycle. Due to the limited regeneration time, the initial time span of reactive adsorption can no longer be reached in subsequent cycles, as the sorbent cannot be fully regenerated. After the third cycle, the time spans for the different modes as well as the relative sorbent loadings approach constant values. Hence, the overall system is operating in steady-state. The interconnection of two subsequent chambers in M3 and M1 allows for an increased sorbent usage from 72.6% (at the end of M2) to 87.1% (at the end of M3) for the prevailing process conditions, while maintaining the CO2 volume fraction in the product flow below 5%.
These results show the feasibility of the novel Matlab Simulink Stateflow implementation of the SEWGS model for process optimization. Using a Simulink implementation for a chemical reactor and utilizing Stateflow simplifies the following: simulation-driven development of operating procedures, performance evaluation of larger and more complex systems, and safe failure management. These advantages enable rapid prototyping with MATLAB code generation into programming language for automation systems (PLC) [41] and could thus simplify real plant operation.

5. Conclusions

A dynamically operated compact SEWGS reactor was modelled to optimize its operation procedure. The reactor consists of six identical reaction chambers, which are operated in cycles of reactive adsorption and desorption. The model contains coupled PDEs and is based on kinetic expressions for adsorption, reaction, and desorption.
A novel simulation approach for time- and space-dependent cyclic reactor operation was presented. This approach enables automated adjustment of switching times during run-time according to specified conditions, such as exceeding a threshold of CO2 concentration in the product stream. For that reason, switching times do not need to be pre-defined and can be optimized dynamically.
First, the applicability of the novel method was verified by comparison with existing and well-established methods for reactive adsorption in one reaction chamber. Therefore, a base case simulation was implemented and solved with MATLAB’s pdepe solver. These results were compared with those obtained via MoL (spatial discretization with FD and ODE system solution with MATLAB’s ode15s solver) to determine the required number of spatial discretization cells and to justify the discretization scheme.
Then, the MoL equations were implemented graphically in MATLAB Simulink. Only minor deviations between the results of all methods verify the discretization and suggest the reliability of the MoL implementation in Simulink.
Finally, the basic model was expanded to a complex model distinguishing between initialization, reactive adsorption, and regeneration modes. A comprehensive data structure for reliable data handling was established. A Stateflow machine was designed to simulate automated cyclic switching between six reaction chambers for continuous synthesis gas production. Overall process modeling included a configuration of subsequent interconnected reactor chambers for optimized sorbent usage, while the CO2 volume fraction in the product flow could still be kept below 5%. Due to automated switching between interconnected reaction chambers, an increase of sorbent usage from 72.6% to 87.1% could be elaborated in the presented case.
This case study has shown that carefully chosen operating parameters and process configurations together with simulation-driven process design can significantly enhance the exploitation of the full sorption capacity and therefore increase the efficiency of sorption-enhanced reaction processes. The novel simulation approach can serve as a practical example for dynamic reactor modeling.

Author Contributions

Conceptualization, T.J.S., methodology, T.J.S.; software, T.J.S., J.-H.K., and S.D.; validation, T.J.S., formal analysis, T.J.S., investigation, T.J.S., resources, T.J.S., data curation, T.J.S., writing—original draft preparation, T.J.S., writing—review and editing, T.J.S. and P.P.; visualization, T.J.S., supervision, P.P.; project administration, P.P.; funding acquisition, P.P. All authors have read and agreed to the published version of the manuscript.

Funding

The work presented in this paper is part of the European project Kerogreen, which has received funding from the European Union’s Horizon 2020 research and innovation programme under grant agreement no. 763909.

Conflicts of Interest

The authors declare no conflict of interest.

Abbreviations

The following abbreviations are used in this manuscript:
BFDMBackward finite difference method of first order
CFDMCentered finite difference method of second order
Ch.Chamber
CSTRContinuously stirred tank reactor
DAEDifferential algebraic equation
DASOLVImplicit backward differentiation formula solver in gPROMS
DMESDimethyl ether synthesis
FDFinite Difference
FEMFinite elements method
K-HTCK2CO3-promoted hydrotalcite
LDFLinear driving force model
M1-M4Mode 1-4
MoLMethod-of-lines
ODEOrdinary differential equation
ode15sSolver for stiff ODEs in MATLAB
PDEpartial differential equation
pdepeSolver for systems of parabolic and elliptic PDEs in MATLAB
PLCProgrammable logic controller
PSAPressure swing adsorption
PTSAPressure temperature swing adsorption
SEWGSSorption-enhanced water–gas shift
SMRSteam-methane reforming
TSATemperature swing adsorption
WGSWater–gas shift
The following symbols are used in this manuscript:
β j , des , ( i ) activation energy change( J   mol 1 )
ε b bed void fraction(–)
ε p particle void fraction(–)
ν i stoichiometric reaction coefficient(–)
ρ bulk density( k   g   m 3 )
a ads , i adsorption rate( mol     kg 1 s 1 )
c * pdepe diagonal matric(–)
c i bulk phase concentration( mol   m 3 )
c ¯ i particle void phase concentration( mol   m 3 )
D ax , i axial dispersion coefficient( m 2   s 1 )
D eff , i effective diffusion coefficient( m 2   s 1 )
D mix , i gas mixture diffusion coefficient( m 2   s 1 )
E a activation energy( J mol 1 )
e q equilibrium(–)
f * pdepe flux term coefficient(–)
F STP volumetric flow rate at STP( m l     min 1 )
hslit height(mm)
Δ H R standard reaction enthalpy( k J mol 1 )
ispecies CO, H2O, CO2, H2, N2(–)
jsorption site A, B, C(–)
k C , rep 1 exchange rate coefficient 1( bar 1 s 1 )
k C , rep 2 exchange rate coefficient 2( bar 1 s 1 )
K eq equilibrium constant(–)
k j Freundlich adsorption coefficient( mol   kg 1 bar 1 )
k j , ads adsorption coefficient( s 1 )
k j , des , ( i ) desorption coefficient( s 1 )
k j , des , ( i ) 1 desorption coefficient( s 1 )
k LDF , i linear driving force coefficient( s 1 )
k frequency factor( mol bar 2 g 1 h 1 )
lslit length(mm)
m tiny value exponent(–)
m * pdepe symmetry constant(–)
nindex variable(–)
Nnumber of cells(–)
n j Freundlich adsorption intensity(–)
Oapproximation error(–)
p * pdepe boundary coefficient(–)
p ( i ) (partial) pressure(bar)
q * pdepe boundary coefficient(–)
q j , i sorbent loading of species i on site j( mol   kg 1 )
r p particle radius(m)
r WGS WGS reaction rate( mol   kg 1 s 1 )
Rgas constant( J   mol 1 K 1 )
s * pdepe source term coefficient(–)
ttime( s )
Ttemperature( K )
ugas velocity( m   s 1 )
vdependent variable(–)
wslit width(mm)
w cat catalyst weight fraction(–)
y i volume fraction(–)
zaxial coordinate( m )

Appendix A

Table A1. Kinetic coefficients. Adapted from [28,29].
Adsorption / Desorption
k A , ads 4.18 × 10 2 s 1
k A 1.69   mol   kg 1   bar 1
n A 0.235
k A , des 1 7.84 × 10 9 s 1
β A , des 1.72 × 10 5 J mol 1
k B , ads 9.29 × 10 2 s 1
k B 0.31   mol   kg 1   bar 1
n B 0.239
k B , des 1 4.41 × 10 5 s 1
β B , des 6.27 × 10 4 J mol 1
k C , ads 0.1 bar 1 s 1
k C , rep 1 5.0 × 10 3 bar 1 s 1
k C , rep 2 1.4 × 10 2 bar 1 s 1
k C , des , H 2 O 1 5.23 × 10 11 s 1
k C , des , C O 2 1 2.06 × 10 10 s 1
β C , des , H 2 O 5.41 × 10 4 J mol 1
β C , des , C O 2 5.00 × 10 4 J mol 1
m 1 × 10 16
WGS Reaction
k 2.96 × 10 5 mol   bar 1 g 1 h 1
E a 47.400 J mol 1
Table A2. Computation time for pdepe and MoL simulations for reactive adsorption in one reaction chamber.
MoLpdepe
Number of Cells1030501002002503000
(-)
Computation Time0.040.220.274.9646.8190.9312.19
(min)
Figure A1. Time and space-dependent deviation from molar balance for reactive adsorption in one reaction chamber: (a) pdepe, and (b) MoL ( N = 100 ) simulation results.
Processes 10 01160 g0a1

References

  1. UN. COP26 Outcomes. In Proceedings of the UN Climate Change Conference at the SEC, Glasgow, UK, 31 October–13 November 2021. [Google Scholar]
  2. United Nations. Framework Convention on Climate Change. Adoption of the Paris Agreement. In Proceedings of the 21st Conference of the Parties, Paris, France, 30 November–11 December 2015. [Google Scholar]
  3. European Commission. A European Strategy for Low-Emission Mobility; EEA: Copenhagen, Denmark, 2020. [Google Scholar]
  4. Goede, A.P.H. CO2 neutral fuels. EPJ Web Conf. 2018, 189, 00010. [Google Scholar] [CrossRef] [Green Version]
  5. Rodrigues, A.E.; Madeira, L.M.; Wu, Y.J.; Faria, R. Sorption enhanced reaction processes. In Sustainable Chemistry Series; World Scientific: New Jersey, NJ, USA, 2018; Volume 1. [Google Scholar]
  6. Lee, C.H.; Lee, K.B. Application of one-body hybrid solid pellets to sorption-enhanced water gas shift reaction for high-purity hydrogen production. Int. J. Hydrogen Energy 2014, 39, 18128–18134. [Google Scholar] [CrossRef]
  7. Soria, M.A.; Rocha, C.; Tosti, S.; Mendes, A.; Madeira, L.M. COx free hydrogen production through water-gas shift reaction in different hybrid multifunctional reactors. Chem. Eng. J. 2019, 356, 727–736. [Google Scholar] [CrossRef]
  8. Stadler, T.J.; Barbig, P.; Kiehl, J.; Schulz, R.; Klövekorn, T.; Pfeifer, P. Sorption-Enhanced Water-Gas Shift Reaction for Synthesis Gas Production from Pure CO: Investigation of Sorption Parameters and Reactor Configurations. Energies 2021, 14, 355. [Google Scholar] [CrossRef]
  9. Zhu, X.; Li, S.; Shi, Y.; Cai, N. Recent advances in elevated-temperature pressure swing adsorption for carbon capture and hydrogen production. Prog. Energy Combust. Sci. 2019, 75, 100784. [Google Scholar] [CrossRef]
  10. Harrison, D.P. Sorption-Enhanced Hydrogen Production: A Review. Ind. Eng. Chem. Res. 2008, 47, 6486–6501. [Google Scholar] [CrossRef]
  11. Gazzani, M.; Macchi, E.; Manzolini, G. CO2 capture in integrated gasification combined cycle with SEWGS—Part A: Thermodynamic performances. Fuel 2013, 105, 206–219. [Google Scholar] [CrossRef]
  12. Schiesser, W.E. A Compendium of Partial Differential Equation Models: Method of Lines Analysis with MATLAB; Cambridge University Press: Cambridge, UK, 2009. [Google Scholar]
  13. Lee, K.B.; Verdooren, A.; Caram, H.S.; Sircar, S. Chemisorption of carbon dioxide on potassium-carbonate-promoted hydrotalcite. J. Colloid Interface Sci. 2007, 308, 30–39. [Google Scholar] [CrossRef]
  14. Reijers, H.T.J.; Boon, J.; Elzinga, G.D.; Cobden, P.D.; Haije, W.G.; van den Brink, R.W. Modeling Study of the Sorption-Enhanced Reaction Process for CO2 Capture. I. Model Development and Validation. Ind. Eng. Chem. Res. 2009, 48, 6966–6974. [Google Scholar] [CrossRef] [Green Version]
  15. Najmi, B.; Bolland, O.; Colombo, K.E. A systematic approach to the modeling and simulation of a Sorption Enhanced Water Gas Shift (SEWGS) process for CO2 capture. Sep. Purif. Technol. 2016, 157, 80–92. [Google Scholar] [CrossRef]
  16. Karagöz, S.; Tsotsis, T.T.; Manousiouthakis, V.I. Multi-scale modeling and simulation of a novel membrane reactor (MR)/adsorptive reactor (AR) process. Chem. Eng. Process. Process. Intensif. 2019, 137, 148–158. [Google Scholar] [CrossRef]
  17. Di Giuliano, A.; Gallucci, K.; Giancaterino, F.; Courson, C.; Foscolo, P.U. Multicycle sorption enhanced steam methane reforming with different sorbent regeneration conditions: Experimental and modelling study. Chem. Eng. J. 2019, 377, 119874. [Google Scholar] [CrossRef]
  18. Van Kampen, J.; Boon, J.; Vente, J.; van Sint Annaland, M. Sorption enhanced dimethyl ether synthesis for high efficiency carbon conversion: Modelling and cycle design. J. CO2 Util. 2020, 37, 295–308. [Google Scholar] [CrossRef]
  19. Guffanti, S.; Visconti, C.G.; van Kampen, J.; Boon, J.; Groppi, G. Reactor modelling and design for sorption enhanced dimethyl ether synthesis. Chem. Eng. J. 2021, 404, 126573. [Google Scholar] [CrossRef]
  20. Guffanti, S.; Visconti, C.G.; Groppi, G. Model Analysis of the Role of Kinetics, Adsorption Capacity, and Heat and Mass Transfer Effects in Sorption Enhanced Dimethyl Ether Synthesis. Ind. Eng. Chem. Res. 2021, 60, 6767–6783. [Google Scholar] [CrossRef]
  21. Jang, H.M.; Lee, K.B.; Caram, H.S.; Sircar, S. High-purity hydrogen production through sorption enhanced water gas shift reaction using K2CO3-promoted hydrotalcite. Chem. Eng. Sci. 2012, 73, 431–438. [Google Scholar] [CrossRef]
  22. Aloisi, I.; Di Giuliano, A.; Di Carlo, A.; Foscolo, P.U.; Courson, C.; Gallucci, K. Sorption enhanced catalytic Steam Methane Reforming: Experimental data and simulations describing the behaviour of bi-functional particles. Chem. Eng. J. 2017, 314, 570–582. [Google Scholar] [CrossRef]
  23. Zheng, Y.; Shi, Y.; Li, S.; Yang, Y.; Cai, N. Elevated temperature hydrogen/carbon dioxide separation process simulation by integrating elementary reaction model of hydrotalcite adsorbent. Int. J. Hydrogen Energy 2014, 39, 3771–3779. [Google Scholar] [CrossRef]
  24. Boon, J.; Cobden, P.D.; van Dijk, H.; van Sint Annaland, M. High-temperature pressure swing adsorption cycle design for sorption-enhanced water—Gas shift. Chem. Eng. Sci. 2015, 122, 219–231. [Google Scholar] [CrossRef] [Green Version]
  25. Stankiewicz, A.I.; Moulijn, J.A. Process intensification: Transforming chemical engineering. Chem. Eng. Prog. 2000, 96, 22–34. [Google Scholar]
  26. Keil, F.J. Process intensification. Rev. Chem. Eng. 2018, 34, 135–200. [Google Scholar] [CrossRef] [Green Version]
  27. Di Giuliano, A.; Pellegrino, E. Numerical integration strategies of PFR dynamic models with axial dispersion and variable superficial velocity: The case of CO2 capture by a solid sorbent. Heliyon 2019, 5, e02040. [Google Scholar] [CrossRef] [PubMed]
  28. Choi, Y.; Stenger, H.G. Water gas shift reaction kinetics and reactor modeling for fuel cell grade hydrogen. J. Power Sources 2003, 124, 432–439. [Google Scholar] [CrossRef]
  29. Coenen, K.; Gallucci, F.; Hensen, E.; van Sint Annaland, M. Kinetic model for adsorption and desorption of H2O and CO2 on hydrotalcite-based adsorbents. Chem. Eng. J. 2019, 355, 520–531. [Google Scholar] [CrossRef]
  30. Moe, J.M. Design of water-gas shift reactors. Chem. Eng. Prog. 1962, 58, 8. [Google Scholar]
  31. Poling, B.E.; Prausnitz, J.M.; O’Connell, J.P. The Properties of Gases and Liquids, 5th ed.; McGraw-Hill: New York, NY, USA, 2001. [Google Scholar]
  32. Yang, R.T. Gas Separation by Adsorption Processes; Butterworths series in chemical engineering; Butterworths: Boston, MA, USA, 1987. [Google Scholar]
  33. MathWorks. Solve 1-D parabolic and elliptic PDEs—MATLAB pdepe. Available online: https://de.mathworks.com/help/matlab/ref/pdepe.html (accessed on 19 January 2022).
  34. Skeel, R.D.; Berzins, M. A Method for the Spatial Discretization of Parabolic Equations in One Space Variable. SIAM J. Sci. Stat. Comput. 1990, 11, 1–32. [Google Scholar] [CrossRef]
  35. Shampine, L.F.; Reichelt, M.W. The Matlab ODE suite. SIAM J. Sci. Comput. 1997, 18, 1–22. [Google Scholar] [CrossRef] [Green Version]
  36. Ukrainczyk, N.; Koenders, E.A.B. Numerical Model for Chloride Ingress in Cement Based Materials: Method of Lines Implementation for Solving Coupled Multi-species Diffusion with Binding. Comput. Mater. Civ. Eng. 2016, 1, 109–119. [Google Scholar]
  37. MathWorks. Simulink Product Description—MATLAB & Simulink. Available online: https://de.mathworks.com/help/simulink/gs/product-description.html (accessed on 19 January 2022).
  38. Puente León, F.; Jäkel, H. Signale und Systeme, 7th ed.; De Gruyter Studium, De Gruyter Oldenbourg: Berlin, Germany; Boston, MA, USA, 2019. [Google Scholar]
  39. MathWorks. Choose a Solver—MATLAB & Simulink. Available online: https://de.mathworks.com/help/simulink/ug/choose-a-solver.html (accessed on 19 January 2022).
  40. MathWorks. Overview of Stateflow Objects—MATLAB & Simulink. Available online: https://de.mathworks.com/help/stateflow/ug/overview-of-stateflow-objects.html (accessed on 19 January 2022).
  41. Bayrak, G.; Abrishamchian, F.; Vogel-Heuser, B. Effiziente Steuerungsprogrammierung durch automatische Modelltransformation von Matlab/Simulink/Stateflow nach IEC 61131-3. Autom. Prax. 2008, 50, 49–55. [Google Scholar]
Figure 1. Pilot plant SEWGS reactor with six individually fed reaction chambers. Every chamber consists of seven slits. Isothermal conditions are ensured with adjacent channels between the slits for tempering with purge gas.
Processes 10 01160 g001
Figure 2. Bottom-up Simulink implementation of the model equations for one reaction chamber discretized analogous to MoL. Exemplary ODE implementation of the CO concentration in the bulk phase. The integrator block is marked in yellow. Fourteen ODEs arrange the cell subsystem; N (here: N = 50 ) cells form the reaction chamber.
Processes 10 01160 g002
Figure 3. Required computation time depending on the number of implemented cells, chosen solver, and relative error tolerance. Filled symbols: relative error tolerance 10 6 ; open symbols: relative error tolerance 10 3 . The best results for N = 100 are obtained for solver ode23t with a relative error tolerance of 10 3 . Computation times below 0 indicate that a simulation did not converge.
Processes 10 01160 g003
Figure 4. Simulink model consisting of six reaction chambers (blue), which are operated in either reaction or regeneration mode after an initialization step. Subsequent reaction chambers can optionally be connected. The cyclic process operation is controlled with a Stateflow machine (yellow).
Processes 10 01160 g004
Figure 5. MoL grid analysis with N =   10 to 250 cells for reactive adsorption in one reaction chamber. (a) CO2 loading, and (b) deviation of CO2 loading from N = 250 as a function of the reactor length at t = 25   s .
Processes 10 01160 g005
Figure 6. Comparison of pdepe and MoL ( N = 100 ) simulation results for reactive adsorption in one reaction chamber. (a) CO2 loading at various adsorption times as a function of the reactor length, and (b) bulk phase concentrations at reactor outlet as a function of time. Solid lines: MoL; dotted lines: pdepe.
Processes 10 01160 g006
Figure 7. Comparison of MoL and Simulink ( N = 100 ) simulation results for reactive adsorption in one reaction chamber. (a) CO2 loading at various adsorption times as a function of the reactor length, and (b) bulk phase concentrations at reactor outlet as a function of time. Solid lines: MoL; dotted lines: Simulink ( N = 100 ).
Processes 10 01160 g007
Figure 8. Process operation modes. M1: feed from previous chamber, outlet product; M2: reaction feed, outlet product; M3: reaction feed, outlet to subsequent chamber; M4: regeneration feed, outlet exhaust.
Processes 10 01160 g008
Figure 9. (a) Operation scheme for six reaction chambers, and (b) H2 volume fraction in the product for all chambers combined ("total") and for chamber 1 for the first 900 s . Switching condition M2 to M3: CO2 volume fraction in product > 0.05; M3 to M4: CO2 volume fraction to subsequent chamber > 0.2.
Processes 10 01160 g009
Figure 10. Cyclic operation in six reaction chambers; results shown for nine cycles in chamber 1. (a) Time span of the modes depending on the cycle number, and (b) relative sorbent loading at the end of the modes.
Processes 10 01160 g010
Table 1. Overview of selected studies employing different numerical methods for solving (reactive) adsorption models.
ReactionAdsorptionNumerical SolutionReference
-CO2 on K-HTCMATLAB: MoL (N = 500) / ode15s solver[13]
SMRCO2 on K-HTCMATLAB: MoL / ode15s solver[14]
WGSCO2 on K-HTCgPROMS: CFDM (N = 600) / DASOLV solver[15]
WGSCO2COMSOL Multiphysics: FEM[16]
SMRCO2 on CaO-mayeniteMATLAB: pdepe solver[17]
DMESH2O on LTA zeoliteMATLAB: MoL (N = 30) / ode15s solver[18]
DMESH2O on LTA zeolite 3AgPROMS: BFDM (N = 60) / DASOLV solver[19,20]
WGSCO2 on K-HTCMATLAB: MoL (N = 250) / ode15s solver[21]
SMRCO2 on CaOMATLAB: pdepe solver[22]
-CO2 on K-HTCgPROMS[23]
Table 2. Parameters and operating conditions used in the base case simulation.
General Parameters
ε b 0.4
ε p 0.5
ρ 1096   kg m 3
r p 100 μ m
w cat 0.05
Adsorption Parameters
p8 bar
T250 C
F STP 2000 mL / min
y CO , feed 0.3
y H 2 O , feed 0.6
y N 2 , feed 0.1
Desorption Parameters
p1 bar
T250   C
F STP 1000 mL / min
y H 2 O , feed 0.4
y N 2 , feed 0.6
Publisher’s Note: MDPI stays neutral with regard to jurisdictional claims in published maps and institutional affiliations.

