Article

Improved Employee Safety Behavior Risk Assessment of the Train Operation Department Based on Grids

1
School of Safety Engineering, Beijing Institute of Petrochemical Technology, Beijing 102617, China
2
Beijing Academy of Safety Engineering and Technology, Beijing 102617, China
*
Author to whom correspondence should be addressed.
Processes 2022, 10(6), 1162; https://doi.org/10.3390/pr10061162
Submission received: 5 May 2022 / Revised: 23 May 2022 / Accepted: 7 June 2022 / Published: 9 June 2022
(This article belongs to the Section Sustainable Processes)

Abstract

:
In the train operation department, humans are the most important and dynamic element, and their safe behavior is directly related to the safety of railway transportation. How to accurately assess the safety behavior risk of on-site workers is an urgent problem to be solved. In risk practice, some scholars directly use the accident potential data to calculate the risk parameters, and the accuracy of the risk magnitude is greatly affected by the data quality. Second, the traditional two-dimensional matrix only considers two external factors, probability and severity, without an in-depth analysis of the inherent vulnerability of risk, resulting in low accuracy of risk assessment. With a focus on the hazard factor, this study proposes a three-dimensional risk assessment approach based on grid management to carry out a personalized risk assessment of grid events. Through the grid division, the method can accurately identify the risk events of employees in any cell grid at a certain moment in the “grids-events-time” three-dimensional coordinate system, providing modeling support for personalized risk assessment. Then, a “probability-severity-vulnerability” three-dimensional risk assessment model is constructed. In this model, the probability is obtained by the induced intensity assignment function of the hazard factor, the vulnerability is obtained by the coupling strength assignment function of the hazard factor, and the severity of a single risk event is given a constant value. On this basis, the risk magnitude is determined by the “sum” algorithm of the three risk parameters. This methodology solves the problems of incomplete consideration of risk parameters and insufficient accuracy of quantitative analysis of risk magnitude in the previous risk assessment process and realizes the personalized and dynamic assessment of risk events of the train operation department. Finally, the methodology is applied to the risk event assessment of “the assistant watchman does not appear as required” at Huangyangcheng station of the Shenshuo Railway, and the evaluation results show that the risk magnitude of different elements in the same cell grid has an obvious individual difference, which fully embodies the advantages of grid risk assessment.

1. Introduction

Railways, as a large combination of motors, have the characteristics of equipment networking, production linkage, and operation joint labor, with all types of driving equipment running continuously, and the social safety environment and climate environment often change. As the practice subject of railway safety production, the potential impact of personnel behavior on system safety is significant, and it is urgent to strengthen the safety behavior risk control of workers on site. At present, although railway safety risk management has made great achievements, safety behavior risk practice still has the following deficiencies: On the one hand, the existing practice of safety behavior risk assessment technologies typically uses historical accident statistics to directly obtain the risk parameters [1,2,3]. If the accidents are historically infrequent or have never occurred, the existing risk information has difficulty effectively supporting risk measurement, modeling, and estimation of related risk parameters. On the other hand, the traditional two-dimensional risk matrix rarely considers other risk attributes. Risk is usually expressed by the combination of the consequence of an event and the corresponding occurrence possibility [4]. The “probability–severity” two-dimensional risk matrix has been widely used in the railway field due to its simple and practical advantages, but the probability and consequence only reflect the external uncertainty of risk, ignoring the internal characteristics of risk, and its oversimplification has also attracted criticism from many experts [5,6,7].
To systematically solve the aforementioned problem, this study innovatively proposes a three-dimensional risk assessment model based on grid management. Through grid division, the method can accurately identify the risk events of employees in any cell grid at a certain moment in the “grids-events-time” three-dimensional coordinate system, providing modeling support for personalized risk assessment. Then, a “probability-severity-vulnerability” three-dimensional risk assessment model is constructed. In this model, the probability is obtained by the induced intensity assignment function of the hazard factor, the vulnerability is obtained by the coupling strength assignment function of the hazard factor, and the severity of a single risk event is given a constant value. On this basis, the risk magnitude is determined by the “sum” algorithm of the three risk parameters. This study uses grid division to realize the personalized positioning of risk events and improves the accuracy of risk assessment results through three-dimensional risk assessment, realizing the personalized and dynamic assessment of risk events of the train operation department.
The structure of this study is as follows: Section 2 reviews the literature on the use of accident statistics and innovation research in risk assessment technologies. Section 3 presents the transportation safety behavior of a single grid model of risk assessment, including grid elements and coding, risk identification, risk analysis, and risk evaluation. Section 4 introduces the practicability of this method by taking “the assistant watchman does not appear as required” at Huangyangcheng station of the Shenshuo Railway as an example. Section 5 summarizes the innovation of this research and the future research directions.

2. Literature Review

With the development of big data technology, many experts have attempted to collect all types of safety risk information to evaluate system risk. For instance, Ghofrani et al. [8] applied big data analysis to the field of railway transportation operation, maintenance, and safety. However, owing to the heterogeneity, inconsistency, and incompleteness of data collection, a large amount of data could not be collected and effectively processed, and it was difficult to explore the data in detail. Qiao et al. [9], based on the data of 35,424 cases of unsafe behaviors extracted from the coal mine safety risk management information system, attendance management system, and training management system of the Yima Coal Industry in Henan Province during 2013–2015, qualitatively extracted ten hazard factors using data mining technology and analyzed their relationships. Dong-han and Jinkyu [10] used big data analysis technology to extract human factor reliability data from incident investigation reports based on the concept of safety-II. Railway transportation entails complex system engineering, and various internal and external hazard factors affect each other. However, as a direct cause of risk events, hazard factors are seldom applied in the risk assessment process. The main reason is that the existing risk assessment technology cannot obtain real-time information on these hazard factors, and quantifying the value is also a major problem in the risk assessment process.
In recent years, many experts have applied grid management in urban management, railway infrastructure construction, project management, and other aspects [11,12,13,14,15]. In view of the characteristics of high intelligence, high integration, and high state correlation of China’s high-speed railway, Rengkui et al. [12] proposed the grid management theory of high-speed railway infrastructure. The theory divided high-speed railway lines into several grid units according to certain rules, and each grid unit was composed of different types of equipment. A personalized state prediction model was developed for each component, so as to more accurately and efficiently grasp the degradation trends of infrastructure equipment, diagnose infrastructure faults, and better organize multi-professional comprehensive maintenance and repair activities. Lei et al. [14] proposed a new rail life prediction model based on grid theory, which divided railway lines into multiple cell grids, estimated the service life of each rail grid, and predicted the deterioration trend of the rail by using the Markov process theory and risk assessment model. From the perspective of urban management, Fan [15] investigated and analyzed the basic configuration, characteristics, implementation effects, and main difficulties of community grid management. The core of grid management is to manage the grid elements from the perspective of space rather than expertise to achieve the refinement of management space and accurate positioning of elements. This study uses grid management to accurately locate and classify the risk information related to the operation behavior of the staff in the transportation system. Combined with risk assessment technology, the risk trend of workers’ safety behavior can be better controlled.
In view of the deficiency of a two-dimensional risk matrix, some experts and scholars have improved the respective methods based on different angles. For instance, Zhang [16] took vulnerability as the third parameter of project risk assessment. Han et al. [17] took significance as the third evaluation parameter of international project risk management and constructed a three-dimensional risk assessment model of probability-impact-significance. Duan et al. [18] established a risk analysis framework for the first time, which considered the principle of risk grade allocation of controllability, criticality, manageability, and uncertainty, and carried out a risk assessment and risk ranking for a cryogenic-liquid hydrogen charging system through a quantified probability and consequence two-dimensional risk matrix. Meng et al. [19] proposed an evaluation method for the risk value of unsafe behaviors based on an analysis of the characteristics of employees’ unsafe behavior in coal mine gas explosion accidents and constructed a risk evaluation model consisting of probability, importance, and loss, in which the risk value was the product of the three parameters. Zhang [20] took vulnerability as the third parameter of risk assessment to evaluate the risk assessment of shunting derailment operations. In the process of railway safety risk assessment, the interaction between hazard factors in the same spatial position could lead to coupling risks, and the negative impact of such coupling risks may be greater than the sum of the impacts of a single hazard factor and ultimately have a great impact on the result of systematic risk assessment. Due to different research objects, the definition of vulnerability also varies greatly, and a unified concept has not been formed at present, as shown in Table 1. By adding the risk parameter of vulnerability, this study attempts to evaluate the safety behavior risk of grid events from the perspective of three-dimensional risk analysis.

3. Methodology

3.1. Proposed Framework

The proposed integrated framework that we have employed in this study is graphically depicted in Figure 1. The framework mainly includes two parts; one is grid division, including the definition and coding of the grid, grid element, and grid event. The other is the three-dimensional risk assessment, including risk identification, risk analysis, and risk evaluation of employees’ safety behavior. The steps of the proposed framework can be briefly explained as follows:
Step 1: Grid division. Collect relevant grid information and then divide and encode the assessed cell grids, elements, and possible risk events.
Step 2: Identification of hazard factors. Define the risk events in the cell grid and identify the hazard factors.
Step 3: “Probability-severity-vulnerability” three-dimensional risk analysis. Obtain the risk event probability, vulnerability, and consequence. The risk magnitude can be solved by the parameter “sum” algorithm.
Step 4: Risk evaluation. Compare the grid elements’ magnitude of the risk events with the established risk criteria to determine whether the magnitude of risk is acceptable or tolerable and compare it with the traditional two-dimensional risk assessment results.

3.2. Grid Division

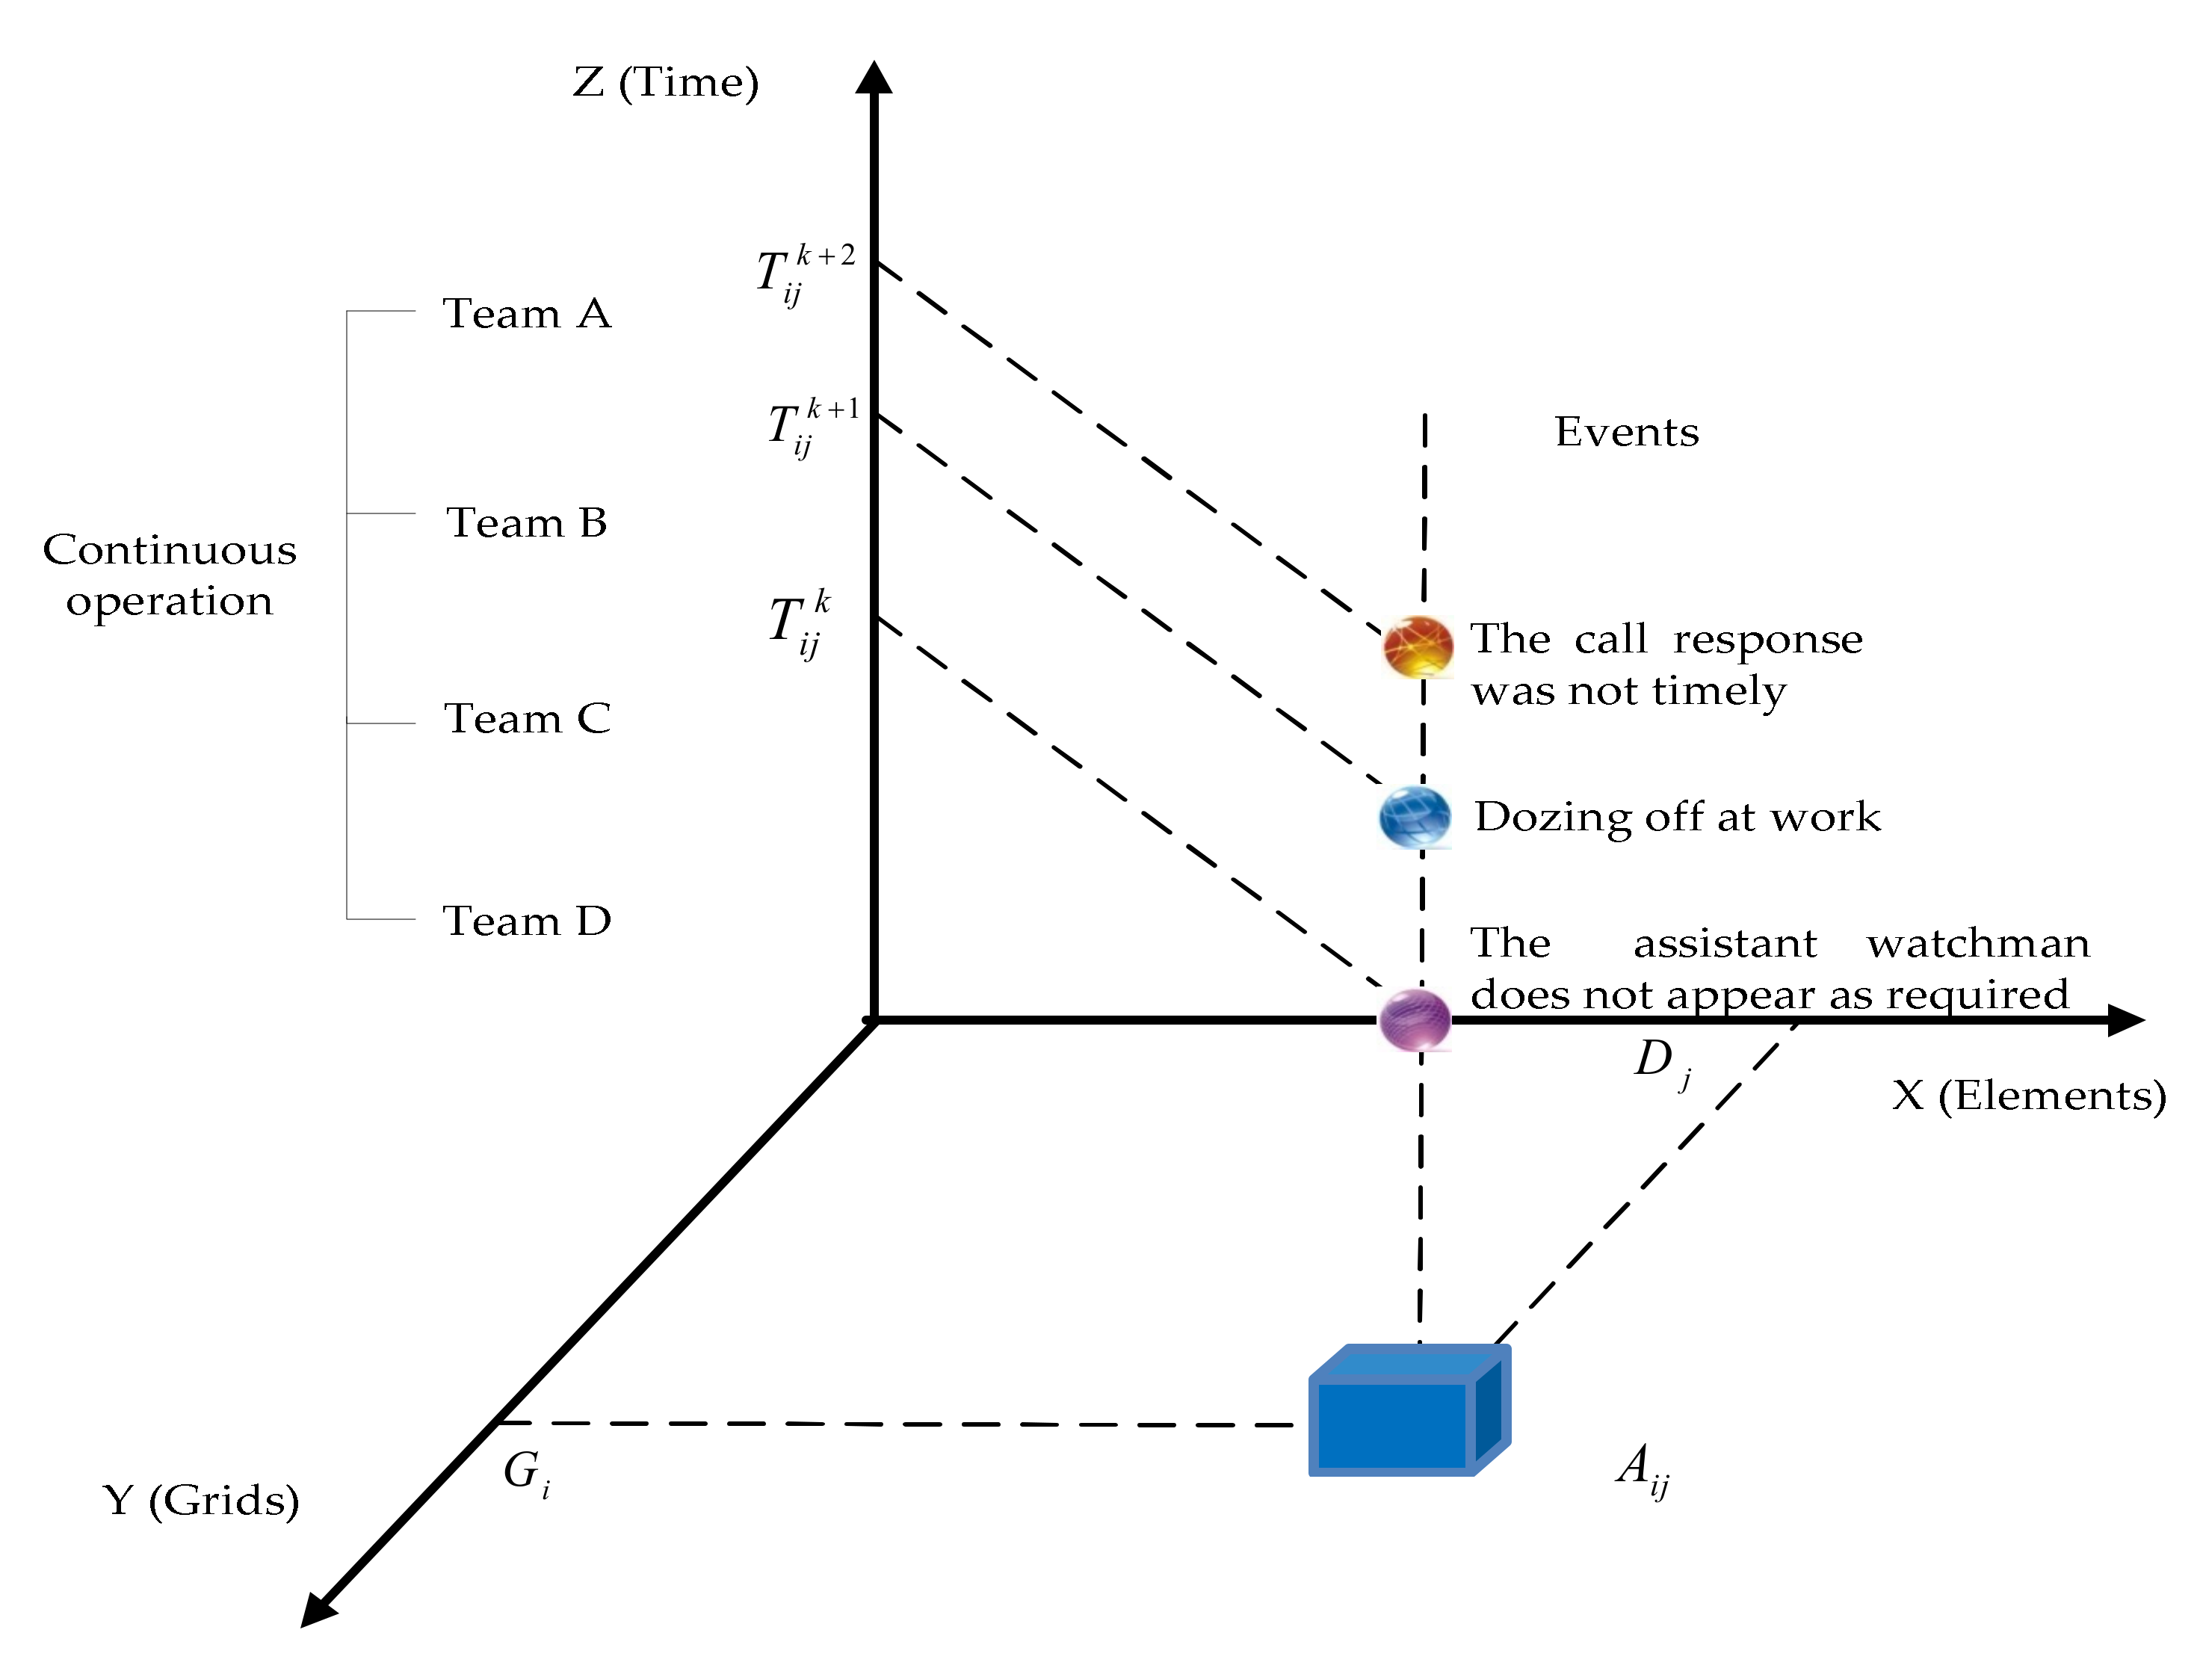
The proposed grid management of the train operation department is a logical virtual grid with personnel participation; it has three-dimensional attributes: time, space, and event. The risk events of employees in any unit grid at any time can be accurately displayed in the “grids–elements–time” three-dimensional coordinate system, and it can organize the disordered and uncorrelated risk data so that railway managers can have a more comprehensive perception and grasp of when, where, and what risk may occur to employees in a short time and a small space, providing modeling support for personalized risk assessment. Figure 2 shows the three-dimensional spatial relationship among grids, elements, and events. The work activities of employees can be reflected in the coordinate system of three-dimensional space, and the factor A i j is the j th element in the grid G i , corresponding to events that occur at different moments: T i j k , T i j k + 1 , and T i j k + 2 .
(1)
Grid definition and coding
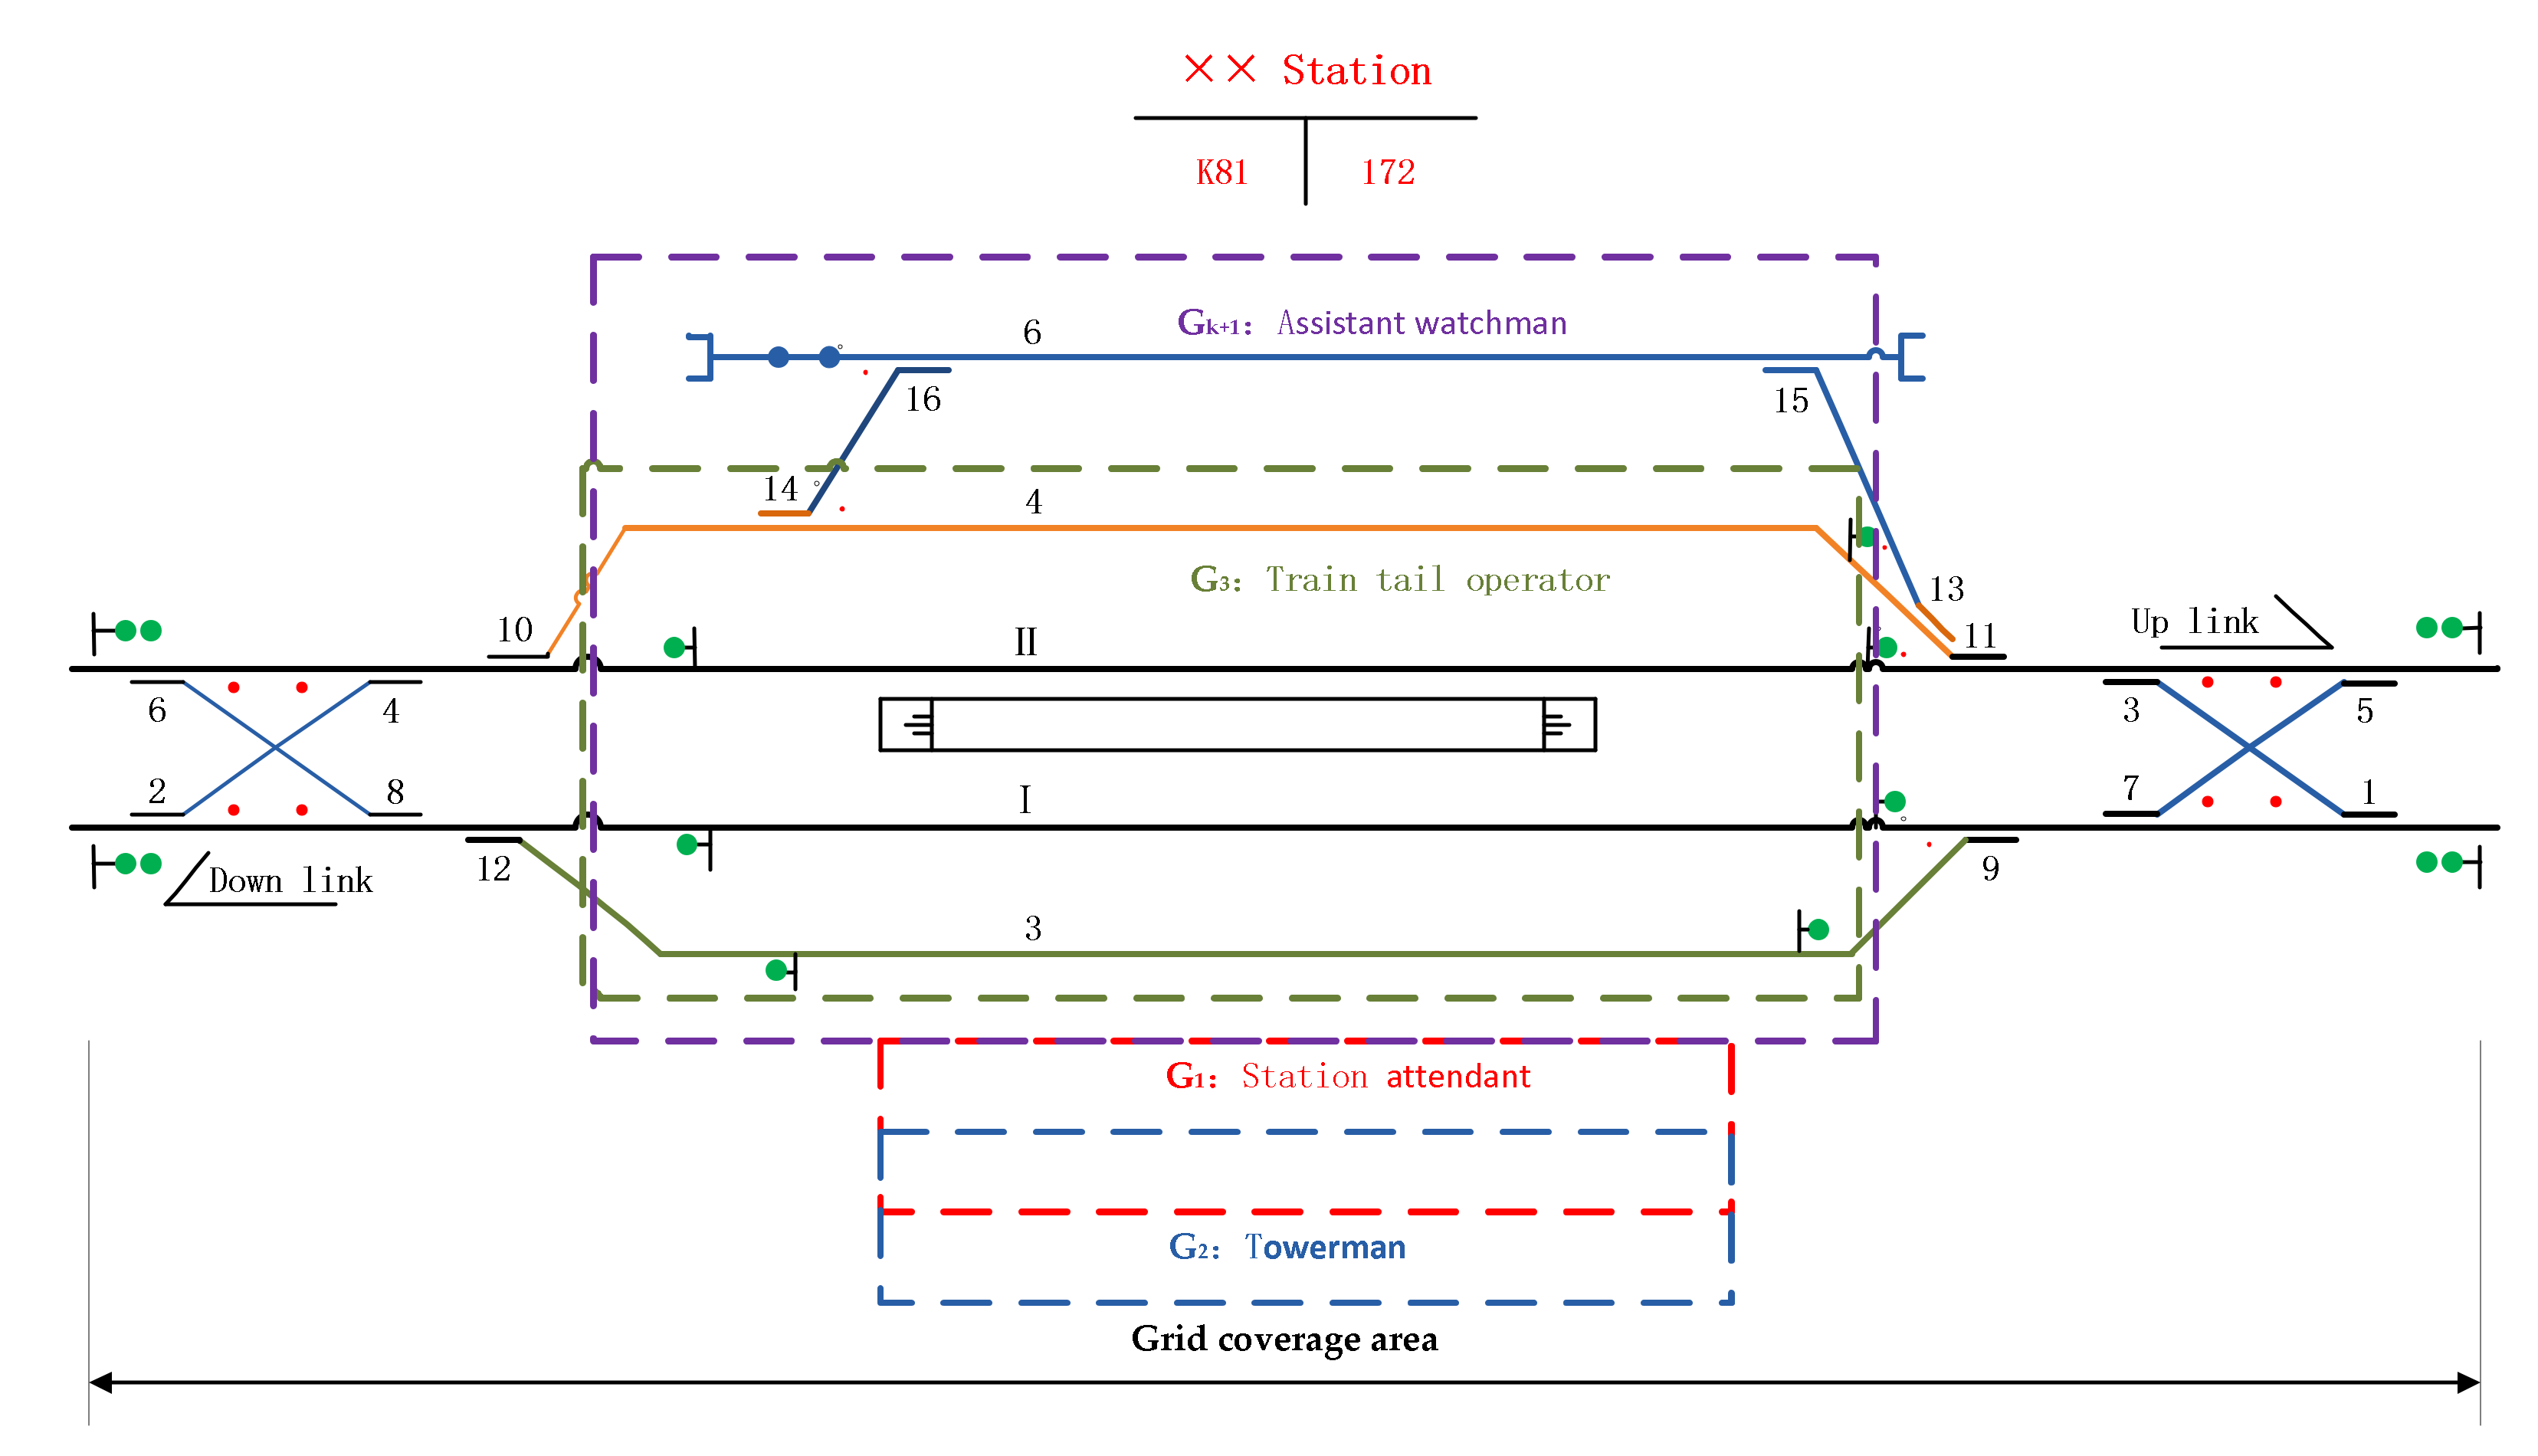
Cell grid definition and division method [13]. The railway traffic work is organized and implemented in the station, and the working scope of the staff is centered on the mileage coordinates of the station center and bounded by the mileage coordinates of the signal machines in and out of the station. Therefore, the grid of the train operation department refers to the discretization of the plane space of various types of work areas covered by the mileage range of the station access signal, that is, it is divided into a number of discrete and unequal “small areas”. The “small areas” can be regarded as a collection of the working activities of several employees in any post, and each “small area” is denoted as a grid cell G k , k = 1 , 2 , , K , where K is the total number of train operation department grid units.
Based on the angle of job scope and spatial position, the grid division of the train operation department should represent the operation scope of all types of employees based on the area of two-dimensional space to realize the correlation between job operation and spatial position. For example, Figure 3 shows the grid division diagram of ×× station in Shenshuo Railway, both the station attendant and the towerman work in the operation room, but they still belong to two different grids owing to different job boundaries.
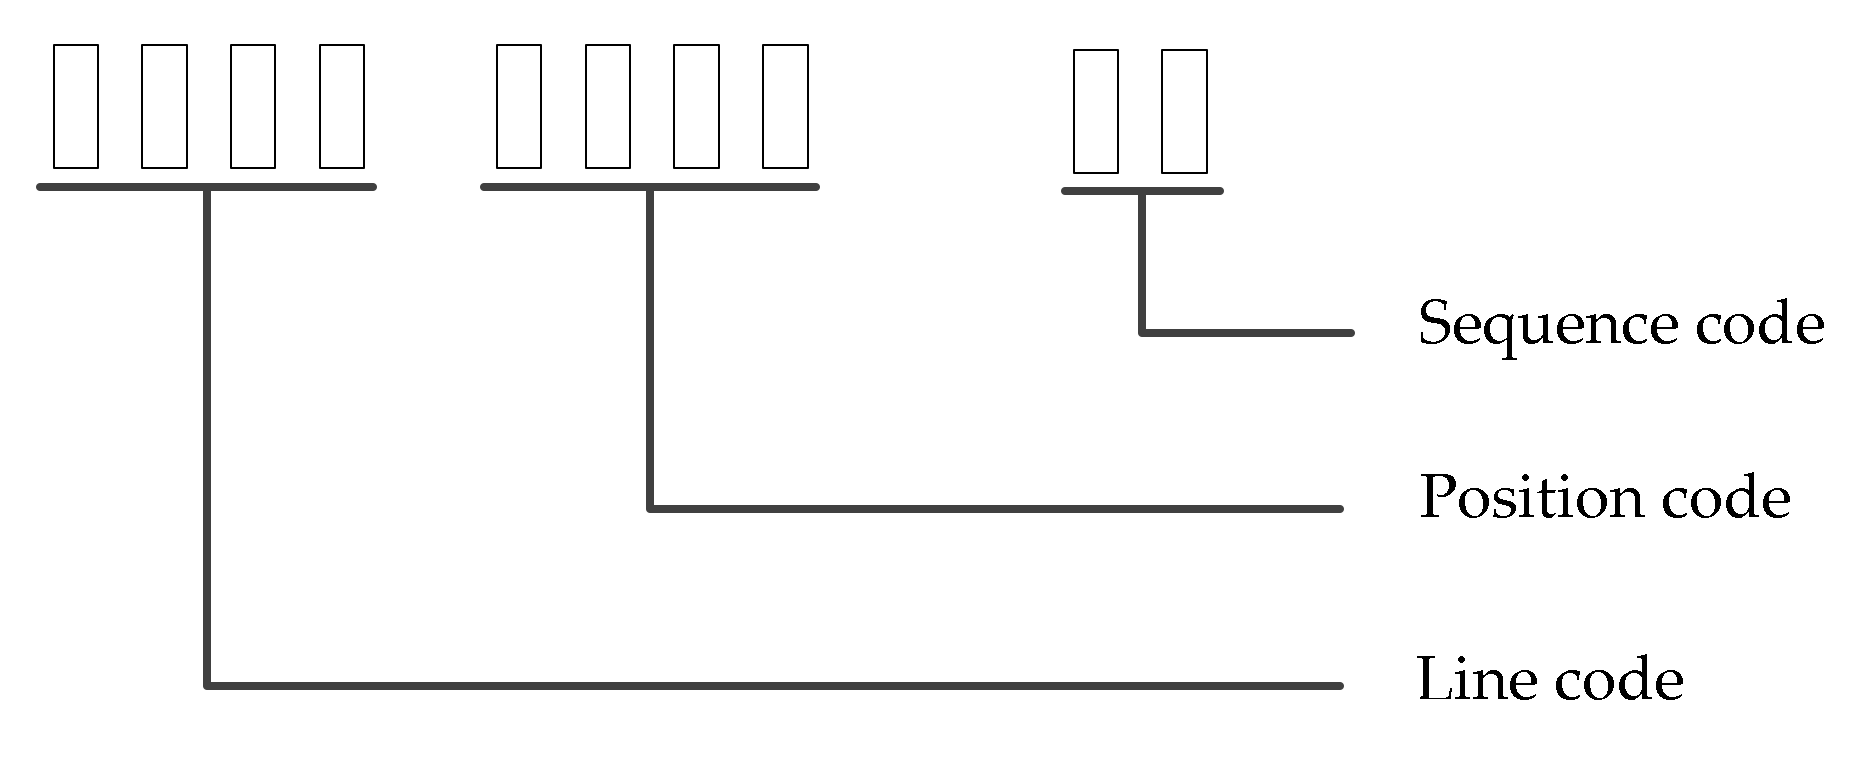
Grid coding rule. Grid coding is related to geospatial dimension information, and grid data should include spatial and attribute data [14]. Each cell grid should have a unique identifier. The transportation system grid coding should include “line code + position code + sequence code”, where the line code is 4 bits and the location code is expressed as the mileage of the station center in kilometers and is set to 4 digits according to the length of the line. The sequence code represents the sequence number of a grid in the station, which can be set as 2 digits. The sequence number starts from the direction of small mileage to the direction of large mileage in the station; thus, the grid code is set to 10 digits, as shown in Figure 4.
(2)
Definition and coding of grid elements
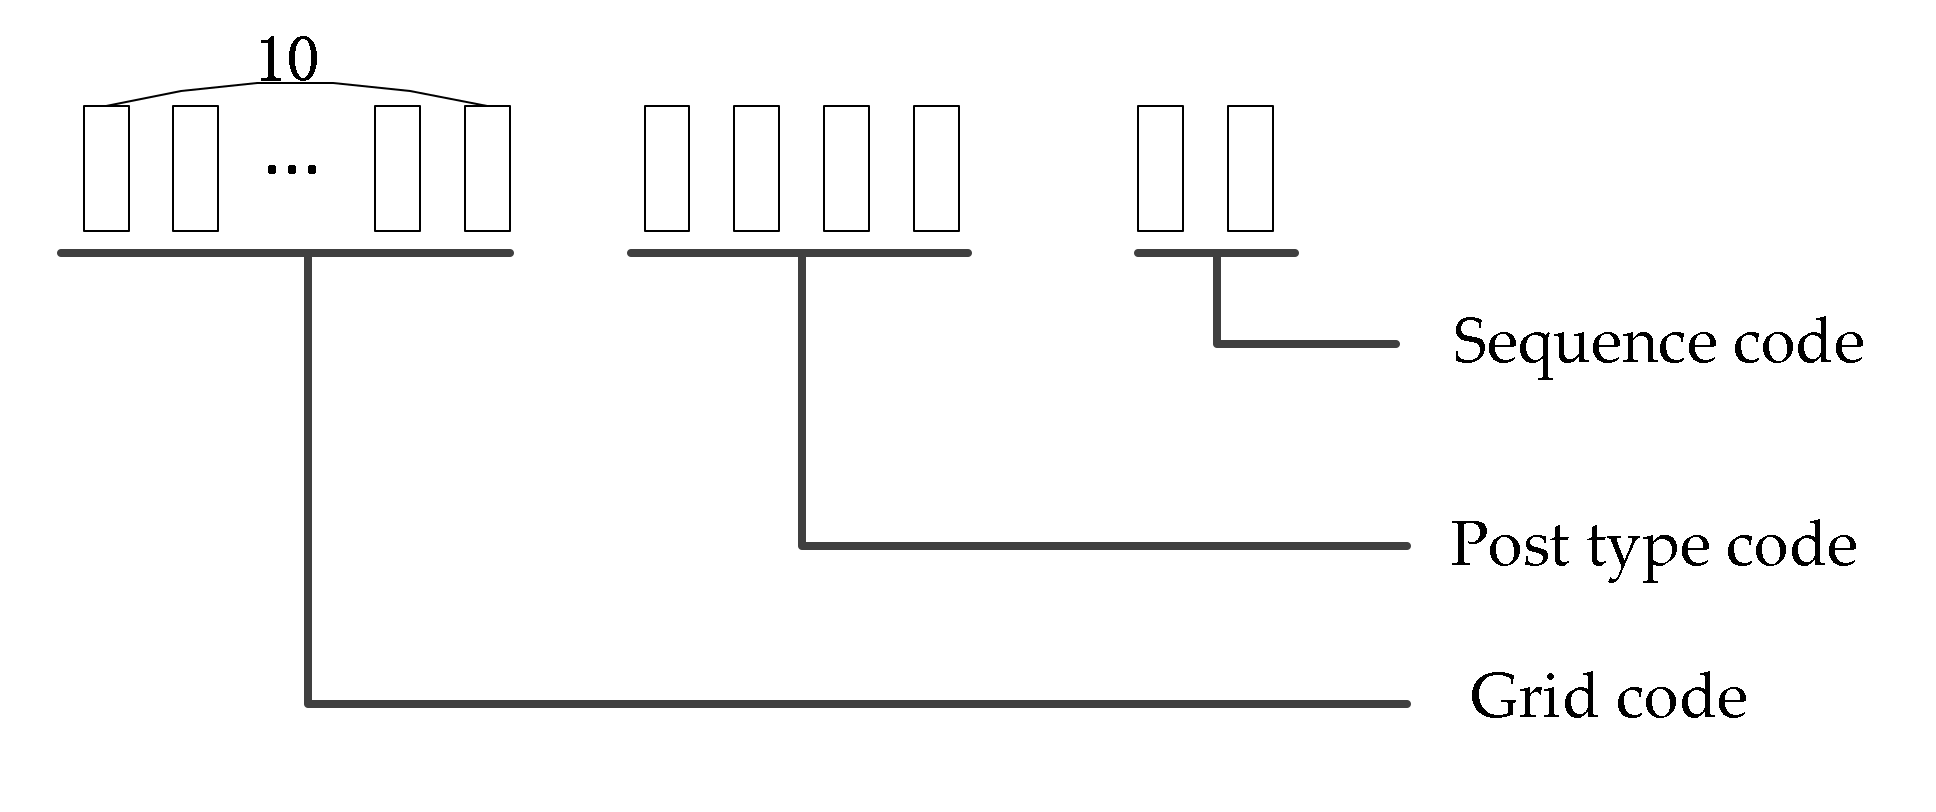
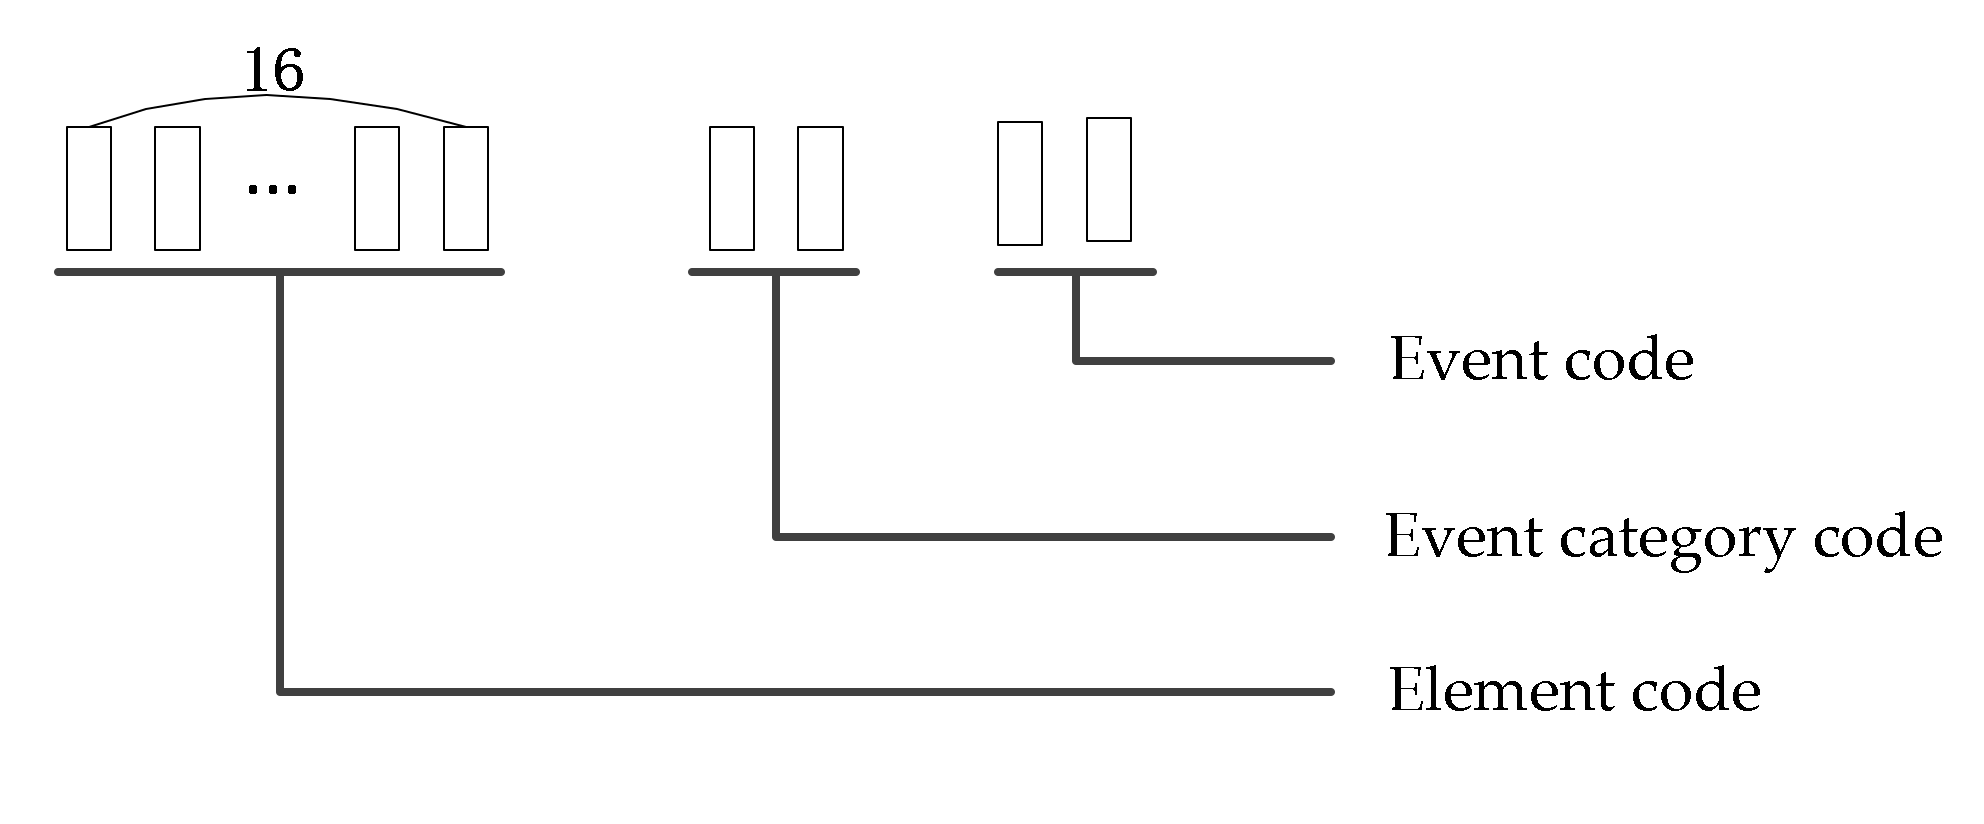
Individual employees and equipment of the train operation department grid are collectively referred to as grid elements. This study focuses on the study of an “individual employee” as a special element, which owns initiative and can carry out various production activities in the grid; thus, we establish the correlation between the grid and its elements. The train operation department generally implements “five shifts and four operations” (the working cycle is 20 days, 12 days on duty and 8 days off duty). Therefore, for the same post, there is a one-to-many relationship between the grid and “workers”. Therefore, a grid may contain one or more elements, but the elements can not cover multiple grids. Element encoding generally includes employee dimension information and geographic spatial dimension information. The employee dimension coding information is used to determine the work type of the employee, and the geographic spatial dimension coding information is used to determine the location of the employee, which can be expressed by the corresponding grid coding. The combination of these elements can help achieve the unique identification of the employee; therefore, the code is designed as “grid code + post type code + sequence code”. The post type code of an employee is set to 4 bits, and the sequence code represents the serial number of an employee in a certain grid, which is 2 bits; therefore, the overall code of grid elements is 16 bits (Figure 5).
(3)
Definition and encoding of grid events
The safety behavior information generated by elements in a cell grid at a certain moment is called the event of grid elements. Events of grid elements comprise events with positive or negative impacts, and events with negative impacts are known as risk events (this study focuses on risk events). The coded event should comprise two parts: event dimension information and element dimension information. The event dimension information can determine the category of the event, and the element dimension information should adopt the coding of the corresponding element of the event. Combined with the coding principle, the coding design is “element code + event category code + event code”. The event category code can be set as 2 bits, the event code can be set as 2 bits, and the total event code is 20 bits (Figure 6).

3.3. Hazard Factors Identification

Risk assessment includes three stages: hazard factor identification, risk analysis, and risk evaluation [24]. Hazard factor identification refers to the hazard factor identification of risk events of elements in the cell grid under specific space-time conditions, which mainly includes two points. One is to clarify the corresponding risk events. All risks are related to “events”, and events are carriers of risks. Therefore, the hazard factor identification in transportation systems carries out hazard identification for specific risk events. The second point concerns a specific state of space and time. Risk has dynamic characteristics. Under the influence of internal and external environments, the hazard factors in different time periods and different operation locations are different. The identification of hazard factors should be targeted at specific space-time states. Hazard factor identification has two main purposes. It can solve the risk probability according to the collected hazard factor data assignment, and the vulnerability can be solved according to the coupling relationship analysis between hazard factors.
Some scholars have studied the hazard factor classification from the perspective of the system [20,25,26,27,28]. Combined with the research of hazard factors in related fields and the “Classification and code of hazardous and harmful factors in the production process” (GB/T 13861-2022) [29], this study divides the hazard factors of grid risk events into four aspects: human, environment, equipment, and management. This study lists the typical hazard factors of the train operation department, and the specific content is shown in Table 2:

3.4. Risk Analysis

(1)
Risk assessment criteria
Probability level. Based on the relevant standards of the European Railway Industry [30] and the opinions of railway field experts, the risk probability level is divided into five levels (Table 3).
Severity level. Based on the relevant standards of the European Railway Industry [30] and the opinions of railway field experts, the risk consequence severity level is divided into five levels (Table 4).
Vulnerability level. At present, there is no unified classification standard for railway safety risk vulnerability at home or abroad. In this study, with reference to the research on vulnerability-related literature [20] and the requirements of railway site safety management, vulnerability is divided into five levels (Table 5).
Risk acceptance criteria. At present, the commonly used risk acceptance criteria include ALARP criteria in the UK, GAMAB criteria in France, and MEM criteria in Germany [30,31]. Among them, ALARP criteria have been widely used in railway, energy, finance, engineering construction, and other industries. In this study, the following standards are formulated with reference to ALARP standards (Table 6). In this study, the “additive” relationship is used to represent the “combination” relationship between probability, severity, and vulnerability. The minimum value is 3 and the maximum value is 15. The summation value is divided into four levels according to expert suggestions.
(2)
Weights of the hazard factors
In the transportation system, hazard factors of risk events belong to different grids, there is interaction and feedback between these hazard factors, and they have strong internal and external dependence. Many experts use the ANP method to study this dependence [32,33,34,35]. In this study, the ANP method is used to solve the relative weight of hazard factors as the input of the probability of safety behavior risk events. The specific steps are as follows:
Step 1: Construct the ANP hierarchy. The network structure of ANP consists of two parts: the control layer and the network layer, as shown in Figure 7. In the control layer, there are control criteria B 1 , B 2 , … B n , which are the criteria of relative objectives, such as risk, benefit, opportunity, and cost. These criteria are independent of each other and are only governed by the target element. The network layer is composed of a hazard subset C that is controlled by the control layer, and its internal structure is the network structure that influences each other. This study considers the single safety behavior risk of the transportation system, and this criterion is the target of risk analysis. Therefore, the ANP hierarchy includes the network layer, which comprises hazard factors governed by a single risk criterion and can be divided into multiple categories, whose internal structure is the network structure that affects each other.
Step 2: Calculate the unweighted hypermatrix. Assume that the network layer of the ANP includes a hazard subset C 1 , C 2 , … C n , among which there are hazard factors e i 1 , e i 2 , …., e i n , i = 1 , 2 , 3 , . . , N . Under the single risk criterion, considering the hazard factor e j l ( l = 1 , 2 , 3 , , n j ) in C j as the secondary criterion, the elements in the hazard factor subset C i are compared according to their influence on e j l ; i.e., a judgment matrix is constructed under the single risk criterion, and the matrix W i j is obtained, as expressed in Equation (1).
W i j = w i 1 j 1 , w i 1 j 2 , , w i 1 j n j w i 2 j 1 , w i 2 j 2 , , w i 2 j n j . . w i n i j 1 , w i n i j 2 , , w i n i j n j
Step 3: Establish the weighted super matrix W - . Taking the entire hazard subset as an element, the relative importance of a certain hazard subset is pally compared under a single risk criterion, and the normalized weight vector ( a 1 j , a 2 j , , a N j ) T of the hazard subset under the subcriterion is obtained, where a i j represents the influence weight of the i th hazard subset on the j th hazard subset, “0” implies no influence, and i = 1 N a i j = 1 ; then, the weighted super matrix is expressed by Equation (2).
W - = ( W i j - ) = a i j W i j
Step 4: Calculate the limit hypermatrix W . Calculate the limit relative ordering vector W = lim k ( 1 / N ) k = 1 N W k - for each hypermatrix. If the limit converges and is unique, the value of the corresponding row of the original matrix is the weight of each index. The weight value w i of each index can be obtained by this formula.
(3)
Probability calculation
The induced intensity of hazard factors refers to the probability of grid element risk events induced by hazards in a specific space-time state. The hazard induced intensity assignment function can establish a personalized function according to the uniqueness of the inducing factors of the risk events that occur in each grid element in a certain period of time and a specific operation area, solve the induced intensity of the hazard factor, and take it as the input for the calculation of the possibility of risk events. Due to the uncertainty of the safety behavior risk of the transportation system, the hazard factors in the cell grid will present different characteristics in different spatio-temporal states. When solving the induced intensity of the hazard factors, it is necessary to select the appropriate assignment function according to the actual situation of the cell grid. Common assignment functions include triangle function, trapezoidal function, Gaussian function, etc. This study presents an assignment function model for the induced intensity of disaster factors of element risk events in a cell grid. The model can select and assign an appropriate membership function according to the specific conditions of the hazard factors of element risk events in the cell grid to calculate the induced intensity of the hazard factors of element risk events in the grid more accurately. The model expression is expressed in Equation (3).
Y T G = y j a 1 , a 2 , , a m , , a M
where
Y T G —In the time interval T , the induced intensity of the hazard factor j of a certain risk event in the cell grid G is assigned.
y —Mapping between variables a m and Y . The construction y should conform to the actual situation of the transportation system, objectively reflect the intensity of the hazard factor j , and be easy to calculate, avoiding manual intervention.
a m —Within the time interval T , a certain state index related to the hazard factors of the grid element, such as professional level, educational level, weather temperature, etc.
m —Represents the number of status indicators.
Through the personalized assignment of the induced intensity of hazard factors, combined with the weight of hazard factors obtained by the ANP method, this study creatively puts forward a possibility assignment function of safety behavior risk events, and the function formula is expressed in Equation (4).
P = i = 1 n Y T G i w i , i = 1 , 2 , , n
where w i is the weight coefficient, which satisfies Equation (5).
0 w i 1 , i = 1 n w i = 1
(4)
Vulnerability calculation
Vulnerability is the inherent characteristic of employees’ safety behavior during risk events in the grid, which is externally reflected in their susceptibility to interference and vulnerability in risk events. The root of these characteristics lies in the coupling influence of various hazard factors in the grid. Therefore, the greater the coupling strength is, the stronger the vulnerability, and vice versa. The DEMATEL method is an effective method to analyze complex system problems. This method can overcome the disadvantage of the traditional risk assessment method, which assumes that the relationship between variables is independent of each other and can fully consider the interdependence of each element and screen out the appropriate hazard factors according to the total impact relationship matrix and impact network relationship diagram [36,37,38,39,40]. In this study, the DEMATEL method is used to establish the coupling strength of hazard factors. The specific steps are as follows:
Step 1: Analyze the hazard factors of elements’ risk events in the cell grid within a certain time interval, and preliminarily form a list of hazard factors of single element risk events in the grid.
Step 2: Build the direct influence matrix. Let a i j represent the influence degree of hazard factor i on hazard factor j , while scales 0, 1, 2, 3, and 4 represent no influence, small influence, moderate influence, high influence, and great influence, respectively. According to the work experience of experts, the interdependence degree a i j of the initially selected hazard factors can be assigned, and the matrix A can be obtained in Equation (6):
A = a i j n × n ( 1 i n , 1 j n )
Step 3: Establish the direct influence matrix D of hazard factors. Equation (7) is used to normalize the matrix A , and the direct influence matrix D is obtained, as shown in Equation (8):
k = j = 1 m a i j 1 i n max
D = 1 k A
Step 4: Establish the total relation matrix T of hazard factors. Equation (9) is used to get the total relation matrix, where I was the identity matrix.
T = D + D 2 + D 3 + + D n = D ( I D ) 1
Step 5: Solve centrality degree ( R i + F j ) and cause degree ( R i F j ) . See Equations (10) and (11) for R i and F j , respectively, where, t i j is any variable in T , R i is the sum of rows in the matrix T , and represents the synthesis of the influence of hazard factor i on other hazard factors. ( R i + F j ) is the centrality, indicating the importance of i relative to other hazard factors. ( R i F j ) is cause degree; if ( R i F j ) is positive, then the element i is an affecting element; if ( R i F j ) is negative, then the element i is an affected element (threshold can be set to ignore indicators with small correlation).
R i = j = 1 n t i j
F j = i = 1 n t i j
Step 6: Draw a cause-and-effect diagraph. The graph is drawn using ( R i + F j ) as the horizontal axis and ( R i F j ) as the vertical axis, and the less influential factors are eliminated.
Step 7: Assign the coupling strength of hazard factors. The coupling strength assignment function is established by the sum of rows and columns in the comprehensive influence matrix T , as shown in Equation (12). The coupling strength is used as the input of vulnerability calculation for subsequent risk events.
S T G j = ( 1 + R j j R j ) ( 1 + F j j F j ) ( 1 j n ) ,
where,
S T G j —Coupling strength of risk event hazard factor j in cell grid G within a time interval T .
R j —The row sum of the hazard factor j in the total relation matrix T .
F j —The column sum of hazard factor j in the total relation matrix T .
According to the concept of vulnerability, this study puts forward an assignment function of the safety behavior risk vulnerability of employees in a train operation system for the first time. The vulnerability of risk events is obtained by combining the coupling strength of hazard factors with the weight of hazard factors. The function formula is expressed in Equation (13).
V = i = 1 n S T G i w i , i = 1 , 2 , , n
where w i is the weight coefficient, which satisfies Equation (14).
0 w i 1 , i = 1 n w i = 1
(5)
Severity calculation
The occurrence of risk events may cause various consequences, e.g., casualties, property losses, and equipment damage; this study only considers casualties. In the traditional two-dimensional risk matrix, from the perspective of the system, the severity of different risk events can be divided into multiple levels, but when a single determined risk event occurs, the severity of its consequence is unique. Therefore, in the process of risk analysis, this study considers a unique assignment to the consequence of a single risk event in the grid.
(6)
Risk level calculation
Based on the classification of risk possibility, severity, and vulnerability by the semiquantitative analysis method, the “addition” algorithm is suitable to solve the risk magnitude. When using the traditional two-dimensional matrix to calculate the risk size, the size or magnitude of the risk is usually expressed by the “combination” of the result and its probability. Many scholars generally use the “multiplication” relationship to express this “combination”. The International Organization for Standardization [29] pointed out that this “combination” relationship did not specifically refer to the product relationship but also the “addition” relationship or other functional relationship. The British Standards Institute [30] also pointed out that the traditional “multiplication” algorithm for frequency and results might lead to the inaccuracy and inconsistency of the final risk level and recommended the “addition” algorithm.
Based on the aforementioned analysis, if the semiquantitative method is used to calculate the risk magnitude, the “multiplication” algorithm is used for the three parameters, and the calculation error will be greater than that of the “addition” algorithm; therefore, the “addition” algorithm is slightly more accurate in this study (Equation (15)).
R T G = F + C + V
where
R T G —the risk event magnitude in cell grid G within time interval T ;
F —the possible magnitude of a risk event;
C —the severity of the consequence magnitude of the risk event;
V —the vulnerability magnitude of the risk event.

3.5. Risk Evaluation

Risk evaluation is the third subprocess of risk assessment which compares the results of risk analysis with the preset risk criteria to determine whether the risk is acceptable or tolerable [21]. Risk evaluation uses the knowledge of risk obtained in the process of risk analysis to make decisions on future actions. These decisions generally include the following:
  • Risk response priorities;
  • What approach should be taken to implement the selected response activities?
  • Whether a response activity should be carried out;
  • Whether a risk needs to be dealt with.

4. Case Study

Shenshuo railway is an important part of the second western coal transport channel in China. It is a class I trunk line double-track electrified heavy-haul railway. The line starts from Daliuta town, Shenmu city, Shaanxi province in the west, and Shuozhou city, Shanxi province in the east. The total length of the line is 270 km and the minimum driving interval is 9 min. At present, the traffic volume has broken through the limit. In addition, the natural conditions are relatively poor, and the comprehensive quality of employees is poor. The on-site safety supervision of the train operation department is facing great challenges.

4.1. Application Scenario Description

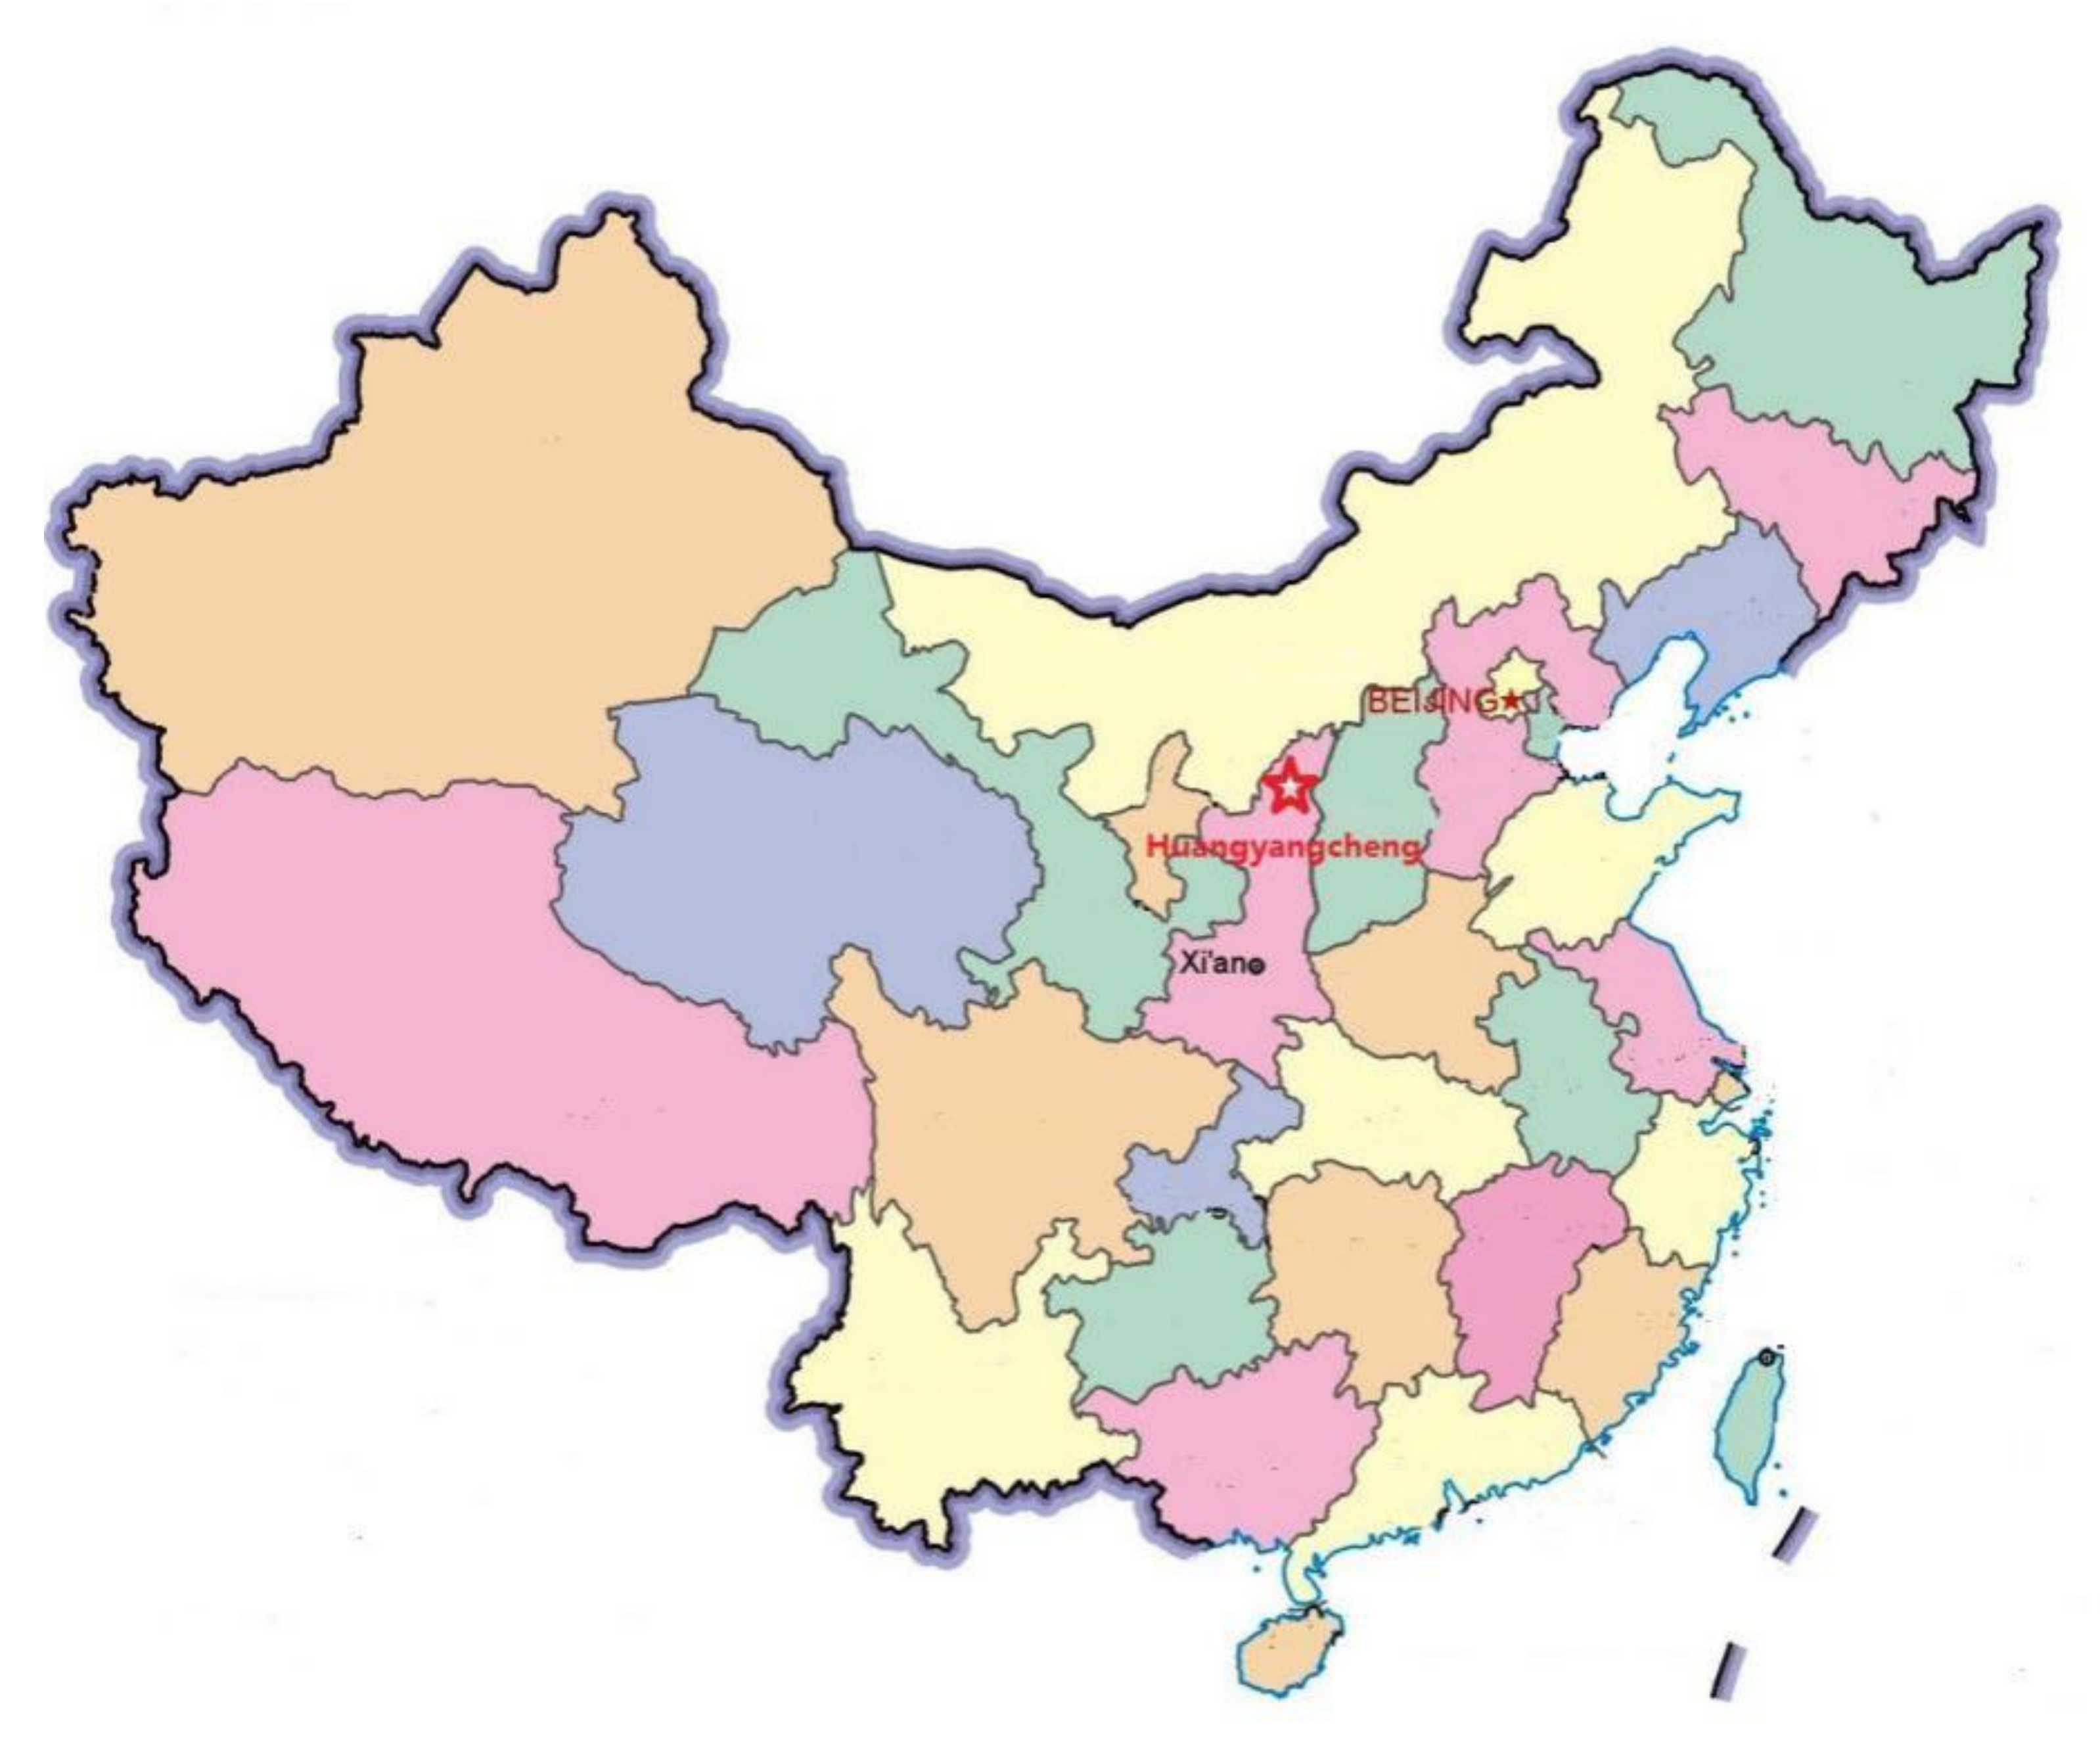
Huangyangcheng station, located in Shenmu city, Shaanxi province (Figure 8), is a second-class freight station under the management of the Shenshuo railway. The “five shifts and four operations working system” (the working cycle is 20 days, 12 days on duty and 8 days off duty) is implemented for the assistant watchman in the station. One assistant watchman is set at the north and south ends of each shift station; the assistant is responsible for operations with regard to the receipt and dispatch of trains, loading and removing iron shoes, and other jobs. Based on the following considerations, this study selects the risk event of “the assistant watchman did not appear as required” as an example to illustrate.
(1)
Risk event based on data acquisition factors. Through many on-site investigations of Huangyangcheng station, we collected and sorted out a large number of hazard factor data, hidden accident dangers, and statistical accounts of education and training.
(2)
The operation area of the station assistant watchman spans the whole station, which has a wider operation scope than other positions and is affected by various hazard factors. If the assistant attendant does not follow the standard operation, the train operation status cannot be monitored, which may lead to derailment and personal injury. Moreover, the risk event has always been a “chronic problem” in the safety work of the station, which cannot help but be checked and prohibited, and the phenomenon of repeated occurrence is more prominent.
(3)
Risk event based on time characteristic factors. In view of this risk event, due to the low temperatures in winter, extremely cold weather often occurs and employees are prone to fear the cold. In addition, the inertia of station employees’ “two violations” has a certain time regularity, which is typically more in the four periods of shift handover, late midnight, lunchtime, and the weekend.
Therefore, the risk event “the assistant watchman did not appear as required” in operation team A during the night inspection of the station master from 3:00 to 5:00 on 28 December 2020, was considered as an example. The grid code of this risk event was “00010044010003010201” (hereafter referred to as “grid G H “).

4.2. Hazard Factors Identification of “the Assistant Watchman Did Not Appear as Required”

The division of hazard factors of “the assistant watchman did not appear as required” in the grid G H is shown in Table 7.

4.3. Risk Analysis

(1)
Probability calculation
In this study, the concept of induced intensity was proposed in Section 3.4, which could be combined with the actual situation of the site to give a personalized assignment function, solve the problem according to the collected hazard data, and then multiply the relative weights of the disaster factors to obtain the possibility of risk events. The specific solution process was as follows:
Induced intensity assignment. Due to the uncertainty of the safety behavior risk of the transportation system, the hazard factors in the cell grid would present different characteristics in different spatio-temporal states. When solving the induced intensity of the hazard factors, it was necessary to select the appropriate assignment function according to the actual situation of the cell grid. The assignment functions selected in this study included the triangle function, trapezoidal function, and so on (Table 8).
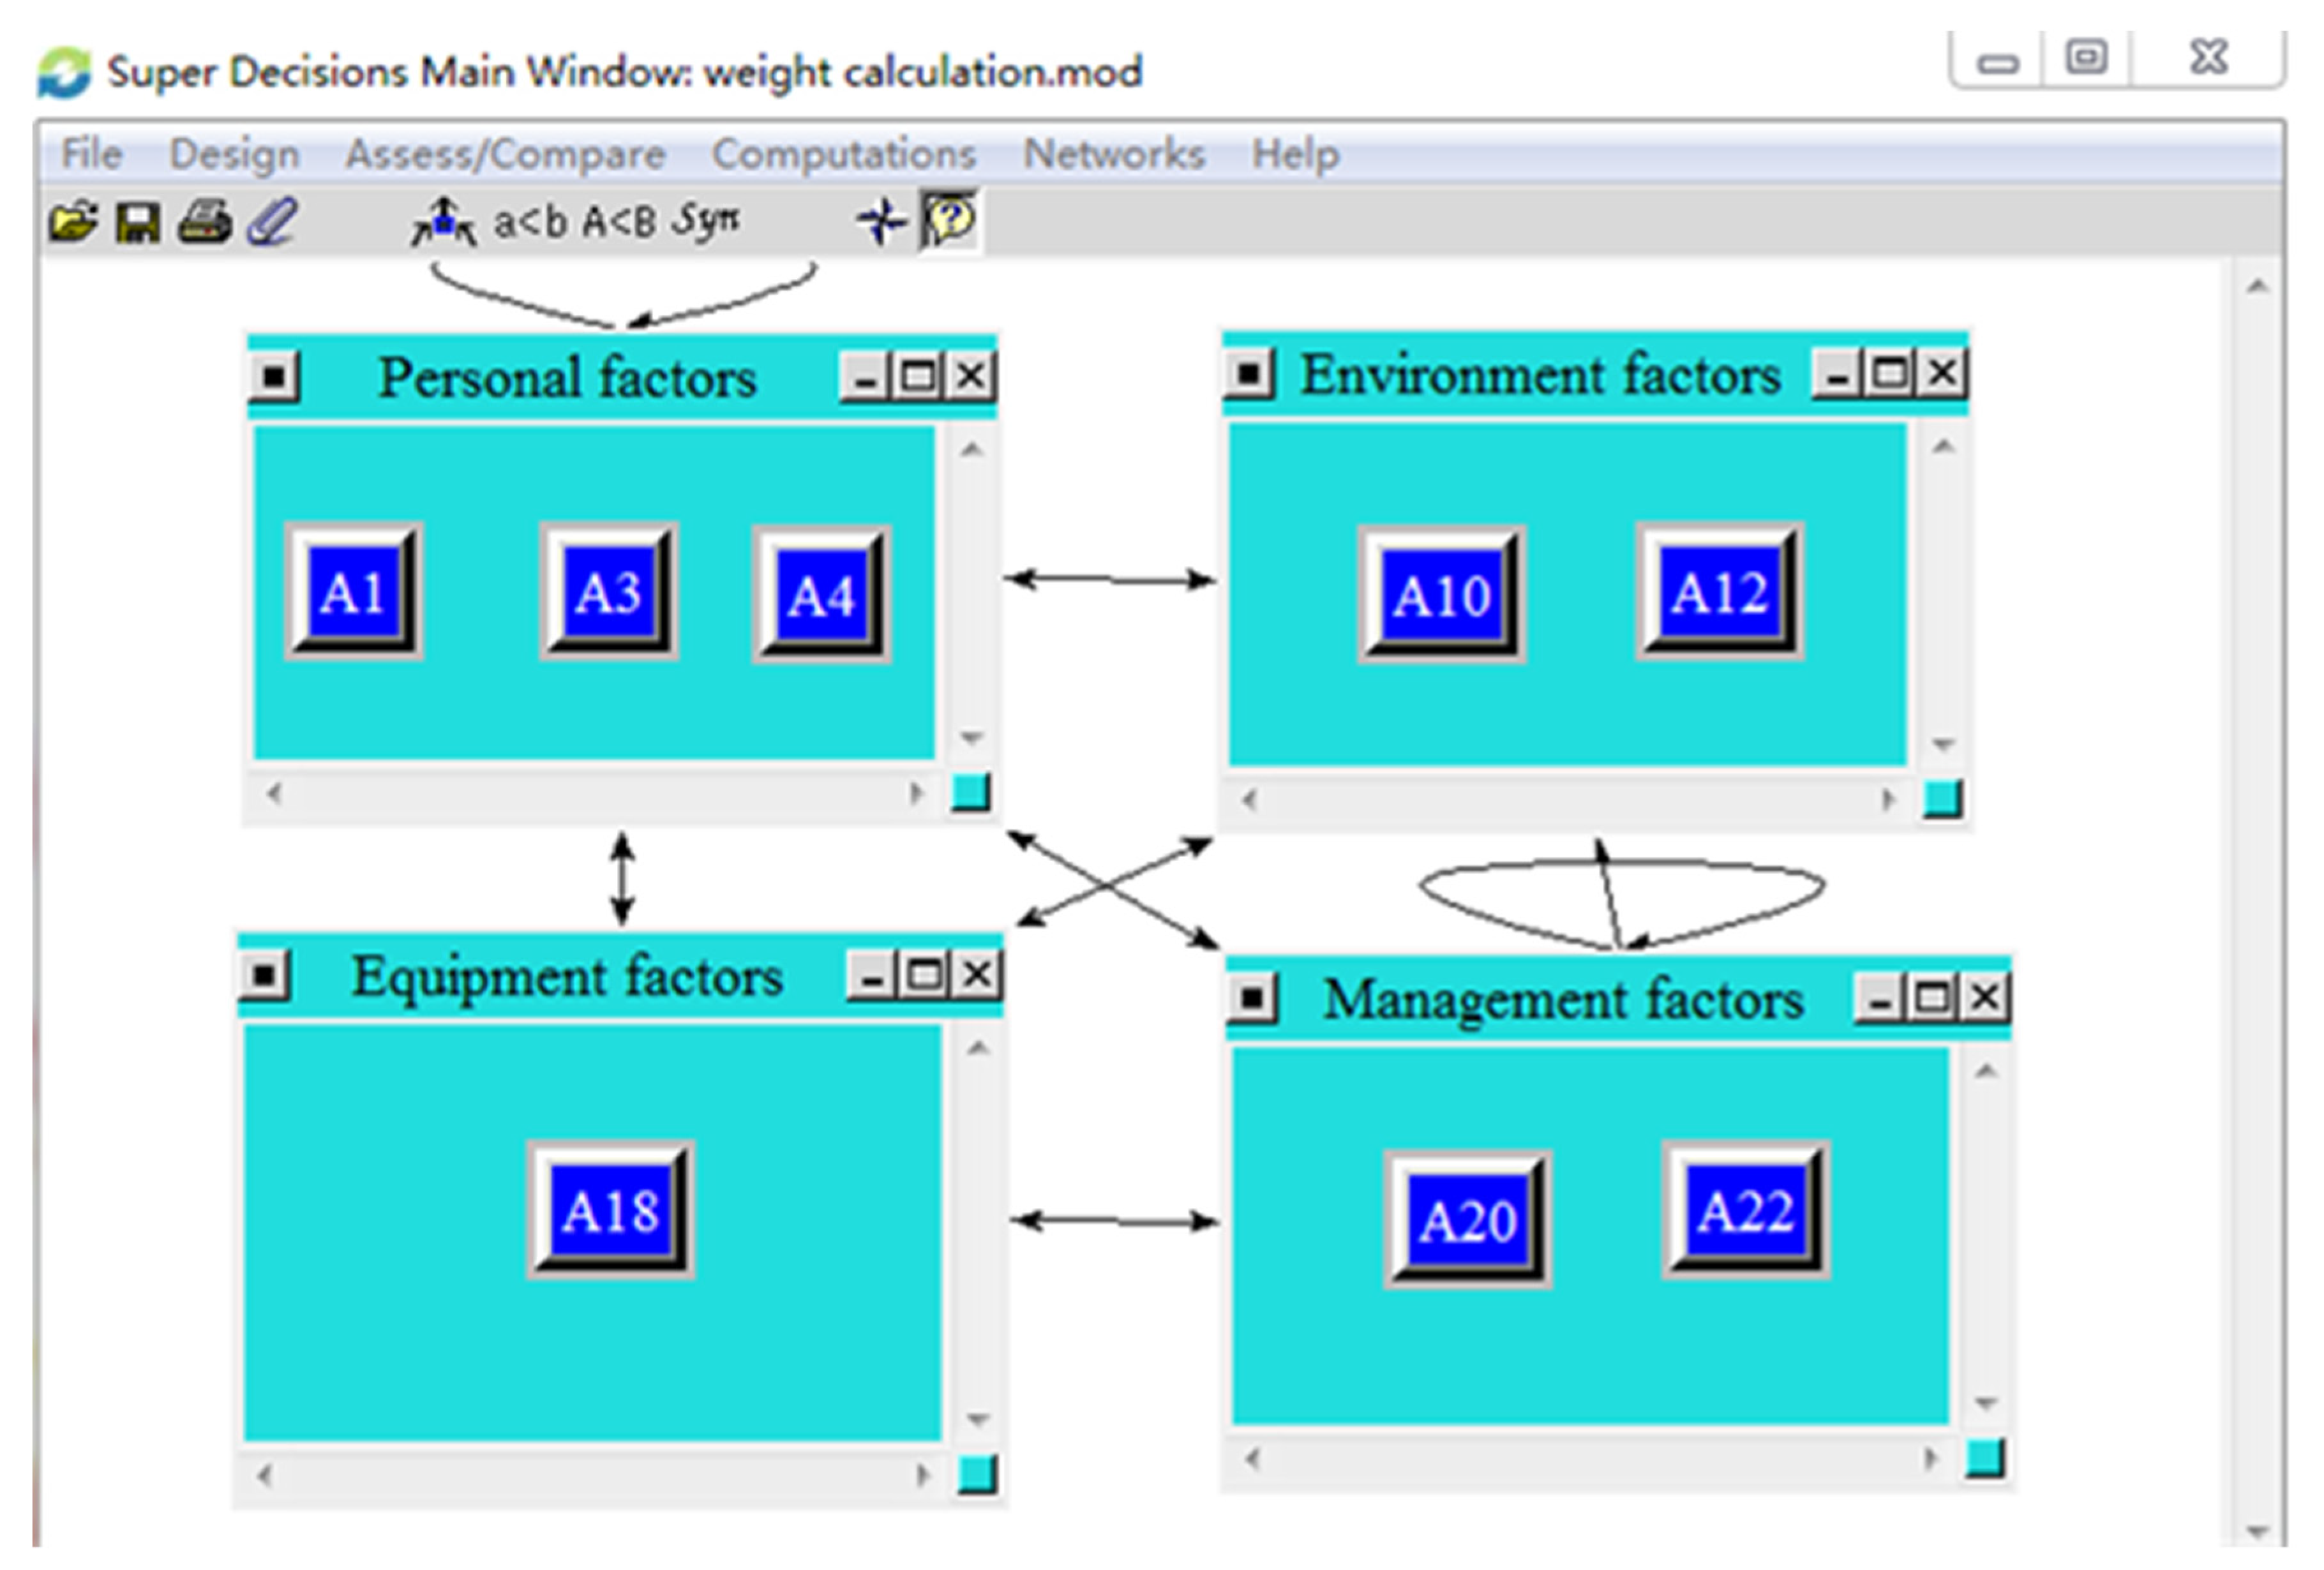
Weight calculation. Due to the interaction and feedback between risk event disaster factors and strong internal and external dependence, the ANP method could reverse the characteristics. The specific calculation procedure was described in Section 3.4. The network hierarchy was constructed by using super decision software (Figure 9), and the weight value of hazard factors was obtained (Table 9).
Probability calculation. According to Equation (4), the probability of “the assistant watchman did not appear as required” scenario was 0.0066. According to the probability rating standard, the probability grade was 3, and the language description was “Infrequent”.
Vulnerability calculation. First, the coupling strength calculation was performed. The direct impact matrix of hazard factors in the grid G H was then established (Table 10). The row sum and column sum were obtained according to the solution steps of the DEMATEL method, and the coupling strength of the hazard factors was calculated according to Equation (12) (Table 11). Secondly, the vulnerability calculation was performed. According to Equation (13), the vulnerability of “the assistant watchman did not appear as required” was 1.17, the magnitude was “Small” and the semantic scale was 2.
(2)
Severity calculation
According to the severity grade standard of the train operation department, experts on the spot thought the risk event of “the assistant watchman did not appear as required” scenario in the grid G H could rarely cause casualties. Therefore, the severity level of the “the assistant watchman did not appear as required” scenario in the grid G H was determined as “Marginal,” and the semantic scale was assigned a value of 2.
(3)
Risk level calculation
According to Equation (15), the risk size of “the assistant watchman did not appear as required” was 7, and the risk level was “Tolerable.”
The risk magnitude of the risk event of “the assistant watchman did not appear as required” in the latest operation cycle of the other nine grid elements involved in the post of assistant attendant in the Huangyangcheng station was solved, and the calculation results were shown in Table 12.

4.4. Risk Evaluation

(1)
Analysis of the three-dimensional risk assessment results
According to the calculation results of risk magnitude, we could find that the risk level of the grid “00010044010003020201”, “00010044010003030201” and “00010044010003090201” was “Undesirable”, grid “00010044010003010201”, “00010044010003040201”, ”00010044010003050201”, “00010044010003070201”, ”00010044010003080201” and “00010044010003100201” was “Tolerable”, and grid “00010044010003060201” was “Negligible.” In the same operation cycle, the risk magnitudes of different elements in the same cell grid had obvious individual differences which fully embodied the advantages of personalized risk assessment of the cell grid. At present, some experts have applied the idea of grid management to railway safety management. For example, Rengkui et al. [12] proposed the grid management theory of high-speed railway infrastructure. A personalized state prediction model was developed for each component, so as to more accurately and efficiently grasp the degradation trends of infrastructure equipment, diagnose infrastructure faults, and better organize multi-professional comprehensive maintenance and repair activities. Lei et al. [14] proposed a new rail life prediction model based on grid theory which divided railway lines into multiple cell grids, estimated the service life of each rail grid, and predicted the deterioration trend of rail by risk assessment model. In terms of three-dimensional risk assessment, Zhang and Sun [20] took vulnerability as the third risk assessment parameter to conduct a three-dimensional risk assessment of train derailment risk events. Cagno et al. [41] believed that controllability should be taken as an evaluation parameter of the expected impact before and after the adoption of risk measures. Zhang [16] took vulnerability as the third parameter of project risk assessment. All these studies could improve the quality of risk assessment.
(2)
Analysis of traditional two-dimensional risk assessment results
The traditional “probability-severity” two-dimensional risk matrix was usually used to solve the magnitude of risk events on the whole by using the statistical data of hidden dangers of unsafe behaviors of all employees. The combination of probability and severity adopted the multiplication algorithm. The probability and severity rating criteria and risk acceptance criteria were, respectively shown in Table 3, Table 4, and Table 13. In 2020, Huangyangcheng Station collected data on a total of 10 “three violations” of “the assistant watchman did not appear as required” (Table 14). Combined with the suggestions of on-site experts, the traditional “probability-consequence” two-dimensional risk matrix was used to give the probability level “Frequent”, the corresponding semantic scale was 5, the consequence level was “Large”, and the corresponding semantic scale was 2. According to the two-dimensional risk matrix parameters, the multiplication principle was generally adopted, and the risk size of the risk event was 10, which belonged to “Tolerable” risk. Managers needed to take reasonable control measures to ensure the risk event was under control.
(3)
Comparative analysis
We found that the traditional risk matrix had some shortcomings: first, it was easy to be affected by the quality, quantity, and integrity of information to directly solve the risk parameters using historical accident statistics, which made it difficult to obtain an accurate evaluation effect by quantitative analysis technology. Second, the systematic risk analysis result could not truly reflect the safety behavior risk level of each employee in this type of work owing to individual differences and the influence of temporal and spatial characteristics. In addition, while considering countermeasures, the station was required to take unified rectification measures for the ten assistant duty attendants until the risk level could not be reduced which increased the cost of risk response and caused a waste of resources to some extent.
To address the above deficiencies, the grid method was used to classify and locate the “key person, key event, and key period” of the train transportation site, and the modeling analysis was conducted for the individual employees. For example, according to the “short board theory” of modern management, it was only necessary to take key control measures for grids “00010044010003020201”, “00010044010003030201”, and “00010044010003090201”. At the same time, a large number of hazard factor data that directly induced risk events were integrated into the risk assessment process which overcame the impact on the accuracy of risk assessment caused by the traditional accident and hidden trouble data missing or less data collection.

5. Conclusions

Inertial illegal operation is not only a great enemy affecting the safety of railway transportation but also one of the persistent problems that have plagued the safety of train maintenance systems for a long time. Considering the deficiency of safety behavior risk assessments of the train operation department, which takes the system as a whole and lacks the awareness of the risk vulnerability, this study proposes a safety behavior risk assessment method based on the grid management and the “probability-severity-vulnerability” three-dimensional risk assessment model to improve the traditional two-dimensional risk matrix. First, the evaluation objects are grided, including the definition and coding of grid, element, and event. Risk events within each grid are assigned unique codes. Then, the hazard factors of grid element risk events are identified from four aspects: human, environment, equipment, and management. Taking the hazard factor as the core, this study proposes the induced intensity and coupling strength of the hazard factor assignment function; they are used, respectively, to calculate the probability and vulnerability of the risk events, accompanied by the ANP and DEMATEL methods. Taking the consequence of the risk event as a constant, the “sum” algorithm can be used to obtain the risk magnitude of the three-dimensional risk matrix. The evaluation results show that the risk magnitudes of different elements in the same cell grid have obvious individual differences which fully embodies the advantages of personalized risk assessment of the cell grid, therefore, it is only necessary to take key control measures for grid “00010044010003020201”, “00010044010003030201” and “00010044010003090201”, which belong to “Undesirable”.
The following contradictions are made in this study. With the help of the grid division, the methodology accurately locates and classifies the on-site staff from the perspective of time and space and orders the disorder and lack of related risk data, which can provide support for a personalized three-dimensional risk assessment. On this basis, this study can build a personalized evaluation model for the risk events of each grid element and change the direct assignment of the traditional “possibility-consequence” two-dimensional risk parameters into the modeling of the “probability-severity-vulnerability” three-dimensional risk matrix using the hazard factor data to indirectly solve the risk magnitude, which can improve the accuracy of risk magnitude calculation.
Although this study improves the traditional risk assessment of employees’ safety behavior, this study still has some shortcomings and the following studies should be considered in the future: First, when considering the hazard factors, this study only considers the hazard factors in the grid, and does not consider the influence factors outside the network or the transportation system, which may also have an impact on the risk assessment results. Further research on this aspect should be carried out in the future. Second, a set of safety behavior risk classification standards for railway employees should be established. When an organization implements risk assessment, no matter which risk assessment method is adopted, the assessor must have a set of assessment standards. This “yardstick” used for risk assessment is the risk classification standard, which is the reference basis for evaluating the importance of risks. With the change in the railway safety production situation and safety supervision requirements, the evaluation standard of safety risk will change accordingly and needs to be adjusted appropriately. The third is to develop a three-dimensional risk assessment software platform to realize the automatic collection, analysis, and processing of disaster-causing factors and the automatic calculation of risk magnitude to improve the automation level.

Author Contributions

Methodology, H.Z.; software, H.Z.; writing—original draft preparation, H.Z.; writing—review and editing, C.Q.; calculation, M.M. All authors have read and agreed to the published version of the manuscript.

Funding

This research received no external funding.

Institutional Review Board Statement

Not applicable.

Informed Consent Statement

Not applicable.

Data Availability Statement

Not applicable.

Acknowledgments

The authors are very thankful to the reviewers and editor for their helpful advice on how to improve the quality of the thesis.

Conflicts of Interest

The authors declare no conflict of interest.

References

  1. Zhou, J.; Lei, Y. Paths between latent and active errors: Analysis of 407 railway accidents/incidents’ causes in China. Saf. Sci. 2018, 110, 47–58. [Google Scholar] [CrossRef]
  2. Zhan, Q.; Zheng, W.; Zhao, B. A hybrid human and organizational analysis method for railway accidents based on HFACS-Railway Accidents (HFACS-RAs). Saf. Sci. 2017, 91, 232–250. [Google Scholar] [CrossRef]
  3. Hui, X.; Yajian, Z.; Hongyang, L.; Martin, S.; Jun, Y.; Fang, Y. Safety risks in rail stations: An interactive approach. J. Rail Transp. Plan. Man 2019, 11, 100148.1–100148.11. [Google Scholar]
  4. ISO3100:2009; Risk Management Principles and Guidelines. ISO: Geneva, Switzerland, 2009.
  5. Hong, Y.; Pasman, H.J.; Quddus, N.; Mannan, M. Supporting risk management decision making by converting linguistic graded qualitative risk matrices through Interval Type-2 Fuzzy Sets. Process Saf. Environ. Prot. 2019, 134, 308–322. [Google Scholar] [CrossRef]
  6. Duijm, J.N. Recommendations on the use and design of risk matrices. Saf. Sci. 2015, 76, 21–31. [Google Scholar] [CrossRef] [Green Version]
  7. Baybutt, P. Guidelines for designing risk matrices. Process Saf. Prog. 2018, 37, 49–55. [Google Scholar] [CrossRef]
  8. Ghofrani, F.; He, Q.; Goverde, R.; Liu, X. Recent applications of big data analytics in railway transportation systems: A survey. Transp. Res. Part C Emerg. Technol. 2018, 90, 226–246. [Google Scholar] [CrossRef]
  9. Qiao, W.; Liu, Q.; Li, X.; Luo, X.; Wan, Y. Using data mining techniques to analyze the influencing factor of unsafe behaviors in Chinese underground coal mines. Resour. Policy 2018, 59, 210–216. [Google Scholar] [CrossRef]
  10. Dong-Han, H.; Jinkyun, P. Use of a big data analysis technique for extracting HRA data from event investigation reports based on the Safety-II concept. Reliab. Eng. Syst. Saf. 2018, 194, 106232. [Google Scholar]
  11. Lei, B.; Sun, Q.; Liu, R.; Wang, F.; Wang, F. A Segment-Based Model for Estimating the Service Life of Railway Rails. In Proceedings of the Cota International Conference of Transportation Professionals, Beijing, China, 25–27 July 2015. [Google Scholar]
  12. Liu, R.; Lei, B.; Wang, F.; Sun, Q.; Wang, F. Grid: A New Theory for High-Speed Railway Infrastructure Management. In Proceedings of the Transportation Research Board 94th Annual Meeting, Washington, DC, USA, 11–15 January 2015. [Google Scholar]
  13. Lei, B.; Zhang, Q.; Liu, R.; Wang, F.; Song, X. Grid-Based Framework for Railway Track Health Evaluation. In Proceedings of the International Conference on Green Intelligent Transportation System and Safety, Changchun, China, 1–2 July 2016; Springer: Singapore, 2016. [Google Scholar]
  14. Lei, B.; Rengkui, L.; Feng, W.; Sun, Q. Estimating railway rail service life: A rail-grid-based approach. Transp. Res. Part A Policy Pract. 2017, 105, 54–65. [Google Scholar]
  15. Fan, X. Research and Thinking on Grid Service and Management of Community in City S. Procedia Eng. 2017, 174, 1177–1181. [Google Scholar] [CrossRef]
  16. Zhang, H. A redefinition of the project risk process: Using vulnerability to open up the event-consequence link. Int. J. Proj. Manag. 2007, 25, 694–701. [Google Scholar] [CrossRef]
  17. Han, S.H.; Kim, D.Y.; Kim, H.; Jang, W. A web-based integrated system for international project risk management. Autom. Constr. 2008, 17, 342–356. [Google Scholar] [CrossRef]
  18. Duan, Y.; Zhao, J.; Chen, J.; Bai, J. A risk matrix analysis method based on potential risk influence: A case study on cryogenic liquid hydrogen filling system. Process Saf. Environ. Prot. 2016, 102, 277–287. [Google Scholar] [CrossRef]
  19. Meng, X.; Liu, Q.; Luo, X.; Zhou, X. Risk assessment of the unsafe behaviours of humans in fatal gas explosion accidents in China’s underground coal mines. J. Clean. Prod. 2019, 210, 970–976. [Google Scholar] [CrossRef]
  20. Zhang, H.; Sun, Q. Risk Assessment of Shunting Derailment Based on Coupling. Symmetry 2019, 11, 1359. [Google Scholar] [CrossRef] [Green Version]
  21. ISO Guide 73-2009; Risk Management Vocabulary. International Organization for Standardization, ISO: Geneva, Switzerland, 2009.
  22. Turner, B.L.; Kasperson, R.E.; Matson, P.A.; McCarthy, J.J.; Corell, R.W.; Christensen, L.; Eckley, N.; Kasperson, J.X.; Luers, A.; Martello, M.L.; et al. A framework for vulnerability analysis in sustainability science. Proc. Natl. Acad. Sci. USA 2003, 100, 8074–8079. [Google Scholar] [CrossRef] [Green Version]
  23. Sarewitz, D.; Pielke, R.; Keykhah, M. Vulnerability and Risk: Some Thoughts from a Political and Policy Perspective. Risk Anal. 2003, 23, 805–810. [Google Scholar] [CrossRef] [Green Version]
  24. IEC 31010-2009; Risk Management—Risk Assessment Techniques. ISO: Geneva, Switzerland, 2009.
  25. Huang, W.; Shuai, B.; Zhang, G. Improved WBS-RBS based identification of risks in railway transportation of dangerous goods. China Saf. Sci. J. 2018, 28, 93. [Google Scholar]
  26. Uğurlu, Ö.; Yıldız, S.; Loughney, S.; Wang, J. Modified human factor analysis and classification system for passenger vessel accidents (HFACS-PV). Ocean Eng. 2018, 161, 47–61. [Google Scholar] [CrossRef] [Green Version]
  27. Kyriakidis, M.; Majumdar, A.; Ochieng, W.Y. The human performance railway operational index—A novel approach to assess human performance for railway operations. Reliab. Eng. Syst. Saf. 2018, 170, 226–243. [Google Scholar] [CrossRef]
  28. Huang, W.; Shuai, B.; Zuo, B.; Xu, Y.; Antwi, E. A systematic railway dangerous goods transportation system risk analysis approach: The 24 model. J. Loss Prev. Process Ind. 2019, 61, 94–103. [Google Scholar] [CrossRef]
  29. GB/T 13861-2009; Classification and Code for the Hazardous and Harmful Factors in Process. General Administration of Quality Supervision, Inspection and Quarantine of the People’s Republic of China; Standardization Administration of the People’s Republic of China: Beijing, China, 2022.
  30. BS EN 50126-2; Railway Applications-The Specification and Demonstration of Reliability, Availability, Maintainability and Safety (RAMS)-Part 2: Guide to the Application of EN 50126-1 for Safety. British Standards Institution (BSI): London, UK, 2007.
  31. BS EN 50126-1; Railway Applications-The Specification and Demonstration Reliability, Availability, Maintainability and Safety (RAMS)-Part 1: Basic Requirements and Generic Process. British Standards Institution (BSI): London, UK, 1999.
  32. Kheybari, S.; Rezaie, F.M.; Farazmand, H. Analytic network process: An overview of applications. Appl. Math. Comput. 2020, 367, 124780. [Google Scholar] [CrossRef]
  33. Chukwuma, E.C.; Okonkwo, C.C.; Ojediran, J.O.; Anizoba, D.C.; Ubah, J.I.; Nwachukwu, C.P. A GIS based flood vulnerability modelling of Anambra State using an integrated IVFRN-DEMATEL-ANP model. Heliyon 2021, 7, e08048. [Google Scholar] [CrossRef] [PubMed]
  34. Liu, X.; Deng, Q.; Gong, G.; Zhao, X.; Li, K. Evaluating the interactions of multi-dimensional value for sustainable product-service system with grey DEMATEL-ANP approach. J. Manuf. Syst. 2021, 60, 449–458. [Google Scholar] [CrossRef]
  35. Salehi, R.; Asaadi, M.A.; Rahimi, M.H.; Mehrabi, A. The information technology barriers in supply chain of sugarcane in Khuzestan province, Iran: A combined ANP-DEMATEL approach. Inf. Process. Agric. 2020, 8.3, 458–468. [Google Scholar] [CrossRef]
  36. Nilashi, M.; Samad, S.; Manaf, A.A.; Ahmadi, H.; Rashid, T.A.; Munshi, A.; Almukadi, W.; Ibrahim, O.; Ahmed, O.H. Factors influencing medical tourism adoption in Malaysia: A DEMATEL-Fuzzy TOPSIS approach. Comput. Ind. Eng. 2019, 137, 106005. [Google Scholar] [CrossRef]
  37. Trivedi, A. A multi-criteria decision approach based on DEMATEL to assess determinants of shelter site selection in disaster response. Int. J. Disater Risk Reduct. 2018, 31, 722–728. [Google Scholar] [CrossRef]
  38. Asan, U.; Kadaifci, C.; Bozdag, E.; Soyer, A.; Serdarasan, S. A new approach to DEMATEL based on interval-valued hesitant fuzzy sets. Appl. Soft Comput. 2018, 66, 34–49. [Google Scholar] [CrossRef]
  39. Balsara, S.; Jain, P.K.; Ramesh, A. An integrated approach using AHP and DEMATEL for evaluating climate change mitigation strategies of the Indian cement manufacturing industry. Environ. Pollut. 2019, 252, 863–878. [Google Scholar] [CrossRef]
  40. Li, Y.; Mathiyazhagan, K. Application of DEMATEL approach to identify the influential indicators towards sustainable supply chain adoption in the auto components manufacturing sector. J. Clean. Prod. 2018, 172, 2931–2941. [Google Scholar] [CrossRef]
  41. Cagno, E.; Caron, F.; Mancini, M. A Multi-Dimensional Analysis of Major Risks in Complex Projects. Risk Manag. 2007, 9, 1–18. [Google Scholar] [CrossRef]
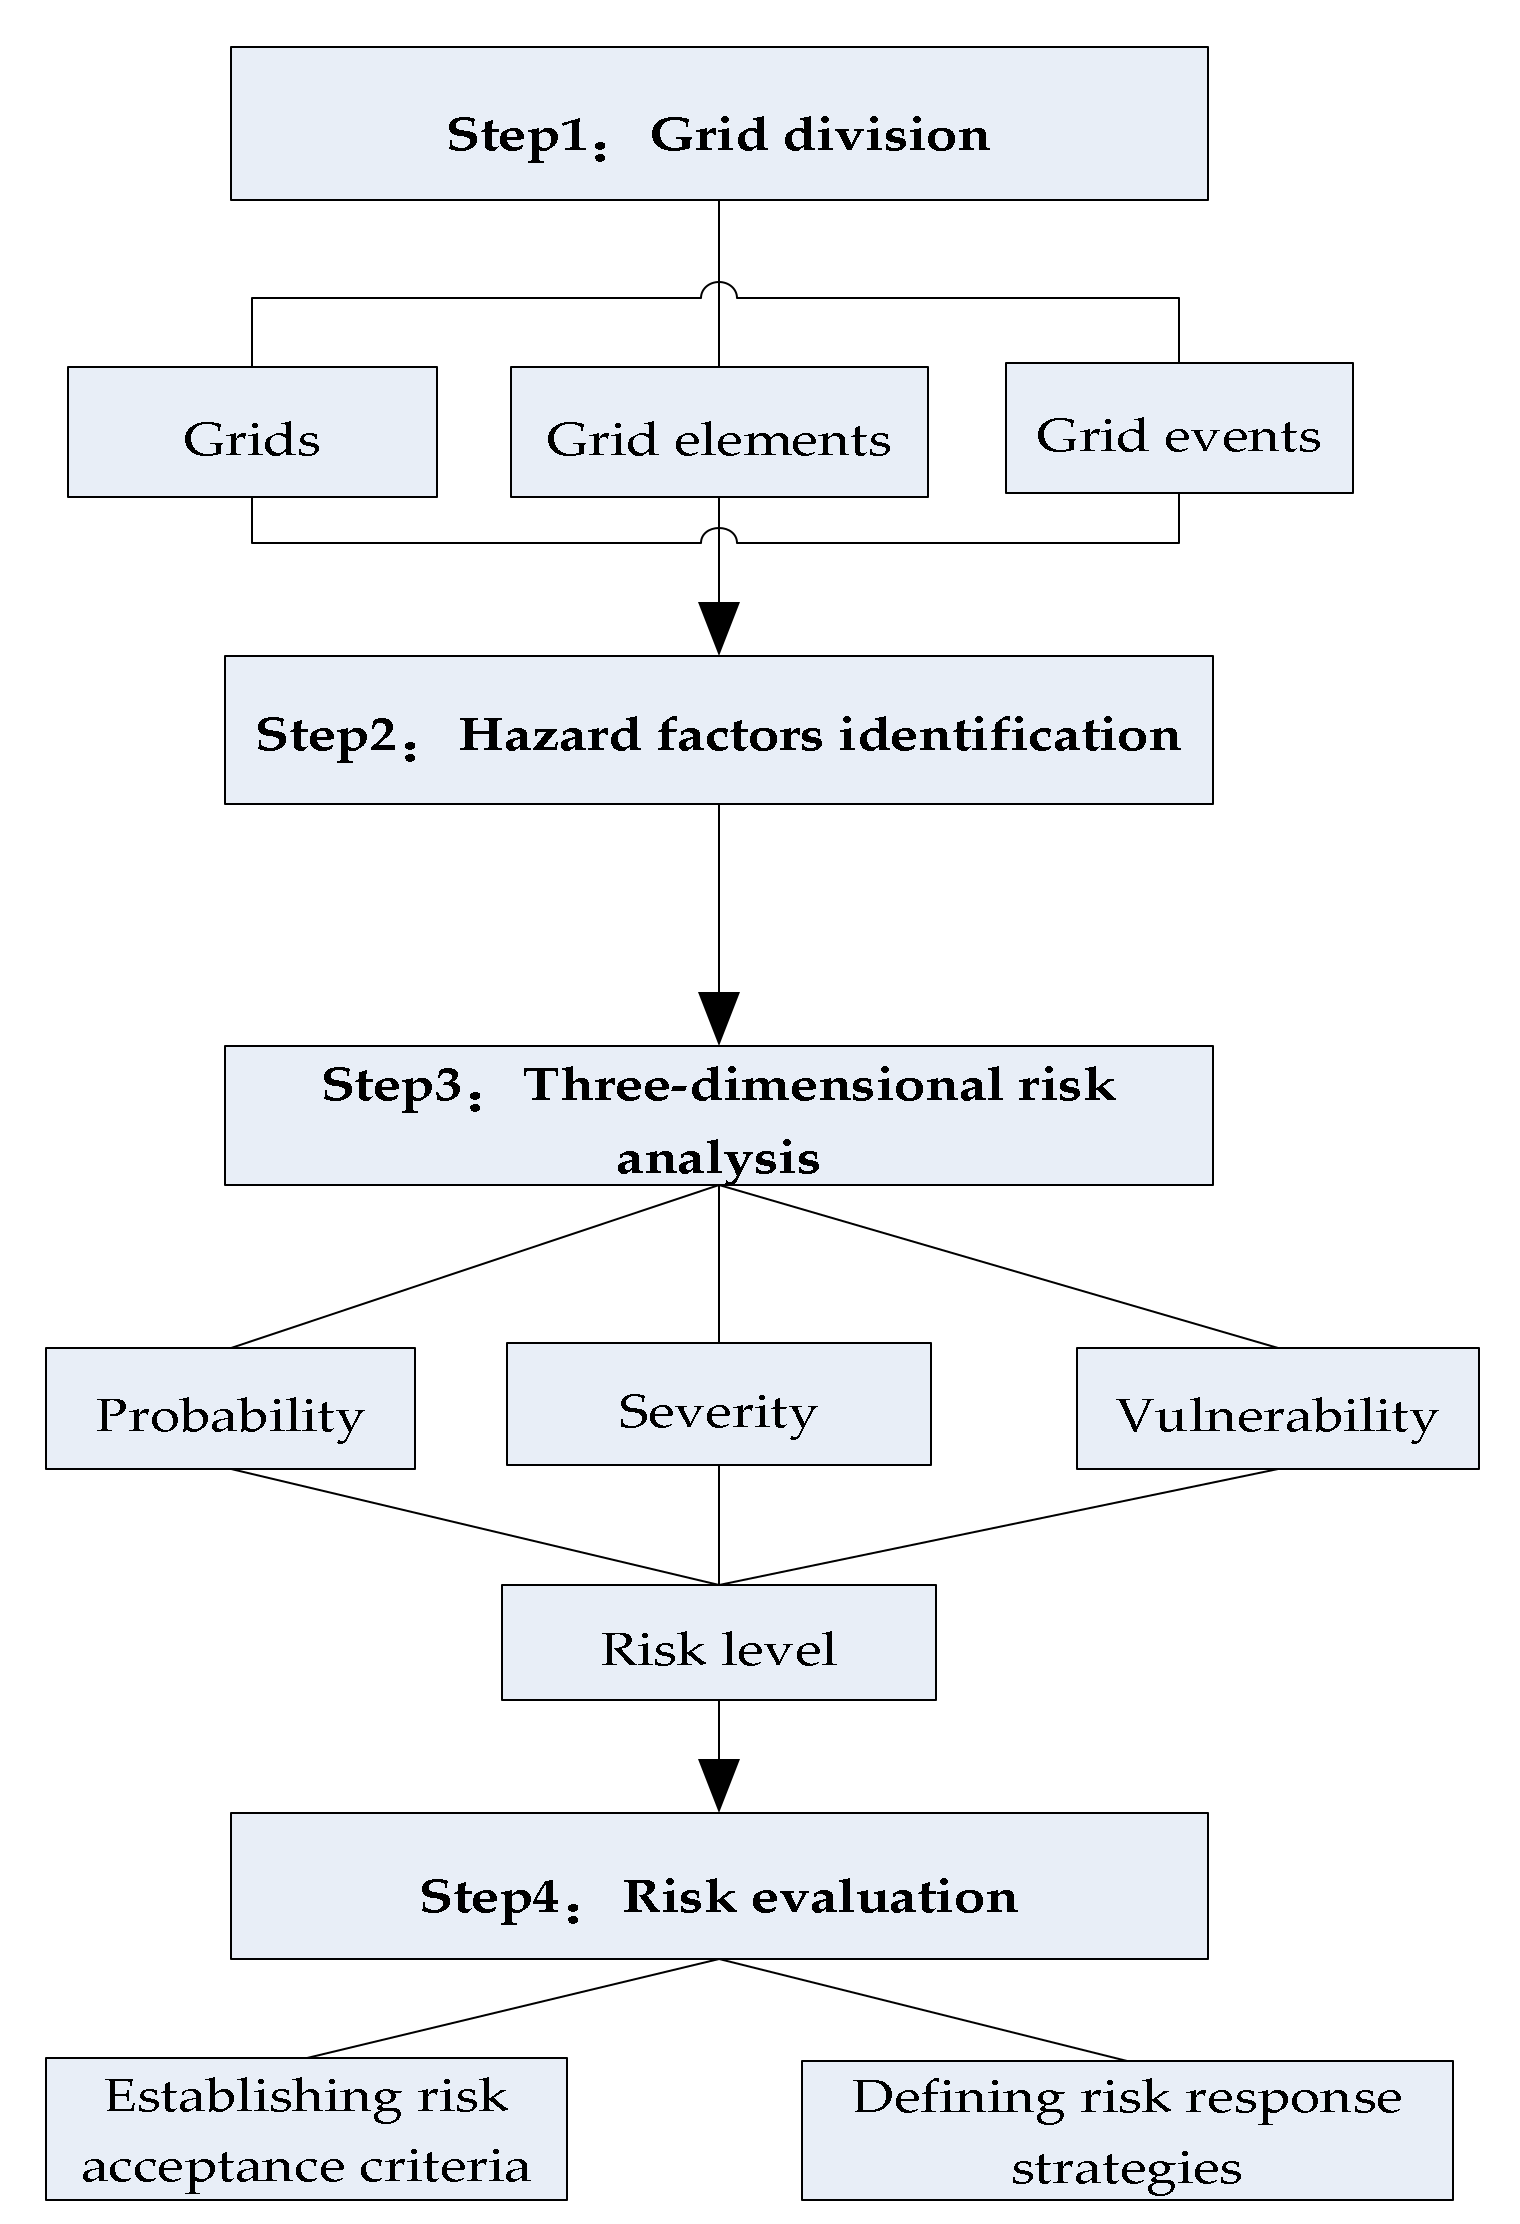
Figure 1. Grid-based three-dimensional risk assessment framework.
Processes 10 01162 g001
Figure 2. Grids, elements, and events interrelation.
Processes 10 01162 g002
Figure 3. Railway station grid division; 1, 2, 3, 4, 6 (in the middle of the picture) represent tracks; 1–16 (at both ends of the picture) represent turnouts.
Processes 10 01162 g003
Figure 4. The code structure of the train operation department grid.
Processes 10 01162 g004
Figure 5. The code structure of grid elements in the train operation department.
Processes 10 01162 g005
Figure 6. The code structure of grid events in the train operation department.
Processes 10 01162 g006
Figure 7. Typical ANP hierarchy.
Processes 10 01162 g007
Figure 8. The location of Huangyangcheng station.
Processes 10 01162 g008
Figure 9. Network structure diagram of the hazard factors in the grid G H .
Processes 10 01162 g009
Table 1. Vulnerability-related concepts.
Organizations, Institutions, or ScholarsConcepts
ISO [21]The inherent nature of something that is sensitive to a risk source that can lead to a consequential event.
Turner [22]The extent to which a particular system, subsystem, or component of a system may be harmed by exposure to hazards, pressures, or disturbances.
Sarewitz et al. [23]A representation of the intrinsic properties of the system, which are the source of potential damage and have nothing to do with the probability of risk events occurring.
Table 2. Typical hazard factors of the train operation department.
Main CategoriesSubclassHazard Factors
Personal factorsPsychological factorsObsessive-compulsive symptoms
Sensitive to interpersonal relationship
Physiological factorssomatization
Professional qualityBusiness performance was not up to standard
Low rank of professional title
Low education levels
Environment factorsNatural environment factorsBlizzard weather
Foggy weather
High temperature and heat
Low temperature and extreme cold
Operating environment factorsThe working site conditions are inconsistent with the standards
Poor lighting, ventilation, temperature, and other post conditions
Social environment factorsPoor working conditions after holidays
Negative public opinion
Poor public safety environment
Equipment factorsDesign and manufacturing factorsPoor equipment performance
Use and maintenance factorsEquipment failure
Untimely maintenance
Incomplete or invalid spare parts
Management factorsRegulatory factorsUnscientific safety management system
Nonstandard operation standards and processes
Site management factorsThe emergency operation organization is not in place
Inadequate performance of safety inspection
Evaluation and supervision factorsPerformance evaluation is not standardized
Imperfect employment mechanism
Table 3. Probability level of safety behavior risk of the transportation system.
Language DescriptionFrequency RangeAverage RangeQualitative Estimate (Number/Year)Probability RangeGrade
Remote1 in 35 years to 1 in 175 years1 in 100 years0.01 [ 0 , 10 4 ) 1
Rare1 in 7 years to 1 in
35 years
1 in 20 years0.05 [ 10 4 , 10 3 ) 2
Infrequent1 in 1.75 years to 1
in 7 years
1 in 4 years0.25 [ 10 3 , 10 2 ) 3
Occasional1 in 3 months to 1
in 1.75 years
1 in 9 months1.25 [ 10 2 , 10 1 ) 4
Regular1 in 20 days to 1 in 3 months1 in 2 months6.25 [ 10 1 , 1 ] 5
Table 4. Severity level of safety behavior risk of the transportation system.
Language DescriptionQualitative DescriptionCasualty EstimateQualitative Estimate (Number/Year)
MinorMinor injury0.0051
MarginalMultiple minor injuries0.0252
ModerateSingle serious injury0.1253
SevereMultiple serious injuries
or single fatal injury
0.6254
CatastrophicTwo to five fatal injuries3.1255
Table 5. Vulnerability level of the train operation department safety behavior risk.
Language DescriptionDescriptionValue of Number ScaleScale Value
TeenyWeak feedback to the coupling effect[1.00, 1.10)1
SmallSlight feedback to the coupling effect[1.11, 1.20)2
MediumLittle reaction to the coupling effect[1.21, 1.30)3
BigObvious response to the coupling effect[1.31, 1.50)4
LargeStrong reaction to the coupling effect[1.51, 2.00)5
Table 6. Risk acceptance criteria of the transportation system.
Risk ScoresRisk CategoryColorDescription
[3, 6]NegligibleGreenRisk is acceptable with/without the agreement of the railway authority
[7, 9]TolerableYellowAcceptable with adequate control and with the agreement of the railway authority
[10, 12]UndesirableOrangeShall only be accepted when risk
reduction is impracticable and with the agreement of the railway authority
[13, 15]IntolerableRedRisk must be reduced in exceptional circumstances
Table 7. Hazard factors of “the assistant watchman did not appear as required”.
Main CategoriesHazard Factors
Personal factors Obsessive-compulsive symptoms A 1
Somatization A 3
Business performance was not up to standard A 4
Environment factors Low temperature and extreme cold A 10
Poor lighting, ventilation, temperature, and other post conditions A 12
Equipment factors Equipment failure A 18
Management factors Unscientific safety management system A 20
Inadequate performance of safety inspection A 22
Table 8. The hazard factor data set of “the assistant watchman did not appear as required”.
Hazards FunctionsData Induced
Intensity
Data Sources
Obsessive symptom, A 1 Y T G = 0.01 , 3.9 n 5 0.008 , 3.3 n 3.8 0.006 , 2 n 2.9 0.004 , 1.62 n < 2 0 , n < 1.62 Y T G :   At   time   interval   T ,   the   risk - induced   intensity   of   the   hazard   factor   in   grid   G . n :   Obsessive - compulsive   factor   score . Symptom Check List-90 (SCL-90) test
n = 2.5
0.006Shenshuo Railway “SCL-90 Mental Health Self-assessment scale” survey data, staff physical examination reports
Somatization, A 3 Y T G = 0.02 , 3.9 n 5 0.01 , 3.3 n 3.8 0.006 , 2 n 2.9 0.003 , 1.37 n < 2 0 , n < 1.37 Y T G :   At   time   interval ,   the   risk - induced   intensity   of   the   hazard   factor   in   grid   G . n :   Obsessive compulsive   factor   score . Symptom Check List-90 (SCL-90) test n = 1.60.003Shenshuo Railway “SCL-90 Mental Health Self-assessment scale” survey data, staff physical examination reports
Business performance was not up to standard, A 4 Y T G = 100 a 10000 , 80 < a < 90 0 , a 90 Y T G :   At   time   interval ,   the   risk - induced   intensity   of   the   hazard   factor   in   grid   G . n :   Business   examination   scores   of   the   post   staff   in   grid   G . Monthly safety production knowledge test score of 850.0015Monthly safety production knowledge examination result of Shenshuo Railway. The examination score of 80 was qualified.
Low temperature and extreme cold, A 10 Y T G = 0.01 ,   the   lowest   temperature   dropped   below   20   ° C   in   24   h . 0.006 ,   the   lowest   temperature   dropped   below   10   ° C   in   24   h . 0.002 ,   the   lowest   temperature   dropped   below   0   ° C   in   24   h . Y T G :   At   time   interval   T ,   the   risk   induced   intensity   of   the   hazard   factor   in   grid   G . The lowest temperature of the day was −24 °C.0.01Meteorological statistics for Shenmu City
Poor lighting, ventila-tion, temperature, and other post conditions, A 12 Y T G = 0 . 003 , job   conditions   are   not   available . 0 , others . Y T G :   At   time   interval   T ,   the   risk - induced   intensity   of   the   hazard   factor   in   grid   G . Poor lighting conditions in the station at night0.003Daily safety inspection data and hidden trouble investigation data of Shenshuo Railway
Equipment
failure, A 18
Y T G = d 1000 D , d D 2 d 100 D , D 2 < d < D 0.01 , d D Y T G : At   time   interval   T ,   the   risk - induced   intensity   of   the   hazard   factor   in   grid   G . d :   Equipment   failure   time   ( day ) . D :   Equipment   failure   threshold ( day ) . The battery capacity was insufficient, which affected the intercom call reliability0.004Equipment maintenance register
Unscientific safety management system, A 20 Y T G = 0.003 , Operating   standards   and   procedures   are   not   standardized . 0 , others . Y T G :   At   time   interval   T , the   risk   induced   intensity   of   the   hazard   factor   in   grid   G . No mobile phone management system0.003Shenshuo railway quarterly acceptance inspection data statistics, safety audit
Inadequate performance of safety inspection, A 22 Y T G = t 1 - t 2 10000 D , t 1 - t 2 D 2 t 1 - t 2 1000 D , D 2 < t 1 - t 2 D 0.02 , t 1 - t 2 > D Y T G : At   time   interval   T ,   the   risk - induced   intensity     of   the   hazard   factor   in   grid   G . t 1 t 2 :   Difference   between   the   specified   inspection     times   and   the   actual   inspection   times . D :   Threshold   between   the   specified   inspection   times   and   the   actual   inspection   times   ( day ) . Inspection was done twice during the working week0.02Shenshuo railway quarterly acceptance inspection data statistics, safety audit
Table 9. The weight value of the hazard factors in the grid G H .
HazardsNormalized by ClusterLimiting
Obsessive-compulsive symptom A 1 0.370.19
Somatization A 3 0.220.12
Business performance was not up to standard A 4 0.410.21
Low temperature and extreme cold A 10 0.610.10
Poor lighting, ventilation, temperature, and other post conditions A 12 0.390.06
Equipment failure A 18 0.200.06
Unscientific safety management system A 20 0.330.11
Inadequate performance of safety inspection A 22 0.470.15
Table 10. Direct influence matrix of the hazard in the grid G H .
Hazard Factors A 1 A 3 A 4 A 10 A 12 A 18 A 20 A 22
A 1 02201000
A 3 10200002
A 4 21000012
A 10 34101102
A 12 23000101
A 18 01001000
A 20 32100102
A 22 41200100
Table 11. The sum of rows, the sum of columns, and coupling strength values of the hazards in the grid G H .
Row SumColumn SumCoupling Strength
0.551.561.39
0.571.391.36
0.681.061.32
1.2800
0.720.331.19
0.220.361.10
0.960.141.19
0.820.971.33
Table 12. The risk level of “the assistant watchman did not appear as required”.
Grid CodingRisk SizeRisk Level
0001004401000302020110Undesirable
0001004401000303020111Undesirable
000100440100030402018Tolerable
000100440100030502017Tolerable
000100440100030602016Negligible
000100440100030702017Tolerable
000100440100030802019Tolerable
0001004401000309020110Undesirable
000100440100031002018Tolerable
Table 13. Two-dimensional risk matrix acceptance criteria.
Risk ScoresRisk CategoryDescription
[1, 6]NegligibleRisk is acceptable with/without the agreement of the railway authority
[7, 12]TolerableAcceptable with adequate control and with the agreement of the railway authority
[13, 18]UndesirableShall only be accepted when riskreduction is impracticable and with the agreement of the railway authority
[19, 25]IntolerableRisk must be reduced in exceptional circumstances
Table 14. Violation statistics of “the assistant watchman did not appear as required”.
DateTimeThree Violations DescriptionInspection Situation
9 January 20204:30Sleeping on dutyYellow notice
20 February 202023:10Trains were not received in timeWhite notice
15 March 202017:00The busy board was not filled in timelyWhite notice
3 April 202015:00Failed to use the intercom to answer the call in timeWhite notice
17 May 202013:00The busy board was not filledYellow notice
9 July 2020 4:30Dozed off on dutyWhite notice
22 August 20207:20Trains were not received in timeWhite notice
9 September 20202:30Sleeping on dutyYellow notice
21 October 202010:15Failed to use the intercom to answer the call in timeWhite notice
5 November 202013:30Dozed off on dutyWhite notice
Publisher’s Note: MDPI stays neutral with regard to jurisdictional claims in published maps and institutional affiliations.