Article

Microwave Pre-Treatment of Model Food Waste to Produce Short Chain Organic Acids and Ethanol via Anaerobic Fermentation

by
Serena Simonetti
1,
Claudia Fernández Martín
1,2 and
Davide Dionisi
1,*
1
Chemical & Materials Engineering Research Group, School of Engineering, University of Aberdeen, Aberdeen AB24 3UE, UK
2
Centre for Energy Transition, University of Aberdeen, Aberdeen AB24 3FX, UK
*
Author to whom correspondence should be addressed.
Processes 2022, 10(6), 1176; https://doi.org/10.3390/pr10061176
Submission received: 16 May 2022 / Revised: 7 June 2022 / Accepted: 9 June 2022 / Published: 12 June 2022
(This article belongs to the Section Environmental and Green Processes)

Abstract

:
As an alternative to conventional anaerobic digestion for methane production, anaerobic fermentation (AF) of organic matter can produce short chain organic acids (SCOAs) in a sustainable way. This study investigated the effect of microwave (MW) pre-treatment on the AF of model food waste to SCOAs and ethanol. The MW pre-treatment was investigated at three temperatures (120, 150 and 180 °C) and residence times (2, 5 and 8 min). The MW treatment gave a significant reduction in the pH and volatile suspended solids (VSS). The largest reduction in the VSS was 20%, indicating solubilisation of the organic matter. The latter was also confirmed by the increase, although it was not statistically significant, in the soluble chemical oxygen demand (COD) and soluble carbohydrates. In the fermentation batch tests, the total product yield was higher (17.5% COD COD−1) than for the untreated substrate (11.1% COD COD−1). An electricity price of GBP 0.06 kWh−1 would correspond to the market value of the additional SCOAs produced with the pre-treated substrate. Although this price is lower than the current business price of electricity in the UK, the MW pre-treatment could become economically feasible with scale-up effects and by using free excess electricity coming from renewable resources.

1. Introduction

Approximately one third of all food intended for human consumption is wasted or lost along the food supply chain, accounting for nearly 1.3 billion tonnes per year worldwide [1]. In the UK, 8.3 million tonnes per year of household food and drink is wasted, one third of it being unavoidable [2]. The consequences of these losses are economic and environmental, exploiting natural resources (e.g., land, water) and impacting biodiversity [3]. Among the current technologies for handling of food waste (FW) (anaerobic digestion (AD), composting, incineration and landfill), it has been estimated that AD has the lowest impacts on climate change [4,5,6]. AD is an industrial established technology that leads to biogas and digestate as final products, used as heat and power source and as biofertiliser. As alternative to biogas, under appropriate process conditions where methanogenesis does not occur, AD could be used to produce short chain organic acids (SCOAs), which are the intermediates of the digestion process. When the final products are SCOAs rather than methane, AD is often referred to as anaerobic fermentation (AF). SCOAs are currently mainly synthesised from petrochemical sources. Only a relatively small fraction of SCOAs is currently produced from microbial fermentation, and in those cases, pure cultures with glucose or sucrose as feed sources are used, thus competing with the food market. Because of their various applications as chemical building blocks in different industry fields, the economic value of SCOAs is higher than that of methane [7].
Pre-treatments of the feedstock have been investigated to increase the biodegradability of the organic matter and to increase the methane yield. Pre-treatments can be diverse and categorised as physical, chemical, and biological and can be applied alone or in combination [8]. Physical pre-treatments such as hydrothermal, microwave (MW) and ultrasonic have been investigated to improve the biodegradability of FW and optimise AD [9,10,11,12]. In contrast to other thermal pre-treatments, microwave heating has the advantage of being a fast and selective heating due to its different heating mechanism. In MW heating, electromagnetic energy is converted into heat, thanks to ionic conduction and dipole rotation. In particular, the polar macromolecules present in food waste align according to the electromagnetic field, causing a breaking of hydrogen bonds and disruption of cell walls, thus releasing intracellular matter [10,13]. Moreover, since microwave utilises electrical energy instead of heat, it can be easily powered by renewable energy sources such as wind or solar energy, thus making it a completely sustainable process. Due to fluctuations in the intensity of the primary resource, renewable electricity from wind or sun can generate peaks that exceed normal domestic and industrial usage, making excess or “curtailed” (wasted) electricity available at low cost or even for free [14]. Although the commercial application of MW pre-treatment in AD cannot be foreseen in the short term [15] and also in other industries any applications of MW are mainly still at the research and laboratory scale, there are some larger scale installations for a variety of uses including the pre-treatment of food waste, e.g., TorWave (100 kW, 1000 mm diameter, 1 t/h continuous processing), indicating that MW has the potential to become applicable to large-scale commercial plants [16].
Microwave irradiation has been shown to increase the solubilisation of lignocellulosic biomass up to 40% [17] and to increase the solubilisation of biomass and biogas production [18]. Studies on MW heating of food waste for AD have shown that temperature has more effect than the residence time [13]. Other studies investigated the effect of other factors such as the heating rate or the microwave power [10,11,18]. To the best of our knowledge, there is no study that has performed MW pre-treatment before AF with the target of producing organic acids. Two studies [19,20] analysed the organic acids as intermediate or by-products for the sole production of methane or hydrogen, one of which found no significant positive effect of microwave pre-treatment [20].
Our study investigated the MW pre-treatment on AF of model food waste to produce SCOAs and ethanol. We investigated the effect of MW temperature and residence time on pH, volatile suspended solids (VSS), volatile solids (VS), total chemical oxygen demand (TCOD), soluble chemical oxygen demand (SCOD), total carbohydrates (TC) and soluble carbohydrates (SC). We then used the feedstocks after MW pre-treatment in AF batch tests to produce SCOAs and compared the results with the feedstock without pre-treatment. In order to keep the process as sustainable and as technically and economically viable as possible (both in terms of energy and chemical use), in our AF experiments we used ambient temperature, uncontrolled pH and high concentration of substrate, as we did in our previous work [21].

2. Materials and Methods

2.1. Substrate and Inoculum

The substrate used for microwave treatments and batch runs was comprised of a solution of distilled water and the following substances: 72.1 g L−1 of organic wheatgrass powder, 45.7 g L−1 of soluble starch, 80.0 g L−1 of yeast extract, 26.0 g L−1 of peptone powder, 66.6 g L−1 of D-sucrose, and 52.6 g L−1 of oleic acid (tech. 90%). The substrate was prepared with the aim of reproducing the concentration of the main components (lipids, proteins, sugars, carbohydrates, and fibres) of unavoidable food and drink waste in the UK [22]. After preparation, the substrate was stored frozen and defrosted prior to use. The inoculum used in the batch tests was an anaerobic mesophilic sludge collected from an anaerobic digester plant in Turriff, Scotland (GaskFarm), fed on fish, cow, and bakery waste. It was stored at 4°C and filtered for the removal of large solids with a Buchner funnel prior to the inoculation into the reactors.

2.2. Microwave Treatments

The substrate was first tested for compatibility with MW using the purpose-built Dielectric properties measurement kit made by the ITACA Institute (Valencia Polytechnic University, Spain), with a frequency range of 2003–2005 MHz and at room temperature. Firstly, 2 mL of the untreated substrate were poured in a quartz cuvette and inserted in the instrument. The dielectric properties (dielectric constant and loss factor) were recorded for 205 s. Average values were calculated. MW treatment was tested at three different temperatures and three different times (Table 1). The selected values were based on the best solubilisation values found in the literature. Based on the review of Scherzinger et al. [13], temperatures up to 120 °C do not cause any significant substrate solubilisation, while a temperature of 175 °C results in increased solubilisation of proteins, sugars and humic-like substances, and higher methane production; short residence times (range investigated 10–40 min) are preferred to reduce the formation of toxic compounds. On the other hand, temperatures above 175 °C and long residence times (above 27 min with hydrothermal treatment) can cause the production of inhibitory compounds (melanoidins) via Maillard reaction [23,24], which can be accelerated by microwave heating starting from a temperature of only 85 °C and a reaction time of 5 min [25]. Hence, a temperature range of 120–180 °C and a residence time range of 2–8 min were chosen for our experimental design. Multilevel factorial design was used to randomise a total of 9 experiments run in duplicate. A control without microwave treatment (MW0) was tested in duplicate; hence, a total of 20 experiments were deployed. The microwave equipment used was the FlexiWAVE (Milestone Srl, Sorisole (BG), Italy), a platform for microwave synthesis, which was used with the High-Pressure setup. Five vessels with a maximum volume of 100 mL, filled with 40 mL of substrate each, were used for the experiments. The maximum working pressure was 100 bar. The vessels were placed on a rotating plate which allowed for homogenous heating. One of the vessels constituted the reference, which contained the temperature sensor with fibre optic for temperature control, whose content was discarded and not used for the analysis and for the batch reactors. The vessels were made of TFM Teflon, a chemically modified PTFE, and provided with a system which releases gases in a controlled way in case of overpressure. The runs were programmed with a power upper limit of 1000 W and a ramp of 10 min with varying heating rate to reach the desired temperature. Once the heating cycle was completed, the vessels were left in the microwave cavity to cool down via ventilation for 30 min, programmed via the terminal. After this, if necessary, the samples were allowed to further cool down at room temperature until they reached a temperature of around 30 °C, after which the vessels were removed from the cavity and opened. It is possible that the length of the cooling process and the temperature of the samples during cooling also contributed to the observed effect of the MW pre-treatment. Further investigation is needed to ascertain any effects of the cooling process on the results. No water losses due to evaporation were observed during the experiments, as the system was closed and no opening of overpressure valves was observed. A constant operational volume before and after microwaving was therefore assumed.

2.3. AF Batch Tests

AF reactors were run in duplicate with substrate without MW pre-treatment and after MW pre-treatment at 150 °C for 2 min (corresponding to pre-treatment MW4). Experiments were performed with lab-scale hermetically closed batch reactors with an operating volume of 200 mL, filled with 190 mL of substrate and 10 mL of inoculum. In a batch test run with inoculum and no substrate, no organic acids were detected (results not shown). Likewise, fresh substrate alone did not contain any fermentation products, as it was expected because of its synthetic composition. Due to the high concentration of substrate and to the rapid decrease in the pH due to organic acids accumulation, methanogenesis was inhibited without the need to add inhibitors or inoculum pre-treatment, as observed in our previous work [21]. The reactors were flushed with nitrogen for 10 min and sealed. They were continuously stirred via magnetic stirrers (UC151, Stuart) and bars at 410 rpm. Two ports were used for sampling and temperature measurement via thermocouple. The reactors were sampled twice a week and run for 21 days. Temperature and pH were not controlled.

2.4. Analytical Methods

Fermentation products (ethanol, lactic acid, acetic acid, propionic acid, n- and iso- butyric acid, n- and iso- valeric acid, n- and iso- caproic acid) were analysed with a gas chromatograph (Trace 1330, from Thermo Fisher Scientific, Waltham, USA) [26]. The total and volatile solids (TS and VS), and the total and volatile suspended solids (TSS and VSS) were analysed using the method APHA-AQQA-WPCF 1991 [27]. Total and soluble COD (SCOD, TCOD) were measured according to the method APHA 5220 D, using COD kits (Spectroquant COD cell test, Merck Millipore, Burlington, MA, USA). Total and soluble carbohydrates (TC and SC) were analysed using the anthrone method [28]. Measurement of pH was performed using a pH meter (FiveEasy™ F20, Mettler Toledo, Columbus, OH, USA). Further information on the analytical methods is described in our previous study [21]. For the study of the morphology of the samples with and without microwave treatment, high resolution Field Emission Scanning Electron Microscopy (FESEM) was applied. 2 mL of the untreated substrate and 2 mL of the MW pre-treated sample corresponding to MW4 were vacuum filtered on a glass microfibre filter grade GF/F, porosity 0.6–0.8 µm, after which they were air dried for 24 h and stored in a desiccator until use. The cake was scraped from the supporting filter and used in a Carl Zeiss GeminiSEM 300.

2.5. Statistical Analysis

One-way ANOVA was performed using the software Minitab 20 to investigate the significancy of the effects of microwave temperature and time over pH, VS, VSS, TC, SC TC−1feed, TCOD, SCOD TCOD−1feed. The resulting p-values, obtained from the test, indicate the likelihood of finding the observed result when the null hypothesis is true (no statistical differences between the observations). A value of p < 0.05 indicates that the null hypothesis is rejected, hence there is a statistically significant difference between the observations. The control MW0 was included in the analysis, assuming a temperature value of 20 °C and treatment time of 0 min.

2.6. Energy Applied and Product Market Value

The energy applied during the MW pre-treatment was calculated from the integral of the power vs. time, where the power input was obtained from the instrument. An example of the profiles of power and temperature vs. time for MW4 is reported in the Supplementary Materials (Figure S1). The market prices of the fermentation products (ethanol, lactic acid, acetic acid, butyric acid) were obtained from the literature [7] and converted to GBP kg−1. Table 2 shows the market prices of the products assumed in this study. The average business electricity price in the UK was obtained from the website “Business Electricity Prices” [29], based on Q4 2021 data (source: UK Government), for a very large business size. Its value was 17.22 p per kWh.

3. Results and Discussion

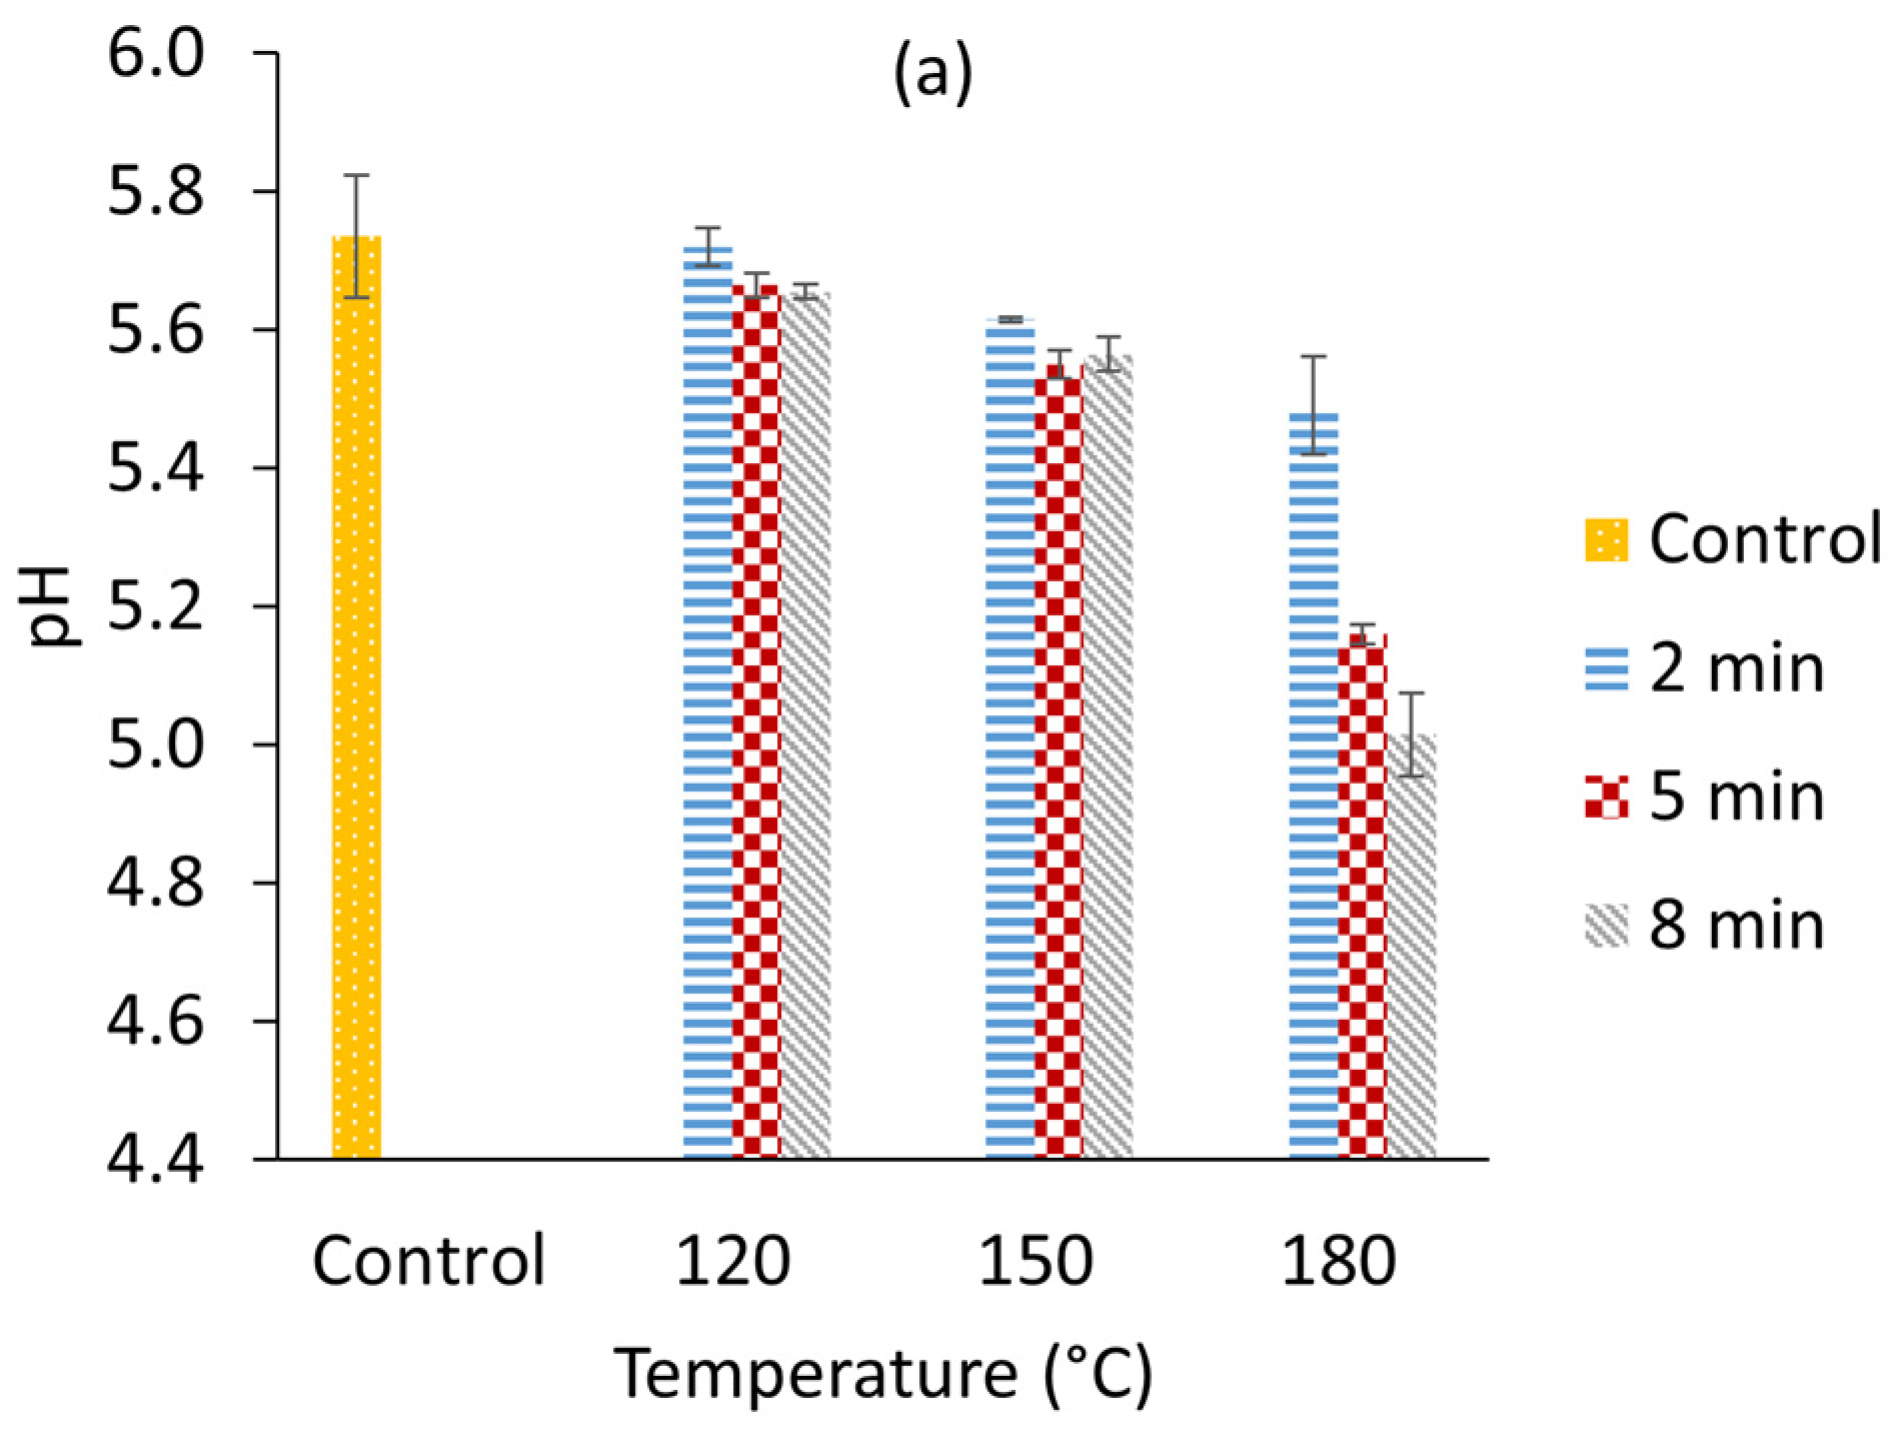
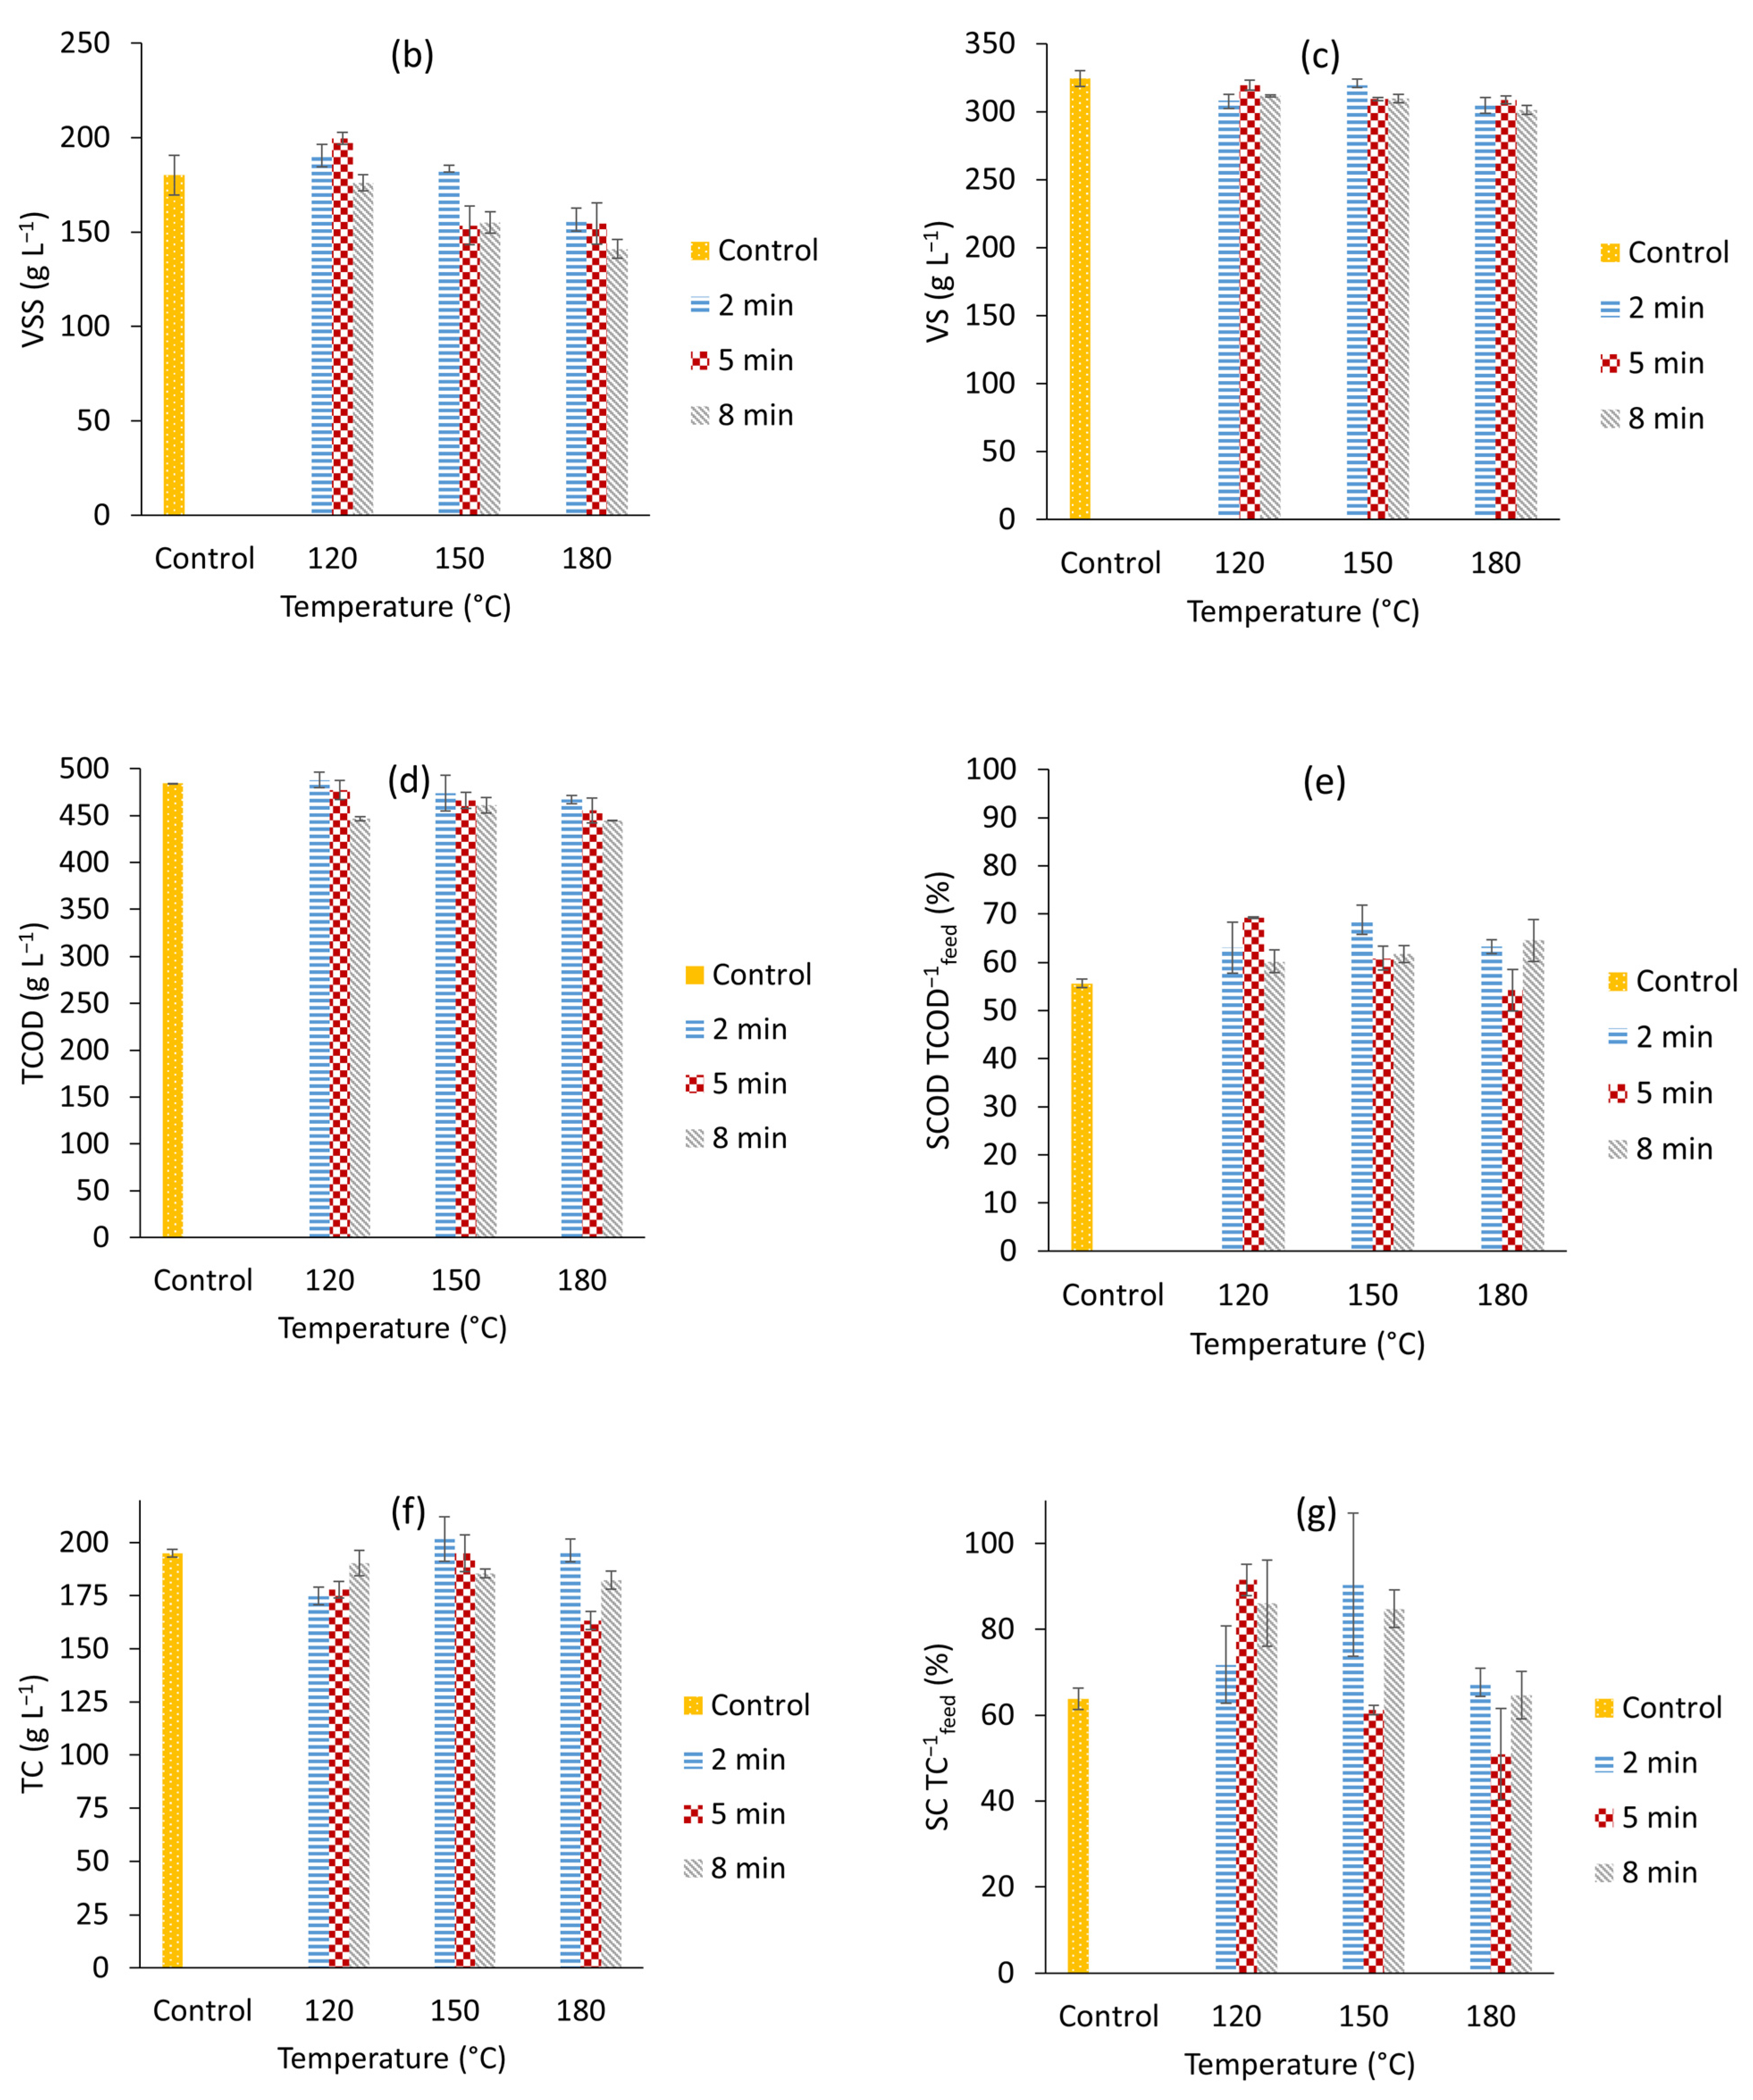
3.1. Microwave Pre-Treatments at Different Temperatures and Times

Data on dielectric properties of the materials used with MW pre-treatment are needed in order to estimate their behaviour under MW irradiation (MW absorbance (dielectric constant ε’) and microwave energy conversion into heat (loss factor, ε’’)), and to understand its mechanism and scalability [30]. The substrate proved to be suitable for MW pre-treatment by showing a dielectric constant of 52.4 and a loss factor of 22.4, close to those of pure water (ε’ = 78.24, ε’’ = 7.54 at 23 °C and 2.00 GHz) and methanol (ε’ = 20.96, ε’’ = 11.77 at 20 °C and 2.45 GHz) [31,32]. Samples pre-treated at 180 °C had a darker brown colour and strong smell, possibly deriving from the formation of melanoidins and other molecules. Figure 1 shows the results of the MW treatment, comparing them to the untreated feedstock (control). One-way ANOVA shows a highly significant effect of the temperature on the pH (p < 0.001). The pH (Figure 1a) decreases with the temperature, from the highest value of 5.74 ± 0.088 of the control to the lowest value of 5.02 ± 0.060 of the experiment run with highest temperature and longest residence time. The decrease in the pH with increasing pre-treatment temperature is reported in several literature studies investigating MW or other thermal treatments (i.e., hydrothermal) and is reported to be caused by the formation of organic acids [18,19,33]. The effect of time on the pH is not statistically significant, although the pH slightly decreases for longer pre-treatment times and its decrease is more evident at the highest temperature, in accordance with the report by Scherzinger et al. [13]. The effect of the pre-treatment temperature on the VSS is highly significant (p = 0.005). VSS decrease with increasing temperature, while the value of the control is in the range of the treatments at 120 °C (Figure 1b). The effect of time is not significant, although it seems to generally cause a slight decrease in VSS. The lowest concentration of VSS was observed in MW9, with a value of 141.0 ± 4.95 g L−1, which corresponds to a 20% decrease compared to the control. Differences in VS between temperatures are slightly significant (p = 0.041), and a slight decrease can be observed at 150 and 180 °C, which is similar to the results for the VSS (Figure 1c). Yin et al. observed likewise an increase in VS from 120 to 140 °C, after which VS decreased with increasing temperatures, indicating a conversion to smaller molecules such as organic acids, monosaccharides and furans [33]. In the range of temperatures investigated in our work, VS seem to decrease with the pre-treatment time as well, although not in a statistically significant way. The lowest VS values were reached at 180 °C and 8 min of treatment (301.3 ± 3.30 g L−1), representing a reduction of 7% compared to the control. A statistically significant decrease in VS with time and power in MW pre-treatments has been reported in the literature [11]. No significant effects of time and temperature on the TCOD were found. Figure 1d shows a slight decrease in TCOD with both time and temperature, although being within the range of the standard error. Srinivasan et al. [34] found similar results although at lower temperatures (90 and 110 °C). The decrease in the TCOD can be attributed to the formation of volatile organic compounds that would be released during the treatment, as hypothesised by Mudhoo et al. [11]. Other studies report the absence of a trend of the TCOD with temperature, time, or power, but no univocal explanation was found [18,34]. Figure 1e shows the ratio of the SCOD after MW treatment and the TCOD of the untreated feed. The ANOVA shows that no statistically significant differences are found with neither temperature nor time (p > 0.05). However, most MW treatments gave a ratio that is higher than the control (55.6 ± 0.87%). The highest ratio between SCOD at the end of the pre-treatment and TCOD of the untreated feedstock is observed in reactors MW2 and MW4, respectively, 69.2 ± 0.15% and 68.7 ± 3.01%. In the literature, soluble COD was found to increase with microwave treatment in several studies run with food waste or other organic wastes [10,19,20,34,35]. TC are not significantly affected by the two variables temperature and time. Instead, temperature has a slight significant effect (p = 0.049) on the solubilisation of carbohydrates, measured by the ratio SC TC−1feed (Figure 1g). The ratio is generally higher at all temperatures compared to the control. Similar to what was observed with the soluble COD (Figure 1e), the data overall show some solubilisation of the carbohydrates. The highest values of SC TC−1feed were observed in MW2 and MW4, 91.5 ± 3.65% and 90.4 ± 16.67%, respectively. In a similar temperature range (100–200 °C), using hydrothermal treatment, the solubilisation of COD and carbohydrates increased with the temperature, and the best results were achieved at 180 °C [33].

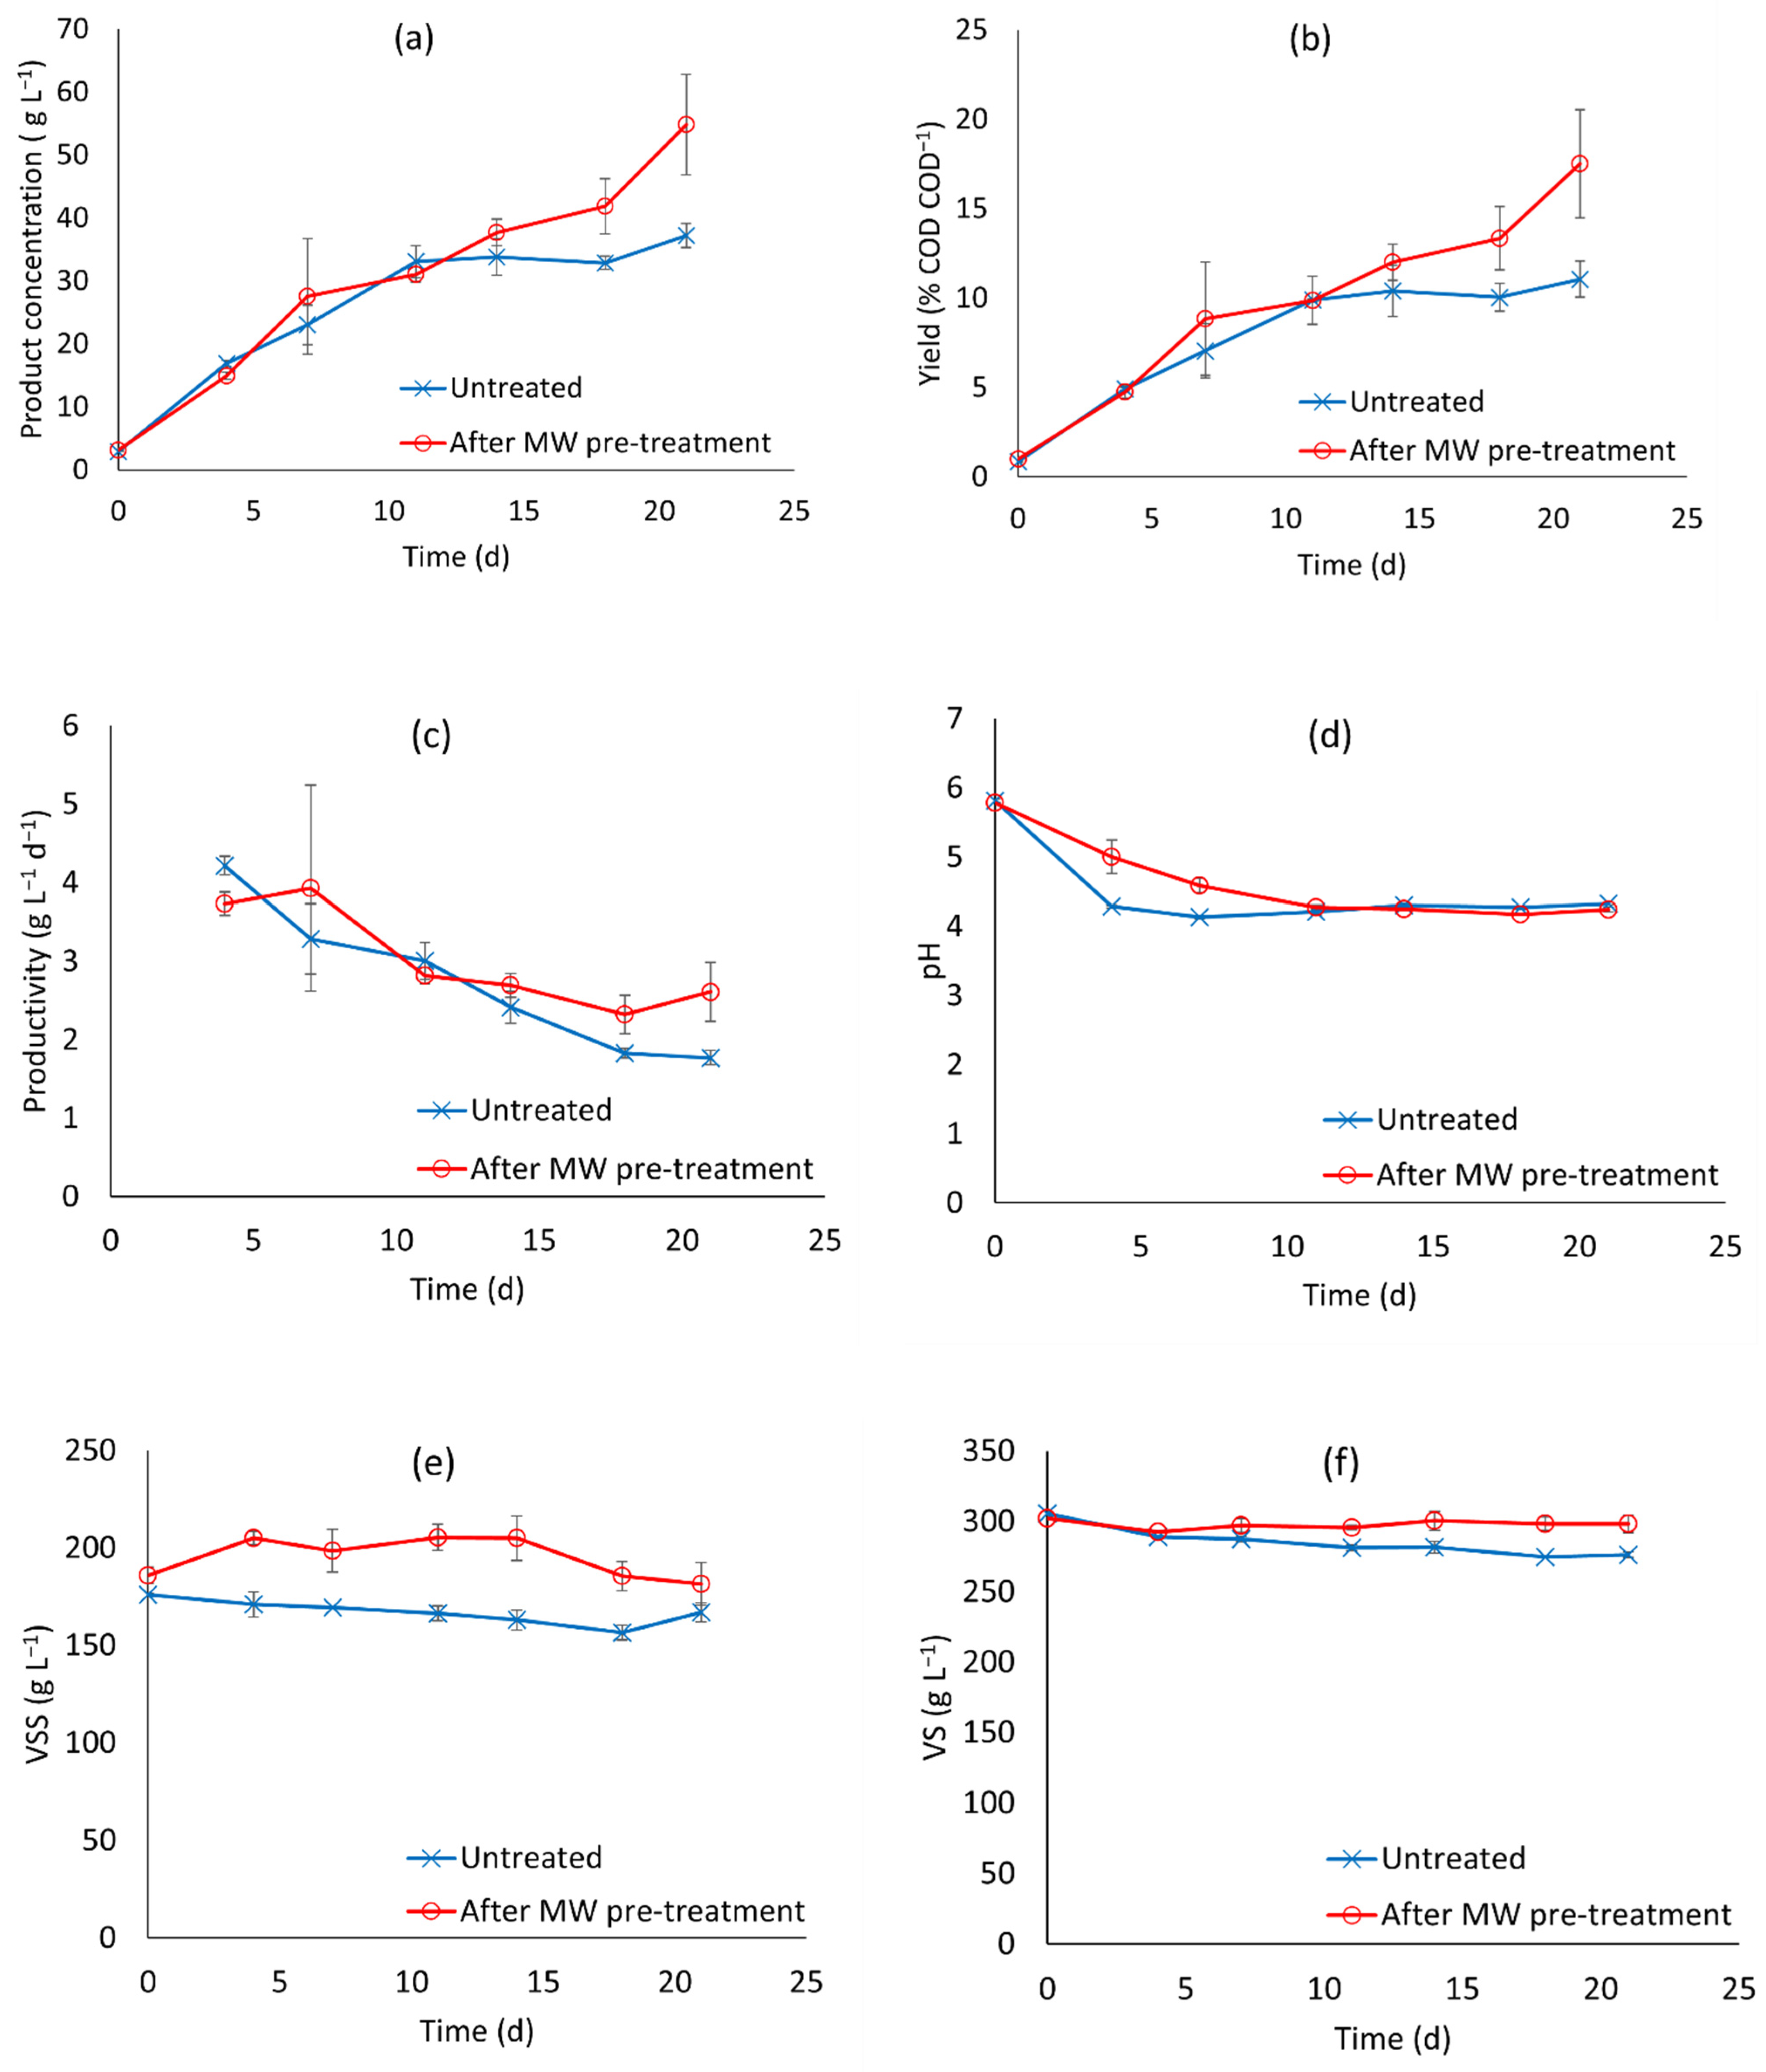
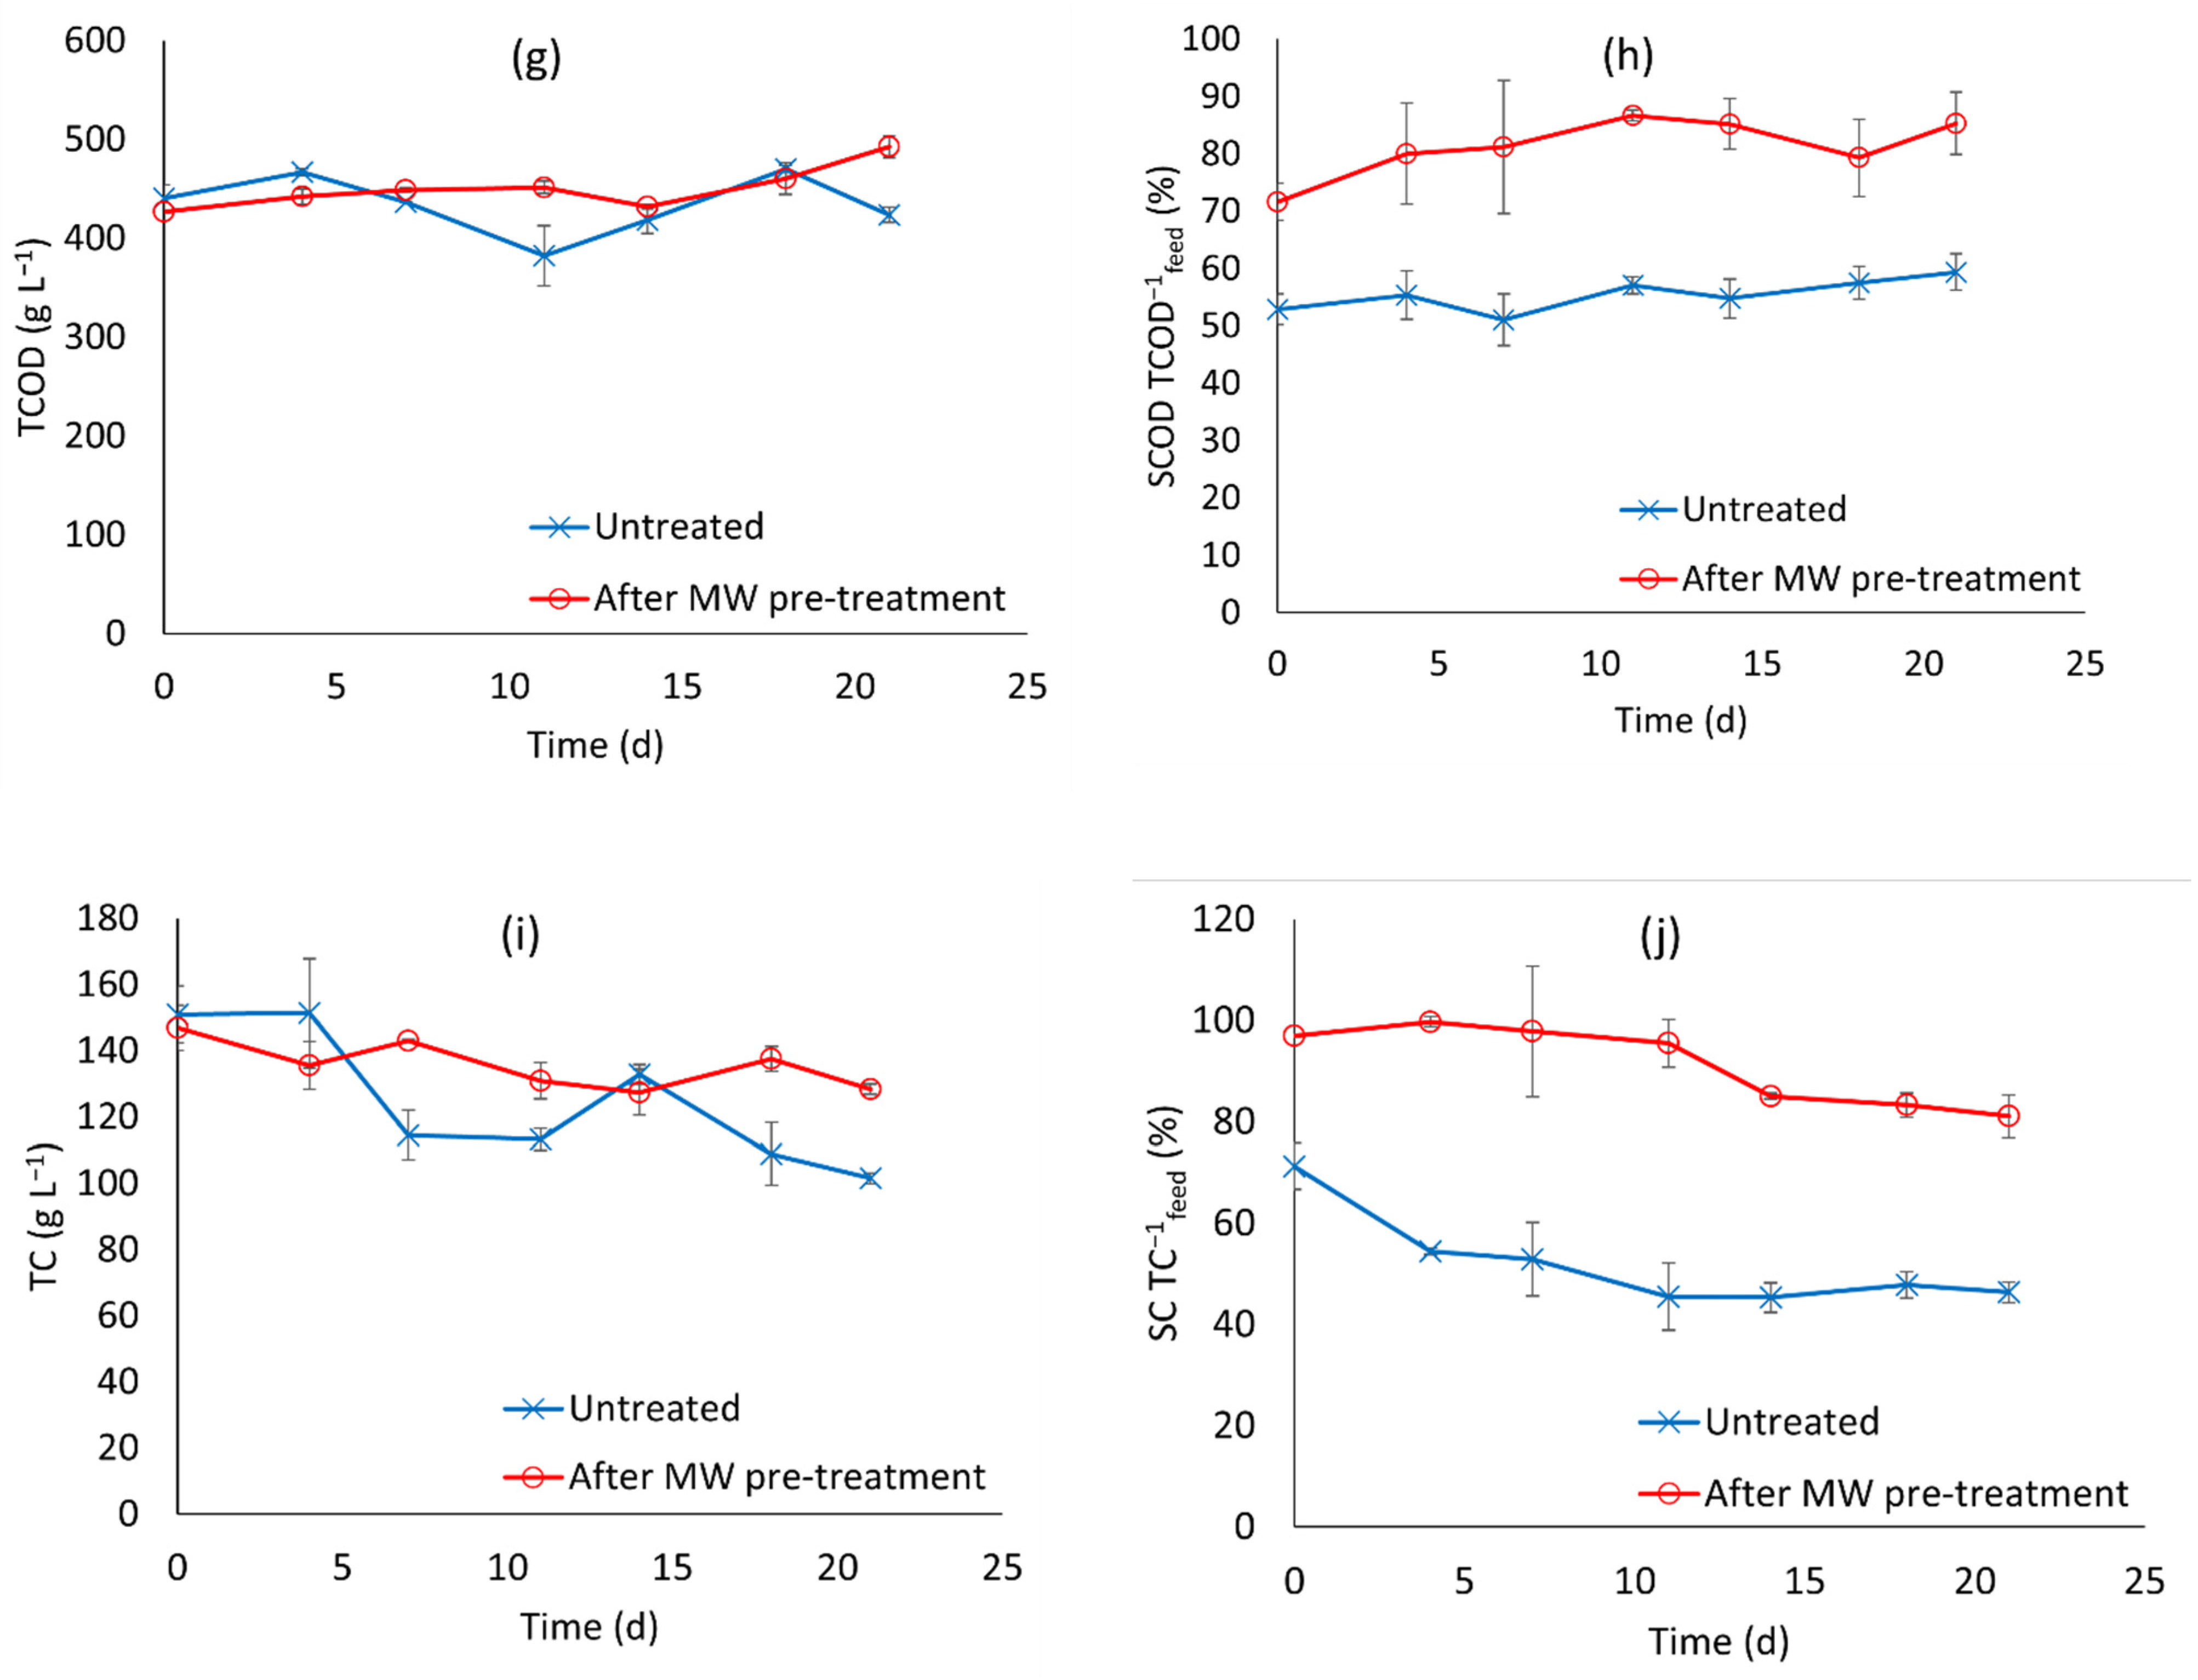
3.2. Anaerobic Fermentation Tests

Pre-treatment MW4 (150 °C, 2 min) was chosen for the AF batch tests. The choice of MW4 was based on this pre-treatment having among the highest values of COD and carbohydrates solubilisation (Figure 1e,f), which is expected to enhance the fermentation process, and on the fact that temperatures between 150 and 175 °C have been reported in the literature to enhance the digestibility of the substrate [13,18,35].
Figure 2 reports the results of the AF experiments. Final product concentration (Figure 2a) was higher with pre-treatment than in the control (without pre-treatment), with values of 54.8 ± 7.96 g L−1 and 37.2 ± 1.91 g L−1, respectively. The experiment with pre-treatment started to perform better after 11 days, with increasing product concentration, while the experiment without pre-treatment plateaued. Production with the pre-treated feed kept increasing until the final day, hence it is possible that the maximum production was not reached yet in the 21 days of the run. No differences in the lag phase were observed with or without pre-treatment, in contrast to what was hypothesised by Scherzinger [13]. Li et al. [36] observed a reduction in the lag phase of 2 days in the production of lactic acid from a thermally pre-treated food waste. Among several temperatures investigated, 140 °C resulted in the highest lactic acid production (29.55 g L−1). Because of the faster lactic acid production at 170 °C than 140 °C, a temperature of 170 °C resulted in the best productivity corresponding to the highest product concentration (9.59 g L−1 d−1). The maximum lactic acid concentration was reached after 4 days, then it declined because pH was adjusted at 7.5, favourable for the conversion into volatile fatty acids. In our study, however, 170 °C was not investigated, showing the need for further investigation in a more restricted temperature range. The final product yield in the pre-treated experiment was 17.5 ± 3.03% COD COD−1, while without pre-treatment it was 11.1 ± 1.00% COD COD−1. As shown in Figure 2c, total product productivity after MW pre-treatment (2.6 ± 0.38 g L−1 d−1 after 21 d) was higher than without pre-treatment (1.8 ± 0.09 g L−1 d−1). The pH was virtually the same in all reactors, except for days 4 and 7, and stabilised to a value of 4.2–4.3 from day 11 onwards (Figure 2d). In the reactor after MW pre-treatment, pH remained stable after day 11 even though product concentration kept increasing. This was not associated with the production of non-acidic products, e.g., ethanol. A similar behaviour was observed in our previous experiments with similar conditions, where pH never went below the value of 4, even though the total SCOAs kept increasing [21]. The stable pH value may be due to the presence of simultaneous equilibria, e.g., acids, carbon dioxide and ammonia produced from the hydrolysis of the proteins. Yin et al. reported an increasing ammonia concentration from day 4 in a hydrothermally pre-treated food waste at 140 °C, reaching a value of around 750 mg L−1 after 15 days [33]. The values of the initial pH (day 0) were different than those observed in the treatments at different temperatures and times, where pH was lower in the treated samples, probably due to the buffering effect of the inoculum. VSS were higher in the experiment with the pre-treated feedstock, although the difference was smaller on the final day (Figure 2e). Values of VS were close, showing little effect of the pre-treatment on this variable (Figure 2f). No significant reduction in TS and VS was likewise observed at the end of the dark fermentation in the work reported by Bundhoo [19]. Total COD was similar in both treatments, and no significant reduction was observed (Figure 2g), indicating that production of hydrogen or methane was absent or low. Instead, the soluble COD was higher in the experiment after pre-treatment than in the control (Figure 2h), corresponding to the higher soluble COD observed in the pre-treatment tests (Figure 1e). At the end of the run, the ratio SCOD TCOD−1feed in the pre-treated experiment was 85.3 ± 5.44%, while it was 59.4 ± 3.19% without pre-treatment. Similarly, an increased concentration of soluble metabolites was also reported in the literature [19]. Soluble COD in a hydrothermally pre-treated substrate did not show significant changes between days 3 and 15 of the fermentation run [33]. In a thermal pre-treated food waste, a reduction in VSS corresponded to the increase in SCOD, showing an increasing solubilisation with increasing temperature from 110 to 170 °C [36]. A decrease in the TC was observed in both runs, although this was more evident in the untreated experiment. (Figure 2i). Similarly, as for the COD (see Figure 2j), there was a solubilisation of the carbohydrates following the MW pre-treatment: the ratio SC TC−1feed was higher with pre-treatment (81.1 ± 4.21% as final value), than without pre-treatment (46.4 ± 1.98%). The ratio decreased in both runs over time, indicating conversion to fermentation products.
The product composition with the pre-treated and untreated feed was in general similar, with some differences (Figure 3). The reactors produced ethanol, lactic acid, acetic acid, and butyric acid. Lactic acid was the main fermentation product in both cases, but its content was higher in the pre-treated (80.9%) compared to the untreated (66.1%). The untreated run produced products with a higher ethanol content than the run with pre-treatment. Acetic acid was produced with higher percentages in the runs with pre-treatment (14.0% vs. 10.2% without pre-treatment). Finally, butyric acid was produced in low amounts in both treatments (1.5% vs. 1.9% with and without pre-treatment, respectively). Results in the study reported by Bundhoo [19] were different, since, although microwave increased the production of acids as observed in this work, a high concentration of ethanol and increased propionic acid were found in the pre-treated run. The main difference between the pre-treated and untreated experiments, although they showed an overall similar product distribution, was the higher content of lactic acid to the detriment of ethanol in the treated run compared to the untreated. This difference indicates a minor role of the ethanol-type fermentation in the run after MW treatment, due to either a change in the substrate composition after MW heating, or to a higher pH in the initial days of the batch fermentation run after MW pre-treatment. In our previous work with the same substrates [21], lactic acid was the main fermentation product, in agreement with the results of this study. The predominance of lactic acid is consistent with the literature evidence that lactic acid is typically produced at a low pH [37]. Indeed, because of its lower pKa than other organic acids produced in fermentation, at acidic pH, lactic acid is more present in its dissociated form, which is not toxic for the microorganisms [38], than other organic acids.

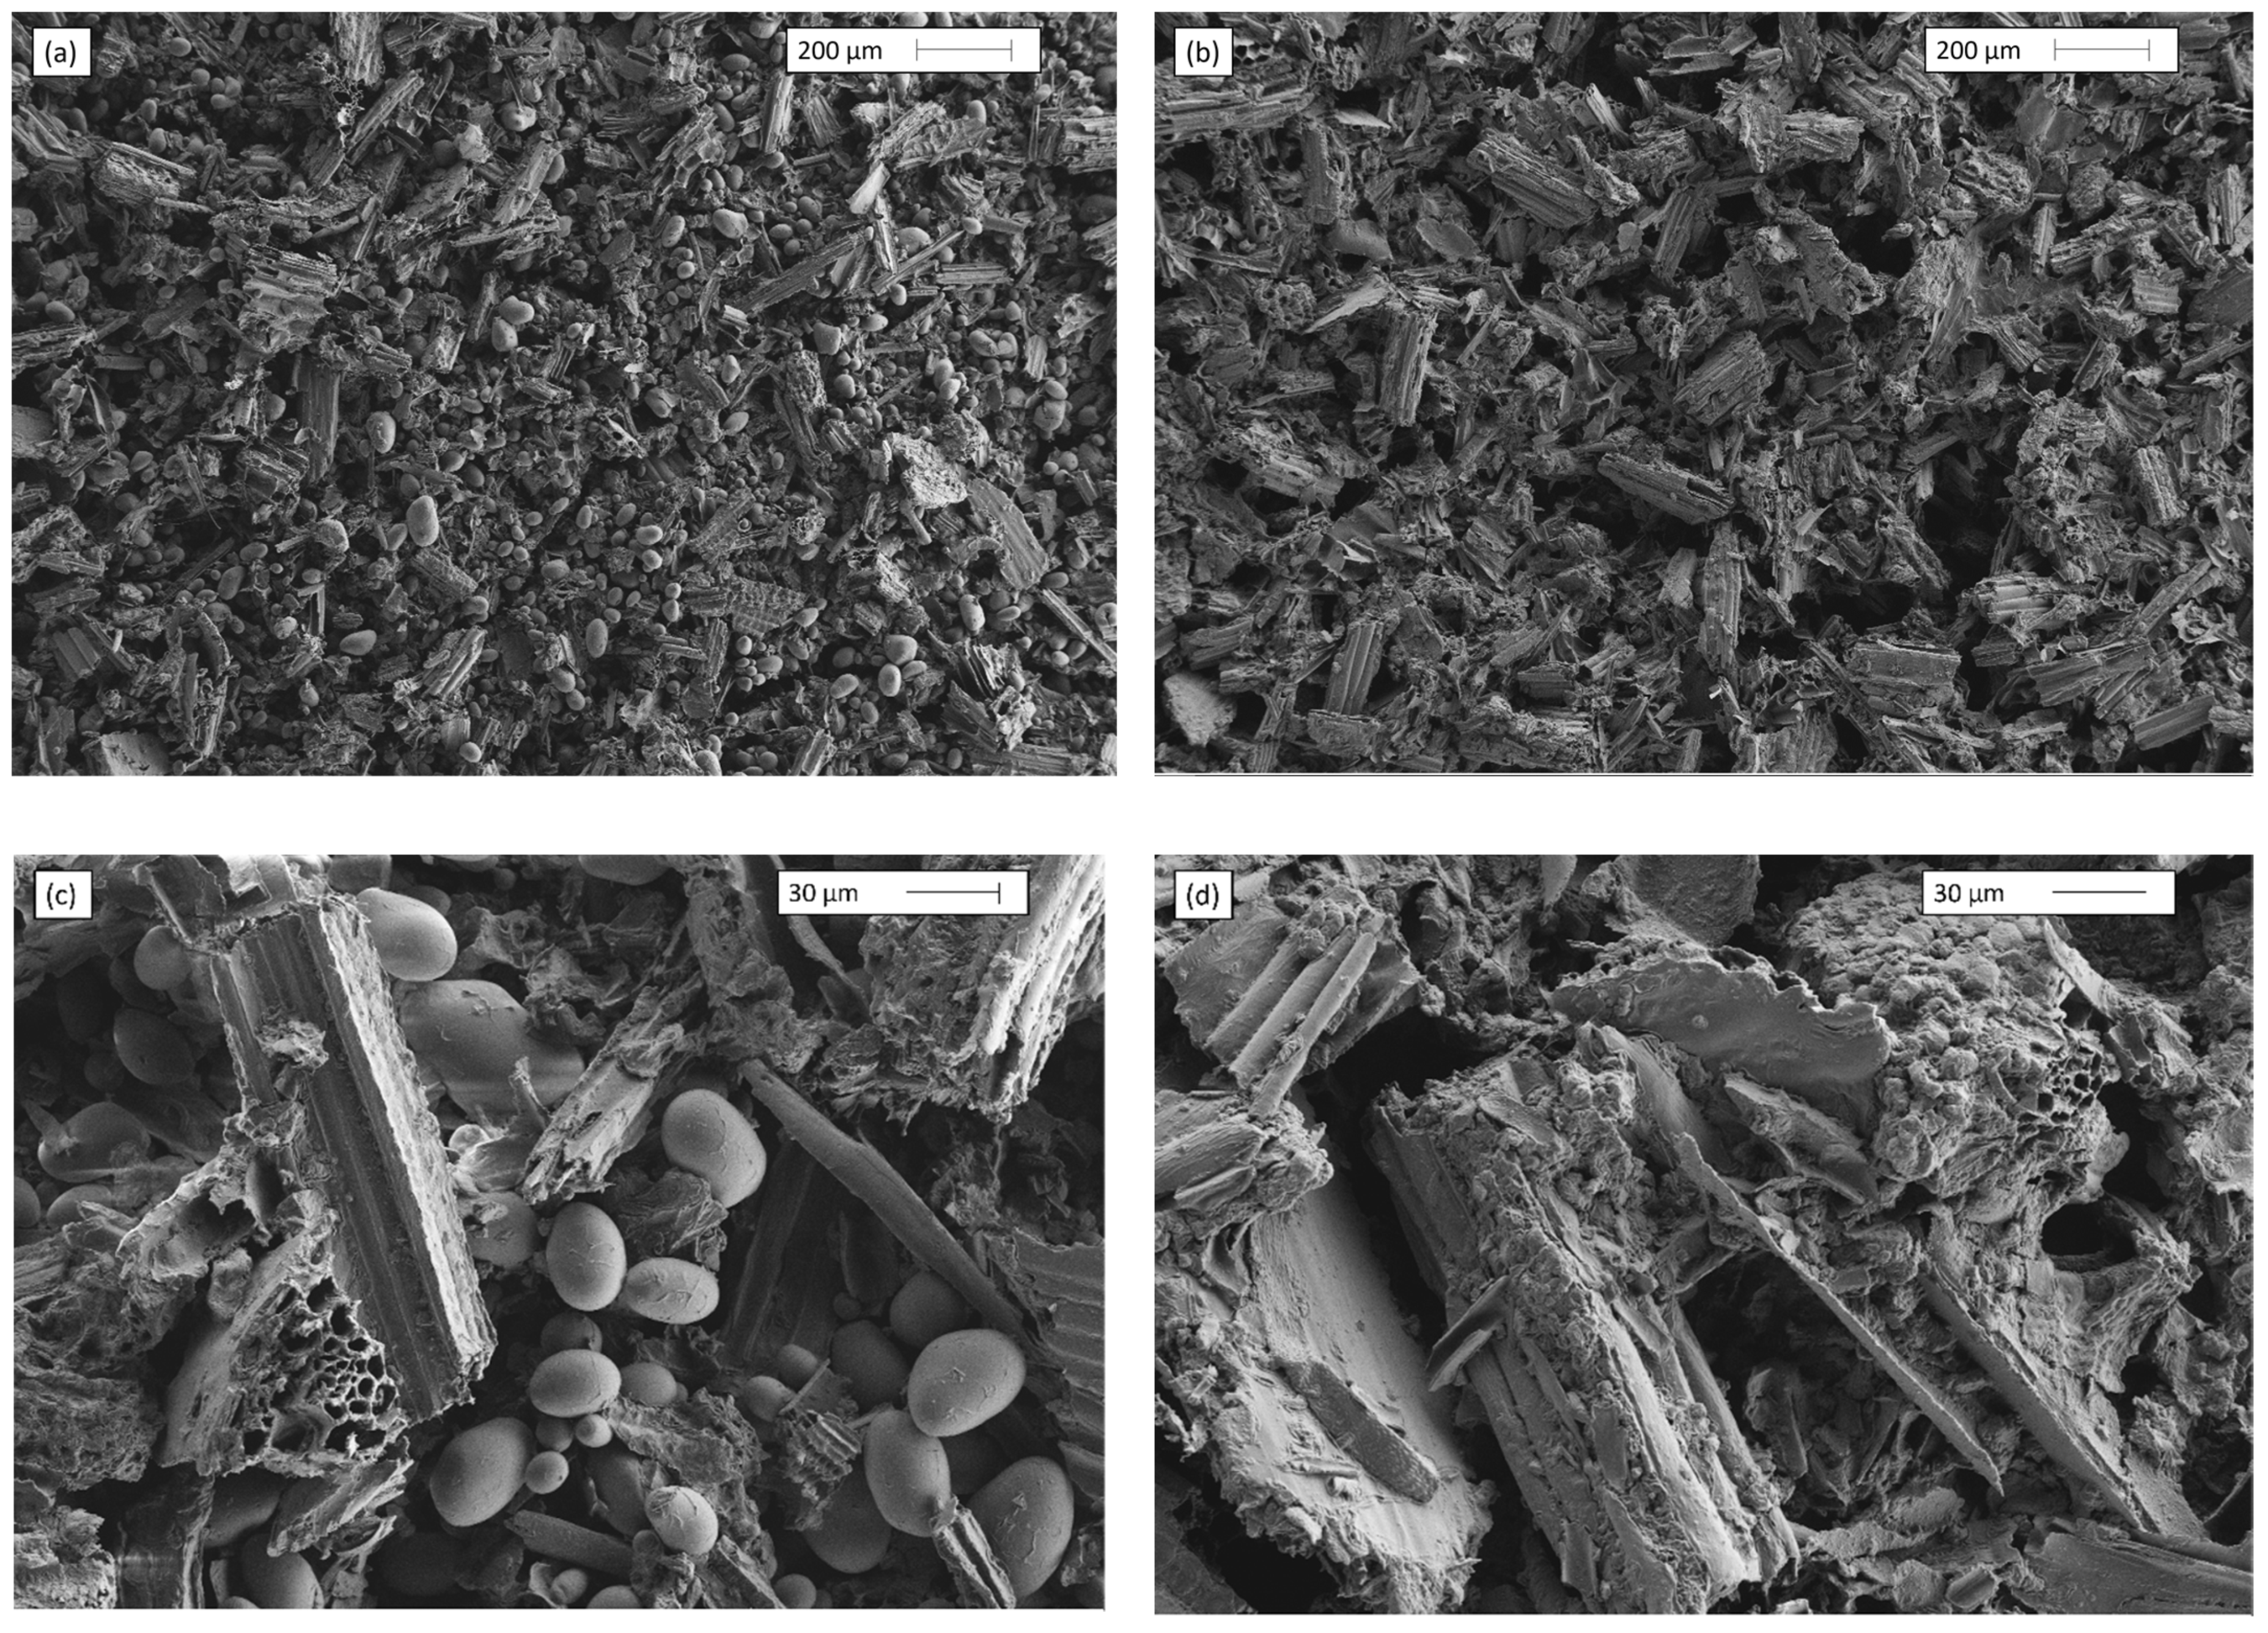
3.3. Scanning Electron Microscopy Images

Figure 4 shows the Scanning Electron Microscopy (SEM) images of the untreated and MW pre-treated substrate before the anaerobic fermentation tests and before inoculation with the microorganisms. Although the feedstock consisted of a fine powder and was well mixed, due to the heterogeneity of the system and to the limitations of sampling small volumes, the results of the SEM images can only be used for some preliminary qualitative observations. Further investigation is needed on the effect of MW pre-treatment on particle morphology. More images at different magnitudes are available in the Supplementary Materials (Figure S2). The untreated sample is characterised by mainly two types of formations: full and oval shaped, and cylindrical with an internal honeycomb structure. The MW treated sample is different from the untreated: the spheres are absent, and the structures are less defined. The agglomerates have bigger dimensions and are more amorphous, yet the cylindrical structures are still partially distinguishable. A more porous structure, indicating a larger surface area, was observed at 80 and 140 °C thermal pre-treated food waste in the work of Li et al., compared to the untreated and 180 °C samples; however, the images were taken on the fourth day of fermentation and bacteria were also present in the mixture [36]. Such morphological change can enhance the contact between the microorganisms and the substrate, resulting in an improved fermentation process. A hypothesis to explain these differences is the hydrolysis of suspended solids due to the MW treatment, which produces less defined and more degraded solids. The amorphous and bigger elements observed in MW4 can be explained by the Maillard reaction of proteins and carbohydrates, typically starting at a temperature of 140 °C. This reaction leads to the formation of semi-solid clumps and melanoidins, causing a decrease in the specific surface of suspended solids. [17,39] Increased colloidal components in thick waste activated sludge leading to an improved degradation rate were also observed by Eskicioglu et al. and Toreci et al. [40,41].

3.4. Energy and Economic Considerations

The total energy applied in MW4 pre-treatment was, referring to the VS of the feedstock, 1.11 kWh kgVS−1. Per unit of total products produced in the AF tests, the total energy applied was 6.20 kWh kg products−1. The total market value of the fermentation products (ethanol, lactic acid, acetic acid, butyric acid) after the fermentation runs was estimated to be GBP 0.12 and GBP 0.20 kgVS−1 for the untreated and pre-treated experiments, respectively. The net difference showed an increased product market value of GBP 0.08 kgVS−1 or of GBP 0.06 kWh−1 if MW pre-treatment is performed, compared to the untreated experiment. Purely based on the electricity costs, without considering capital costs and other operating costs, the increased economic value of the products would be balanced by an electricity cost of GBP 0.06 kWh−1. This cost is significantly lower than current business costs of electricity in the UK, which is GBP 0.172 kWh−1 (Section 2.6), indicating that, with these assumptions and with the results of the present study, the microwave pre-treatment is not economically competitive.
These considerations are only valid for the experimental setup used in this study. There are various factors that can increase the economic revenue from the MW pre-treatment of food waste before AF or that can make the use of energy for the MW pre-treatment more attractive:
  • Higher production of SCOAs with longer run time. The length of our experiments was fixed to 21 d. From the experimental profiles in Figure 2a, SCOA production had not stopped by the end of the experiment in the pre-treated fermentation runs, therefore it is likely that longer run times could give higher SCOA production and higher revenue from the products;
  • Scale-up factors for energy consumption. Our measured electricity consumption was obtained for 200 mL volumes, which is very different from the size and geometry of a full-scale installations. The energy consumption per unit of volatile solids may benefit from scale-up effects;
  • Use of excess or “curtailed” electricity form peaks of renewable energy production. The cost of electricity from peaks of generation from solar and wind farms has been assumed to be zero in a recent report by the UK Government [14]. The MW pre-treatment could therefore be designed to be operated only when excess electricity becomes available, which would significantly reduce the operating costs of the pre-treatment.
To the best of our knowledge, cost assessment has usually not been performed in studies which investigated microwave pre-treatment for anaerobic digestion. Eswari et al. estimated a net profit for the production of methane from sludge at pilot scale [42], but no data are available in the literature for the AF process.

4. Conclusions

MW pre-treatment of the feedstock gives some benefits to the AF process to produce SCOAs. In our study with model food waste, the microwave pre-treatment significantly improved the solubilisation of VSS, with an increase, although it was not statistically significant, in soluble COD and carbohydrates. The MW pre-treated feedstock gave higher SCOA yields in AF experiments. This study has shown promising data on what could be an alternative technology to increase some of the desired products out from the AF. Additionally, this picture could greatly change if using excess energy from peaks of renewable electricity generation, with scale-up effects and with higher SCOA yields obtained for longer fermentation time. MW processes only use electricity, which can be obtained more easily than heat from renewable resources. This important advantage of the MW process should not be underestimated in a world where the access to fossil resources is facing many technical, economic and political constraints.

Supplementary Materials

The following supporting information can be downloaded at: https://www.mdpi.com/article/10.3390/pr10061176/s1, Figure S1: Example of temperature and power profiles during MW pre-treatment (run MW4, 150 °C, two min).; Figure S2: SEM images of untreated (left) and microwave treated substrate at 150 °C for two min (right), at a magnitude (from top to bottom) of 200×, 150×, 50×, and 350×.

Author Contributions

Conceptualization: S.S., D.D. and C.F.M.; Methodology: S.S.; Formal analysis and investigation: S.S.; Writing—original draft preparation: S.S.; Writing—review and editing: D.D. and C.F.M.; Funding acquisition: S.S. and D.D.; Resources: S.S. and D.D.; Supervision: D.D. and C.F.M. All authors have read and agreed to the published version of the manuscript.

Funding

This study was funded by LEVERHULME TRUST. Serena Simonetti, a Leverhulme Trust Doctoral Scholar, is part of the 15 PhD scholarships of the “Leverhulme Centre for Doctoral Training in Sustainable Production of Chemicals and Materials” at the University of Aberdeen (Scotland, UK).

Institutional Review Board Statement

Not applicable.

Informed Consent Statement

Not applicable.

Data Availability Statement

Not applicable.

Acknowledgments

We would like to show our appreciation to Simbarashe Biti for providing his assistance in the use of the microwave equipment FlexiWAVE and John Still for performing the SEM analyses.

Conflicts of Interest

The authors declare no conflict of interest.

References

  1. Food and Agriculture Organisation of the United Nations (FAO). Global Food Losses and Food Waste: Extent, Causes and Prevention; FAO: Dü sseldorf, Germany, 2011. [Google Scholar]
  2. Quested, T.E.; Parry, A.D.; Easteal, S.; Swannell, R. Food and drink waste from households in the UK. Nutr. Bull. 2011, 36, 460–467. [Google Scholar] [CrossRef]
  3. Food and Agriculture Organisation of the United Nations (FAO). Post 2015 and SDGs: Nourishing People, Nurturing the Planet; E-bulletin 6; FAO: Roma, Italy, 2015. [Google Scholar]
  4. Eriksson, M.; Strid, I.; Hansson, P. Carbon footprint of food waste management options in the waste hierarchy e a Swedish case study. J. Clean. Prod. 2015, 93, 115–125. [Google Scholar] [CrossRef]
  5. Papargyropoulou, E.; Lozano, R.; Steinberger, J.K.; Wright, N.; Ujang, Z. The food waste hierarchy as a framework for the management of food surplus and food waste. J. Clean. Prod. 2014, 76, 106–115. [Google Scholar] [CrossRef]
  6. Gao, A.; Tian, Z.; Wang, Z.; Wennersten, R.; Sun, Q. Comparison between the technologies for food waste treatment. Energy Procedia 2017, 105, 3915–3921. [Google Scholar] [CrossRef]
  7. Dionisi, D.; Silva, I.M.O. Production of ethanol, organic acids and hydrogen: An opportunity for mixed culture biotechnology? Rev. Environ. Sci. Biotechnol. 2016, 15, 213–242. [Google Scholar] [CrossRef]
  8. Ma, C.; Liu, J.; Ye, M.; Zou, L.; Qian, G.; Li, Y. Towards utmost bioenergy conversion efficiency of food waste: Pretreatment, co-digestion, and reactor type. Renew. Sustain. Energy Rev. 2018, 90, 700–709. [Google Scholar] [CrossRef]
  9. Posmanik, R.; Labatut, R.A.; Kim, A.H.; Usack, J.G.; Tester, J.W.; Angenent, L.T. Coupling hydrothermal liquefaction and anaerobic digestion for energy valorization from model biomass feedstocks. Bioresour. Technol. 2017, 233, 134–143. [Google Scholar] [CrossRef]
  10. Yue, L.; Cheng, J.; Tang, S.; An, X.; Hua, J.; Dong, H.; Zhou, J. Ultrasound and microwave pretreatments promote methane production potential and energy conversion during anaerobic digestion of lipid and food wastes. Energy 2021, 228, 120525. [Google Scholar] [CrossRef]
  11. Mudhoo, A.; Moorateeah, P.R.; Mohee, R. Effects of Microwave Heating on Biogas Production, Chemical Oxygen Demand and Volatile Solids S Solubilization of Food Residues. World Acad. Sci. Eng. Technol. Int. J. Environ. Ecol. Eng. 2012, 69, 805–810. [Google Scholar]
  12. Ormaechea, P.; Castrillón, L.; Marañón, E.; Fernández-Nava, Y.; Negral, L.; Megido, L. Influence of the ultrasound pretreatment on anaerobic digestion of cattle manure, food waste and crude glycerine. Environ. Technol. 2017, 38, 682–686. [Google Scholar] [CrossRef]
  13. Scherzinger, M.; Kaltschmitt, M. Thermal pre-treatment options to enhance anaerobic digestibility—A review. Ren. Sustain. Energy Rev. 2021, 137, 110627. [Google Scholar] [CrossRef]
  14. Department for Business, Energy & Industrial Strategy. Hydrogen Production Costs 2021. Available online: https://www.gov.uk/government/publications/hydrogen-production-costs-2021 (accessed on 26 April 2022).
  15. Szmidt, R.A.K. Pretreatment Equipment and Food Waste Preparation for Anaerobic Digestion; Wong, M.H., Purchase, D., Dickinson, N., Eds.; Food Waste Valorisation; World Scientific: Singapore, 2023; In press. [Google Scholar]
  16. Kingman, S.; Dodds, C.; Buttress, A.; Groszek, D. Microwave Processing—Beyond Food. Chem. Eng. 2021, 965. Available online: https://www.thechemicalengineer.com/features/microwave-processing-beyond-food/ (accessed on 30 April 2022).
  17. Fan, J.; Santomauro, F.; Budarin, V.L.; Whiffin, F.; Abeln, F.; Chantasuban, T.; Gore-Lloyd, D.; Henk, D.; Scott, R.J.; Clark, J.; et al. The additive free microwave hydrolysis of lignocellulosic biomass for fermentation to high value products. J. Clean. Prod. 2018, 198, 776–784. [Google Scholar] [CrossRef]
  18. Marin, J.; Kennedy, K.J.; Eskicioglu, C. Effect of microwave irradiation on anaerobic degradability of model kitchen waste. Waste Manag. 2010, 30, 1772–1779. [Google Scholar] [CrossRef] [PubMed]
  19. Bundhoo, Z.M.A. Effects of microwave and ultrasound irradiations on dark fermentative bio-hydrogen production from food and yard wastes. Int. J. Hydrog. Energy 2017, 42, 4040–4050. [Google Scholar] [CrossRef]
  20. Shahriari, H.; Warith, M.; Hamoda, M.; Kennedy, K.J. Evaluation of single vs. staged mesophilic anaerobic digestion of kitchen waste with and without microwave pretreatment. J. Environ. Manag. 2013, 125, 74–84. [Google Scholar] [CrossRef]
  21. Simonetti, S.; Martín, C.F.; Dionisi, D. Anaerobic fermentation for the production of short chain organic acids: Product concentration, yield and productivity in batch experiments at high feed concentration. J. Environ. Chem. Eng. 2021, 9, 106311. [Google Scholar] [CrossRef]
  22. Quested, T.; Johnson, H. Household Food and Drink Waste in the UK; final report; WRAP: Banbury, UK, 2009. [Google Scholar]
  23. Liu, J.; Yin, J.; He, X.; Chen, T.; Shen, D. Optimizing food waste hydrothermal parameters to reduce Maillard reaction and increase volatile fatty acid production. J. Environ. Sci. 2021, 103, 43–49. [Google Scholar] [CrossRef]
  24. Yin, J.; Liu, J.; Chen, T.; Long, Y.; Shen, D. Influence of melanoidins on acidogenic fermentation of food waste to produce volatility fatty acids. Biores. Technol. 2019, 284, 121–127. [Google Scholar] [CrossRef]
  25. Cheng, Y.; Mu, D.; Jiao, Y.; Xu, Z.; Chen, M. Microwave-assisted maillard reaction between rice protein and dextran induces structural changes and functional improvements. J. Cereal Sci. 2021, 97, 103134. [Google Scholar] [CrossRef]
  26. Raposo, F.; Borja, R.; Cacho, J.A.; Mumme, J.; Mohedano, Á.F.; Battimelli, A.; Bolzonella, D.; Schuit, A.D.; Noguerol-Arias, J.; Frigon, J.; et al. Harmonization of the quantitative determination of volatile fatty acids profile in aqueous matrix samples by direct injection using gas chromatography and high-performance liquid chromatography techniques: Multi-laboratory validation study. J. Chromatogr. A 2015, 1413, 94–106. [Google Scholar] [CrossRef] [PubMed] [Green Version]
  27. American Public Health Association, APHA. Standard Methods for the Examination of Water and Wastewater; Report No. 18th edition; APHA: Washington, DC, USA, 1992. [Google Scholar]
  28. Koehler, L.H. Differentiation of Carbohydrates by Anthrone Reaction Rate and Color Intensity. Anal. Chem. 1952, 24, 1576–1579. [Google Scholar] [CrossRef]
  29. Business Electricity Prices. 2022. Available online: https://www.businesselectricityprices.org.uk/ (accessed on 6 May 2022).
  30. Kostas, E.T.; Beneroso, D.; Robinson, J.P. The application of microwave heating in bioenergy: A review on the microwave pre-treatment and upgrading technologies for biomass. Ren. Sustain. Energy Rev. 2017, 77, 12–27. [Google Scholar] [CrossRef] [Green Version]
  31. Gabriel, C.; Gabriel, S.; Grant, E.H.; Halstead, B.S.J.; Mingos, D.M.P. Dielectric parameters relevant to microwave dielectric heating. Chem. Soc. Rev. 1998, 27, 213–224. [Google Scholar] [CrossRef]
  32. Gezahegn, Y.A.; Tang, J.; Sablani, S.S.; Pedrow, P.D.; Hong, Y.; Lin, H.; Tang, Z. Dielectric properties of water relevant to microwave assisted thermal pasteurization and sterilization of packaged foods. Innov. Food Sci. Emerg. Technol. 2021, 74, 102837. [Google Scholar] [CrossRef]
  33. Yin, J.; Wang, K.; Yang, Y.; Shen, D.; Wang, M.; Mo, H. Improving production of volatile fatty acids from food waste fermentation by hydrothermal pretreatment. Biores. Technol. 2014, 171, 323–329. [Google Scholar] [CrossRef]
  34. Srinivasan, A.; Saha, M.; Caufield, K.; Abida, O.; Liao, P.H.; Lo, K.V. Microwave-enhanced advanced oxidation treatment of lipids and food wastes. Water Air Soil Pollut. 2018, 229, 227. [Google Scholar] [CrossRef]
  35. Shahriari, H.; Warith, M.; Hamoda, M.; Kennedy, K.J. Anaerobic digestion of organic fraction of municipal solid waste combining two pretreatment modalities, high temperature microwave and hydrogen peroxide. Waste Manag. 2012, 32, 41–52. [Google Scholar] [CrossRef]
  36. Li, J.; Zhang, W.; Li, X.; Ye, T.; Gan, Y.; Zhang, A.; Chen, H.; Xue, G.; Liu, Y. Production of lactic acid from thermal pretreated food waste through the fermentation of waste activated sludge: Effects of substrate and thermal pretreatment temperature. Biores. Technol. 2018, 247, 890–896. [Google Scholar] [CrossRef]
  37. Luongo, V.; Policastro, G.; Ghimire, A.; Pirozzi, F.; Fabbricino, M. Repeated-Batch Fermentation of Cheese Whey for Semi-Continuous Lactic Acid Production Using Mixed Cultures at Uncontrolled pH. Sustainability 2019, 11, 3330. [Google Scholar] [CrossRef] [Green Version]
  38. Warnecke, T.; Gill, R.T. Organic acid toxicity, tolerance, and production in Escherichia coli biorefining applications. Microb. Cell Factories 2005, 4, 25. [Google Scholar] [CrossRef] [PubMed] [Green Version]
  39. Ravber, M.; Knez, Ž.; Škerget, M. Hydrothermal Degradation of Fats, Carbohydrates and Proteins in Sunflower Seeds after Treatment with Subcritical Water. Chem. Biochem. Eng. Q. 2015, 29, 351–355. [Google Scholar] [CrossRef]
  40. Eskicioglu, C.; Terzian, N.; Kennedy, K.J.; Droste, R.L.; Hamoda, M. Athermal microwave effects for enhancing digestibility of waste activated sludge. Water Res. 2007, 41, 2457–2466. [Google Scholar] [CrossRef] [PubMed]
  41. Toreci, I.; Kennedy, K.J.; Droste, R.L. Effect of High-Temperature Microwave Irradiation on Municipal Thickened Waste Activated Sludge Solubilization. Heat Transf. Eng. 2010, 31, 766–773. [Google Scholar] [CrossRef]
  42. Eswari, P.; Kavitha, S.; Kaliappan, S.; Yeom, I.; Banu, J.R. Enhancement of sludge anaerobic biodegradability by combined microwave-H2O2 pretreatment in acidic condition. Environ. Sci. Pollut. Res. 2016, 23, 13467–13479. [Google Scholar] [CrossRef]
Figure 1. Average values with standard error bars of microwave treatments at different temperatures and times: pH (a), volatile suspended solids (VSS) (b), volatile solids (VS) (c), total chemical oxygen demand (TCOD) (d), soluble chemical oxygen demand (SCOD) TCOD−1feed (e), total carbohydrates (TC) (f), and soluble carbohydrates (SC) TC−1feed (g).
Processes 10 01176 g001aProcesses 10 01176 g001b
Figure 2. Average values over time with standard error bars of batch runs without and with microwave pre-treatment: Product concentration (a), yield (b), productivity (c), pH (d), VSS (e), VS (f), TCOD (g), SCOD TCOD−1feed (h), TC (i), and SC TC−1feed (j).
Processes 10 01176 g002aProcesses 10 01176 g002b
Figure 3. Product composition (mass basis) at day 21 of batch runs without and with microwave pre-treatment. Average values with standard error bars.
Processes 10 01176 g003
Figure 4. SEM images of untreated (left) and microwave-treated substrate at 150 °C for two min (right), at a magnitude of 50× (top) and 250× (bottom). Other SEM images are available in the Supplementary Materials (Figure S2).
Processes 10 01176 g004
Table 1. Microwave treatments.
Treatment NameTemperature (°C)Time (Min)
MW0--
MW11202
MW21205
MW31208
MW41502
MW51505
MW61508
MW71802
MW81805
MW91808
Table 2. Market prices of fermentation products. Adapted with permission from Ref. [7]. Copyright © 2016, Springer Science Business Media Dordrecht.
Fermentation ProductMarket Price (GBP kg−1) 1
Lactic acid1.28
Butyric acid0.96
Ethanol0.40
Acetic acid0.40
1 Conversion factor used: GBP 0.8 to USD 1−1.
Publisher’s Note: MDPI stays neutral with regard to jurisdictional claims in published maps and institutional affiliations.

