Article

Effects of Forest Types on SOC and DOC in the Permafrost Region of the Daxing’anling Mountains

School of Geographical Sciences, Heilongjiang Province Key Laboratory of Geographical Environment Monitoring and Spatial Information Service in Cold Regions, Harbin Normal University, Harbin 150025, China
*
Authors to whom correspondence should be addressed.
Processes 2022, 10(7), 1293; https://doi.org/10.3390/pr10071293
Submission received: 27 May 2022 / Revised: 24 June 2022 / Accepted: 25 June 2022 / Published: 30 June 2022
(This article belongs to the Special Issue The Role of Biochar in Soil Remediation Processes)

Abstract

:
There is a “symbiotic relationship” between permafrost and the forest ecosystem; the melted permafrost provides sufficient water for forest growth, and the forest ecosystem plays an important role in protecting the permafrost. Aiming to study the effects of different forest types on soil organic carbon (SOC) and dissolved organic carbon (DOC) in the permafrost region of the Daxing’anling Mountains, this research focuses on the soil of the three forest types of pinus sylvestris var. mongolica forest, larch forest, and birch forest in Beiji Village, Mohe County, Daxing’anling Region, and collected vertical profile soil samples from the three soil layers of 0–10, 10–20, and 20–30 cm at three different sites types (upslope, mesoslope, and downslope) in August 2017. The results show that the forest type is the main influencing factor for the content of SOC and DOC. The site type has a significant effect on the content of SOC and DOC in the three forest types, but the difference varies slightly (p > 0.05). The content of SOC and DOC is negatively correlated with the depth of the soil layer of the vertical profile. The geodetector data analysis shows that there are significant differences (p < 0.05) among the contents of SOC and DOC in the three forest types. In conclusion, this study contributes to an in-depth understanding of carbon storage, the carbon dynamics of SOC, and the effects of different forest types on carbon balance in permafrost regions, and it provides a scientific basis for the study of the carbon cycle mechanism in permafrost regions.

1. Introduction

Daxing’anling is the highest latitude mountainous area in China and is in line with the laws of the latitudinal and vertical zonality. A large number of data proves that in the sensitive freeze–thaw soil layer, SOC fluctuates frequently during the annual melting process of the active layer with the downward migration of the ice front. However, climate change causes permafrost to move from south to north, leading to an increased melting depth and reduced area [1]. Permafrost degradation, increased soil respiration, and changes in SOC bring about fluctuations in greenhouse gases and exacerbate global climate change. It is estimated that the organic carbon storage in the 1 m soil layer on the Earth’s surface is 1500–2000 Pg, about twice the CO2 content of the atmosphere [2]. Therefore, SOC change is closely related to global climate change. SOC, as a combination of humus, animal, and plant residues and microbiomes formed by microorganisms, is an important component of soil and is the most sensitive indicator of global climate change [3,4]. DOC refers to a number of different organic materials with special sizes and structures. DOC is the most active component of SOC [5]. It is dissoluble to some extent, can pass through filter membranes with a pore diameter of 0.45 m, is unstable, is easy to oxidize and to decompose, and moves fast in the soil due to the strong influence of plants and microorganisms in the definite space–time condition [6,7]. Fluctuations in soil carbon banks can greatly affect the ecosystem. SOC, which can actively be exchanged with atmospheric components, accounts for about two-thirds of the carbon in the terrestrial ecosystem, so small changes in SOC will greatly change the CO2 concentration and global carbon cycle [8,9,10].
In China, permafrost is mainly distributed in the northeast of the Daxing’anling Mountains and Xiaoxing’anling Mountains, Western Mountains, and Qinghai–Tibet Plateau. The topography of the northeast permafrost area is mainly hilly and mountainous. Although the altitude is not high, due to the high latitude and the influence of Siberian high pressure, it is the coldest natural area in China [11]. The active layer refers to the soil layer covered with permafrost. It features one-way melting in the summer and two-way freezing in the winter. The permafrost region has non-connecting permafrost below. The significant impact of vegetation on permafrost has attracted the attention of many experts and scholars [12]. It can be seen from the historical changes in larch in the Daxing’anling Mountains that the existence of permafrost is closely related to the succession of forests, and the degradation or disappearance of permafrost is synchronized by a decline in forests. Thus, it can be said that there is an inseparable “symbiotic relationship” between permafrost and the forest ecosystem in the Daxing’anling Mountains [13]. However, there is still a lack of objective understanding on how the forest ecosystem affects permafrost. Moreover, different forest types have different carbon storage capabilities. In this paper, soil samples have been taken from the three forest types of pinus sylvestris var. mongolica forest, larch forest, and birch forest in Beiji Village, Mohe County, Daxing’anling Region, to study the effects of different forest types and vertical site types on SOC and DOC in permafrost so as to deepen our understanding of the characteristics of carbon loss and provide an important reference for the correct evaluation of carbon storage in cold high-latitude permafrost regions in China as well as for research on dynamic changes in SOC and in the equilibrium carbon cycle in the future [14,15,16,17].

2. Materials and Methods

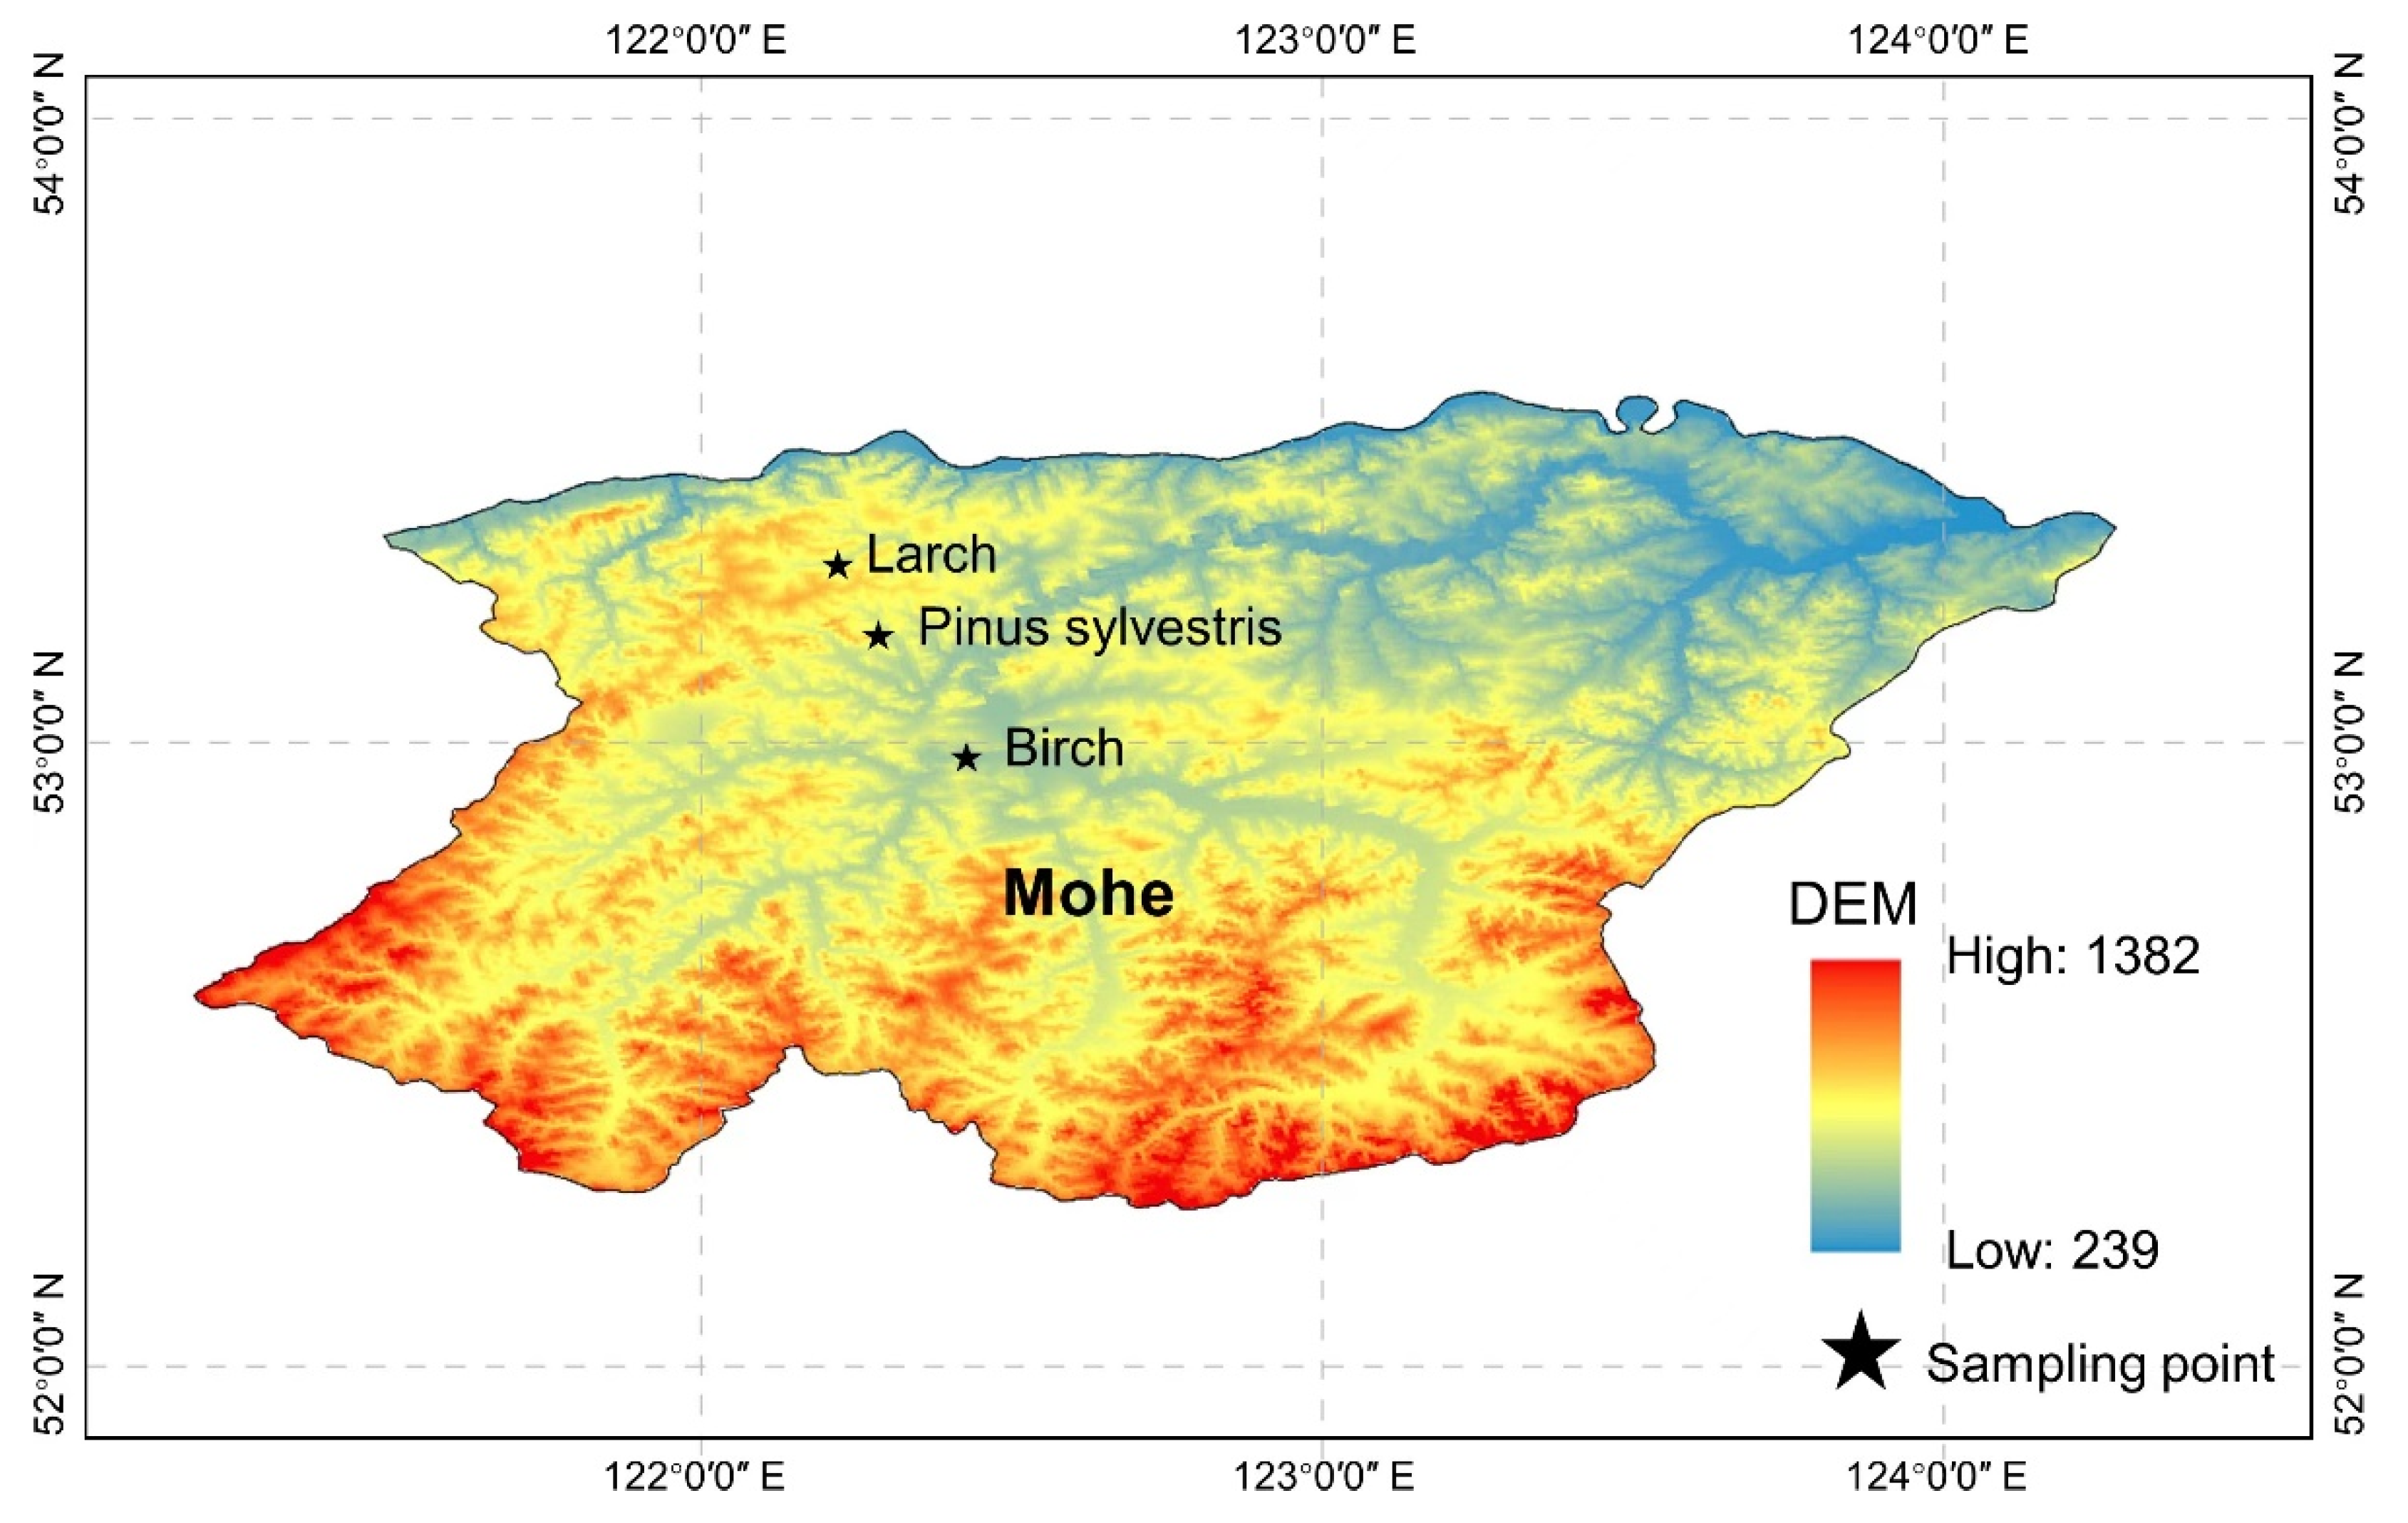
2.1. Background of the Study Area

The permafrost region of the Daxing’anling Mountains is a large area with continuous permafrost, island talik permafrost, and island permafrost, and it is the southern margin of Eurasia high-latitude permafrost. Permafrost and its continuity increases with latitude. With great thickness and low temperature, permafrost is connected in the profile, and the plane is continuously distributed over a large area. The area of the permafrost region accounts for 70~80% of the total area. The Daxing’anling Mountains are located in the cold temperate continental monsoon climate zone. This region has an annual average temperature of −5~−7 °C in the north and −1.5~4.3 °C in the southeast, an extreme minimum temperature of −52.3 °C, an annual temperature difference of 49.3 °C, annual average precipitation of 460.8 mm, and an average frost-free period of 86.2 d. The study area in this paper is located in Beiji Village, Mohe County, Daxing’anling Region, which is situated at the northern foot of Daxing’anling Mountains, on the south bank of the upstream of Heilongjiang River, and at the foot of Qixing Mountain. With geographical coordinates of 122°21′05′′~122°21′30′′ E, 53°27′00′′~53°33′30′′ N, it is the coldest place in China in winter. The altitude of our study area is between 600 m and 1000 m, the elevation difference is not great, and the slope is relatively uniform, ranging from 15° to 25°. Due to the influence of altitude gradient, the distribution of soil carbon is different. The soil is all brown soil, and there is permafrost beneath the active layer. There are commonly seen forest types in the study area, including larch forest, pinus sylvestris var. mongolica forest, and birch forest. Larch forest represents a cold and dry habitat condition and is the main forest vegetation in the Daxing’anling Mountains. These forest species mostly grow on sunny slopes, semi-sunny slopes, or on watersheds. Larch is tall and has a large stock volume, simple structure, and neat forest form. Pinus sylvestris var. mongolica forest grows in the lower part of shady slopes and half shady slopes of 5–10°, where the habitat is cold and wet, with sufficient but often stagnant water. The poor decomposition of dry branches and fallen leaves causes obvious gleization and peatification. In addition, the thin soil layer and permafrost layer curb the growth of pinus sylvestris var. mongolica forest, so low trees with a small DBH and neat forests are mostly withered and can be blown down easily. Birch is a transitional type of larch vegetation. It is formed by the invasion of birch-dominated broad-leaved tree species after the logging and burning of native larch forest. Birch forest is widely distributed and is extremely unstable in terms of its composition and structure, but it plays an important role in improving forest soil and larch forest succession (Figure 1).

2.2. Collection of Soil Samples

This paper selects soil samples from the three forest types of pinus sylvestris var. mongolica forest, larch forest, and birch forest in Beiji Village, Mohe County, Daxing’anling Region, in August 2017. Each forest type can be divided into three site types, namely upslope, mesoslope, and downslope. Each site type was divided into three sample plots. Each sample plot had three sampling points. After the dry branches and fallen leaves on the topsoil were removed, a total of 243 soil samples were collected from the three soil layers of 0–10, 10–20, and 20–30 cm using an earth borer with a diameter of 5 cm. The collected fresh soil samples were brought back to the lab. After animal and plant residues, stones, and other debris were removed, the soil samples were divided into two parts and were packaged and sealed.

2.3. Test Method

Determination of SOC content: SOC content was determined using MultiN/C3100 TOC (Jena, Germany) and high-temperature combustion. Determination of DOC content: a 10 g soil sample was put into a triangular bottle containing 50 mL of distilled water, oscillated and extracted at 25 °C for 30 min, and centrifuged at high speed for 10 min; then, the supernatant was filtered with a filter membrane (pore size: 0.45 μm); the organic carbon concentration in the extract solution was determined using MultiN/C3100 TOC (Jena, Germany), and the DOC concentration was obtained; finally, the DOC concentration (mg/L) was converted to the DOC content (mg/kg) according to the water–soil ratio.

2.4. Statistical Analysis Method

The data were statistically analyzed using Excel 2003, SPSS 19.0 software, one-way ANOVA with geodetector, and SPSS19.0. A significance test (significance level: α = 0.05) of differences was conducted between the data groups with a least significant difference (LSD) test and correlation analysis with the Pearson method. The data in the chart are mean ± standard deviation. Related chart was made using OriginPro8.5.

3. Results and Analysis

3.1. Effects of Different Forest Types on SOC and DOC

Different forest types in the study area affect the input and output of soil organic substances due to the different decomposition degrees of surface cover vegetation, dead leaves, and organic matter, thus affecting the content of SOC and DOC. The contents of SOC and DOC decrease significantly in different forest types as the depth of the soil layer increases (Table 1). In the topsoil (0–10 cm), the SOC content of larch forest is greater than that of pinus sylvestris var. mongolica and birch forests. The SOC content of larch, pinus sylvestris var. mongolica, and birch forests is 186.71, 106.98, and 103.08 g/kg, respectively (Table 1). In the soil layer of 10–20 cm, the change pattern of the SOC content in the three forest types is consistent, with no significant difference (p > 0.05). This change pattern can also apply to the DOC content of the three forest types, but the differences are significant. In the topsoil (0–10 cm), the DOC content of larch and birch forests is greater than that of pinus sylvestris var. mongolica forests. The DOC content of pinus sylvestris var. mongolica, larch, and birch forests is 246.83, 621.15, and 790.85 mg/kg, respectively (Table 1). In the soil layers of 10–20 cm and 20–30 cm, the DOC content of birch forest is still higher than that of the other two forest types. DOC has a significant effect on the stability of SOC, and its content varies significantly between different forest types (p < 0.01).
DOC/SOC is an important indicator of the quality of the soil carbon bank, indicating the stability of organic carbon.

3.2. Differences in the Content of SOC and DOC in Different Site Types

According to Figure 2, site type can greatly affect the content of SOC and DOC in the three forest types in the permafrost region of the Daxing’anling Mountains. In the three different sites (downslope, mesoslope, and upslope), the content of SOC and DOC in birch forest changes significantly, with a gradual increase in the SOC content and a gradual decrease in DOC. The content of SOC and DOC in pinus sylvestris var. mongolica and larch forests show the following change pattern: upslope > mesoslope > downslope. The fluctuation in the SOC content in pinus sylvestris var. mongolica forest with the change in the site type is significantly higher than that in larch forest, but no significant regularity is observed. The minimum content of both SOC and DOC in larch forest occurs in the mesoslope, the maximum content of SOC is found in the downslope, and the maximum content of DOC is found in the upslope. The SOC and DOC content of the three site types shows significant change patterns, but differences among them are not significant (p > 0.05).

3.3. Distribution Differences in the Content of SOC and DOC in Different Soil Layers

In the vertical profile, the SOC content in pinus sylvestris var. mongolica forest gradually decreases from top to bottom, while that of birch forest decreases more gradually. In contrast, the SOC content in larch forest first decreases and then increases slightly. Thus, the vertical distribution of the SOC content in the three forest types is 10 cm > 20 cm > 30 cm. In the vertical profile, the DOC content of the three forest types gradually decreases from top to bottom. The DOC content in larch forest is lower than that of birch forest, but both are higher than that of pinus sylvestris var. mongolica forest, with significant differences (p < 0.05). As the depth of soil layer of the vertical profile increases (Figure 3), the differences between different forest types decrease, especially between birch and larch forests. There is no significant correlation between the depth of the three soil layers and the content of SOC and DOC (p > 0.05), but the deeper the soil layer, the lower the content of SOC and DOC. This indicates that the SOC and DOC in the permafrost zone are accumulated, and the vertical profile of the soil is negatively correlated with the content of SOC and DOC.

4. Discussion

SOC is affected by many factors, such as vegetation photosynthesis utilization rate, altitude gradient distribution, soil water content fluctuations, pH, climate, and human activities. Geodetector is a new statistical method to detect spatial heterogeneity and to reveal the drivers behind it. This method does not involve linearity hypotheses and has an elegant form and a clear physical meaning. The q, the statistics of geodetector with the value domain of [0,1], can be used to measure spatial heterogeneity, detect explanatory factors, and analyze the interaction between variables and has been applied in multiple fields such as natural and social sciences [18]. The larger the value of q, the stronger the explanatory power of the independent variable X to the attribute Y. According to the principal component analysis by geodetector, the contribution rate of forest type, the first principal component of the influencing factors, to the content of SOC and DOC reach 25.6% and 79.7%, respectively. The results prove that the different forest types in the study area are the primary influencing factor of the SOC content followed by the soil layer and altitude (Table 2).

4.1. Distribution Characteristics of the Content of SOC and DOC in Different Forest Types

SOC mainly comes from plant secretions and residues [19]. The changes in the SOC content in birch, pinus sylvestris var. mongolica, and larch forests may be because of the soil organic matter content, a determinant of soil quality, which can affect the physical, chemical, and biological characteristics of soil [20]. The balance between the mineralization rate and the organic matter input of different types of carbon determines the accumulation degree of SOC, and the organic matter input is mainly up to the amount of organic matter and the humization coefficient of organic residues [21]. The variation in the SOC content is mainly affected by the vegetation type under the same climate and soil parent material [22]. The change in the DOC content may be caused by the spatial migration of DOC due to the melting of permafrost in the active layer in the summer. Some DOC is redistributed along the soil horizontally and vertically or is decomposed directly, while some may be lost during migration [23]. The storage, decomposition, and release of SOC have important implications for the carbon cycle. The luxuriant branches and leaves of larch and birch and the shrubs growing under them can effectively reduce the direct solar radiation in the larch and birch forests, reduce the soil temperature in the forests, and slow down the melting of permafrost under the forests [24,25,26,27,28]. Moreover, thick layers of moss plants growing on the ground of larch and birch forests can provide good insulation and play an important role in protecting the permafrost under the forests [11]. Thus, the DOC content of larch and birch forests is significantly higher than that of pinus sylvestris var. mongolica forest.

4.2. Distribution Characteristics of the Content of SOC and DOC in Different Site Types

The content of SOC and DOC in the same forest type changes significantly from the downslope to the mesoslope to the upslope, but there is no significant difference. The SOC content of the three different forest types varies significantly. The great differences in the vegetation growth environment and the intense artificial disturbances (reclamation for grazing and deforestation for firewood) along the upslope of birch forest lead to changes in forest vegetation, further affecting the content of SOC and DOC. In addition, there are many human disturbances along the downslope of pinus sylvestris var. mongolica and larch forests near scenic areas, while there are no human disturbances along the upslope. There is no significant correlation between the different site types and the content of SOC and DOC, but the change trends in the content of SOC and DOC are completely different along the downslope, the mesoslope, and the upslope. This indicates that the site type has an influence on the content of SOC and DOC, and the content of SOC and DOC shows a site heterogeneity pattern [29].

4.3. Distribution Characteristics of the Content of SOC and DOC in Different Soil Layers

Previous studies have proven that it is not always reliable to infer the SOC content of the 1 m soil layer using only the surface SOC content, so it is necessary to understand the vertical distribution patterns of soil organic carbon content profiles [30]. In general, in the vertical profile, the SOC content in pinus sylvestris var. mongolica and birch forests tend to have consistent change patterns, while there is no obvious change law in the SOC content in larch forest. The DOC content at the different soil layer depths is 10 cm > 20 cm > 30 cm, namely the DOC content decreases with the increasing depth of the soil layers. The study shows that the key environmental factors (hydrology and vegetation coverage, etc.) within the small areas of different sections that control the vegetation productivity and litter decomposition rate are obviously different and have an important effect on the organic carbon content in the litter [31]. In the three forest types, the SOC content at 0–10 cm is significantly higher than that at 10–20 cm and 20–30 cm. The main reason may be that the many dead leaves and biological residues attached to the topsoil contribute to the decomposition of organic matter and lead to the increase in the SOC content. The DOC content at 0–10 cm and 10–20 cm is significantly higher than that at 20–30 cm. The reason may be that the changes in soil hydrothermal conditions cause water infiltration, affect the activity of microorganisms in the soil, and change the content of the organic matter input into the soil layer, leading to the changes in the DOC contents [32].

5. Conclusions

This study focused on the content of SOC and DOC in the permafrost region of the Daxing’anling Mountains. The results show that: (1) In the forest ecosystem in the permafrost region, forest type is closely related to SOC and DOC, and SOC and DOC can be used as one of the important indicators for the changes in SOC. (2) In larch forest, the SOC content decreases from the downslope to the mesoslope to the upslope, while the DOC content changes in the opposite direction, showing an increasing trend from the downslope to the mesoslope to the upslope. In different site types, the content of SOC and DOC in birch forest is inversely proportional to that of larch forest. Compared to larch and birch forests, the change pattern of the content of SOC and DOC in pinus sylvestris var. mongolica forest is less significant. (3) In the vertical profile, the content of SOC and DOC in the three forest types decreases, and there is a significantly negative correlation between the depth of the soil layers and the SOC.

Author Contributions

X.W., S.Z. and L.Z. designed research; D.W. and W.D. performed research; D.W. and W.D. analysed data; and W.D. wrote the paper. All authors have read and agreed to the published version of the manuscript.

Funding

This research was funded by U20A2082 [Key Joint Program of National Natural Science Foundation of China (NSFC) and Heilongjiang Province for Regional Development (No. U20A2082)].

Institutional Review Board Statement

Not applicable.

Informed Consent Statement

Not applicable.

Data Availability Statement

The data used to support the findings of this study are available from the corresponding author upon request.

Conflicts of Interest

The authors declare no conflict of interest.

References

  1. Jin, J.; Yu, S.P.; Lu, L.Z.; Li, Y.W. Preliminary assessment of permafrost degradation and its trends in the daxing’an mountains. Glacier Frozen Soil 2006, 28, 467–476. [Google Scholar]
  2. Eswaran, H.; Berg, E.V.D.; Reich, P. Organic carbon in soils of the world. Soil Sci. Soc. Am. J. 1993, 90, 269–273. [Google Scholar] [CrossRef] [Green Version]
  3. Xiao, H.L. Climate change in relation to soil organic matter. Soil Environ. Sci. 1999, 8, 300–304. [Google Scholar]
  4. Wang, B.; Sun, G.; Luo, P.; Wang, M.; Wu, N. Labile and recalcitrant carbon and nitrogen pools of an alpine meadow soil from theeastern Qinghai-Tibetan Plateau subjected to experimental warmingand grazing. Acta Ecol. Sin. 2011, 31, 1506–1514. [Google Scholar]
  5. Li, J.; Sheng, H.; Zhou, P.; Zhang, Y. Profile distribution and difference of active carbon components in different soil types in the hilly area of eastern Hunan. Chin. J. Eco-Environ. 2013, 22, 1780–1784. [Google Scholar]
  6. Wang, J.; Zhang, X.D.; Xie, H.T.; Zhu, P.; Jiang, G.M. An overview of new quantitative indicators in modern soil organic matter research. Chin. J. Appl. Ecol. 2003, 14, 1809–1812. [Google Scholar]
  7. Guo, D.N.; Geng, S.Y.; Zhao, G.Y.; Wang, L. Effects of drainage afforestation on dissolved organic carbon biodegradation and leaching of soil in Xiaoxing’anling wetland. J. Environ. Sci. 2016, 36, 2631–2637. [Google Scholar]
  8. Post, W.M.; Emanuel, W.R.; Zinke, P.J.; Stangenberger, A.G. Soil carbon pools and world life zones. Nature 1982, 298, 156–159. [Google Scholar] [CrossRef]
  9. Yang, Y.S.; Xie, J.S.; Sheng, H.; Chen, G.S.; Li, X.; Yang, Z.J. The impact of land use/cover change on storage and quality of soil organic carbon in midsubropical mountainous area of southern China. J. Geogr. Sci. 2009, 19, 49–57. [Google Scholar] [CrossRef]
  10. Aminem, E.L.; Chang, S.L.; Zhang, Y.T.; Chou, Y.; He, P. The distribution of soil organic carbon along the elevation and its influencing factors in spruce forests of Tian shan Mountain. Chin. J. Ecol. 2014, 34, 1626–1634. [Google Scholar]
  11. Zhou, Y.W.; Guo, D.X. The main characteristics of permafrost in China. J. Glaciol. Geocryol. 1982, 4, 1–19. [Google Scholar]
  12. Tutubalina, O.V.; Rees, W.G. Vegetation degradation in a permafrost region as seen from space: Noril’sk (1961–1999). Cold Reg. Sci. Technol. 2001, 32, 191–203. [Google Scholar] [CrossRef]
  13. Cai, T.J.; Liu, Z.M.; Yang, D.; Guo, P. Wonders of frozen soil and forest in daxing’anling mountains. J. For. Hum. Sci. 2013, 12, 126–133. [Google Scholar]
  14. Shen, X.; Liu, Y.; Liu, B.; Zhang, J.; Wang, L.; Lu, X.; Jiang, M. Effect of shrub encroachment on land surface temperature in semi-arid areas of temperate regions of the Northern Hemisphere. Agric. For. Meteorol. 2022, 320, 108943. [Google Scholar] [CrossRef]
  15. Dong, J.; Deng, R.; Zhang, Q.; Cai, J.; Ding, Y.; Li, M. Research on recognition of gas saturation in sandstone reservoir based on capture mode. Appl. Radiat. Isot. 2021, 178, 109939. [Google Scholar] [CrossRef]
  16. Zhang, K.; Wang, S.; Bao, H.; Zhao, X. Characteristics and influencing factors of rainfall-induced landslide and debris flow hazards in Shaanxi Province, China. Nat. Hazards Earth Syst. Sci. 2019, 19, 93–105. [Google Scholar] [CrossRef] [Green Version]
  17. Ahukaemere, C.M.; Okoli, N.H.; Aririguzo, B.N.; Onwudike, S.U. Tropical Soil Carbon Stocks in Relation to Fallow Age and Soil Depth. Malays. J. Sustain. Agric. 2020, 4, 5–9. [Google Scholar]
  18. Wang, J.F.; Xu, C.D. Geographical detectors: Principles and prospects. Chin. J. Geogr. 2017, 72, 116–134. [Google Scholar]
  19. Zang, Q.J.; Yu, X.B.; Qian, J.X.; Xiong, T. Distribution characteristics of plant communities and soil organic matter andmain nutrients in the Poyang Lake Nanji Wetland. Acta Ecol. Sin. 2012, 32, 3656–3669. [Google Scholar]
  20. Shen, X.; Liu, B.; Henderson, M.; Wang, L.; Jiang, M.; Lu, X. Vegetation greening, extended growing seasons, and temperature feedbacks in warming temperate grasslands of China. J. Clim. 2022, 1, 51. [Google Scholar] [CrossRef]
  21. Xu, J.; Lan, W.; Ren, C.; Zhou, X.; Wang, S.; Yuan, J. Modeling of coupled transfer of water, heat and solute in saline loess considering sodium sulfate crystallization. Cold Reg. Sci. Technol. 2021, 189, 103335. [Google Scholar] [CrossRef]
  22. Fan, C.; Li, H.; Qin, Q.; He, S.; Zhong, C. Geological conditions and exploration potential of shale gas reservoir in Wufeng and Longmaxi Formation of southeastern Sichuan Basin, China. J. Pet. Sci. Eng. 2020, 191, 107138. [Google Scholar] [CrossRef]
  23. Li, W.; Shi, Y.; Zhu, D.; Wang, W.; Liu, H.; Li, J.; Shi, N.; Ma, L.; Fu, S. Fine root biomass and morphology in a temperate forest are influenced more by the nitrogen treatment approach than the rate. Ecol. Indic. 2021, 130, 108031. [Google Scholar] [CrossRef]
  24. Zhang, K.; Ali, A.; Antonarakis, A.; Moghaddam, M.; Saatchi, S.; Tabatabaeenejad, A.; Chen, R.; Jaruwatanadilok, S.; Cuenca, R.; Crow, W.T.; et al. The Sensitivity of North American Terrestrial Carbon Fluxes to Spatial and Temporal Variation in Soil Moisture: An Analysis Using Radar-Derived Estimates of Root-Zone Soil Moisture. Journal of geophysical research. Biogeosciences 2019, 124, 3208–3231. [Google Scholar] [CrossRef]
  25. Lu, G.; Zhou, L.; Zhao, X.; Jia, Q.; Xie, Y.; Zhou, G. Vertical distribution characteristics of soil organic carbon and total nitrogen in reed wetland. Chin. J. Appl. Ecol. 2006, 17, 384–389. [Google Scholar]
  26. Zheng, Y.; Zhang, L.X.; Xing, W.P.; Zhang, Z. Effect of vegetation on the microwave radiation of frozen soil in cold region. Glacier Frozen Soil 2009, 31, 30–35. [Google Scholar]
  27. Liao, X.J.; He, D.J.; Wang, R.; Cai, J.; Su, S.; Zhang, Z. The distribution pattern of soil organic carbon in coastal wetlands in eastern Fujian. Wetl. Sci. 2013, 11, 192–197. [Google Scholar]
  28. Jiang, S.; Zhao, G.Y.; Zang, S.Y.; Shao, Z. DOC chemical spectral characteristics of soil under different land use patterns in the Xiaoxing’an Mountains. J. Soil Water Conserv. 2016, 30, 234–238. [Google Scholar]
  29. Zheng, H.M.; Yan, C.C.; Zhang, Y.; Zhang, N. Effects of site types on the carbon storage of natural birch forest ecosystem in Zhangguangcailing. Chin. J. Ecol. 2016, 36, 6284–6294. [Google Scholar]
  30. Ma, Y.X.; Li, D.C.; Li, X.S.; Zhang, G.; Han, Z.; Li, X. Estimation of organic carbon reliability in 1m soil using the organic carbon in the surface layer (0–20 cm) of farmland. Chin. J. Soil Sci. 2014, 51, 189–193. [Google Scholar]
  31. Xu, Q.F.; Jiang, P.K. Study on soil water-soluble organic carbon under different forest vegetation. J. Soil Water Conserv. 2004, 18, 84–87. [Google Scholar]
  32. Chang, X.L.; Jin, H.J.; Wang, Y.P.; Zhang, Y.; Zhou, G. Research progress on the influence of vegetation on permafrost. Chin. J. Ecol. 2012, 32, 7981–7990. [Google Scholar]
Figure 1. Spot map of the study area.
Processes 10 01293 g001
Figure 2. Distribution of the content of SOC and DOC in the upslope, mesoslope, and downslope (ZDOC—the content of DOC in pinus sylvestris var mongolica forest, BDOC—the content of DOC in birch forest, LDOC—the content of DOC in larch forest. ZSOC—the content of SOC in pinus sylvestris var mongolica forest, BSOC—the content of DOC in birch forest, LSOC—the content of DOC in larch forest).
Processes 10 01293 g002
Figure 3. Distribution of the content of SOC and DOC in the soil layers of vertical profiles. (ZDOC—the content of DOC in pinus sylvestris var mongolica forest, BDOC—the content of DOC in birch forest, LDOC—the content of DOC in larch forest. ZSOC—the content of SOC in pinus sylvestris var mongolica forest, BSOC—the content of DOC in birch forest, LSOC—the content of DOC in larch forest).
Processes 10 01293 g003
Table 1. Content of SOC and DOC in pinus sylvestris var. mongolica, birch, and larch forests.
Depth of Soil Layer (cm)Vegetation TypeSOCDOCDOC/SOC
0–10Pinus sylvestris var. mongolica forest106.98 ± 30.11 a246.83 ± 56.28 a2.51 ± 0.91
Birch forest103.08 ± 18.46 a790.85 ± 150.42 b8.06 ± 2.42
Larch forest186.71 ± 88.83 b621.15 ± 102.79 c4.02 ± 1.62
10–20Pinus sylvestris var. mongolica forest80.58 ± 28.71 a220.85 ± 48.92 a3.41 ± 2.09
Birch forest77.21 ± 19.98 a712.80 ± 123.73 b10.06 ± 3.83
Larch forest135.83 ± 71.21 b566.67 ± 73.74 c5.05 ± 1.86
20–30Pinus sylvestris var. mongolica forest80.58 ± 28.71 a220.85 ± 48.92 a3.41 ± 2.09
Birch forest77.21 ± 19.98 a712.80 ± 123.73 b10.06 ± 3.83
Larch forest135.83 ± 71.21 b566.67 ± 73.74 c5.05 ± 1.86
The values in the table are mean ± standard deviation; the same depth of soil layer in the same column with different letters indicates significant difference (p < 0.05). (The difference is insignificant if the same letter is labeled and significant if there is a different labeled letter. a, b, and c represent the significant level α = 0.05).
Table 2. Analysis of the influencing factors of the content of SOC and DOC.
Analysis of the Influence Factors
Site TypeForest TypeSoil Layer
SOCq statistic0.0470.2560.064
p value0.1750.0000.096
DOCq statistic0.0010.7970.034
p value0.9520.0000.277
Publisher’s Note: MDPI stays neutral with regard to jurisdictional claims in published maps and institutional affiliations.

