Article

Numerical Simulation Investigation on Fracture Propagation of Fracturing for Crossing Coal Seam Roof

Shale Gas Exploration and Development Department, CNPC Chuanqing Drilling Engineering Company Limited, Chengdu 610051, China
*
Author to whom correspondence should be addressed.
Processes 2022, 10(7), 1296; https://doi.org/10.3390/pr10071296
Submission received: 5 June 2022 / Revised: 24 June 2022 / Accepted: 29 June 2022 / Published: 30 June 2022

Abstract

:
The fracturing crossing coal seam roof is a technology that fulfills the fracturing of a coal seam through the vertical propagation of fractures. Geological conditions are the key factors determining the effect of this kind of fracturing, but there is hardly any research on this aspect. To determine the favorable geological conditions for through-roof fracturing, based on a 3D fracture propagation model, and considering the interlayer vertical fracture toughness and leak-off heterogeneity, a mathematical model of fracturing through a horizontal well in a coal seam roof was established, and the calculation method of fractures crossing layer propagation was determined. In this method, the effect of fracture communication with the coal seam is evaluated by taking the area and the area ratio of fractures in the coal seam as the objective functions. The effects of parameters such as in situ stress combination profile, coal seam fracture toughness, and fluid loss coefficient on fracturing results were evaluated. The reasonable distance from the horizontal well to the coal seam’s top surface was determined in this work. The study results show that: (i) the fracturing effect is better when the coal seam is lower in in situ stress; (ii) the distance between the horizontal well and the top surface of the coal seam is recommended to be less than 4 m to obtain the ideal fracturing effect; and (iii) the combination of the in situ stress profile is the key factor, and the fracture toughness and fluid loss coefficient of the coal seam, fluid viscosity, and the number of perforations in one cluster are the secondary factors affecting the fracturing effect.

1. Introduction

With soft coal seams widely distributed in eastern North China, Southern and Southwestern China, and the Ordos Basin, China has rich coalbed methane resources [1,2,3,4]. These coal seams with poor physical properties, low porosity, and permeability are difficult to develop [5,6,7,8] and need to be fractured to become economically viable. As the coal seams are low in strength and fragile, drilling and fracturing within coal seams could contaminate coal seams by drilling fluid and collapse of the well wall, which is not conducive to subsequent fracturing and development. Fracturing through the coal seam roof [9] provides a new method for gas development in soft coal seams. This technique fractures in the roof of the coal seam and achieves the fracturing of the coal seam through vertical propagation of fractures. Drawing on the idea of large-scale fracturing of shale gas, theoretical research and application of horizontal well-staged multi-cluster fracturing have also been carried out for coalbed roofs [10,11]. The fracture propagation law and adaptability conditions of horizontal well fracturing processes in the coal bed roof are theoretical, and engineering issues need to be studied urgently for through-roof fracturing.
Some theoretical and field experimental studies on fracturing or penetration fracturing through a coal seam roof have been carried out. To date, the related research focuses on the effects of fracturing parameters and perforation parameters on crossing layer fracture propagation [12,13,14,15], optimization of development technology of horizontal wells in a coal seam roof [16,17], fracture initiation pressure of a coal seam or coal seam roof [18,19], properties of different roof rocks of a coal seam [20], fracture characteristics of rock mass during mining [21,22,23], and the effects of coal mechanical parameters on proppant embedding [24,25]. However, few studies on favorable geological conditions suitable for fracturing through horizontal wells in a coal seam roof have been reported. Hence, the accurate design of distance from the horizontal well to the top surface of the coal seam and cluster spacing lack theoretical basis.
To address the above issues, a mathematical model of fracture propagation in horizontal well multi-cluster fracturing through a coal seam roof has been established based on a planar three-dimensional multi-fracture propagation model [26], which considers both interlayer vertical fracture toughness and filter loss heterogeneity in this work. Based on this model, the effects of different geological conditions on fracture propagation were evaluated by the area of fractures in the coal seam and its ratio to the total fracture area to determine the in situ stress profile, coal seam fracture toughness, fluid loss coefficient suitable for fracturing through the coal seam roof, and the reasonable distance between the horizontal well and the top of the coal seam. The research results can guide the economic and large-scale development of coalbed methane in China.

2. Mathematical Model

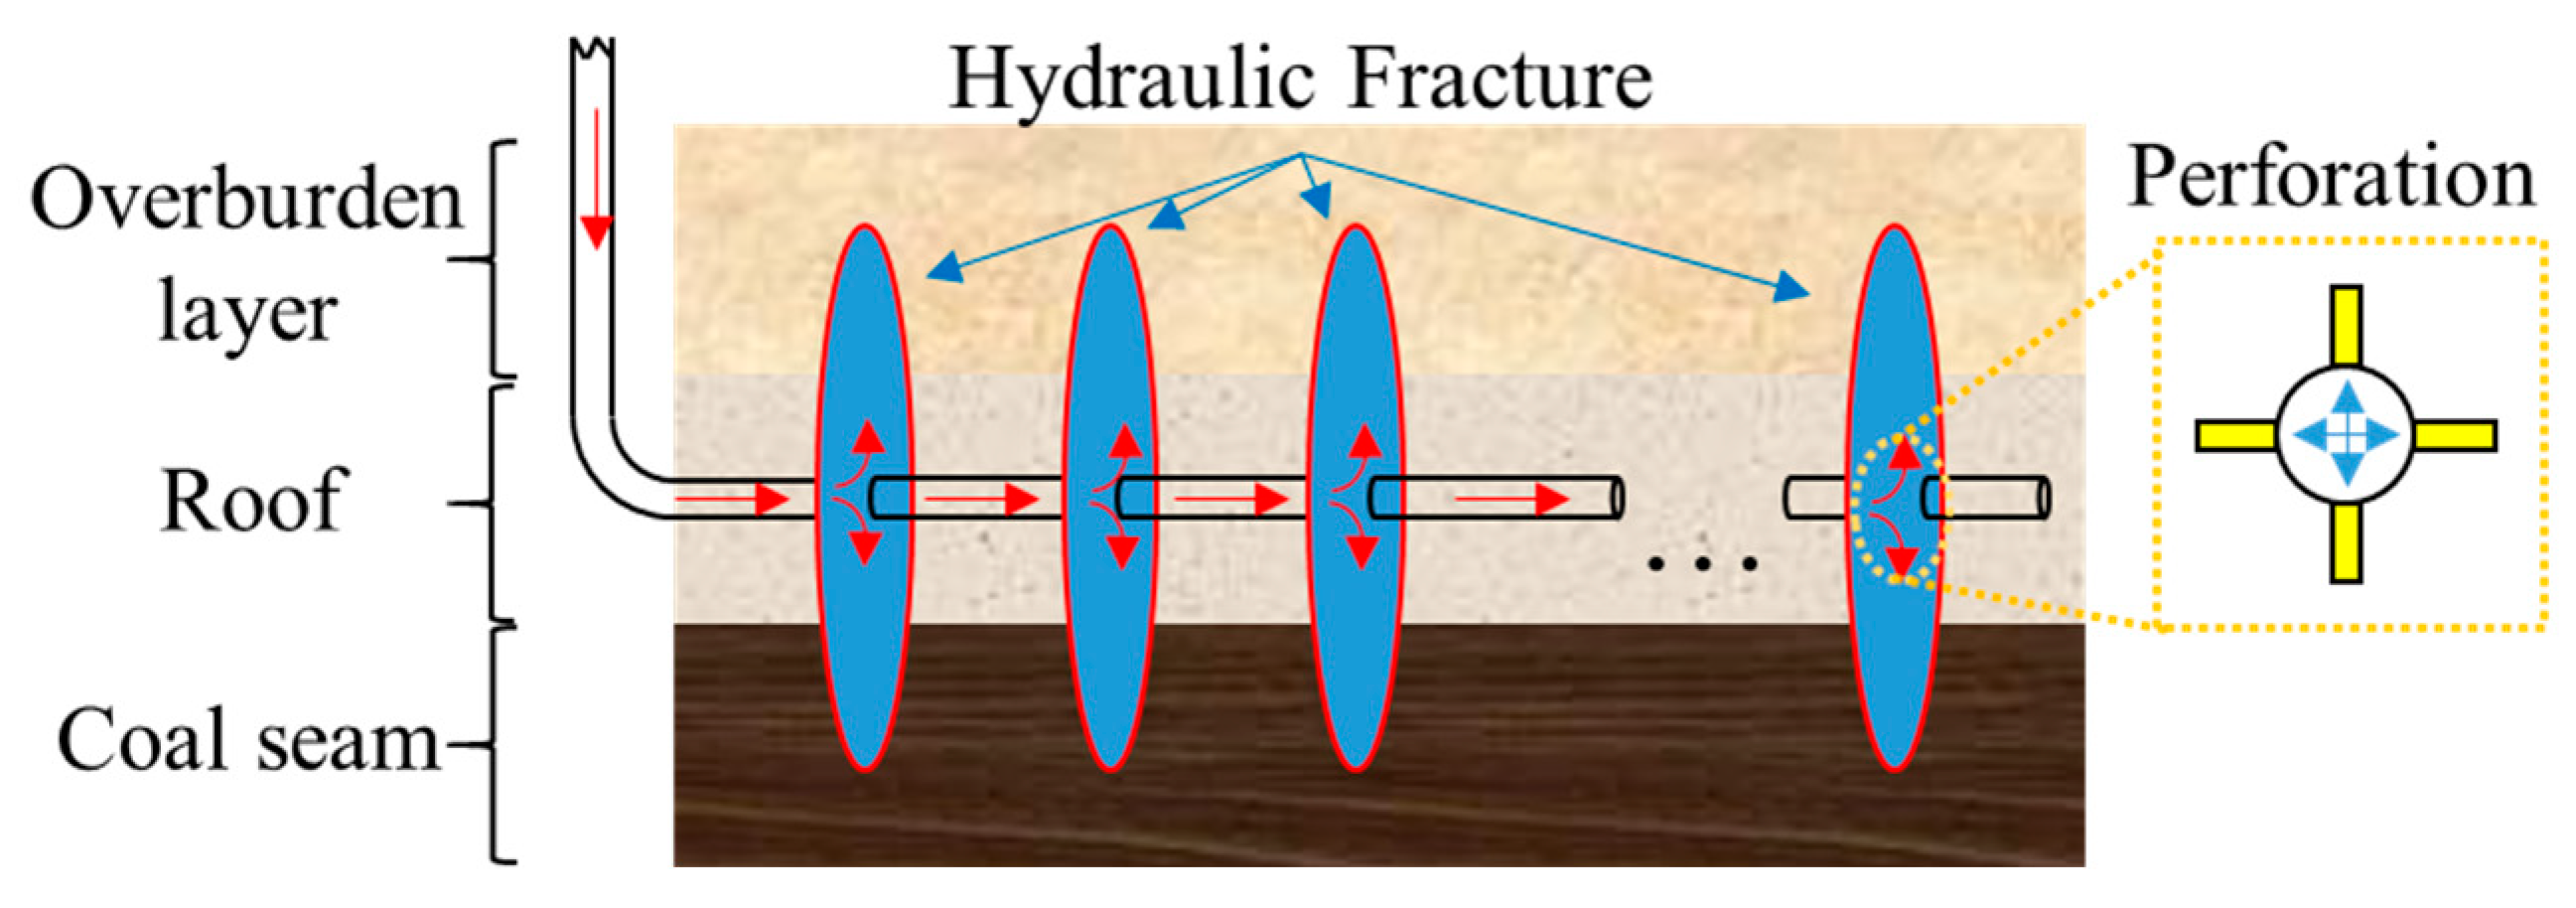
2.1. Multi-Fracture Propagation Model for Multi-Cluster Fracturing

2.1.1. Rock Deformation Model

A three-dimensional displacement discontinuity model is used to calculate the rock deformation. The shear displacement discontinuity of a planar fracture is zero, so the relationship between the pressure in the fracture and the width of the fracture can be described by Equation (1)
p f σ h = A ( t ) C ( x x ' , y y ' , z z ' ) w ( x ' , y ' , z ' ) d A
The specific form of Green’s function C is [27]
C = E 8 π ( 1 v 2 ) 1 [ ( x x ' ) 2 + ( y y ' ) 2 + ( z z ' ) 2 ] 0.5

2.1.2. Flow Equation of Fluid in the Hydraulic Fracture

The governing equation of fluid flow in the fracture is
q = w 3 12 μ p f
The component form of Equation (3) is
{ q x = w 3 12 μ p f x q y = w 3 12 μ p f y
The continuity equation of fluid flow in the fracture is
w t + q + 2 C l t t 0 = δ ( x x in , k , y y in , k , z z in , k ) Q k , k = 1 , 2 , , n f
Equation (3) is substituted into Equation (5) to obtain
w t = ( w 3 12 μ p f ) + 2 C l t t 0 + δ ( x x in , k , y y in , k , z z in , k ) Q k , k = 1 , 2 , , n f

2.1.3. Equation of Fluid Flow in the Wellbore

The injected fracturing fluid passes through the wellbore and perforation holes into clusters of fractures in multi-cluster fracturing. The “wellbore–perforation–fracture” system controls the amount of fluid injected into each group and is controlled by the “wellbore–perforation–fracture” system. The inlet pressure of each fracture cluster satisfies
p w = p p , k + p t , k + p i n , k , k = 1 , 2 , , n f
Pressure drop through perforation holes is [28]
p p , k = 0.807 ρ Q k 2 n k 2 d k 4 K k 2
The flow friction in the wellbore is calculated using Churchill’s entire flow regime equation [29]. Meanwhile, the fractional flow rate of each cluster satisfies the mass conservation law, i.e.,
Q T = I = 1 n f Q in , k

2.1.4. Initial and Boundary Conditions

The inlet flow of each fracture satisfies
Q | in = w 3 12 μ p n = Q in , k
When the stress intensity factor at the crack tip satisfies the fracture toughness of a layer of rock, the crack will extend.
K tip = K Ic
The tip stress intensity factor is calculated by [30].
K tip = 0.806 E π w t i p 4 ( 1 v 2 ) D x

2.2. Solution Method of the Model

A fixed grid system is used to calculate crack propagation, and the fixed grid system is a rectangular cell-structured one. Each cell is labeled as (i,j,k), and the corresponding position is (xi,yj,zk). There are four kinds of elements: channel element, tip element, survey element, and non-activated element, as shown in Figure 1. The cell type is updated by determining whether the tip cell meets the propagation condition. The cell center point is the unknown quantity point (width and pressure) for a solution, and the cell boundary is the location of the calculated flow.
All open units and tip units are labeled sequentially as I, and the number of cells at the current moment is Ne, I = 1,2,.., Ne. The equations are discretized by using the constant unit displacement discontinuity method (as in Equation (1)) to obtain
p I = J = 1 N e C I J w J + σ h
CIJ can be deduced from Equation (2). The matrix form of Equation (13) is
p = C w + σ h
The discrete form of the flow equation (Equation (6)) is established using the finite volume method.
Δ w i , j , k = Δ t 12 μ D x [ ( w i + 1 2 , j , k 3 p i + 1 , j , k p i , j , k D x w i 1 2 , j , k 3 p i , j , k p i 1 , j , k D x ) ] + Δ t 12 μ D y [ ( w i , j + 1 2 , k 3 p i , j + 1 , k p i , j , k D y w i , j 1 2 , k 3 p i , j , k p i , j 1 , k D y ) ] 4 C l t t 0 + Δ t Q k
To calculate the wellbore flow distribution based on the wellbore conditions.
F ( Q 1 , Q 2 , , Q n f , p w ) = 0
The components of Equation (16) are
{ F 1 ( Q 1 , Q 2 , , Q n f , p w ) = p w 0.807 ρ Q 1 2 n 1 2 d 1 4 K 1 2 p t , 1 p in , 1 ( Q 1 , Q 2 , , Q n f , p w ) F k ( Q 1 , Q 2 , , Q n f , p w ) = p w 0.807 ρ Q k 2 n k 2 d k 4 K k 2 p t , k p in , k ( Q 1 , Q 2 , , Q n f , p w ) F n f ( Q 1 , Q 2 , , Q N , p w ) = p w 0.807 ρ Q N 2 n k 2 d k 4 K k 2 p t , n f p in , n f ( Q 1 , Q 2 , , Q n f , p w ) F n f + 1 ( Q 1 , Q 2 , , Q N , p w ) = Q T k = 1 n f Q k
The Newton–Raphson method is used to solve Equation (16), and the solution of Equation (16) is iterated with the fluid–solid coupling Equations (14) and (15) to calculate the flow rate of each cluster. The fluid–solid coupling equations are stiff. Solving stiff equations with a general implicit method requires many iterations, making the computation low efficiency. Hence, the Runge–Kutta–Legendre approach with 2nd order accuracy accelerates the model calculation [26,31]. The model accuracy has been fully validated by the results of penny fracture analytical solutions [32,33] and physical modeling experiments [34]. The model is solved programmatically using MATLAB, and the calculations are fully vectorized and have high inefficiency.

3. Results and Analysis

To determine the influences of different geological parameters on the effective fracture area and effective area ratio, the fracturing effects under other in situ stress combination profiles, distances from horizontal well to the top surface of the coal seam, coal seam fracture toughness values, and fluid loss coefficients of Well PX2-1 in Panyidong coal mine, southern Anhui province were analyzed [35]. The fracture penetration geometric model is shown in Figure 2.
The basic parameters: the strata from top to bottom were “overlying layer–roof layer coal layer,” the roof layer was 20 m thick; all the rock layers had the same elastic modulus E of 10.0 GPa, Poisson’s ratio v of 0.2, vertical fracture toughness KIcv of 0.5 MPa·m0.5, and fluid loss coefficient Cl of 1.0 × 10⁻⁴ m/min0.5. The fracturing fluid with a viscosity μ of 10.0 mPa.s was injected for 10 min at the pumping rate Q of 10.0 m3/min. The perforation holes were 12.0 mm in diameter and 0.8 in abrasion coefficient. Each cluster had 16 perforation holes, and the cluster spacing was 15 m. The grids were set at Δx × Δy = 2 m × 2 m. The four kinds of in situ stress combinations are shown in Figure 3, in which the layers from top to bottom are “overlying layer–roof layer–coal seam.” The distance d between the horizontal well and the top surface of the coal seam shown in Figure 3 ranged from 2 to 10 m. The effects of different geological conditions on the fracturing outcome were analyzed by taking the single-stage 3-cluster fracturing case as an example to determine the geological conditions suitable for through-roof fracturing.

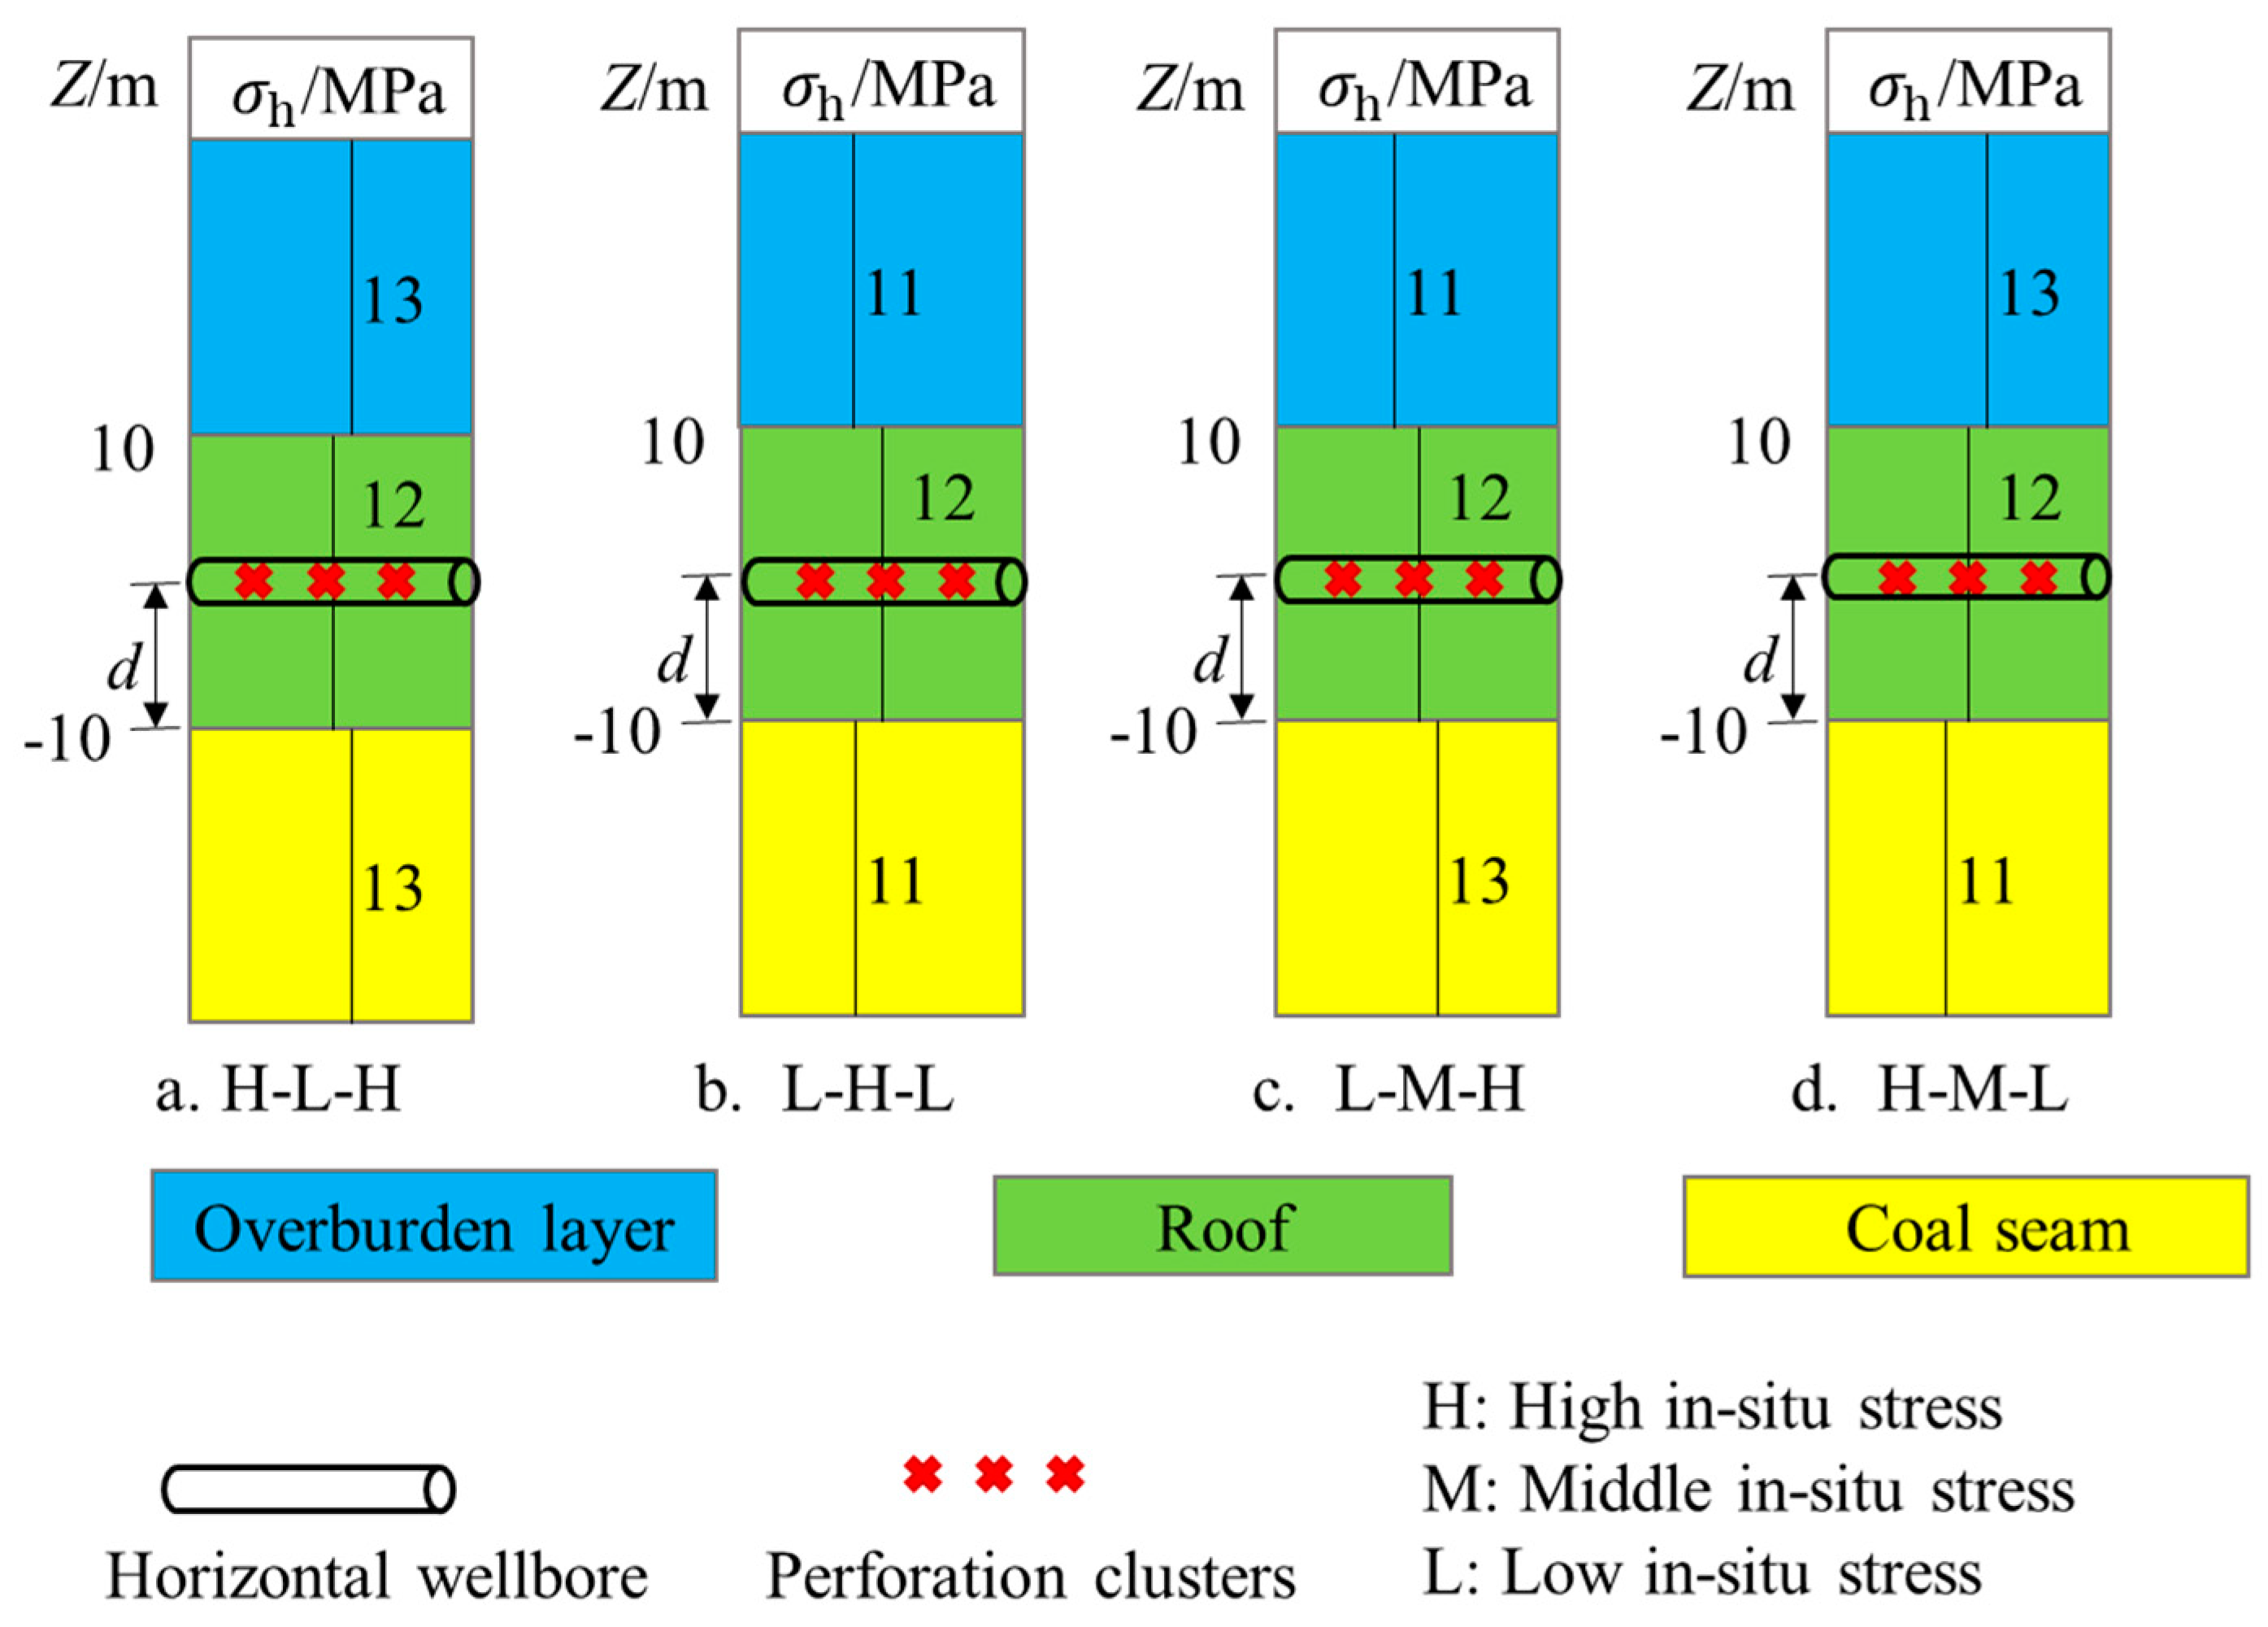
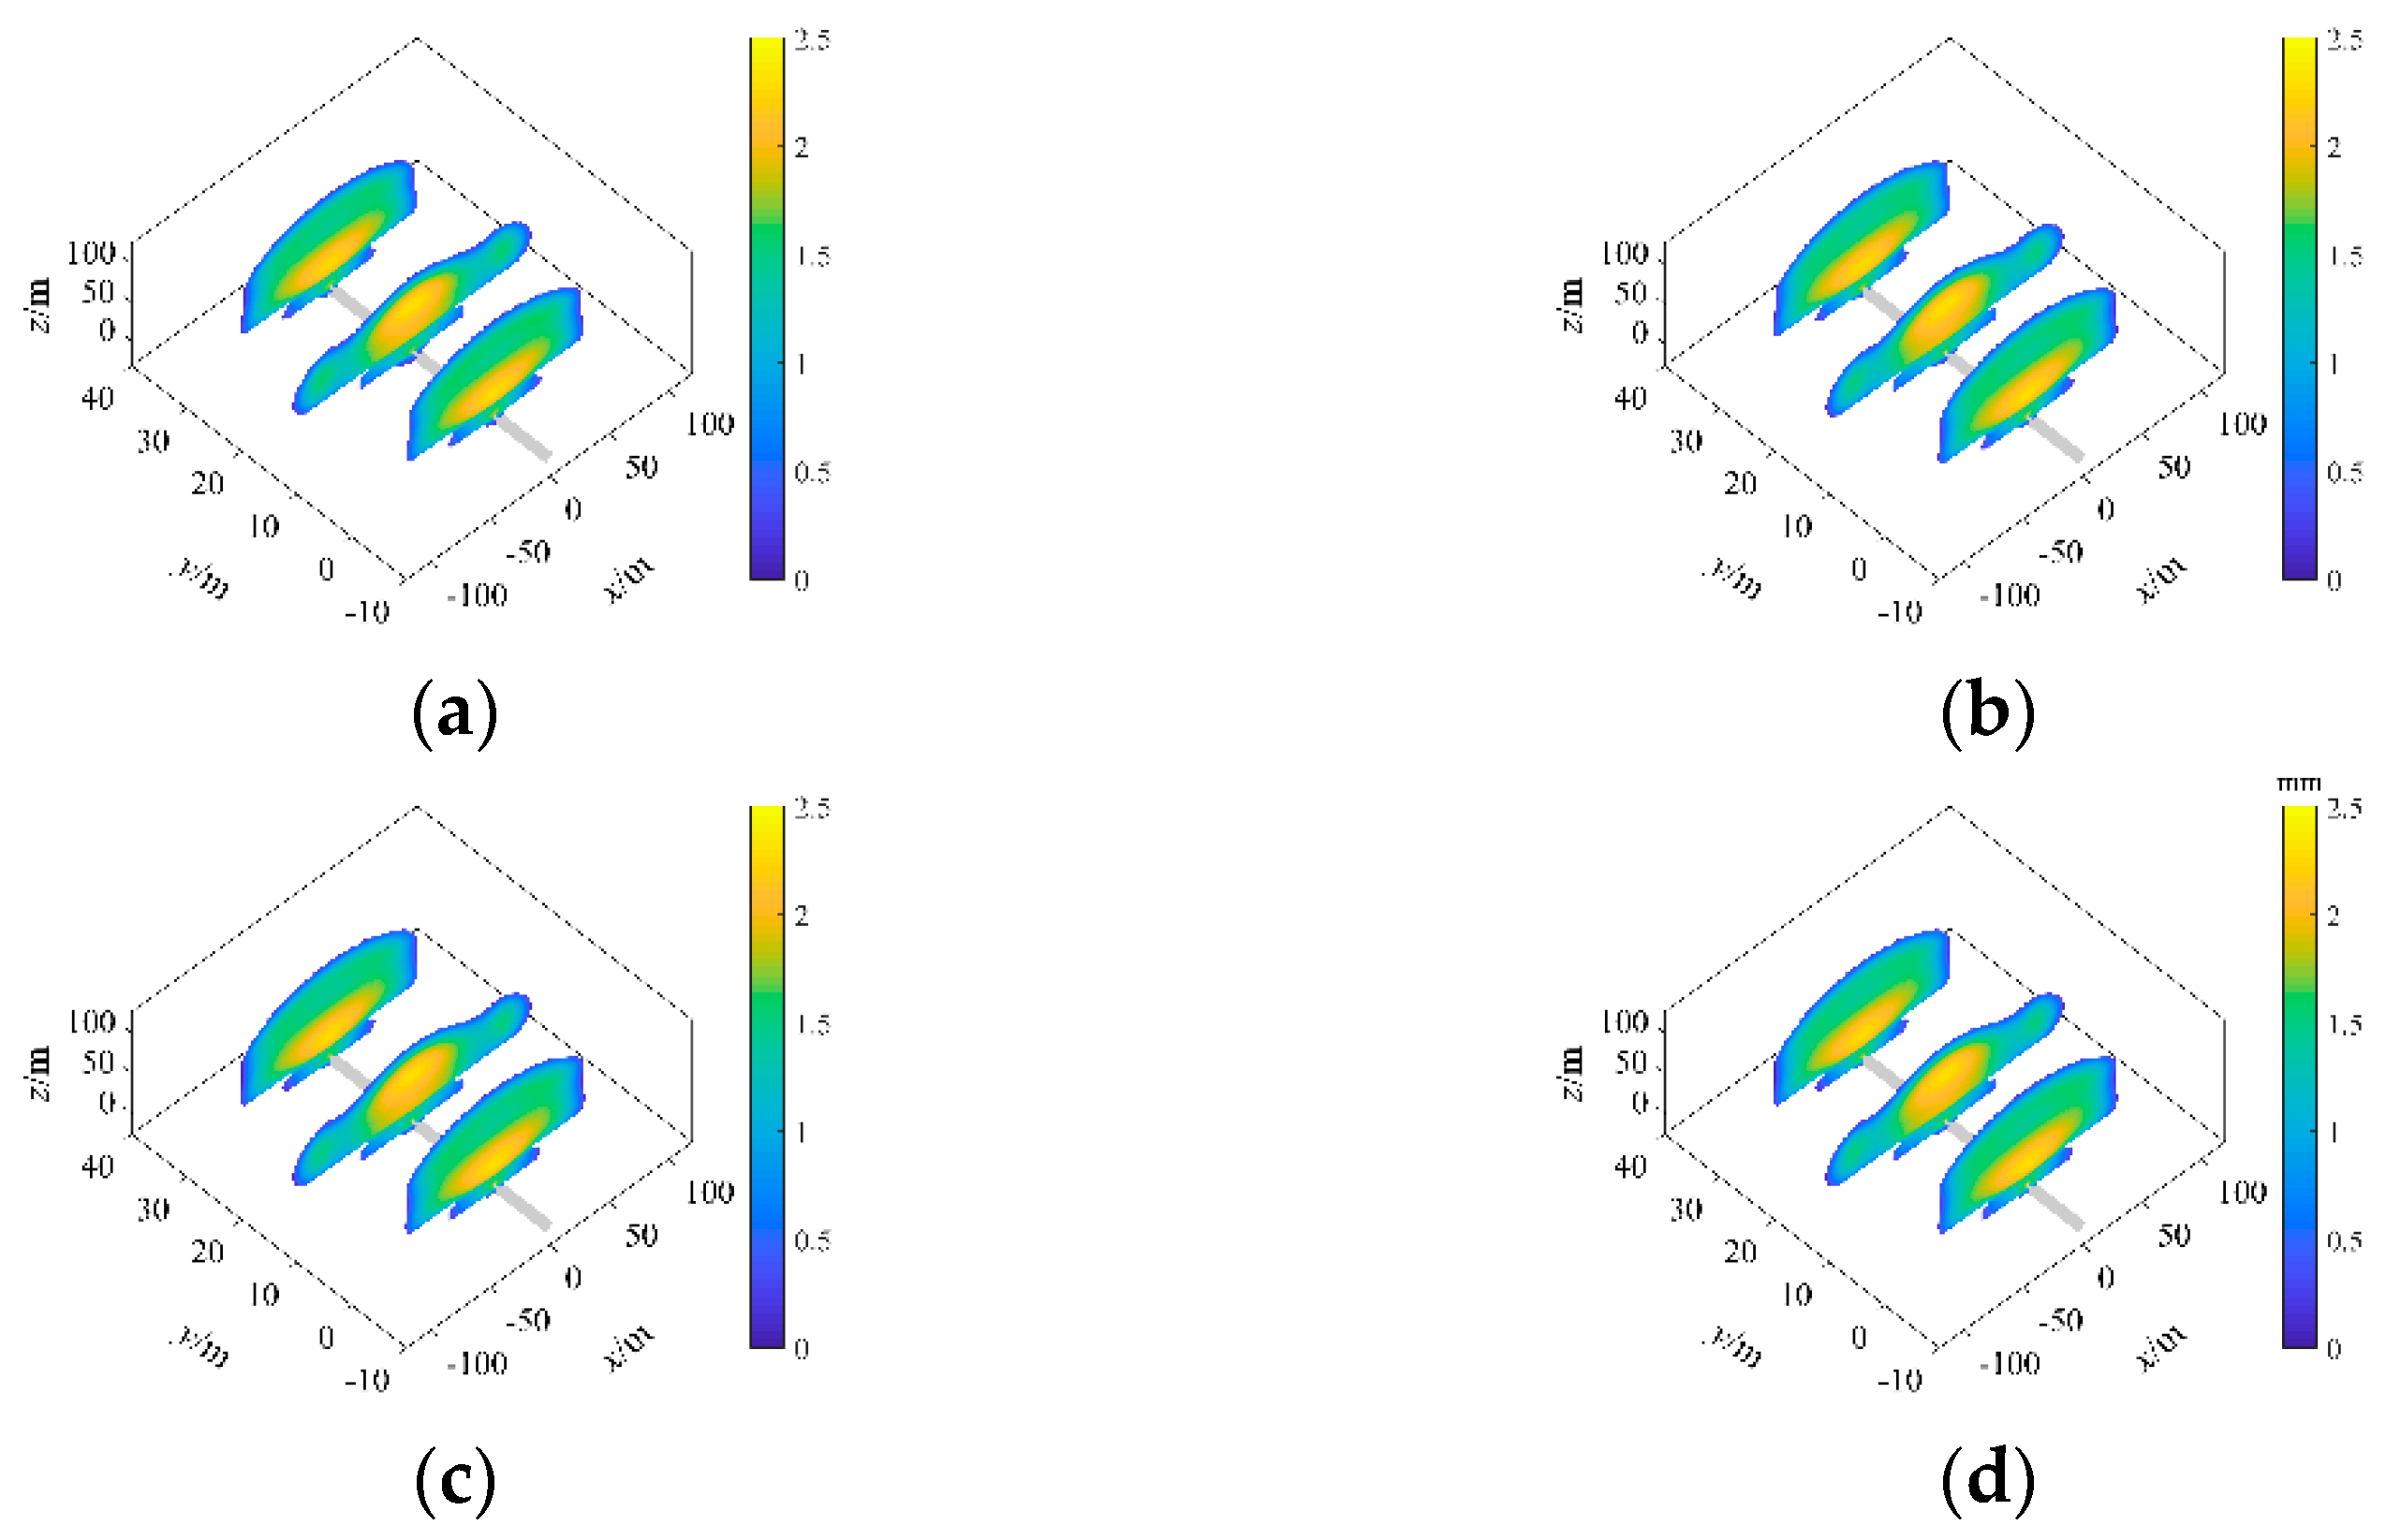
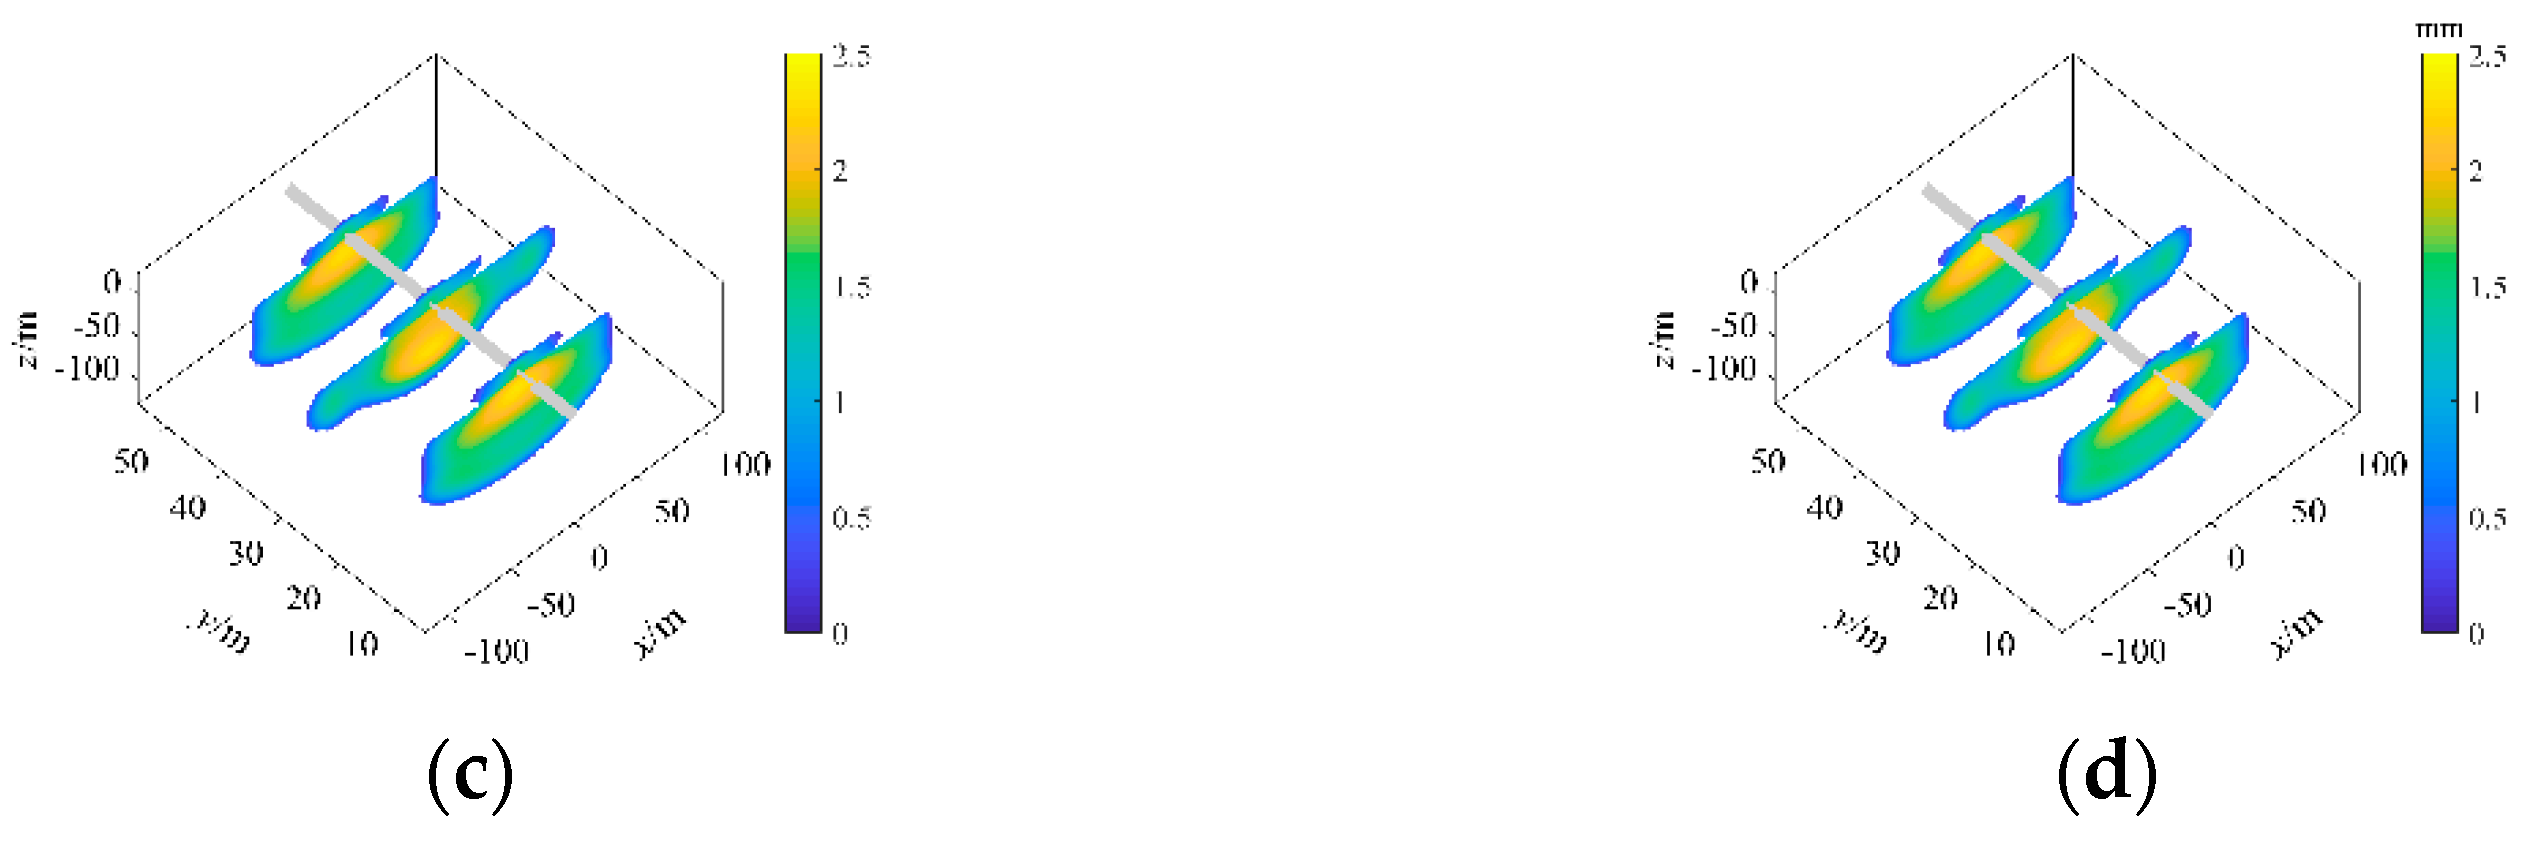
3.1. In Situ Stress Profiles

Firstly, the effects of different in situ stress profiles on fracture crossing layer propagation were analyzed. To visually compare the impact of fractures communicating with the coal seam under other geological parameters, the fracture area within the coal seam was taken as the effective area Ac. The fracture area ratio within the coal seam was taken as the effective area ratio RA (Equation (18)), and the other parameters were kept constant to simulate the fracture crossing layer propagation results under four (Figure 3) different combinations of in situ stresses of “overlying layer–roof layer–coal seam”, respectively.
R A = A c A t

3.1.1. “High–Low–High” In Situ Stress Profile

Under the in situ stress combination profile of “overlying layer–roof layer–coal seam” (13 MPa–12 MPa–13 MPa) shown in Figure 3a, the effect of distance from the horizontal well section to the top surface of the coal seam d on the fracturing was analyzed.
Under this combination profile of in situ stresses, the fractures formed under different distances from the horizontal well section to the top surface of the coal seam had little differences in shape (e.g., Figure 4), most of them were located within the roof layer, and fractures growing into the coal seam accounted for a small proportion. Compared with the overlying layer and the coal seam, the roof layer had lower in situ stress, and the fractures met the least resistance when propagating within the roof layer. The fractures must overcome larger resistance to grow further into the coal seam when reaching the interface between the roof layer and the coal seam. Therefore, in this case, the fractures are more likely to propagate in the roof layer and unlikely to communicate with the coal seam.
In addition, due to the stress interference between fractures [36], the fractures in the middle of a cluster are shorter than those on both sides. The fractures start to expand vertically when the induced stress exceeds the interlayer stress difference, resulting in a relatively large fracture height and uneven fracture propagation.
Figure 5 shows that the smaller the distance from the horizontal well to the top surface of the coal seam, the larger the fracture area in the coal seam is, but the increasing degree is small (1–2%). The ratios of effective regions corresponding to 10 and 2 m from the horizontal well to the top surface of the coal seam were both at 36–38%, and the effective areas were both at 1.40 × 10⁴–1.54 × 10⁴ m2; indicating that decreasing the distance d can slightly improve the fracturing effect.

3.1.2. “Low–High–Low” In Situ Stress Profile

Under the combination of in situ stresses of “overlying layer–roof layer–coal seam” (11 MPa–12 MPa–11 MPa) shown in Figure 3b, the effect of the distance from the horizontal well section to the top surface of the coal seam d on the fracturing was analyzed.
Figure 6 shows that under this in situ stress profile, the fractures generated under different distances from the horizontal well to the top surface of the coal seam vary significantly in shape. Since the roof layer was high in stress, the fractures met the most significant resistance when propagating within the roof layer and the least resistance when propagating in the coal seam; therefore, once penetrating the interface between the roof layer and the coal seam, the fractures would extend more easily in the coal seam with lower in situ stress.
Figure 7 shows that the smaller the distance from the horizontal well to the top surface of the coal seam, the easier it is for the fractures to penetrate the roof layer and extend toward the coal seam. As the distance d decreased from 10 to 2 m, the effective area ratio increased from 40% to 68%, and the effective area increased from 2 × 10⁴ to 3.8 × 10⁴ m2, indicating that the fracturing effect improved significantly.
Assuming that the effective area ratio of greater than 60% indicates that the in situ stress combination profile is suitable for through-roof fracturing, then the distance from the horizontal well to the top surface of the coal seam of 2–4 m is proper for this in situ stress combination profile (11 MPa–12 MPa–11 MPa). When the distance from the horizontal well section to the coal seam top was more than 4 m, fractures communicating with the coal seam reduced, resulting in effective area ratios of less than 60%.

3.1.3. “Low–Middle–High” In Situ Stress Profile

The effect of distance from the horizontal section to the top surface of the coal seam on the fracturing result under the combined in situ stress profile of the “overlying layer–roof layer–coal seam” (11 MPa–12 MPa–13 MPa) shown in Figure 3c was analyzed.
Figure 8 shows that under this combination of in situ stresses, the fractures formed at different distances from the horizontal well to the top surface of the coal seam have little difference in shape. Compared with the roof layer, the coal seam had higher in situ stress in this case, so when propagating in the coal seam, the fractures met higher resistance and were not easy to expand, resulting in poor communication with the coal seam.
Figure 9 shows that as the distance from the horizontal well to the top surface of the coal seam decreased from 10 to 2 m, the fractures always grew to the roof and overlying layers with lower in situ stresses but were hard to grow in the coal seam. Meanwhile, the effective area ratio increased from 3% to 8%, and the effective area from 1000 to 3000 m2. In other words, the effective area at d of 2 m is nearly two times that at d of 10 m. However, compared with the case under the in situ stress combination profile of 11 MPa–12 MPa–11 MPa, the effective area and effective area ratio, in this case, are nearly 10 times smaller. Clearly, under this in situ stress combination profile, fractures have ineffective communication with the coal seam; in other words, this combined stress profile is not ideal for fracturing through a horizontal well in the roof layer.

3.1.4. “High–Medium–Low” In Situ Stress Profile

The effect of the distance from the horizontal well section to the top surface of the coal seam on the fracturing result under the combination of in situ stresses of “overlying layer–roof layer–coal seam” (13 MPa–12 MPa–11 MPa) shown in Figure 3d was simulated.
Figure 10 shows that the fractures formed at different distances from the horizontal well to the top surface of the coal seam under this combined stress profile have little differences in shape. Figure 11 shows that the fractures tend to be more likely to expand towards the coal seam under this combined stress profile. The combined stress profile is the main factor affecting the fracturing effect, so the effective area and its ratio did not increase significantly as the distance from the horizontal well to the top surface of the coal seam decreased. However, under this combined stress profile, the effective area ratios and effective areas at different d were all greater than 90% and 4 × 10⁴ m2, indicating the fractures were well communicated with the coal seam. That is to say, this combined in situ stress profile is most suitable for fracturing through the horizontal well in the roof of the coal seam.

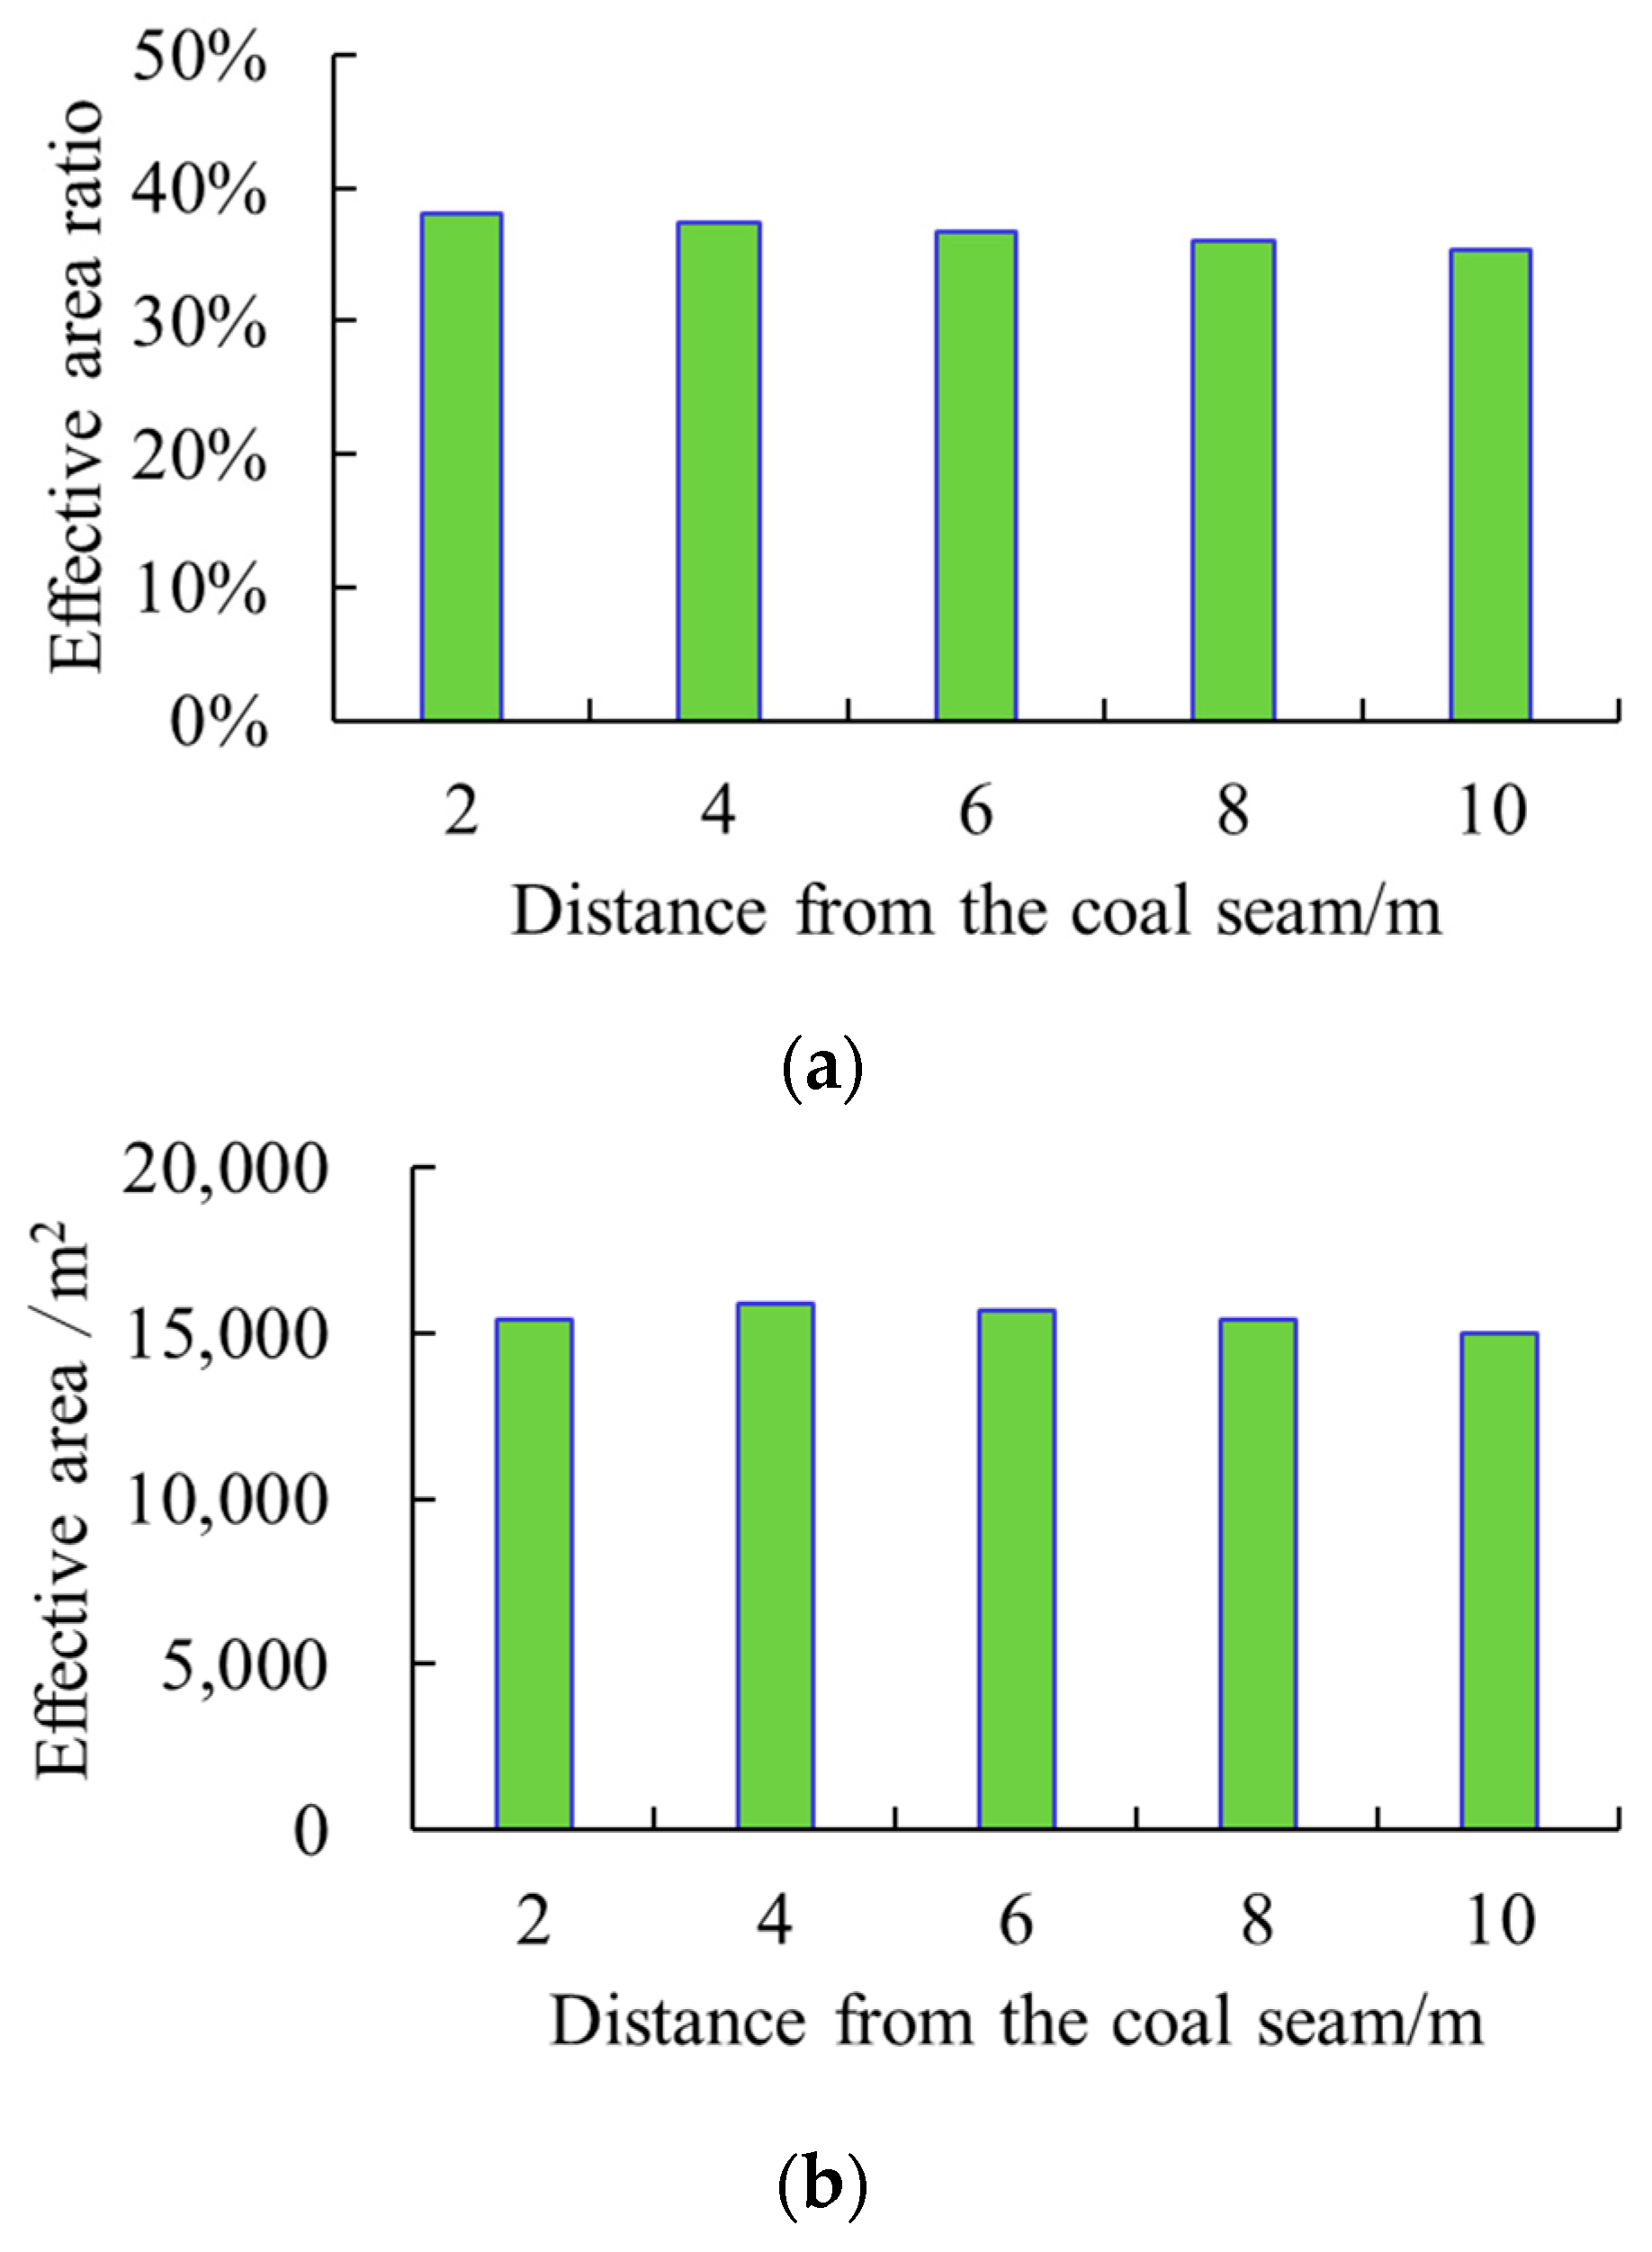
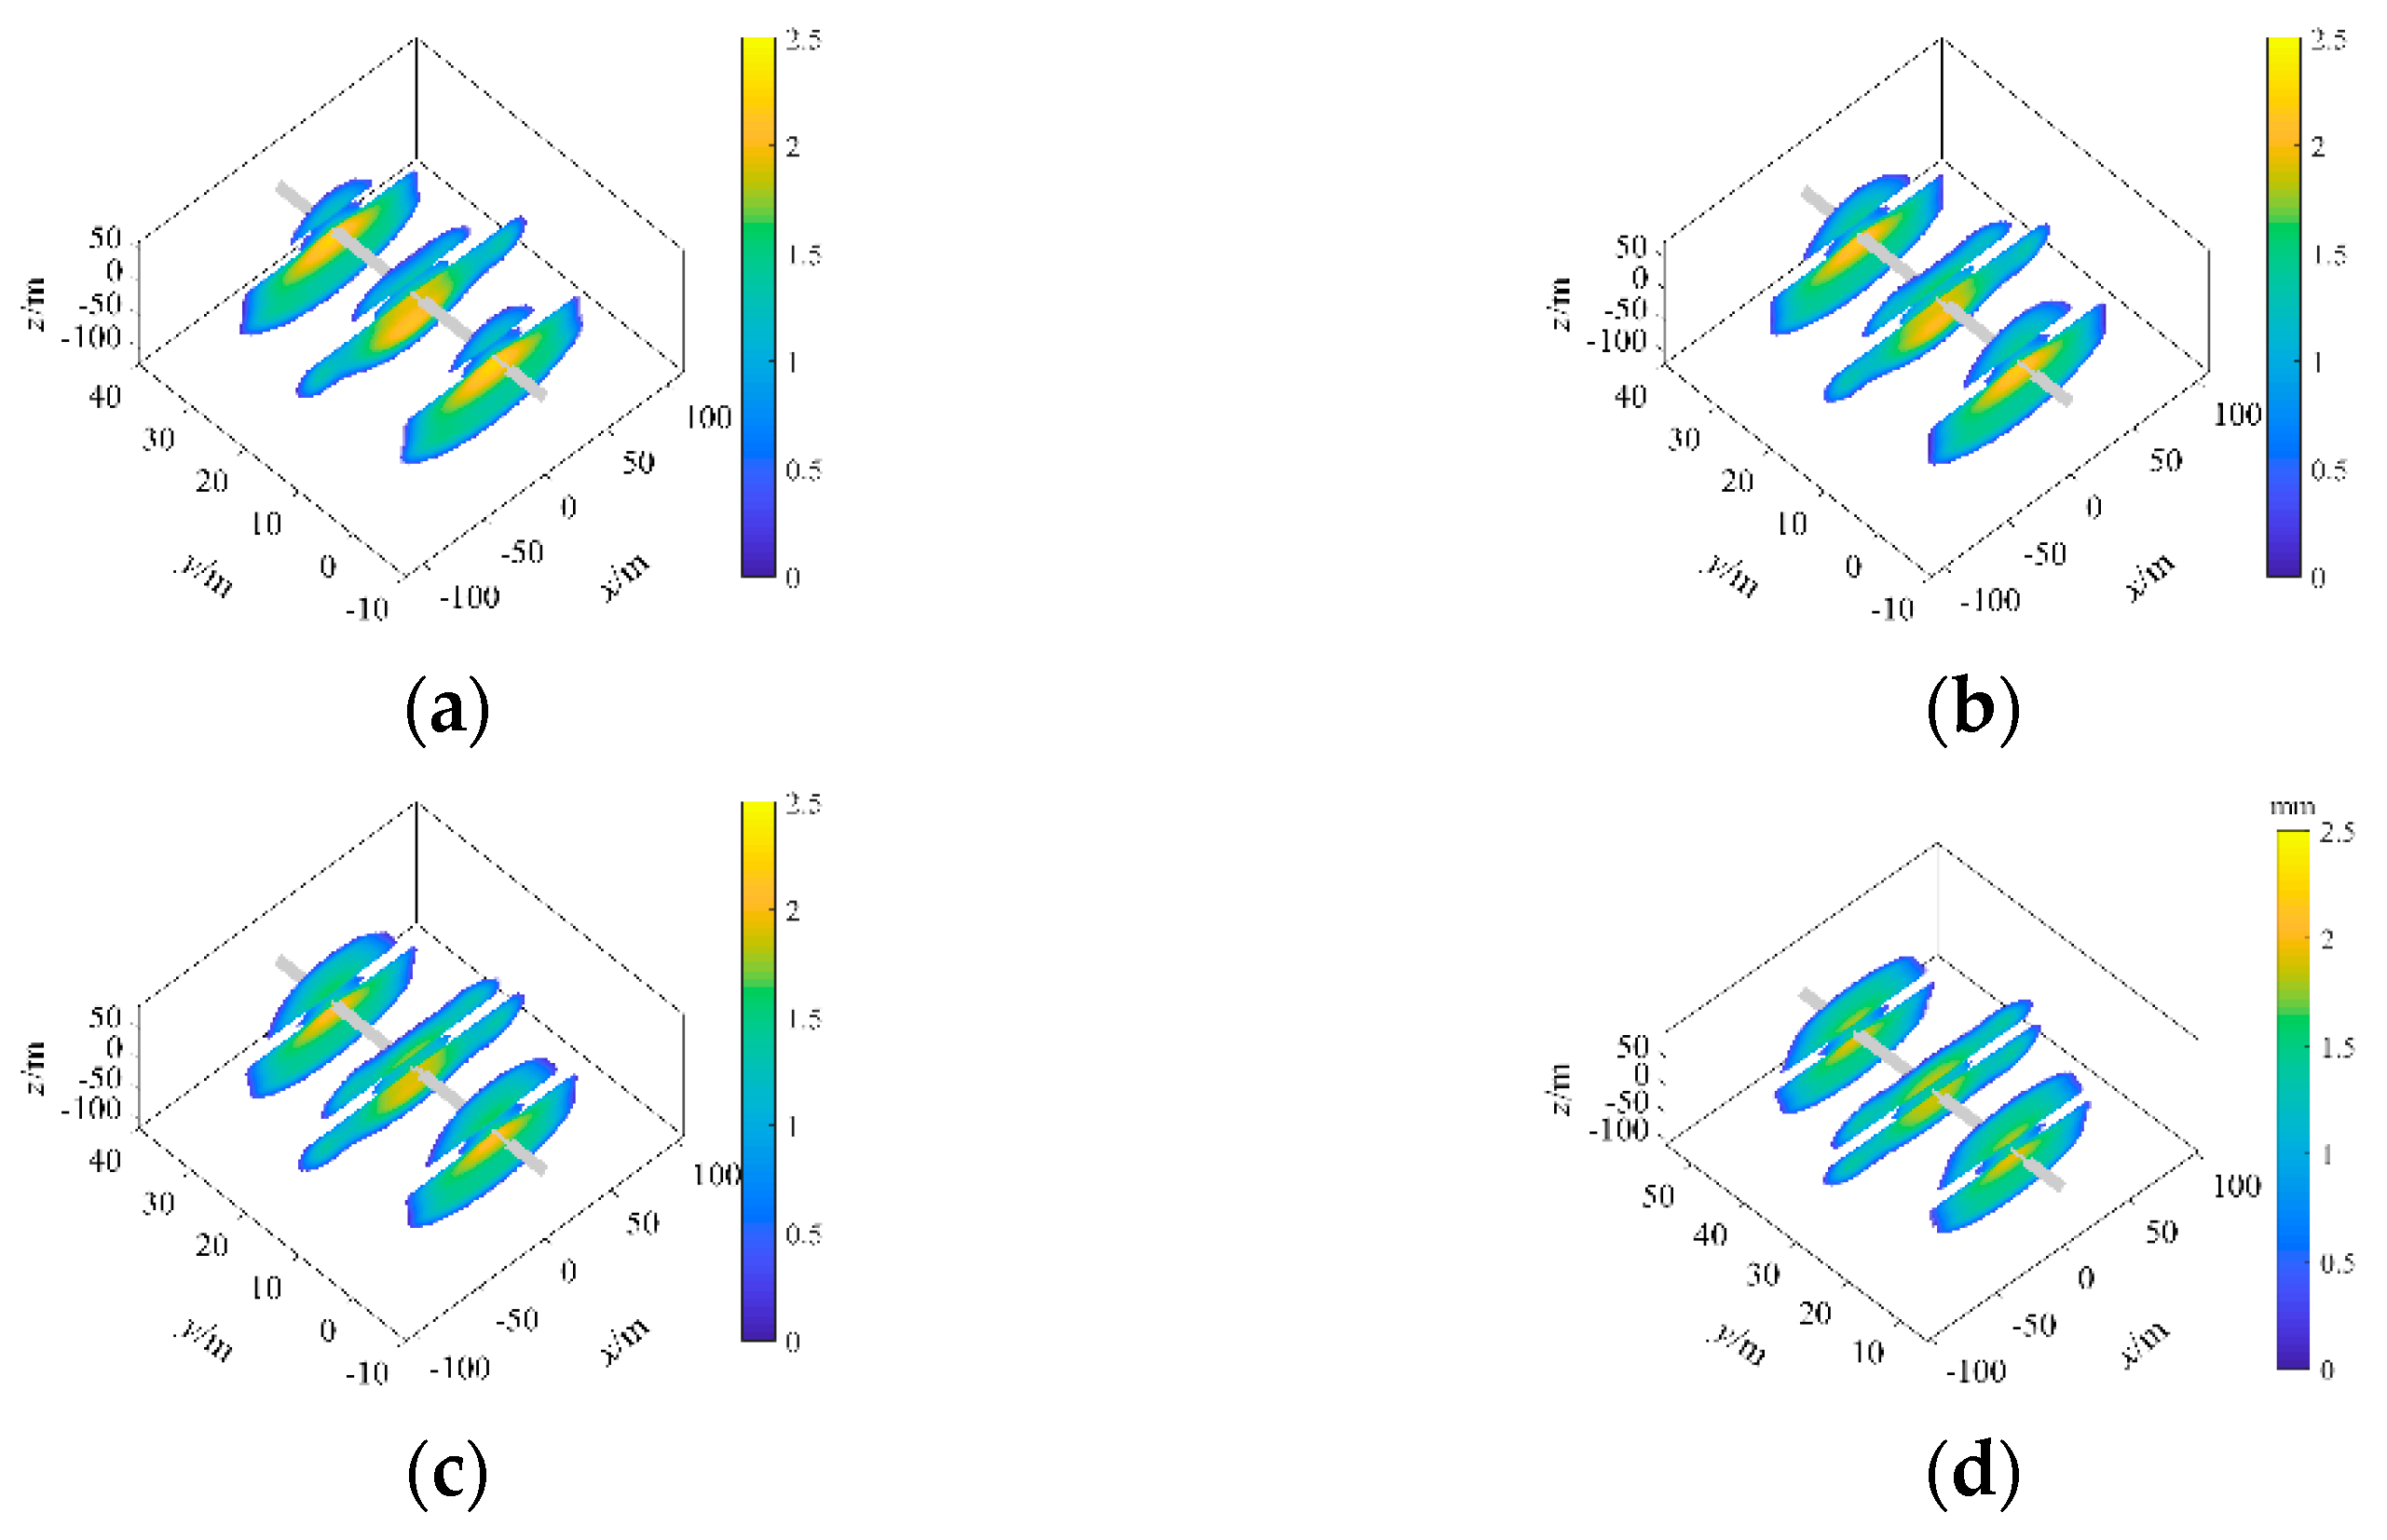
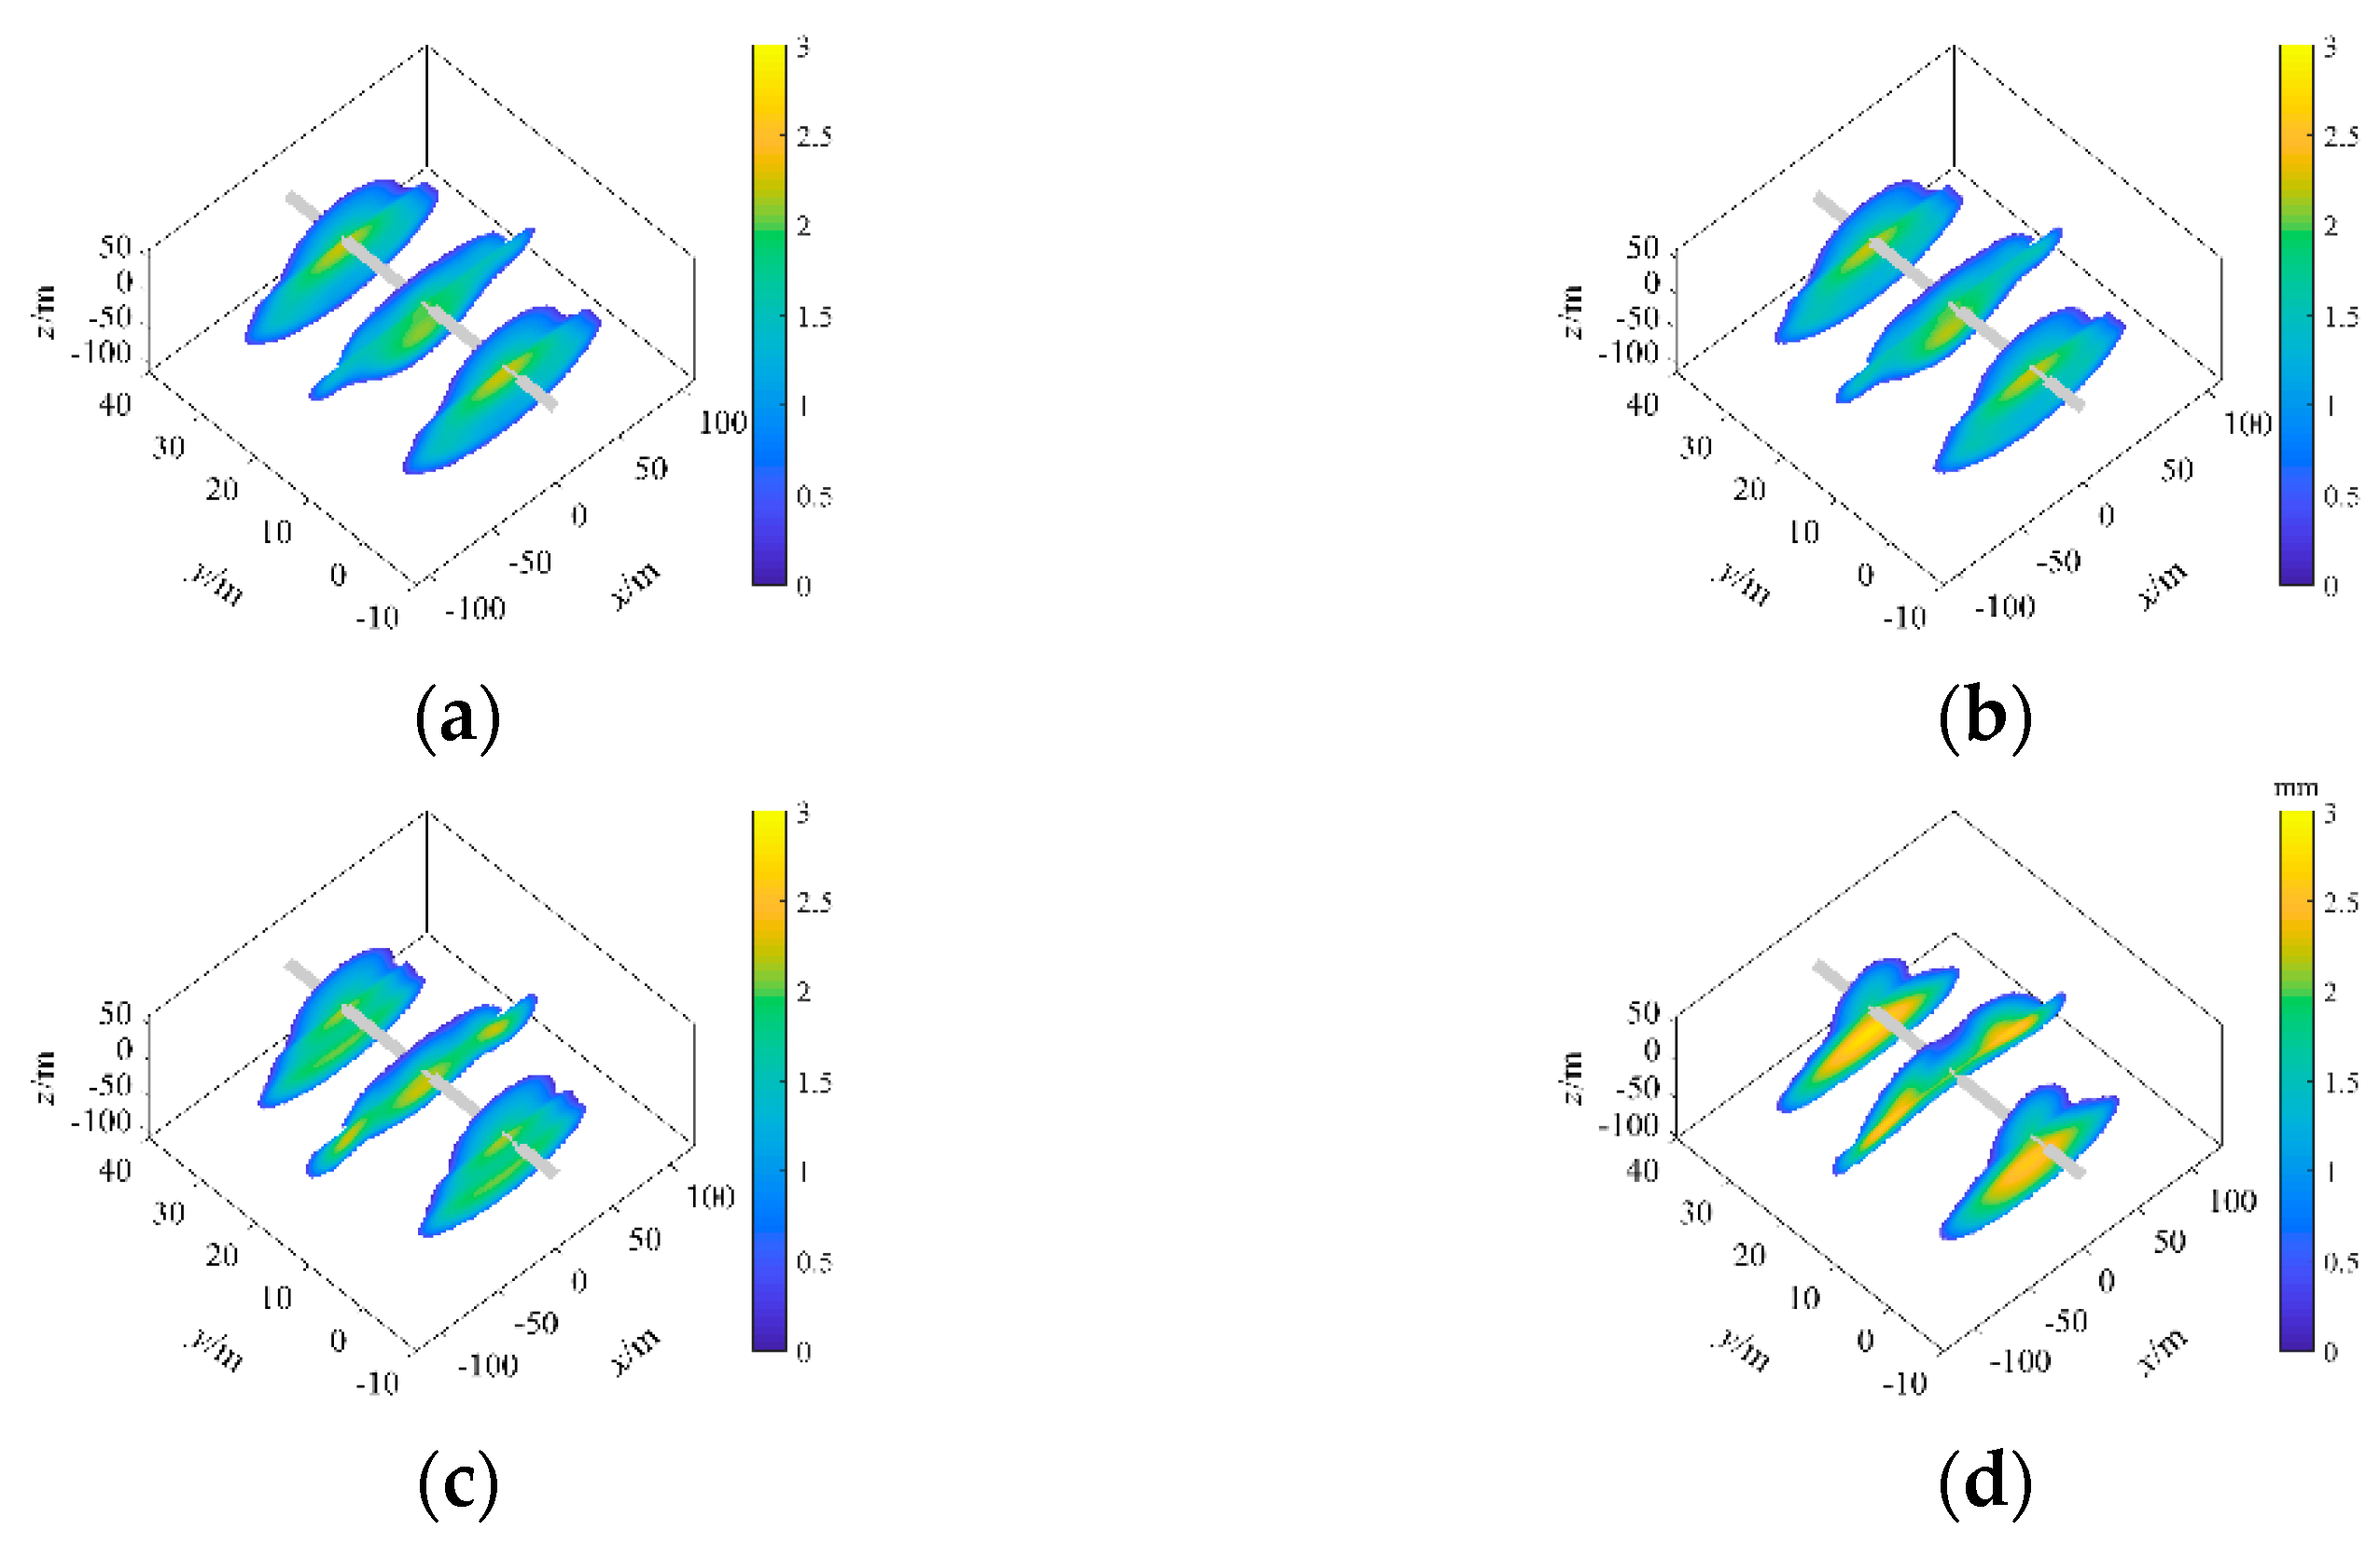
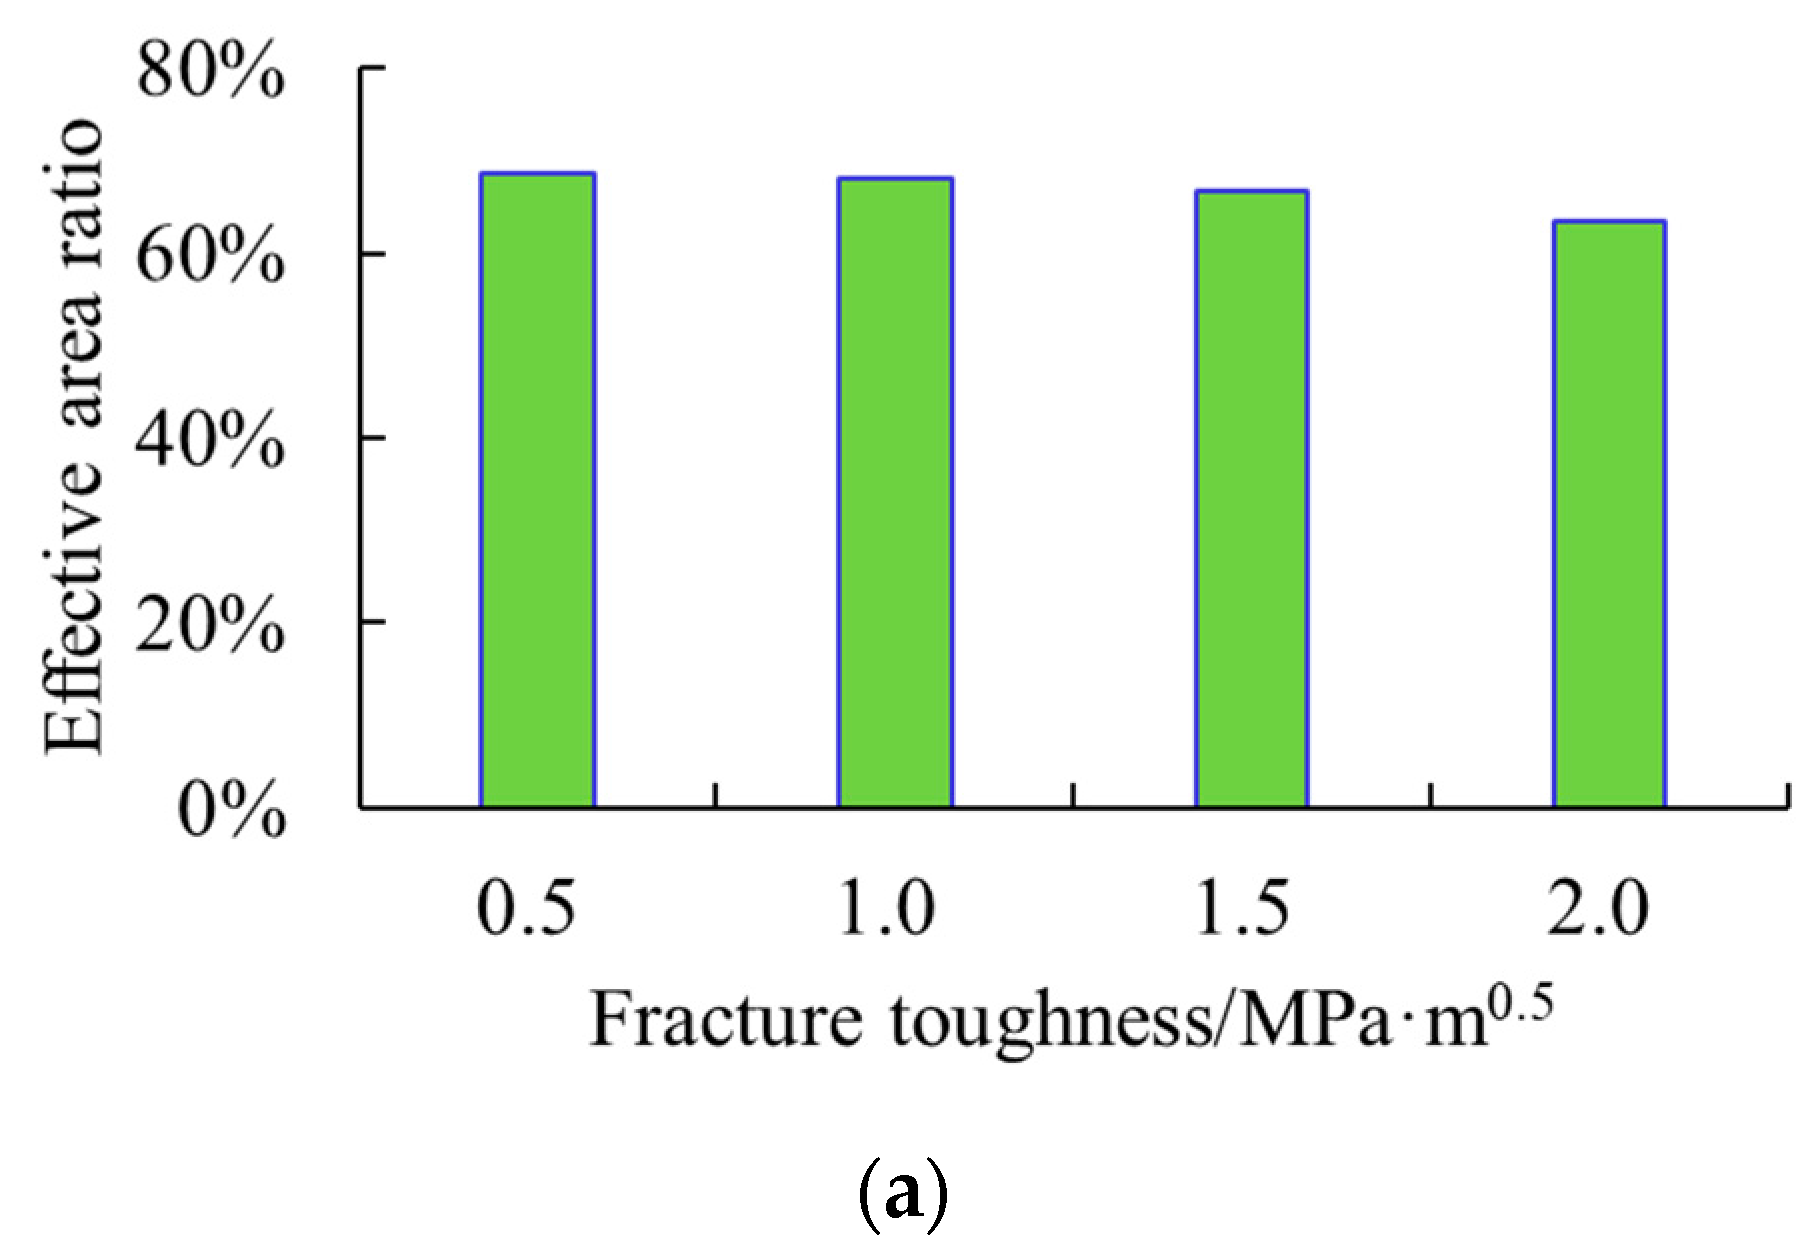
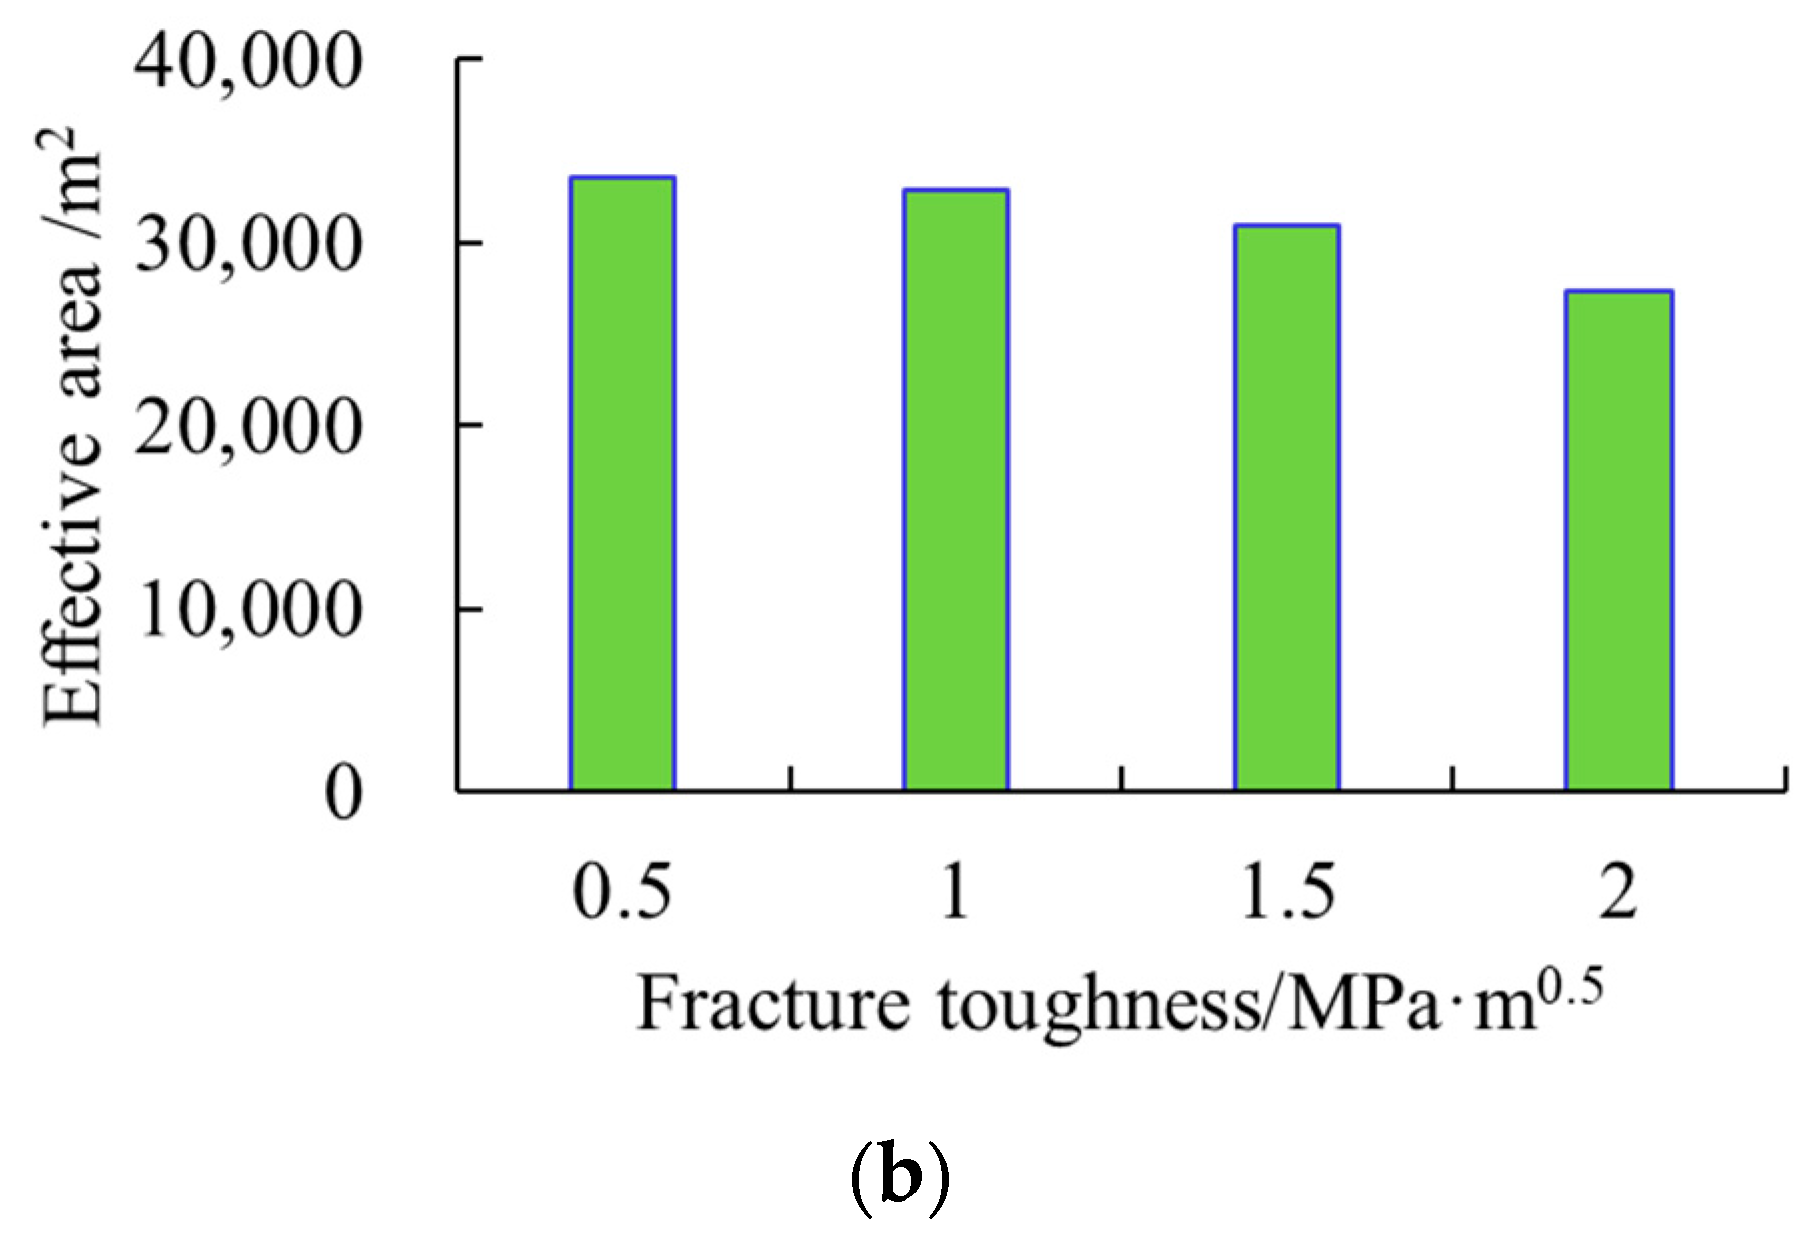
3.2. Effect of Fracture Toughness

Fracture toughness of the coal seam is an essential mechanical constraint for hydraulic fracturing, so it is of practical significance to study the mechanism of the influence of mechanical fracture properties of the coal seam on the fracture making efficiency of the reservoir for the optimization of the fracturing process and improvement in the fracture making effect [37,38].
Parameter setting: The stratigraphic profile was “an overburden layer, a roof layer, and a coal seam.” In reality, the coal seam is lower in in situ stress, so the combination of the in situ stress profile was set at 12 MPa–12 MPa–11.5 MPa; the distance from the horizontal well to the top surface of the coal seam d was set at 4 m; the coal seam was placed at the elastic modulus E of 10.0 GPa, Poisson’s ratio v of 0.2, and vertical fracture toughness KIcv of 0.5–2 MPa·m0.5; the other layers were set at the sheer fracture toughness KIcv of 0.5 MPa·m0.5, and the total fluid loss coefficient Cl was set at 1 × 10⁻⁴ m/min0.5.
The fracturing affects under different vertical fracture toughness values of the coal seam (KIcv = 0.5, 1, 1.5, 2 MPa·m0.5) were simulated numerically under the above base parameters. The results show that fractures formed under different vertical fracture toughness values of coal seam differ widely in shape but are primarily concentrated in the coal seam, as shown in Figure 12.
The greater the vertical fracture toughness of the coal seam, the poorer the fracturing effect is (Figure 13). At all the different vertical fracture toughness values, the effective area ratios were above 60%. The smaller the vertical fracture toughness, the larger the effective area ratio was. For example, the effective area ratio and effective area at KIcv of 0.5 MPa·m0.5 were 12% and 0.7 × 10⁴ m2 larger than those at KIcv of 2 MPa·m0.5, respectively. With the increase in heterogeneity of the vertical fracture toughness of the coal seam, the effective area and effective area ratio gradually decrease, and the stronger the heterogeneity, the faster the decrease speed in effective area is.
According to the fracture mechanics theory, only when the stress intensity factor at the tip of the fracture reaches the fracture toughness of the coal seam rock can the fracture continue to propagate. Therefore, the greater the vertical fracture toughness of coal seam rock, the more difficult it is for fractures to grow in the coal seam, and the effect of fractures communicating with the coal seam becomes poorer.
In addition, the results show that when the vertical fracture toughness of the coal seam rock was four times the fracture toughness of the roof layer, the resistance generated by the fracture toughness still could not prevent fractures from extending to the coal seam extensively, indicating that the combined in situ stress profile has a more significant influence on the fracturing effect than fracture toughness, which is consistent with the existing theoretical findings of crossing-layer fracture propagation [39,40].

3.3. Fluid Loss Coefficient

The fluid loss coefficient is a parameter characterizing the ability to fracture fluid to filter out into the formation. The higher the loss coefficient, the faster the filtration loss speed of fracturing fluid, and the lower the fluid efficiency is.
Parameter setting: The distance from the horizontal well to the top surface of the coal seam, d, was set at 4 m, the fluid loss coefficient of the overlying layer and roof layer Cl at 1 × 10⁻⁴ m/min0.5, and the corresponding in situ stress combination profile of “overlying layer–roof layer–coal seam” at 12 MPa–12 MPa–11.5 MPa. With the other essential parameters kept constant, the fracturing results at coal seam fluid loss coefficients Cl of 2 × 10⁻⁴, 4 × 10⁻⁴, 6 × 10⁻⁴, and 8 × 10⁻⁴ m/min0.5 were simulated numerically and compared.
The results show the fracture geometry under different fluid loss coefficients differs significantly in shape (Figure 14). The effective area ratio decreased by about 25%, and the effective area decreased by 1.6 × 10⁻⁴ m/min0.5 as the fluid loss coefficient of the coal seam increased from 2 × 10⁻⁴ to 8 × 10⁻⁴ m/min0.5 (Figure 15). With the increase in liquid loss coefficient, the fracturing fluid in the coal seam filtered out faster, and the effective fracture fluid volume decreased. In general, the effective fracture area and its ratio decrease with the increase in coal seam fluid loss coefficient.
The effective area ratio still reached 40% when the fluid loss coefficient of the coal seam was eight times the liquid loss coefficient of the roof layer, indicating that the combination of in situ stresses is the primary factor influencing the fracturing effect, and the fluid loss coefficient is a secondary factor.

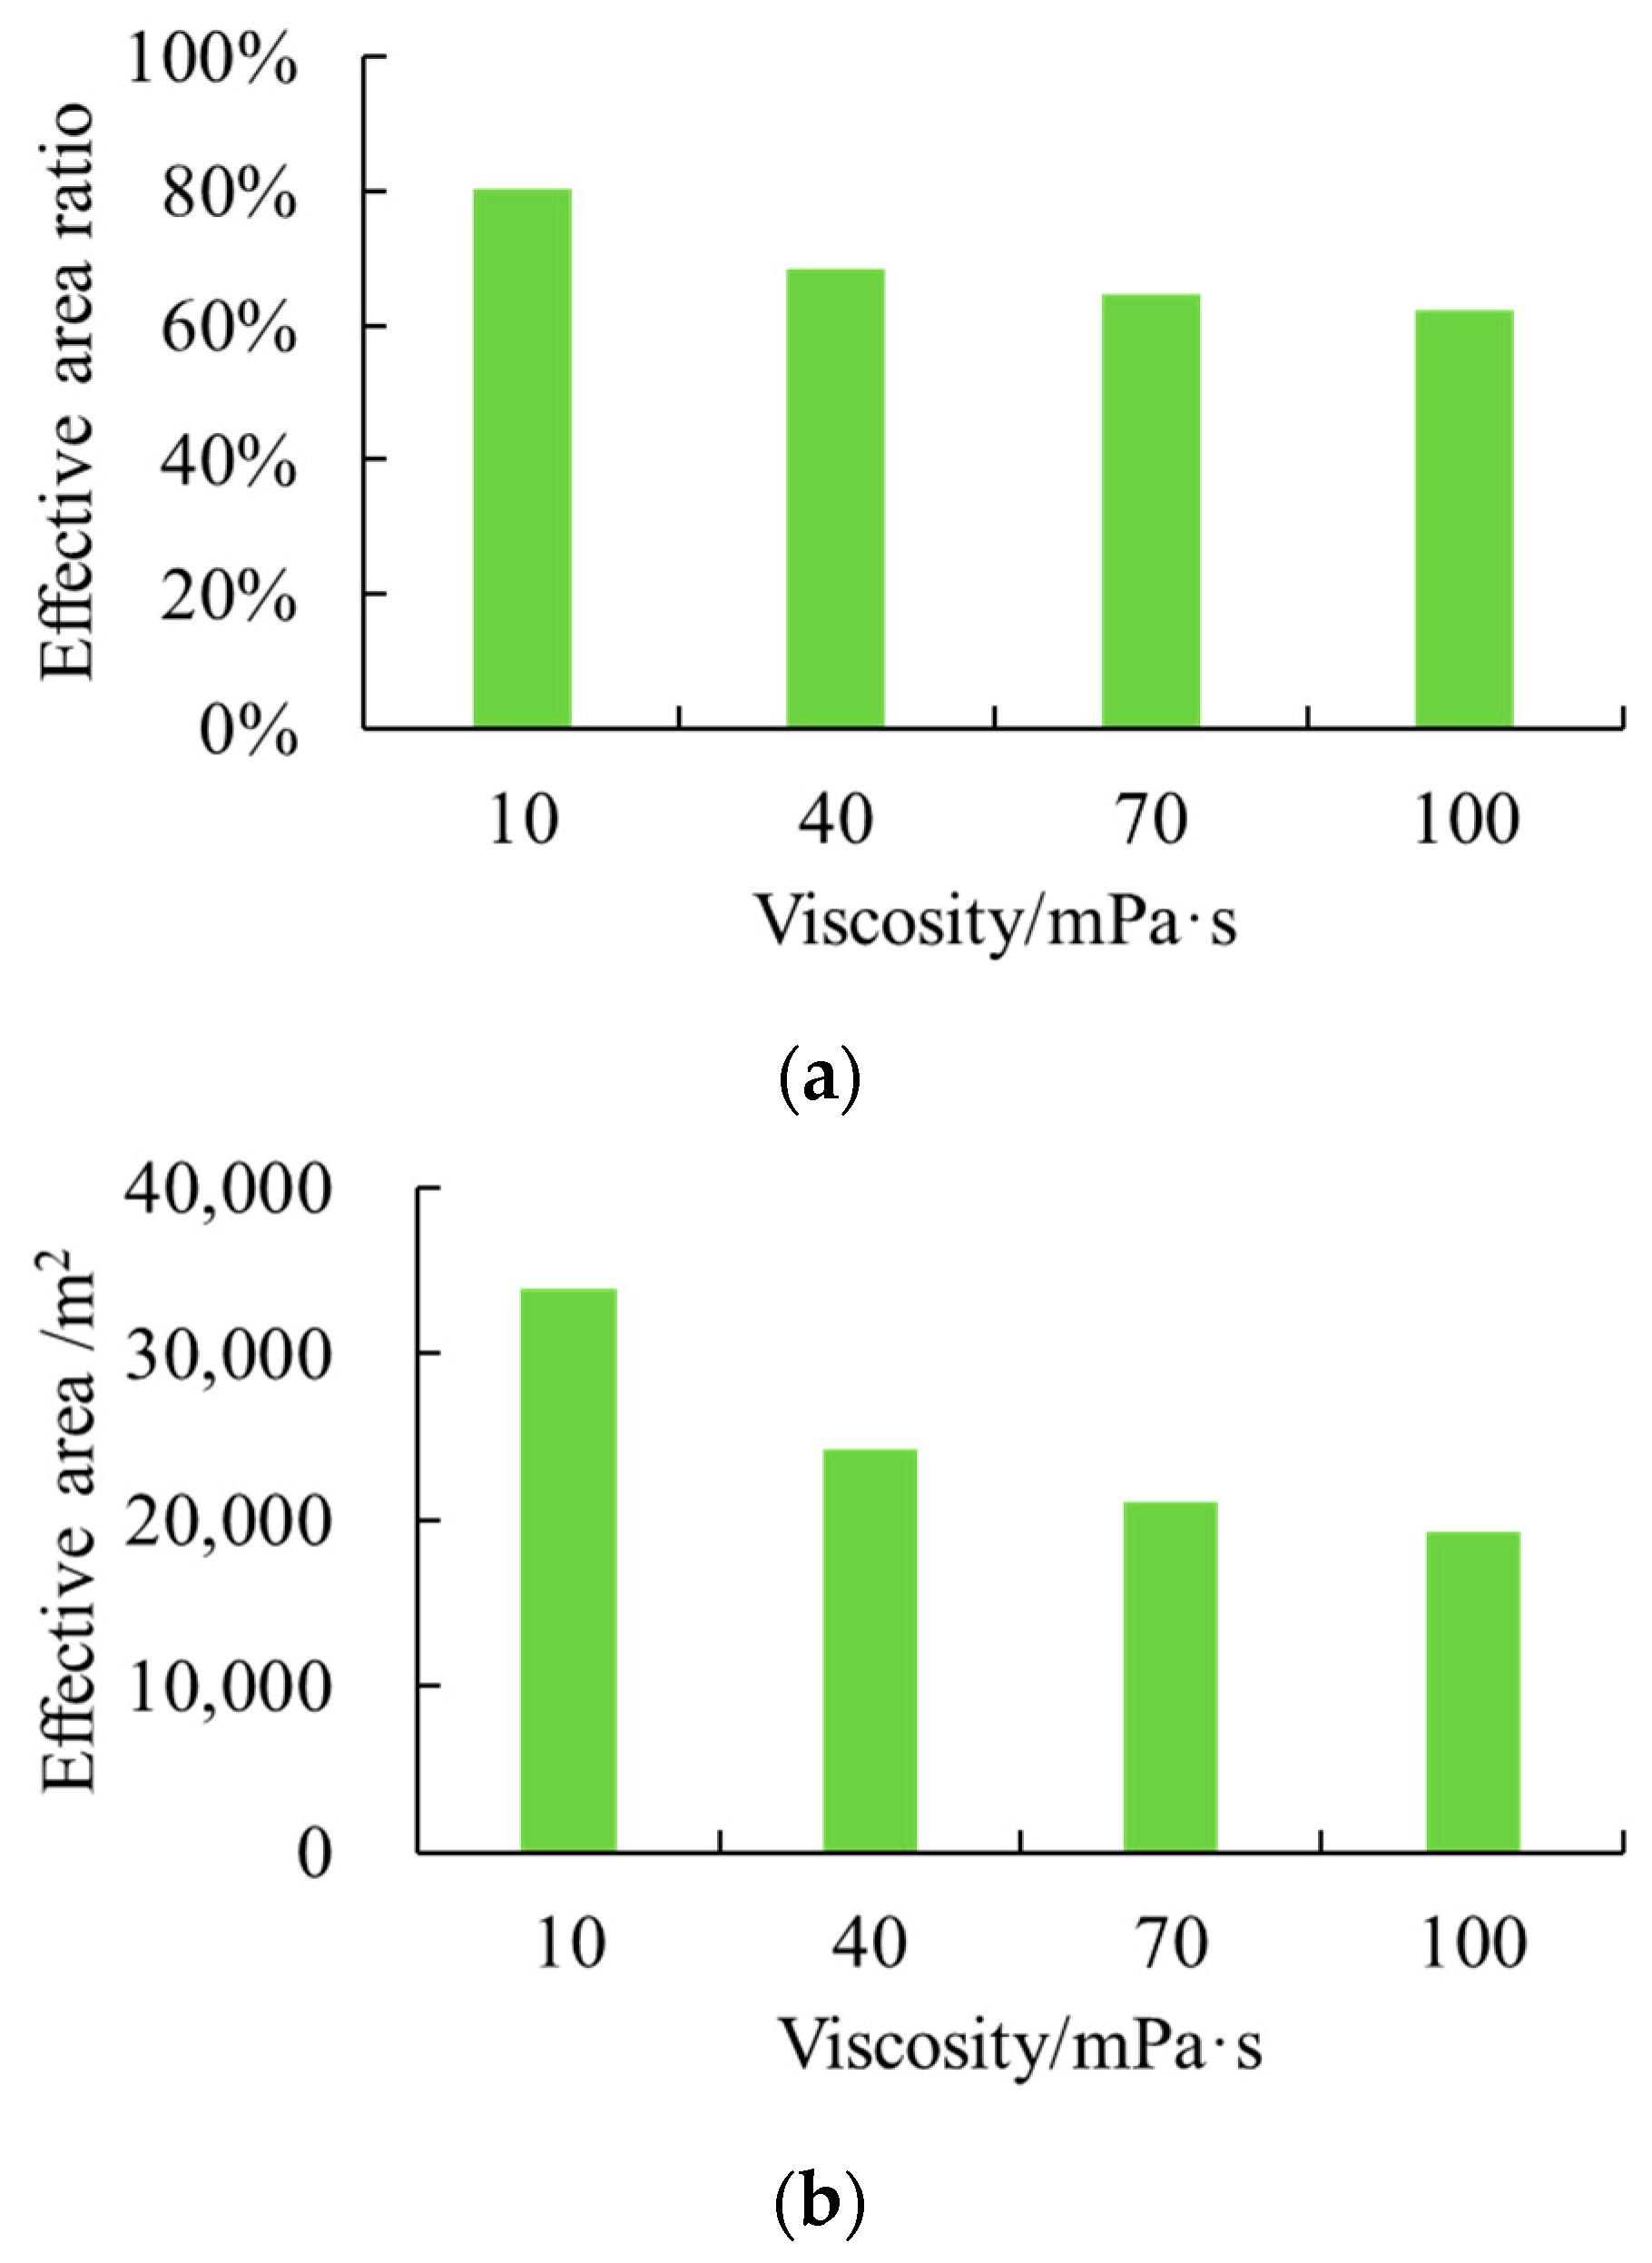
3.4. Fracturing Fluid Viscosity

Fracturing fluid viscosity is an index reflecting the fracture-making ability and flowability of the fluid. Parameter setting: The distance from the horizontal well to the top surface of coal seam d was set at 4 m, the fluid loss coefficient of the overlying layer and roof layer Cl at 1 × 10⁻⁴ m/min0.5, and the corresponding in situ stress combination profile of “overlying layer–roof layer–coal seam” at 12 MPa–12 MPa–11.5 MPa. With the other parameters kept constant, the fracturing results at fracturing fluid viscosity values of 10, 40, 70, and 100 mPa·s were simulated numerically to determine the effect of fracturing fluid viscosity on fracture penetration through the coal bed roof.
The results show that the fracture geometry under different fracturing fluid viscosity values vary significantly in shape (Figure 16). As the fluid viscosity increased from 10 to 100 mPa·s, the fracture width increased from 2 to 4 mm, by about one time; in addition, the fracture length and fracture height were smaller than those at the lower viscosity values of fracturing fluid because of the larger fracture width. Figure 17 shows that the effective area ratio and effective area at the highest fluid viscosity decreased by about 20% and 1.4 × 10⁴ m2 from those at the lowest. Due to the increase in viscosity, the fracturing fluid had a stronger fracture-making ability. The fractures had higher penetration ability, even expanded massively in the roof layer with higher stress; moreover, because of the larger fracture width, the final effective fracture area and its ratio were smaller. However, in general, the effective area and its ratio decrease with the increase in fracturing fluid viscosity.

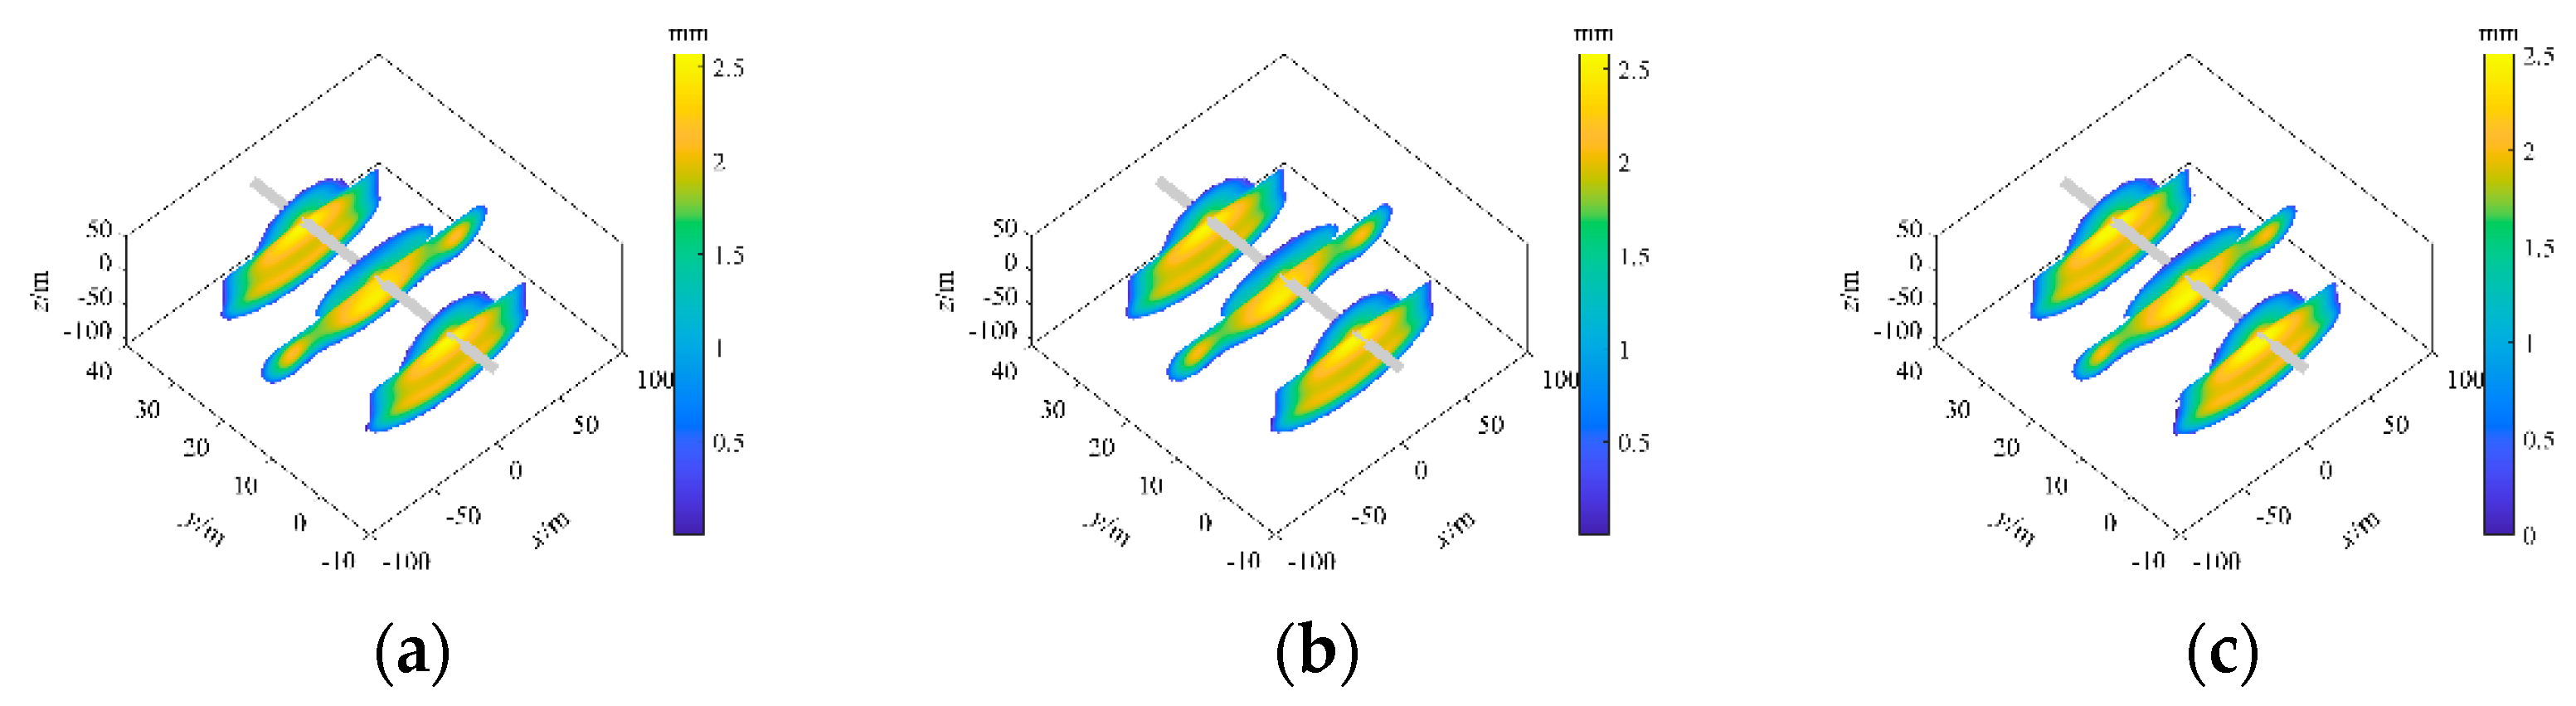
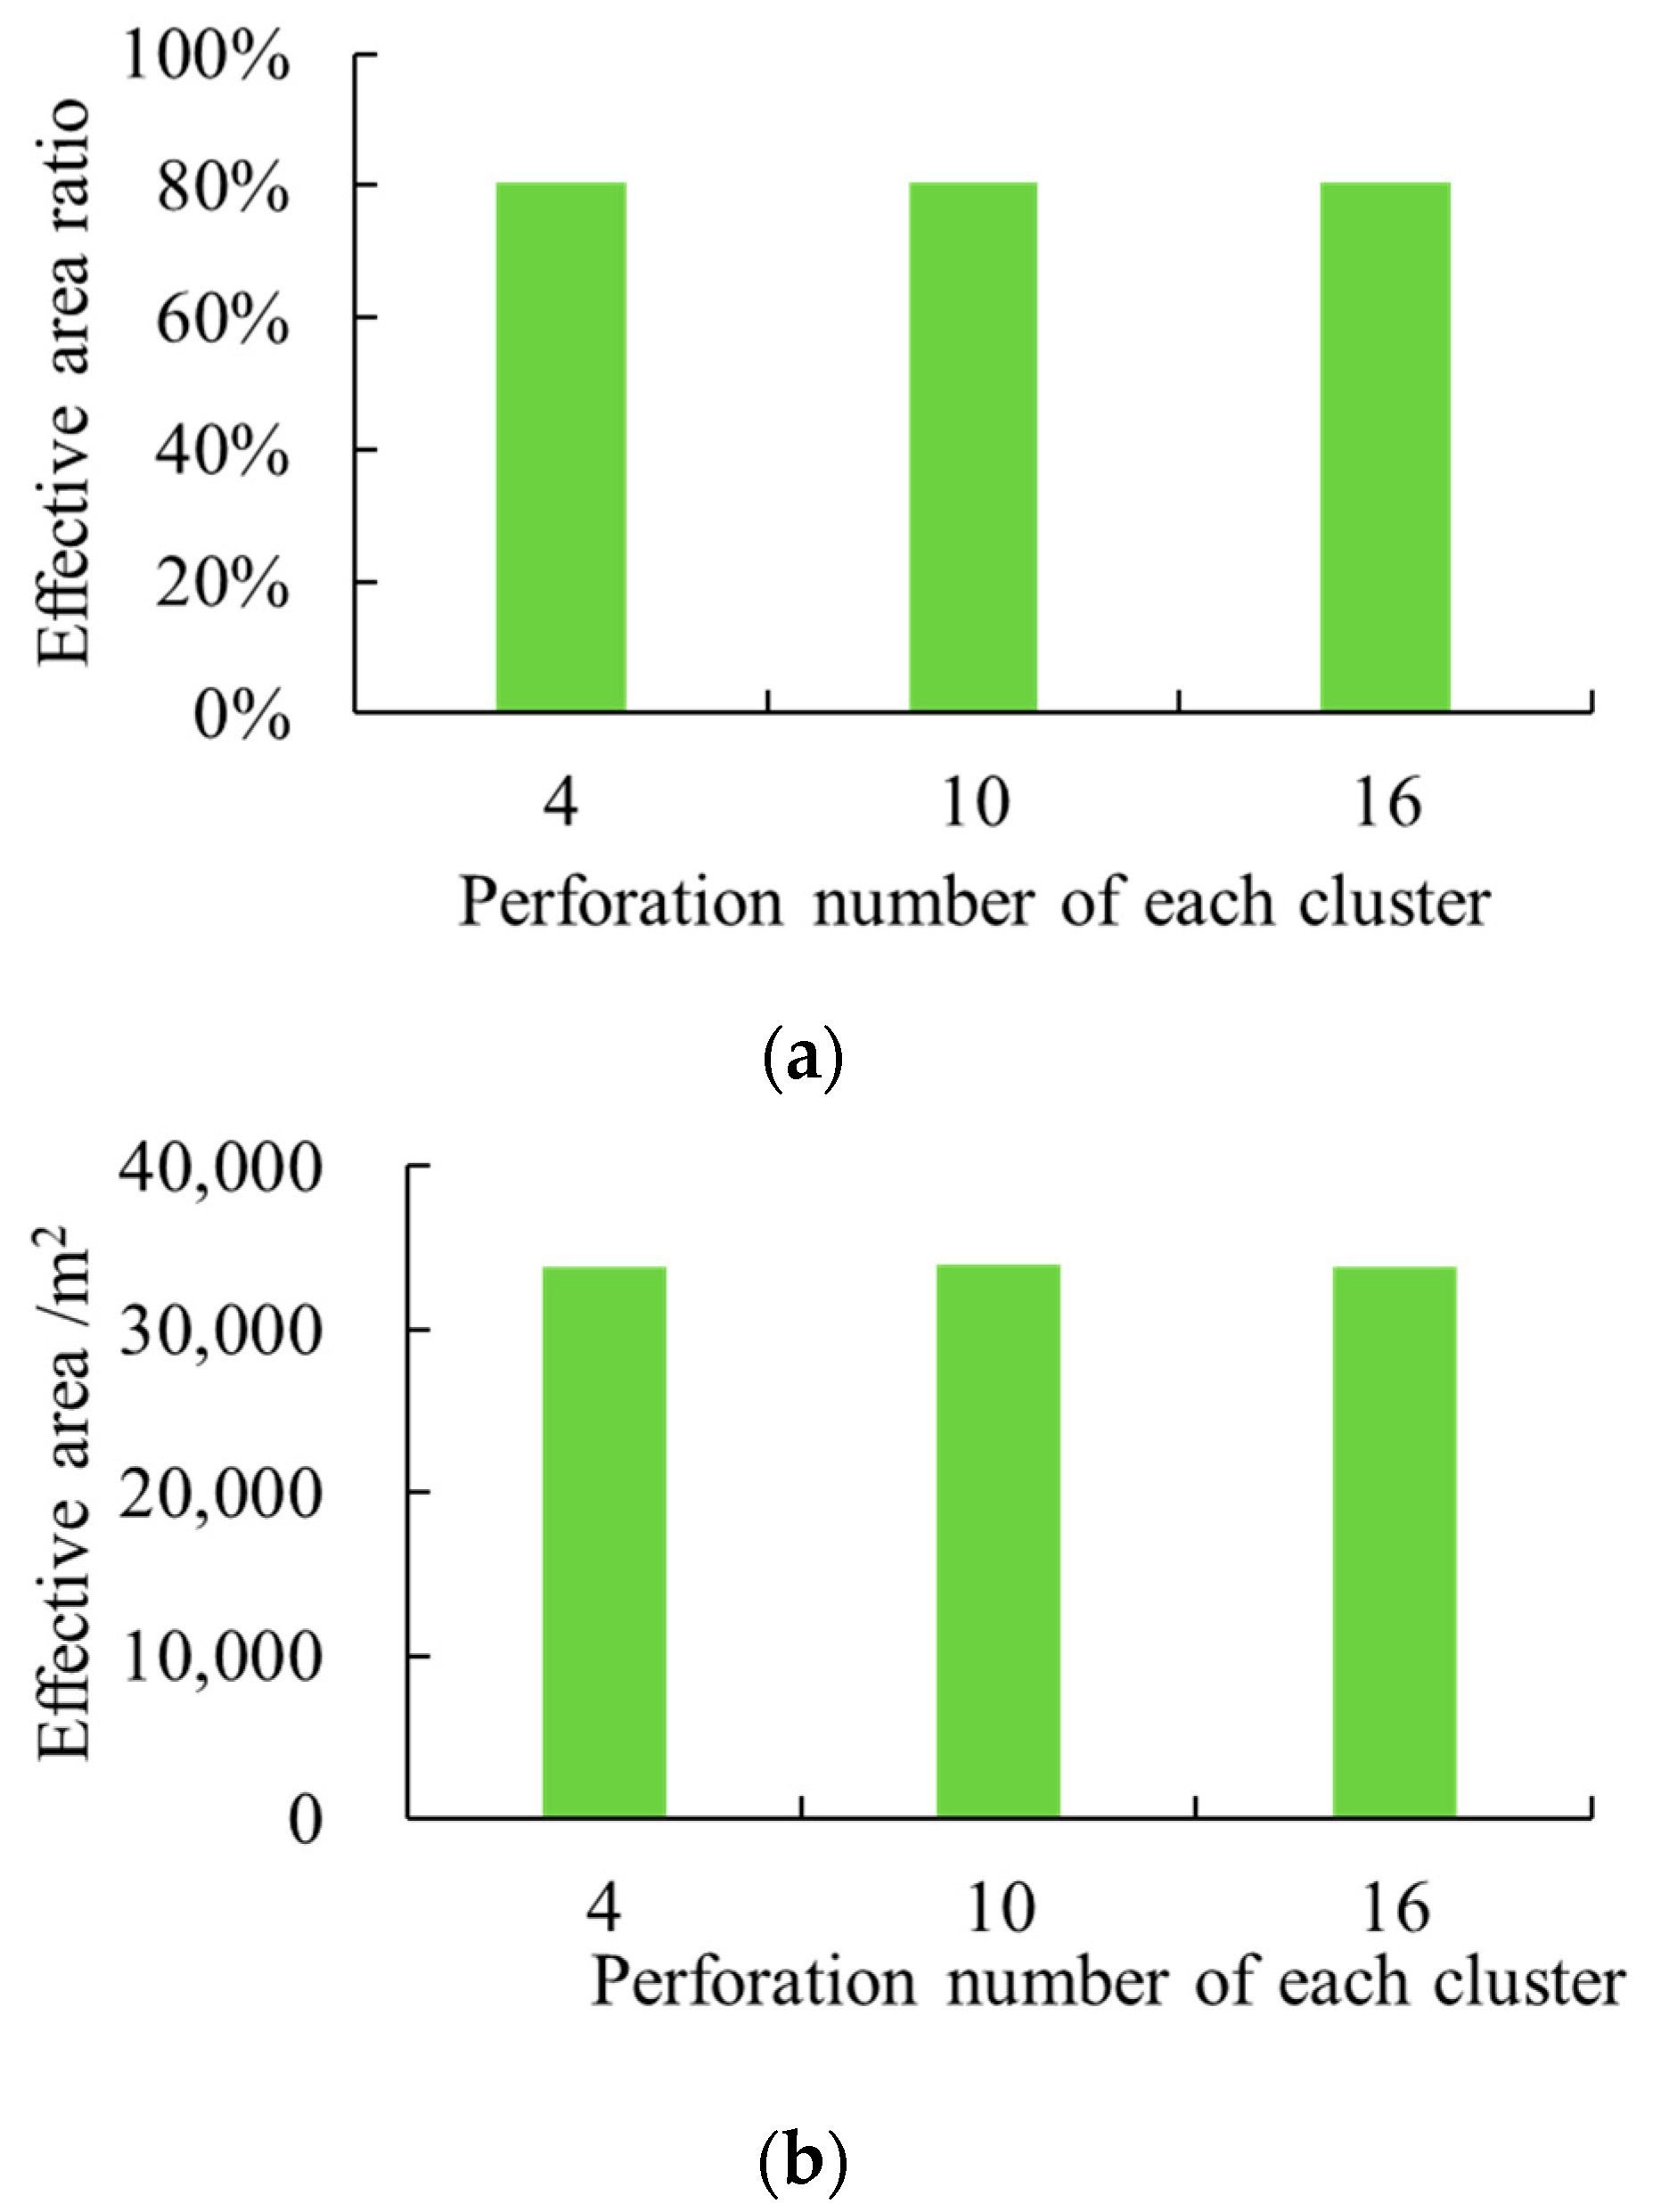
3.5. Perforation Number in Each Cluster

The number of perforation holes in one cluster and the total number of perforation holes in one stage determine the degree of fracture flow restriction and influence fluid influx and fracture propagation of each cluster. Parameter setting: The distance from the horizontal well to the top surface of coal seam d was set at 4 m, the fluid loss coefficient of the overlying layer and roof layer Cl at 1 × 10⁻⁴ m/min0.5, and the corresponding in situ stress combination profile of “overlying layer–roof layer–coal seam” at 12 MPa–12 MPa–11.5 MPa. With the other parameters kept constant, the fracturing results at perforation holes in one cluster of 4, 10, and 16 were simulated numerically to determine the effect of this parameter on fracture penetration through the coal bed roof.
The results show that fractures generated under different perforation holes in one cluster have little difference in shape (Figure 18). Figure 19 shows that the effective area ratios and areas at different perforation holes in one cluster hardly changed. Due to the influence and restriction of in situ stress conditions, once penetrating the interface between the coal seam and the roof, the fractures would extend extensively in the coal seam, so the number of perforation holes in one cluster has a minor influence on the fracture propagation.

4. Conclusions

(1) It was found that when the coal seam has lower in situ stress, fractures communicate with the coal seam well, and the fracturing effect is better; in contrast, when the coal seam has higher in situ stress, the fracturing effect is poorer.
(2) The distance between the horizontal well and the top surface of the coal seam has an essential influence on the effect of crossing layer fracturing, especially under the “low–high–low” in situ stress combination profile. To obtain the ideal fracturing effect in practical application, the distance between the horizontal well and the top surface of the coal seam is recommended to be less than 4 m.
(3) The combination profile of in situ stresses is the critical factor. At the same time, fracture toughness, fluid loss coefficient of the coal seam, fluid viscosity, and the number of perforation holes in one cluster are secondary factors affecting the fracturing effect.

Author Contributions

Conceptualization, Y.L.; data curation, Y.W.; formal analysis, C.D.; funding acquisition, J.X. All authors have read and agreed to the published version of the manuscript.

Funding

This research received no external funding.

Institutional Review Board Statement

Not applicable.

Informed Consent Statement

Not applicable.

Data Availability Statement

The data presented in this study are available on request from the corresponding author. The data are not publicly available due to oilfield data confidentiality.

Acknowledgments

We would like to acknowledge the support of the Major Project of CNPC (No. 2021DJ4502).

Conflicts of Interest

The authors declare no conflict of interest.

Nomenclature

pfFluid pressure in the fracture, Pa;
σhMinimum horizontal principal stress, Pa;
CGreen’s function;
tTime, s;
A(t)The area of opened fractures at time t, m2;
AThe area of opened fractures, m2;
wFracture width, m;
(x’, y’, z’)Source point, (x, y, z)—field point;
EYoung’s modulus, Pa;
vPoisson’s ratio, dimensionless;
qUnit length volume flow vector, m2/s;
μFluid viscosity, Pa·s;
qxVolume flow per unit length in the x direction, m2/s;
qyVolume flow per unit length in the y direction, m2/s;
ClCarter’s leak off coefficient, m/s0.5;
QkThe inlet flow of the kth fracture, m3/s;
δDirac function, m−2;
t0The moment when the element is opened, s;
nfThe number of fractures;
(xin,k, yin,k, zin,k)The position of the kth fracture;
pwWellbore pressure, Pa;
pt,kWellbore flow friction of the kth fracture, Pa;
pp,kPerforation friction of the kth cluster, Pa;
pin,kInlet pressure of the kth cluster, Pa;
ρFracturing fluid density, kg/m3;
nkThe number of perforations of the kth cluster;
dkThe perforation diameter of the kth cluster, m;
KkPerforation erosion coefficient of the kth cluster;
QTInjection rate, m3/s;
KIcRock mode I fracture toughness, MPa·m0.5;
KtipTip stress intensity factor, Pa·m0.5;
dx, dyElement size of x,y direction, m;
wtipWidth of the tip element, m;
NeThe number of elements;
wJFracture width of the Jth element, m;
pIPressure of the Ith element, Pa;
pPressure matrix, Pa;
wWidth matrix, m;
CIJThe influence coefficient of element I on element J, Pa/m;
σhMinimum horizontal principal stress matrix, Pa;
ΔtTime step, s;
ΔwVariation in width in adjacent time steps, m;
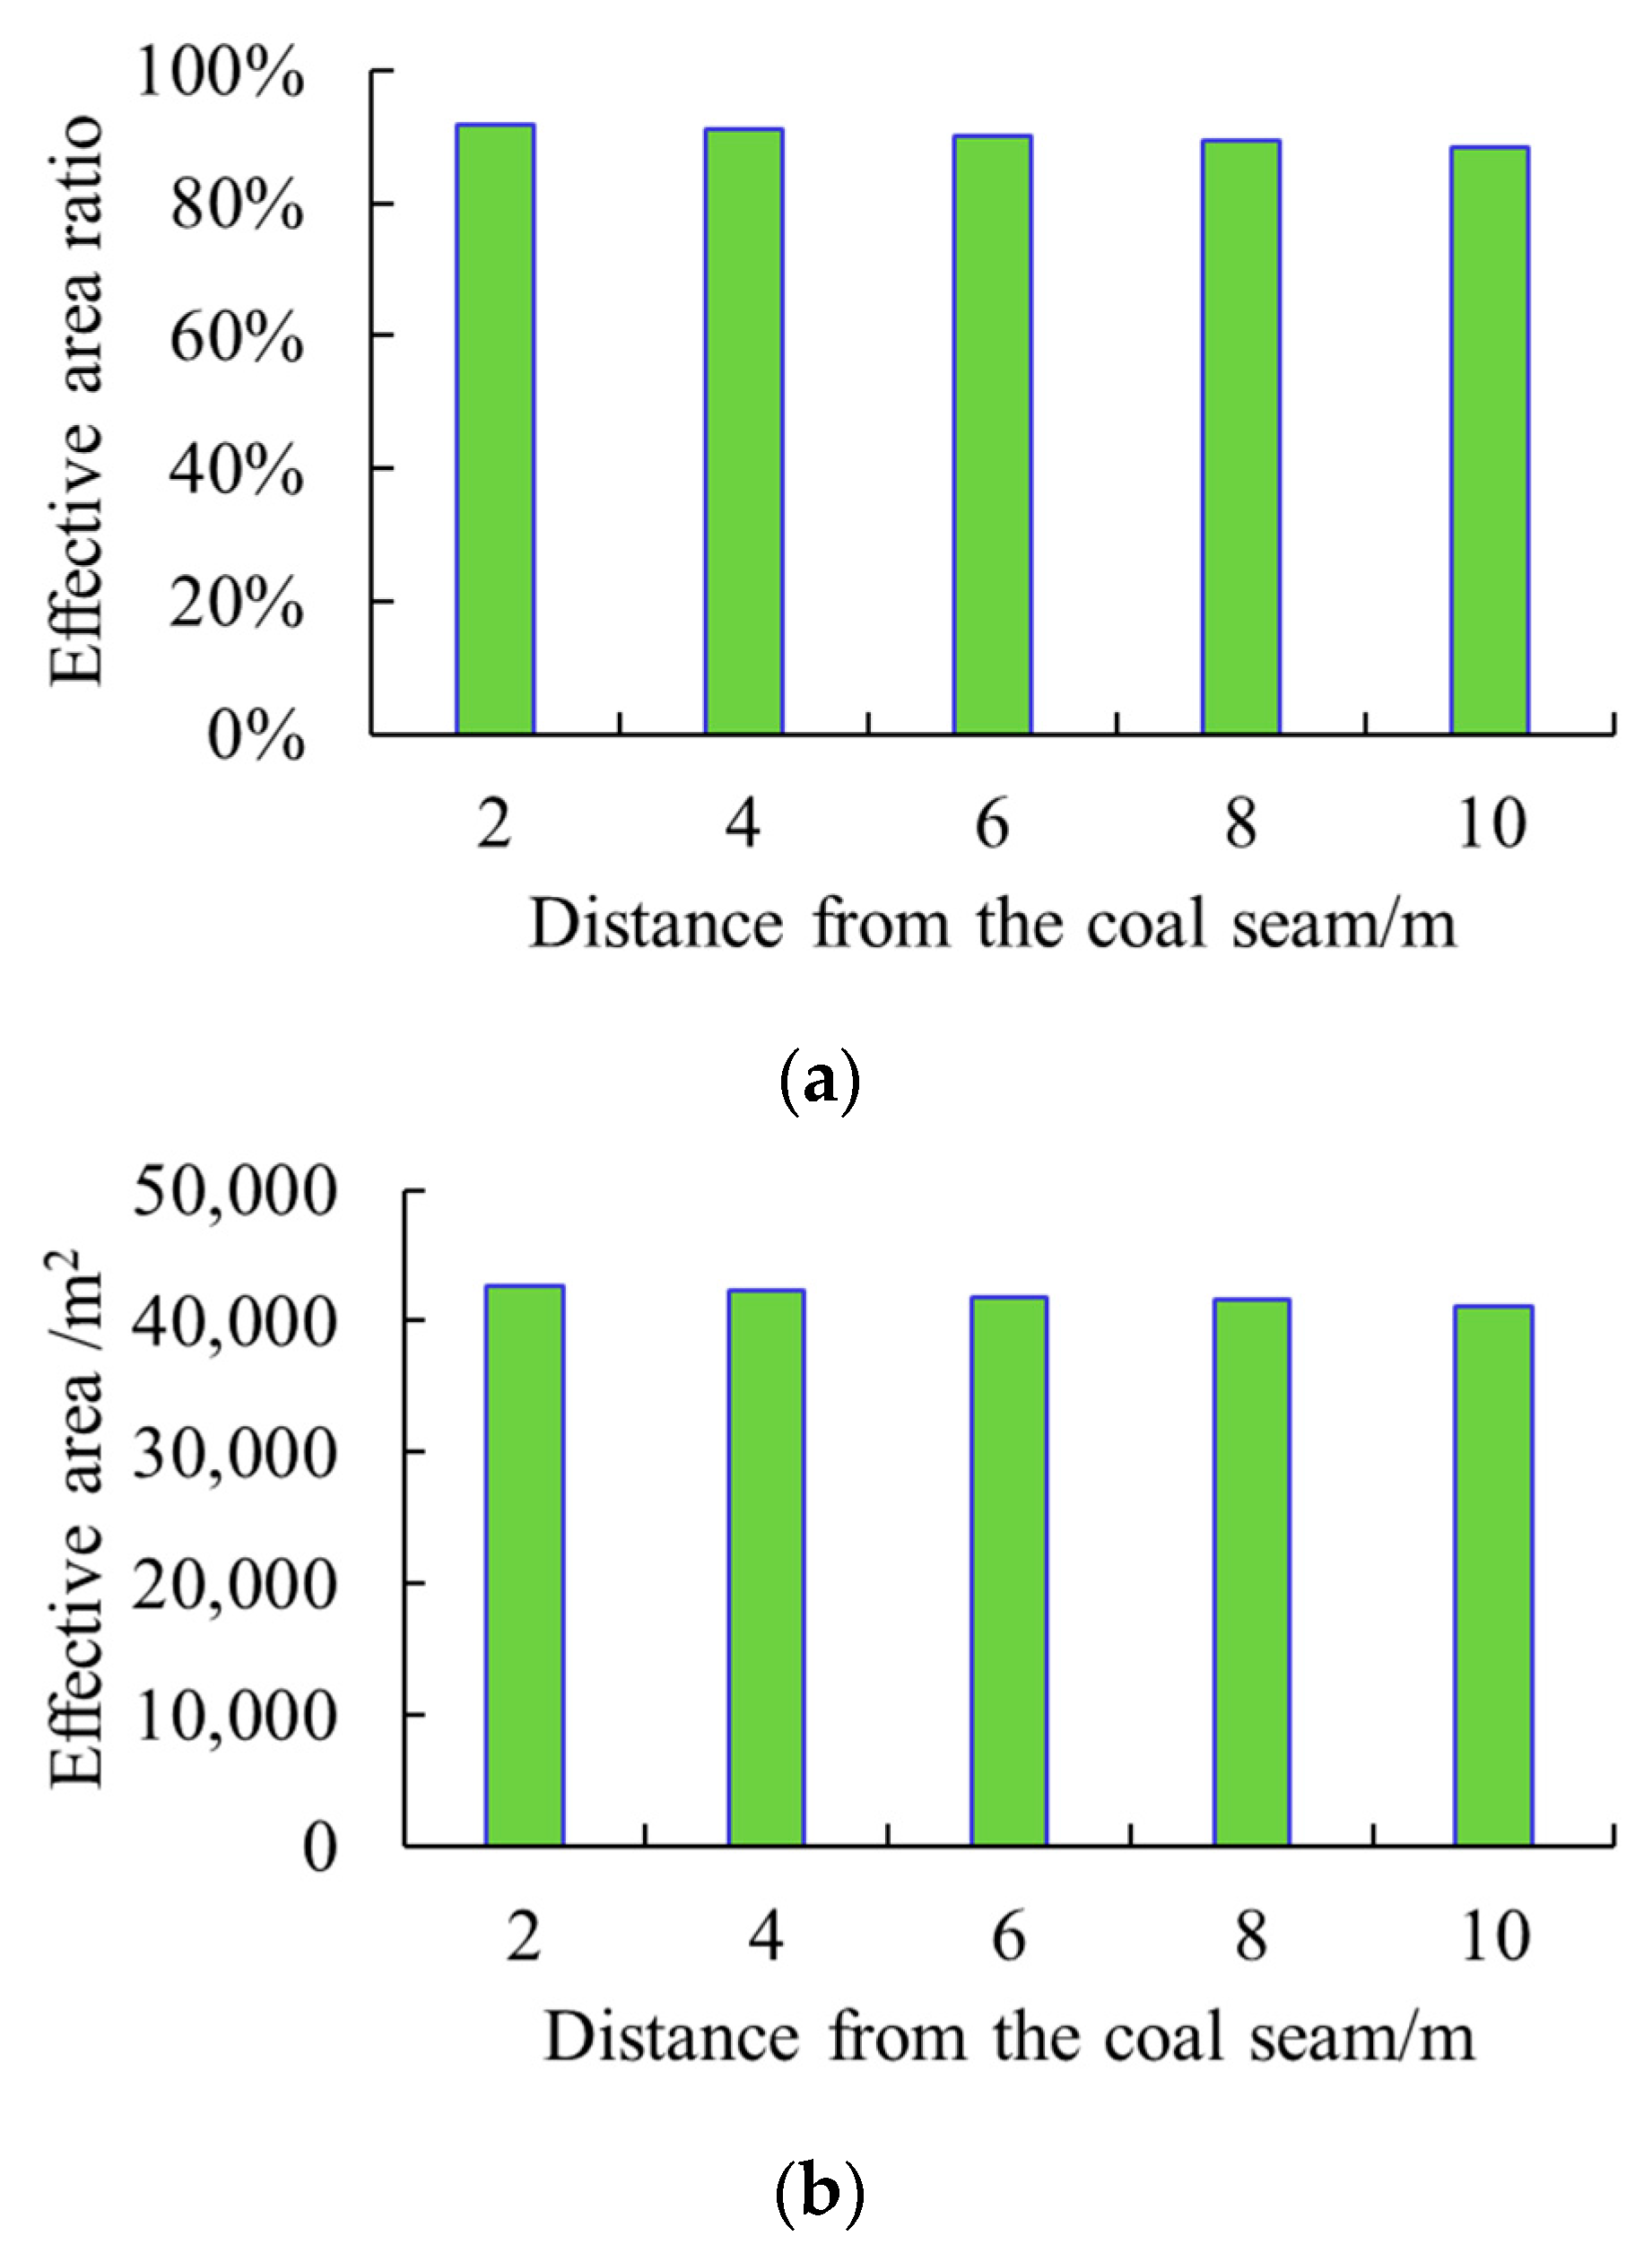
RARatio of fracture area of coal seam (effective area ratio), dimensionless;
AcFracture area in coal seam (effective area), m2;
AtTotal fracture area, m2;
dDistance between horizontal well and top of coal seam, m;
ZVertical coordinates of the in situ stress profile, m.

References

  1. Liu, C.L.; Zhu, J.; Che, C.B.; Yang, H.L.; Fan, M.Z. Methodologies and results of the latest assessment of coalbed methane re-sources in China. Nat. Gas Ind. 2009, 29, 130–132+152. [Google Scholar]
  2. Liu, J.Z.; Sun, H.T.; Lei, Y.; Cao, J. Current situation and development trend of coalbed methane development and utilization technology in coal mine area. J. China Coal Soc. 2020, 45, 258–267. [Google Scholar]
  3. Zhang, S.A.; Liu, X.J.; Wen, Q.Z.; Zhang, X.; Zhao, W. Development situation and trend of stimulation and reforming technology of coalbed methane. Acta Pet. Sin. 2021, 42, 105–118. [Google Scholar]
  4. Zhu, Q.; Yang, Y.; Zuo, Y.; Song, Y.; Guo, W.; Tang, F.; Ren, J.; Wang, G. On the scientific exploitation of high-rank CBM resources. Nat. Gas Ind. B 2020, 7, 403–409. [Google Scholar] [CrossRef]
  5. Jiang, B.; Qu, Z.; Wang, G.G.; Li, M. Effects of structural deformation on formation of coalbed methane reservoirs in Huaibei coalfield, China. Int. J. Coal Geol. 2010, 82, 175–183. [Google Scholar] [CrossRef]
  6. Jiang, B.; Ju, Y.W. Tectonic coal structure and its petrophysical features. Nat. Gas Ind. 2004, 24, 27–29+146. [Google Scholar]
  7. Zhao, H.; Liu, C.; Xiong, Y.; Zhen, H.; Li, X. Experimental research on hydraulic fracture propagation in group of thin coal seams. J. Nat. Gas Sci. Eng. 2022, 103, 104614. [Google Scholar] [CrossRef]
  8. Lyu, S.; Wang, S.; Chen, X.; Wang, S.; Wang, T.; Shi, X.; Dong, Q.; Li, J. Natural fractures in soft coal seams and their effect on hydraulic fracture propagation: A field study. J. Pet. Sci. Eng. 2020, 192, 107255. [Google Scholar] [CrossRef]
  9. Zhang, Q.; Ge, C.G.; Li, W.; Jiang, Z.B.; Chen, J.X.; Li, B.G.; Wu, J.G.; Wu, X.P.; Liu, J. A new model and application of coalbed methane high efficiency production from broken soft and low permeable coal seam by roof strata-in horizontal well and staged hydraulic fracture. J. China Coal Soc. 2018, 43, 150–159. [Google Scholar]
  10. Yu, B.; Gao, R.; Xia, B.W.; Kuang, T.J. Study and engineering practice on the hard roofs control in the large space by ground fracturing technology. J. China Coal Soc. 2021, 46, 800–811. [Google Scholar]
  11. Li, D.Q.; Zhang, S.C.; Zhang, S.A. Experimental and numerical simulation study on fracturing through interlayer to coal seam. J. Nat. Gas Sci. Eng. 2014, 21, 386–396. [Google Scholar] [CrossRef]
  12. Zhang, F.S.; Wu, J.F.; Huang, H.Y.; Wang, X.H.; Luo, H.R.; Yue, W.H.; Hou, B. Technological parameter optimization for improving the complexity of hydraulic fractures in deep shale reservoirs. Nat. Gas Ind. 2021, 41, 125–135. [Google Scholar]
  13. Wang, Y.; Hou, B.; Wang, D.; Jia, Z. Features of fracture height propagation in cross-layer fracturing of shale oil reservoirs. Pet. Explor. Dev. 2021, 48, 469–479. [Google Scholar] [CrossRef]
  14. Zhong, Q.Y.; Hong, T.X. Generalized Kelvin solution based boundary element method for crack problems in multilayered solids. Eng. Anal. Bound. Elem. 2002, 26, 691–705. [Google Scholar]
  15. Li, K.; Jiang, X.; Ding, H.; Hu, X. Three-Dimensional Propagation Simulation and Parameter Analysis of Rock Joint with Displacement Discontinuity Method. Math. Probl. Eng. 2019, 2019, 3164817. [Google Scholar] [CrossRef] [Green Version]
  16. Gong, Z.W.; Jia, J.C.; Xu, Y.B.; Shi, J. The coal seam roof strata-in horizontal well CBM gas drainage technology based on logging information. Nat. Gas Ind. 2021, 41, 83–91. [Google Scholar]
  17. Fang, L.C.; Li, G.H.; Li, D.D.; Li, H.Z.; Liu, J. Analysis on the CBM extraction effect of the horizontal wells in the coal seam roof in Luling coal mine in Huaibei. Coal Geol. Explor. 2020, 48, 155–160+169. [Google Scholar]
  18. Bai, X.H.; Wu, C.F.; Geng, Y.; Tang, X.; Sun, M.C.; Su, Y.M. Experimental study of space mesh hydraulic fracturing by drilling through strata for outburst prevention in severe-outburst and low-permeability coal seam. J. China Coal Soc. 2013, 38, 245–250. [Google Scholar]
  19. Tang, T.W.; Liu, D.A.; Cui, Z.D.; Han, Z.C.; Liu, B.Q.; Wang, Z.D. Initiation pressure evaluation of coal mine roof hydraulic fracturing based on fracture mechanics. J. China Coal Soc. 2020, 45 (Suppl. S2), 727–735. [Google Scholar]
  20. Greb, S.F.; Nelson, W.J.; Elrick, S.D. Mining geology of the principal resource coals of the Illinois Basin. Int. J. Coal Geol. 2020, 232, 103589. [Google Scholar] [CrossRef]
  21. Ma, D.; Duan, H.; Zhang, J. Solid grain migration on hydraulic properties of fault rocks in underground mining tunnel: Radial seepage experiments and verification of permeability prediction. Tunn. Undergr. Space Technol. 2022, 126, 104525. [Google Scholar] [CrossRef]
  22. Ma, D.; Duan, H.; Zhang, J.; Liu, X.; Li, Z. Numerical Simulation of Water–Silt Inrush Hazard of Fault Rock: A Three-Phase Flow Model. Rock Mech. Rock Eng. 2022, 1–20. [Google Scholar] [CrossRef]
  23. Li, Q.; Cheng, B.; Li, X.B.; Yin, T.B.; Huang, L.Q. Fracture behaviour of microwave-heated granite under indentation: Experimental and numerical investigation. Eng. Fract. Mech. 2022, 269, 108535. [Google Scholar] [CrossRef]
  24. Ahamed, M.A.A.; Perera, M.S.A.; Li, D.Y.; Ranjith, P.G.; Matthaia, S.K. Proppant damage mechanisms in coal seam reservoirs during the hydraulic fracturing process: A review. Fuel 2019, 253, 615–629. [Google Scholar] [CrossRef]
  25. Ahamed, M.; Perera, M.; Black, J.R.; Matthai, S.; Ranjith, P.; Dong-Yin, L.; Sampath, K. Investigating the proppant damage mechanisms expected in a propped coal fracture and its effect on fracture flow. J. Pet. Sci. Eng. 2020, 198, 108170. [Google Scholar] [CrossRef]
  26. Chen, M.; Zhang, S.; Li, S.; Ma, X.; Zhang, X.; Zou, Y. An explicit algorithm for modeling planar 3D hydraulic fracture growth based on a super-time-stepping method. Int. J. Solids Struct. 2020, 191–192, 370–389. [Google Scholar] [CrossRef]
  27. Crouch, S.L.; Starfield, A.M. Boundary Element Methods in Solid Mechanics: With Applications in Rock Mechanics and Geological Engineering; Allen & Unwin: Crows Nest, Australia, 1982. [Google Scholar]
  28. Crump, J.B.; Conway, M.W. Effects of perforation-entry friction on bottom hole treating analysis. J. Pet. Technol. 1988, 40, 1041–1048. [Google Scholar] [CrossRef]
  29. Churchill, S.W. Friction-factor equation spans all fluid-flow regimes. Chem. Eng. 1977, 84, 91–92. [Google Scholar]
  30. Olson, J.E. Predicting fracture swarms-The influence of subcritical crack growth and the crack-tip process zone on joint spacing in rock. Geological Society: London, UK, 2004; Volume 231, pp. 73–88. [Google Scholar]
  31. Chen, M.; Zhang, S.; Xu, Y.; Ma, X.; Zou, Y. A numerical method for simulating planar 3D multi-fracture propagation in multi-stage fracturing of horizontal wells. Pet. Explor. Dev. 2020, 47, 171–183. [Google Scholar] [CrossRef]
  32. Sa Vitski, A.A.; Detournay, E. Propagation of a penny-shaped fluid-driven fracture in an impermeable rock: Asymptotic solutions. Int. J. Solids Struct. 2002, 39, 6311–6337. [Google Scholar] [CrossRef]
  33. Dontsov, E.V. An approximate solution for a penny-shaped hydraulic fracture that accounts for fracture toughness, fluid viscosity and leak-off. R. Soc. Open Sci. 2016, 3, 160737. [Google Scholar] [CrossRef] [PubMed] [Green Version]
  34. Wu, R.; Bunger, A.P.; Jeffrey, R.G.; Siebrits, E. A comparison of numerical and experimental results of hydraulic fracture growth into a zone of lower confining stress. In Proceedings of the 42nd U.S. Rock Mechanics Symposium (USRMS), San Francisco, CA, USA, 29 June–2 July 2008. [Google Scholar]
  35. Chai, J.F.; Sun, H.B.; Yin, H.S.; Wang, Y.; Guo, M.; Wu, H.Y. Study on Development Technology of Coalbed Methane in Horizontal Well of Coal Seam Roof. Coal Technol. 2020, 39, 44–46. [Google Scholar]
  36. Lecampion, B.; Desroches, J. Simultaneous initiation and growth of multiple radial hydraulic fractures from a horizontal wellbore. J. Mech. Phys. Solids 2015, 82, 235–258. [Google Scholar] [CrossRef]
  37. Xu, Y.B. Layer-penetrating staged fracturing law of horizontal wells within roof of coal seams under stress interference. Coal Geol. Explor. 2020, 48, 11–18. [Google Scholar]
  38. Wamg, X.R.; Wang, E.Y.; Liu, X.F.; Li, N.; Zhou, X. Three-point-bending test of crack propagation and fracture parameters of coal specimens. Chin. J. Rock Mech. Eng. 2021, 40, 690–702. [Google Scholar]
  39. Li, H.Z.; Jiang, Z.B.; Shu, J.S.; Fan, Y.; Du, T.L. Numerical simulation of layer-crossing propagation behavior of hydraulic fractures at coal-rock interface. Coal Geol. Explor. 2020, 48, 106–113. [Google Scholar]
  40. Zhao, J.Z.; Peng, Y.; Li, Y.M.; Wang, L.; Zhang, Y.; Mi, Q.B. Abnormal sand plug phenomenon at a high injection rate and relevant solutions. Nat. Gas Ind. 2013, 33, 56–60. [Google Scholar]
Figure 1. Schematics of the grid system. (a) Discrete fracture surface, (b) Element type, (c) Grid activation.
Processes 10 01296 g001
Figure 2. Model of fracture crossing layer propagation.
Processes 10 01296 g002
Figure 3. Combinations of in situ stress of the overlying layer, roof layer, and coal seam.
Processes 10 01296 g003
Figure 4. Fractures formed under the profile of high–low–high in situ stress combination. (a) d = 2 m, (b) d = 4 m, (c) d = 6 m, (d) d = 8 m.
Processes 10 01296 g004
Figure 5. Fracturing outcomes under the combination of “high–low–high” in situ stresses. (a) Effective area ratio with distance from horizontal well to coal seam top. (b) Effective area with distance from the horizontal well to coal seam top.
Processes 10 01296 g005
Figure 6. Fractures formed under the combination profile of “low–high–low” in situ stresses. (a) d = 2 m, (b) d = 4 m, (c) d = 6 m, (d) d = 8 m.
Processes 10 01296 g006
Figure 7. Fracturing outcomes under the combination of “low–high–low” in situ stresses. (a) Effective area ratio with distance from the horizontal well to the coal seam top. (b) Effective area with distance from the horizontal well to the coal seam top.
Processes 10 01296 g007
Figure 8. Fractures formed under the “low–medium–high” in situ stress combination of the overlying layer, roof layer, and coal seam. (a) d = 2 m, (b) d = 4 m, (c) d = 6 m, (d) d = 8 m.
Processes 10 01296 g008
Figure 9. Fracturing outcomes under the “low–medium–high” in situ stress combination. (a) Effective area ratio with distance from the horizontal well to the coal seam top. (b). Effective area with distance from the horizontal well to the coal seam top.
Processes 10 01296 g009
Figure 10. Fractures formed under the “high–medium–low” in situ stress combination of overlying layer, roof layer, and coal seam. (a) d = 2 m, (b) d = 4 m, (c) d = 6 m, (d) d = 8 m.
Processes 10 01296 g010aProcesses 10 01296 g010b
Figure 11. Fracturing outcomes under the “high–medium–low” in situ stress combination. (a) Effective area ratio with distance from the horizontal well to the coal seam top. (b) Effective area with distance from the horizontal well to the coal seam top.
Processes 10 01296 g011
Figure 12. Fracture geometry under different fracture toughness values of the coal seam. (a) KIcv = 0.5 MPa·m0.5, (b) KIcv = 1.0 MPa·m0.5, (c) KIcv = 1.5 MPa·m0.5, (d) KIcv = 2.0 MPa·m0.5.
Processes 10 01296 g012
Figure 13. Fracturing outcomes under different fracture toughness values of the coal seam. (a) Effective area ratio with distance from the horizontal well to the coal seam top. (b) Effective area with distance from the horizontal well to the coal seam top.
Processes 10 01296 g013aProcesses 10 01296 g013b
Figure 14. Fracture geometry under different fluid loss coefficients of the coal seam. (a) Cl = 2.0 × 10⁻⁴ m/min0.5, (b) Cl = 4.0 × 10⁻⁴ m/min0.5, (c) Cl = 6.0 × 10⁻⁴ m/min0.5, (d) Cl = 8.0 × 10⁻⁴ m/min0.5.
Processes 10 01296 g014
Figure 15. Fracturing outcomes under different fluid loss coefficients of the coal seam. (a) Effective area ratio with distance from the horizontal well to the coal seam top. (b) Effective area with distance from the horizontal well to the coal seam top.
Processes 10 01296 g015
Figure 16. Fracture geometry under different viscosity values of fracturing fluid. (a) 10 mPa·s, (b) 40 mPa·s, (c) 70 mPa·s, (d) 100 mPa·s.
Processes 10 01296 g016
Figure 17. Fracturing outcomes under different viscosity values of fracturing fluid. (a) Effective area ratio with distance from the horizontal well to the coal seam top. (b) Effective area with distance from the horizontal well to the coal seam top.
Processes 10 01296 g017
Figure 18. Fracture geometry under different numbers of perforation holes in one cluster, (a) 4 perforations, (b) 10 perforations, (c) 16 perforations.
Processes 10 01296 g018
Figure 19. Fracturing outcomes under different numbers of perforation holes in one cluster. (a) Effective area ratio with distance from the horizontal well to the coal seam top. (b) Effective area with distance from the horizontal well to the coal seam top.
Processes 10 01296 g019
Publisher’s Note: MDPI stays neutral with regard to jurisdictional claims in published maps and institutional affiliations.

