Article

Discussion on the Reconstruction of Medium/Low-Permeability Gas Reservoirs Based on Seepage Characteristics

1
School of Geosciences, China University of Petroleum (East China), Qingdao 266580, China
2
PetroChina Jidong Oilfield Company, Tangshan 063004, China
3
Institute of Petroleum and Natural Gas Engineering, Chongqing University of Science and Technology, Chongqing 401331, China
*
Author to whom correspondence should be addressed.
Processes 2022, 10(4), 756; https://doi.org/10.3390/pr10040756
Submission received: 11 February 2022 / Revised: 10 April 2022 / Accepted: 10 April 2022 / Published: 13 April 2022

Abstract

:
The construction of underground gas storage mostly focuses on depleted gas reservoirs. However, the depleted gas reservoir used to build underground gas storage in China is located far from the main gas consumption economic zone. It is necessary to reconstruct underground gas storage using nearby reservoirs in order to meet the needs of economic development. The complex three-phase seepage characteristics encountered in the process of reconstruction of underground gas storage reservoirs seriously affect their storage and injection production capacities. Combined with the mechanism of multiphase seepage and the multicycle injection production mode during the process of gas storage construction, the feasibility of rebuilding gas storage in medium- and low-permeability reservoirs was evaluated through relative permeability experiments and core injection production experiments. The results showed that the mutual driving of two-phase oil–water systems will affect the storage space and seepage capacity, that the adverse effect will be weakened after multiple cycles, and that increasing the gas injection cycle can enhance the gas-phase seepage capacity and improve the crude oil recovery. Therefore, we found that it is feasible to reconstruct underground gas storage in medium- and low-permeability reservoirs, which lays a foundation for the development of underground gas storage in China.

1. Introduction

Underground gas storage reservoirs are artificial gas fields or gas reservoirs formed by reinjecting commercial natural gas into underground pore space [1]. Underground gas storage has the following advantages: large storage capacity, high mobility, wide adjustment range for peak–valley gas consumption, durable service life of 30~50 years or more, and a large safety factor (much higher than surface facilities) [2]. There are 693 underground gas storage reservoirs in operation in 37 countries and regions around the world, and the natural gas supplied accounts for 11% of the total natural gas demand, 358.79 billion m3; these are mainly distributed throughout the CIS, North America and Europe [3]. China’s gas storage construction is relatively backward, and the in-operation gas volume from gas storage accounts for only 2.4% of the annual natural gas consumption, which is far lower than the world average [4]. With the increasing demand for natural gas for economic development, the construction of underground gas storage in China has entered a vigorous period. One of the main means to speed up the construction of gas storage in China is by exploring whether medium–low permeability reservoirs have the potential for construction of gas storage [5]. A high injection and production capacity of an underground gas storage space is necessary to ensure its ability to adjust to the peak–valley differences in gas consumption. In addition, the gas injection–production capacity is mainly determined by the seepage conditions of the area near the wellbore, and by the well’s control capacity [6]. During the process of multistage injection and production, the permeability of the reservoir will be greatly altered, thus affecting the gas injection and extraction capacity. This phenomenon is especially obvious for medium–low-permeability reservoirs. Therefore, it is necessary to discuss the potential for gas storage in medium–low-permeability reservoirs [7].
It is more complex to reconstruct an underground gas storage space from an oil reservoir than it is from a gas reservoir. As is well-known, in the reconstruction from an oil reservoir, there exists gas–oil, oil–water, and gas–water mixing areas, and a three-phase mixed seepage interval, rather than the simple gas–water two-phase flow. The polar components in crude oil have an obvious impact on the rock wettability in the reservoir, which further affects the multiphase flow and the effective storage capacity of gas in the porous medium. Al khdheeawi et al. [8,9] studied the effect of wettability on gas storage efficiency from multiple scales, and discussed the influence of different reservoir conditions on gas storage effects. Al khdheeawi proposed an experimental method that can effectively simulate the actual reservoir, which is the main way to study seepage law and effective storage capacity during the process of gas reservoir injection and production [10,11]. Testing of three-phase relative permeability is mainly achieved through physical simulation and mathematical modeling methods [12,13]. The mathematical modeling method is mainly based on stone probability models I and II combined with oil–gas, oil–water and gas–water two-phase relative permeability, to predict oil–gas–water three-phase relative permeability [14,15]. However, it has many assumptions and great limitations [16]. Among them, the physical simulation method tests the three-phase relative permeability curve to closely simulate the 13 types of saturation processes generated by the actual flow process of the oil reservoir [17,18,19]. This method is relatively direct, and the data are more reliable. However, the process is relatively complex and time-consuming, and it is limited by the experimental instruments and measurement methods [20,21]. The mathematical model method is relatively fast and simple, and is widely used. However, many limitations arise due to the idealization of the model. One of the main assumptions is that the three-phase relative permeability of the wetting and non-wetting phases depends only on its own saturation, and that the three-phase relative permeability can be replaced with the two-phase relative permeability under the same saturation conditions.
Therefore, targeting the main seepage intervals, (i.e., gas–water, oil–water and gas–oil flow areas), the relative permeabilities of gas–water, oil–water and gas–oil systems were studied under the traditional two-phase relative permeability measurement method. Furthermore, based on the relative permeability curve, we analyzed the changes in the petrophysical properties of the rock samples, and we discuss the feasibility of reconstruction of underground gas storage from medium–low-permeability reservoirs.

2. Experimental Methodology

2.1. Experimental Conditions

(1)
Temperature and pressure: 20 °C; atmospheric pressure.
(2)
Experimental brine: filtered formation brine with a TDS of 5600 mg/L.
(3)
Displacement gas: standard methane gas with a purity of 95%; apparent viscosity: 0.0178 mPa·s.
(4)
Displacement crude oil: density: 0.83 g/cm3; viscosity: 10.66 mPa·.s.
(5)
Experimental core: artificial core samples prepared from quartz minerals.
(5)
The other experimental parameters and conditions are shown in Table 1.
(6)
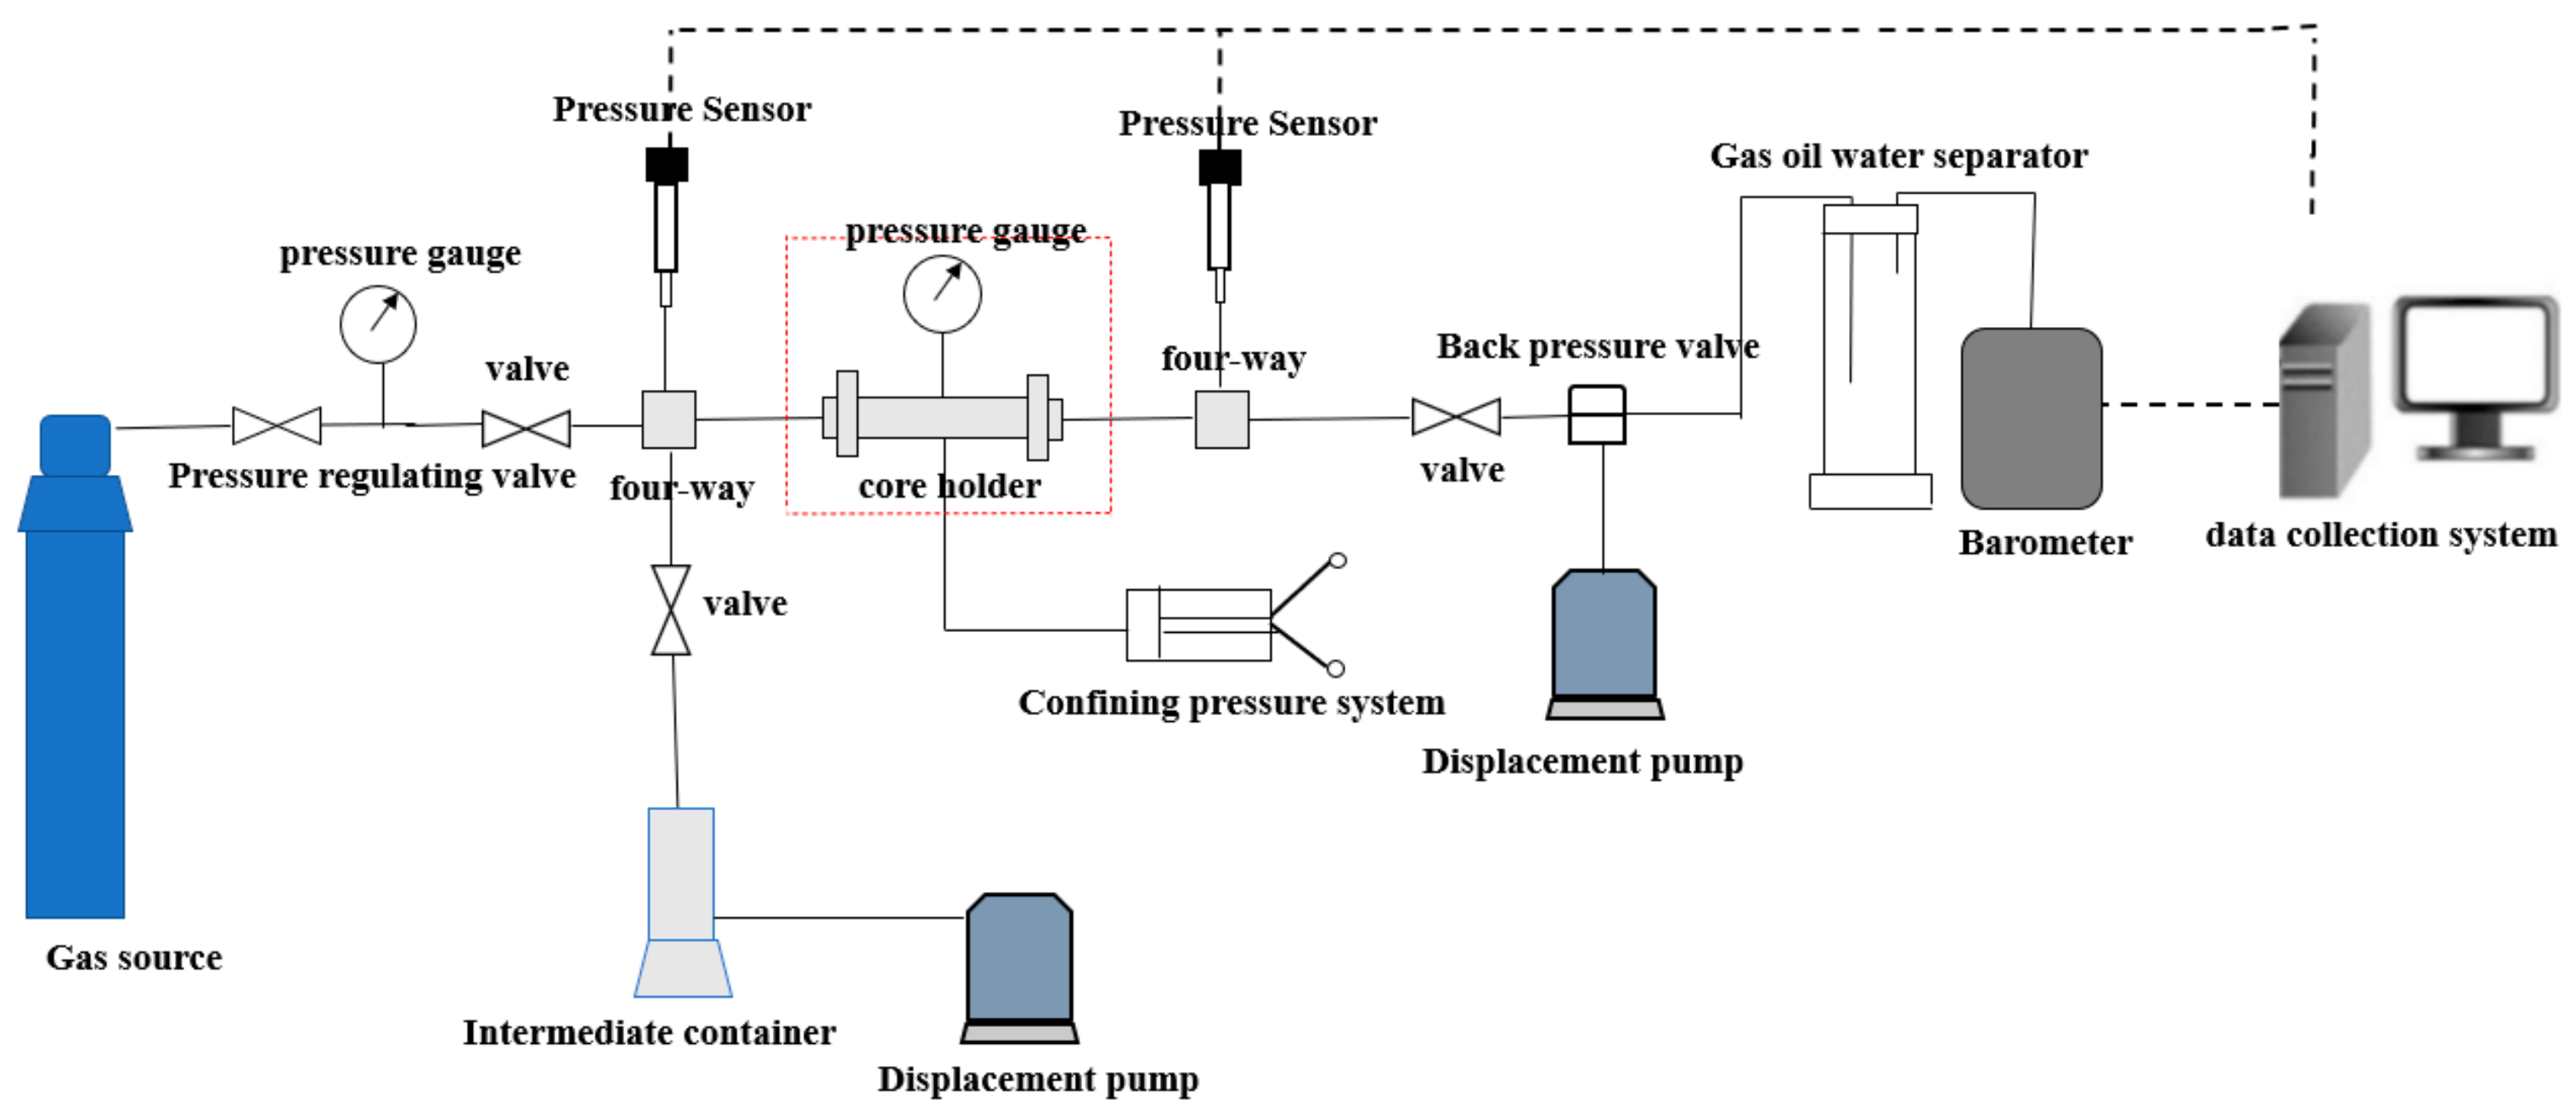
Components of the experimental set-up: ISCO pump (Teledyne ISCO, Lincoln, NE, USA), core holder (Hai’an core Petroleum Instrument Co., Ltd., Nantong, China), intermediate container (Hai’an Core Petroleum Instrument Co., Ltd., Nantong, China), six-way valve (Hai’an Core Petroleum Instrument Co., Ltd., Nantong, China), oil/water/gas three-phase separator (Hai’an Core Petroleum Instrument Co., Ltd., Nantong, China).
(7)
The experimental set-up is shown in Figure 1 below.

2.2. Experimental Methods and Procedures

2.2.1. Experimental Steps for Multicycle Oil and Water Seepage Simulation

(1)
The relative permeability measurement is performed as follows [22,23]: A. Vacuum-saturate the core sample with water first. Record the saturated water volume and thereby calculate the pore volume. Establish initial oil saturation by injection of oil at a flow rate of 0.1 mL/min. B. Adjust the crude oil injection rate to 1 mL/min, to eliminate the capillary end effect, and measure the oil phase permeability. C. Inject water to displace oil at the rate of 1 mL/min. (Note: accurately record the accumulative oil production, accumulative liquid production, and displacement pressure difference across the rock sample). Determine the water phase permeability at residual oil saturation. Stop the water–oil displacement experiment and measure the water saturation of the rock sample. D. Re-install the rock sample by reversing its direction into the core holder. Select the same speed (1 mL/min) to displace water with oil. E. Reverse the rock sample and place into the core holder again. Repeat the above steps until the difference in the oil phase relative permeability at residual water saturation between the last two measurements is less than 3%.
(2)
Calculation of the relative permeability curve: By ignoring the capillary force in the process of displacement, the improved “J·B·N” data processing method is used. In detail, the differential method instead of the derivative method is used. In other words, the oil and water volumes are measured after being static for a period of time, which can greatly improve the measurement accuracy. Sort the data recorded in the experiment, calculate the relative permeabilities one-by-one according to formulas (1)–(5), and establish a relationship chart for relative permeability and saturation.
f o S w = d V o ¯ t d V ¯ t
K ro = f o ( S w ) d 1 / V ¯ t d 1 / I · V ¯ t
K rw = K ro μ w μ o 1 f o ( S w ) f o ( S w )
I = Δ p 1 Δ p ( t )
S we = S wi + V o ¯ ( t ) - V ¯ ( t ) f o ( S w )

2.2.2. Experimental Steps for Multicycle Air and Water Seepage Simulation

(1)
The relative permeability measurement steps are as follows: A. Dry the core sample [24,25]. The gas permeability is determined by injecting gas at a rate of 7 mL/min. B. Vacuum-saturate the core sample with formation water and determine the porosity via the weight difference between the dry and wet core sample. C. Inject formation water at a constant rate of 1 mL/min to determine the absolute permeability. D. Gas displaces water at a rate of 7 mL/min. E. Record the pressure difference, cumulative produced fluids volume, cumulative produced water volume, gas breakthrough time and gas permeability at residual water saturation. F. Reverse the core sample, then re-install it into the core holder. Inject water to displace gas at a speed of 1 mL/min. Record the displacement pressure difference, accumulated fluids produced, accumulated water produced and the water permeability at the residual gas saturation. G. Repeat the above experimental steps.
(2)
Calculation procedure: Convert the cumulative produced fluids, measured at atmospheric pressure, to the value at the average rock sample pressure 𝑉l ⇒ = ∆Vωi + ∆(i−1) + [2𝑝𝑎∕(∆𝑝 + 2𝑝𝑎)]∆𝑉𝑔𝑖; Draw curves of cumulative gas produced versus time, cumulative water produced versus time and cumulative injection time. Separate the points evenly on the curve and perform the following calculations, (6)–(11).
S g , a v = V w V p
K rg = q gi q g
K rg K rw = f g f w · μ g μ w
C = P 3 P 4 + Δ P
q gi = Δ V gi Δ t   and   q g = K A μ g L · Δ P
f g = Δ V gi Δ V i   and   f w = Δ V wi Δ V i

2.2.3. Experimental Procedures for Multicycle Gas–Oil Seepage Simulation

(1)
Experimental steps for relative permeability measurement of gas and oil:
A.
Dry the core sample and determine the absolute permeability by injecting gas at a flow rate of 7 mL/min.
B.
Vacuum-saturate the core sample with formation brine and determine the porosity via the weight difference between the dry and wet core sample.
C.
Establish the connate water saturation by injecting oil to displace water at a flow rate of 1 mL/min until either no more water is produced, or the oil displacement stops when the injected volume reaches PV. Record the amount of water produced, and calculate the oil saturation and connate water saturation of the rock samples.
D.
Inject gas to displace the oil at a rate of 7 mL/min. Record the displacement pressure, oil production volume and gas production at desired time.
E.
When the residual oil saturation is reached, stop the displacement experiment and calculate the gas permeability.
F.
Inject oil from the other direction at a rate of 1 mL/min. Record the displacement pressure, oil production volume and gas production at desired time, until the residual gas saturation is reached. Determine gas phase effective permeability, and stop the displacement.
G.
Repeat the above experimental steps to complete multiple cycles of gas–oil seepage simulation.
(2)
The data processing method is similar to the one with gas and water [26].
The final relative permeability curve is standardized by the Brooks–Corey empirical model, described as formulas (12) and (13):
K r o = K r o ( S wi ) ( 1 S o r S w 1 S o r S w i ) m
K r w = K r w ( S o r ) ( S w S w i 1 S o r S w i ) n
The experimentally obtained relative permeability endpoints, Swi, Kro(Swi), Sor and Krw(Sor), are fit into formulas (12) and (13) to obtain m and n values. The experimental data are thus normalized.

2.2.4. Experimental Steps and Data Processing for Multicycle Injection and Production Experiments

The influence of gas injection on the storage and seepage capacities of the reservoir was analyzed through the multicycle injection and production experiment. The schematic of the experimental set-up is shown in Figure 2.
The experimental steps are as follows:
A.
Dry the core sample. Measure the absolute permeability by injecting the gas at 7 mL/min.
B.
Vacuum-saturate the core sample with water first. Record the saturated water volume and calculate the pore volume. Establish the initial oil saturation by injecting oil at a rate of 0.1 mL/min until there is no more water produced.
C.
imulate the gas injection process: inject natural gas at a constant speed of 10 mL/min and gradually pressurize to 15 MPa.
D.
Simulate the soaking process: close the outlet valve for 2 h.
E.
Simulate the oil production process: open the valve and gradually discharge the liquid. Control the liquid production time as half of the gas injection time, and depressurize to atmospheric pressure.
F.
Gradually increase the pressure until it rises to 15 MPa again, and repeat the process for 8 cycles. (Note: the amount of oil produced during multiple injection processes cannot be directly measured; it can only be determined by a weighing method. Therefore, the oil and water volume in the rock-heart can only be expressed by liquid saturation. Moreover, the liquid saturation is obtained by the average density of oil and water).
G.
Finally, measure the core weight and determine the oil and water volumes by the distillation method.
The initial properties of the core sample are shown in Table 2.

3. Results and Discussion

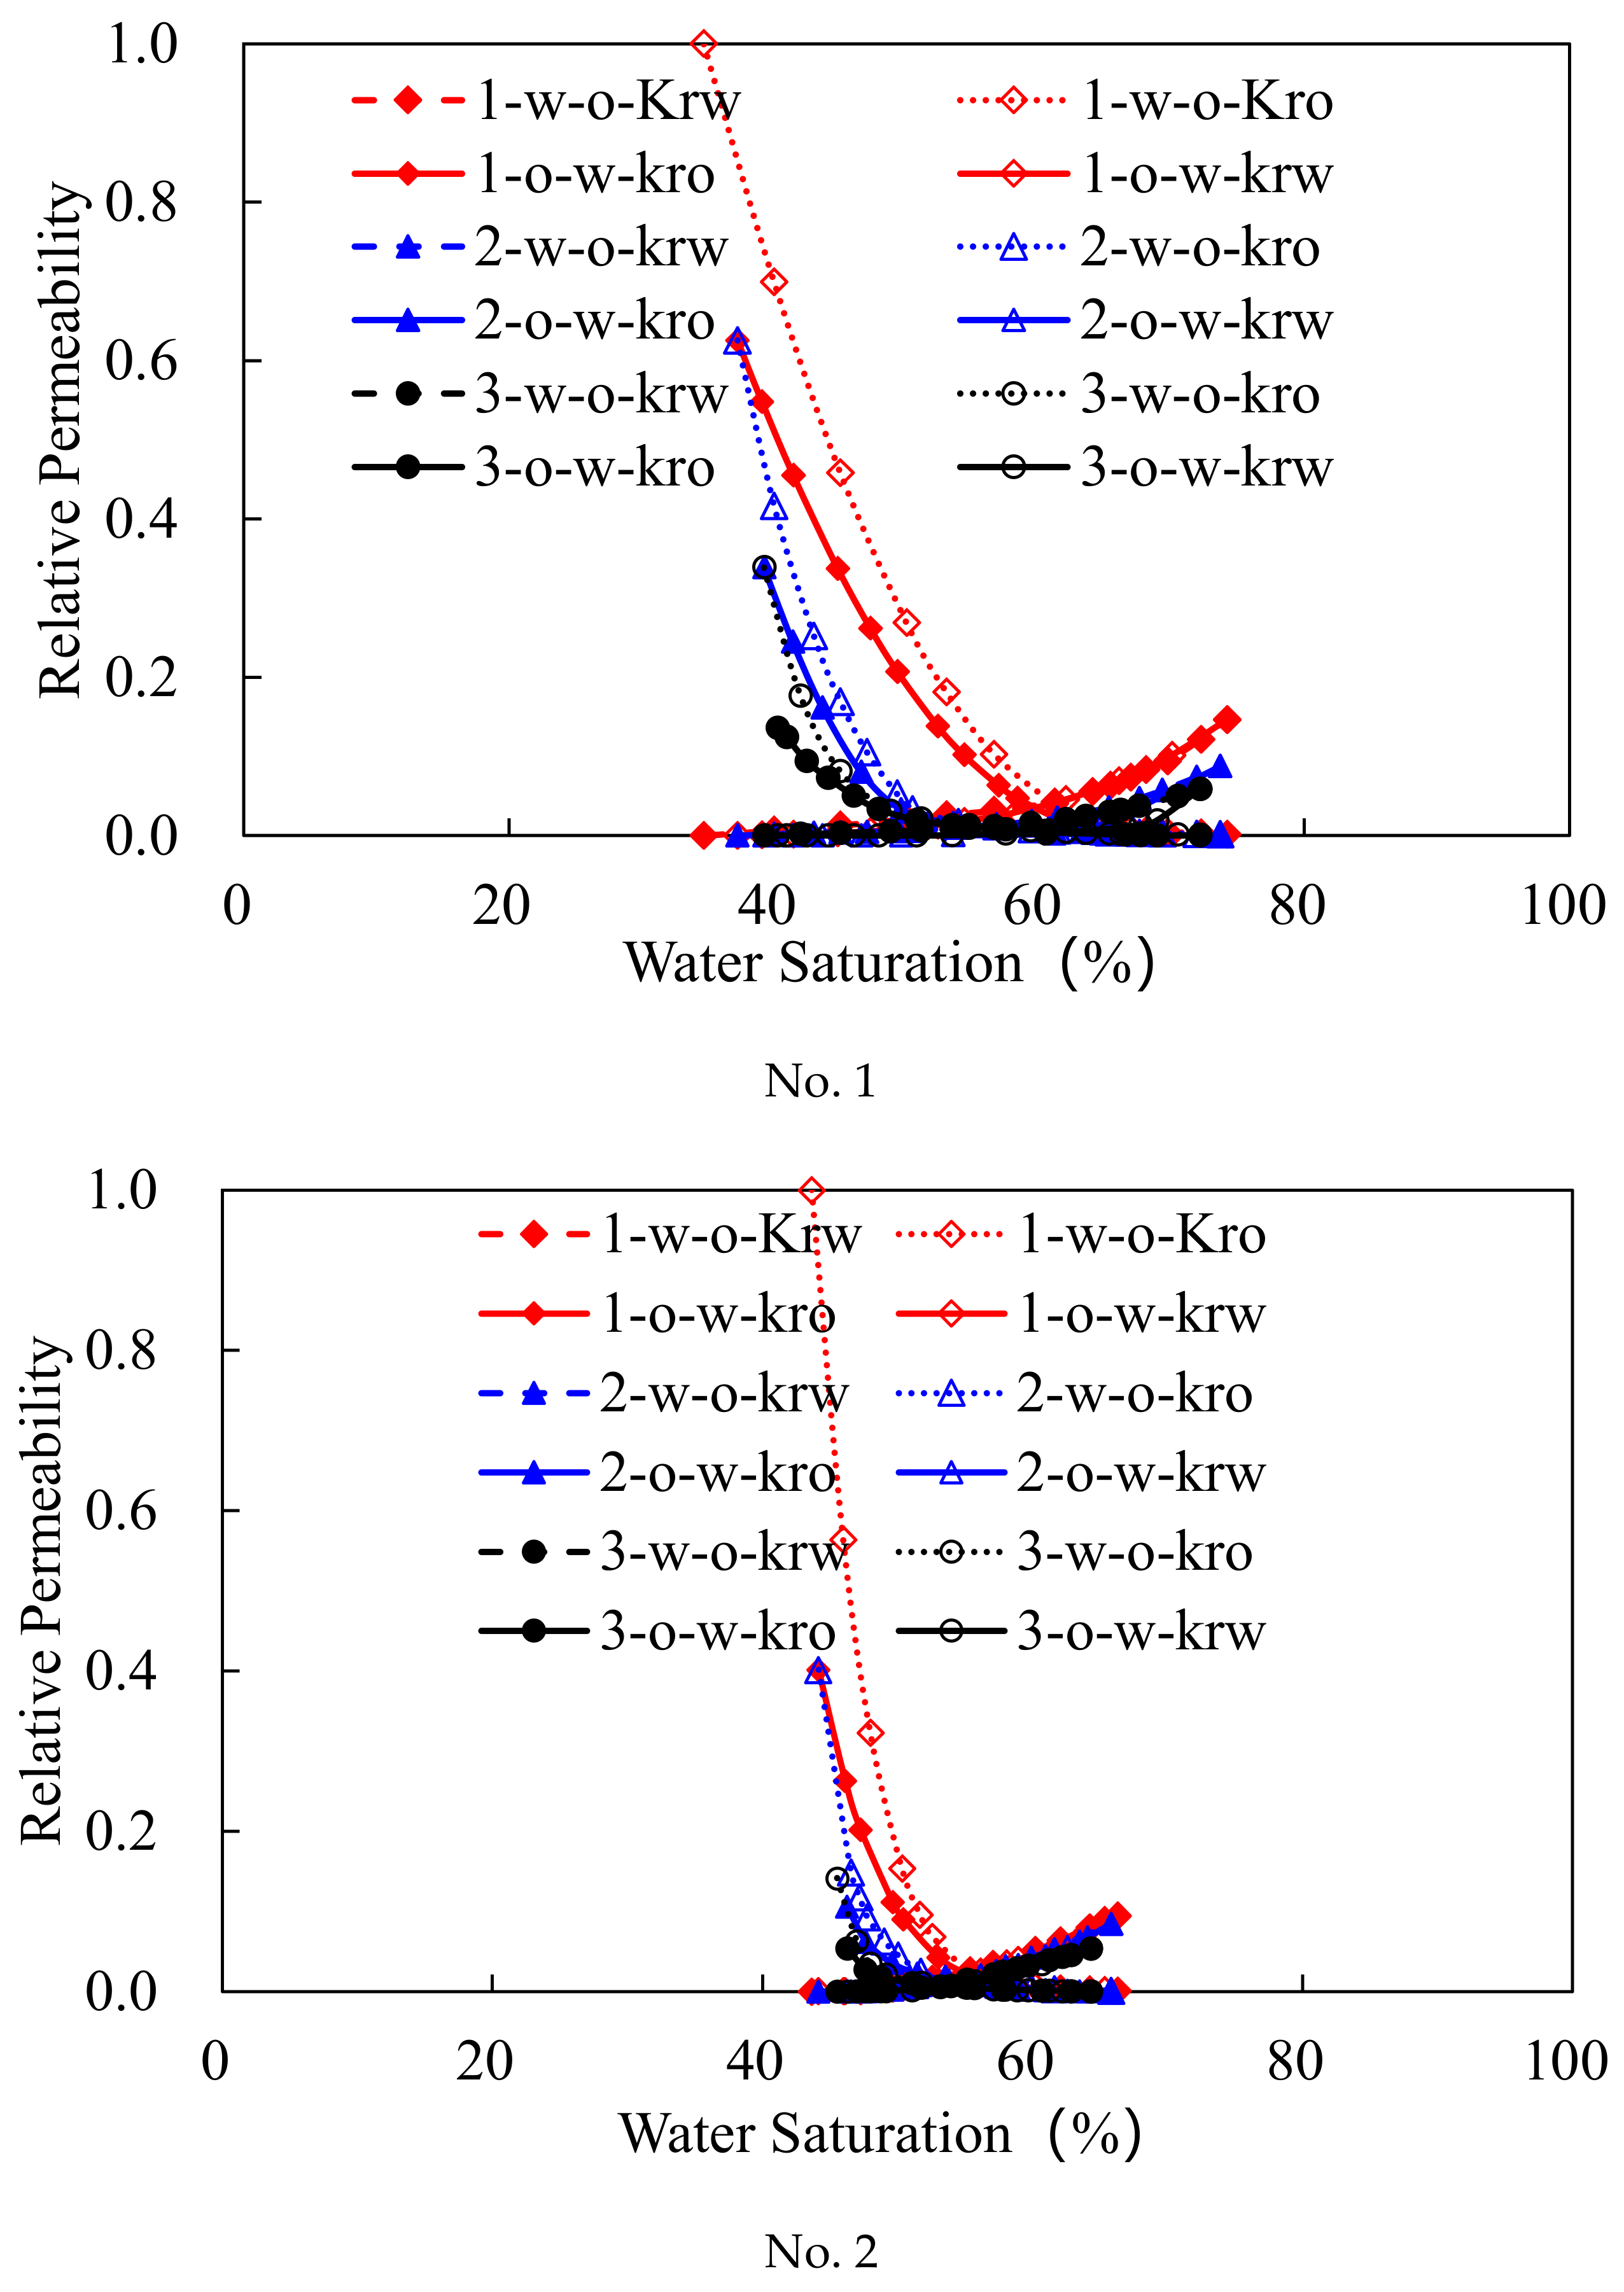
3.1. Oil–Water Relative Permeability Characteristics during Multicycle Displacements

Refer to Figure 3 for the characteristics of oil–water relative permeability during multicycle displacements; the values of key parameters are summarized in Table 3.
As seen from Figure 1, the seepage law of the low-permeability core is similar to that of the high-permeability core. After multiple cycles of oil–water displacements, the seepage capacity of both phases decreases, the connate water saturation rises, the residual oil saturation rises, the iso-permeability point moves downward, and the phase permeability under the endpoint saturation shows a decreasing trend. Oil–water seepage in low-permeability rock is more sensitive to the multiple-cycle displacements.
In the process of water displacement by oil, the oil advances rapidly along the dominant channel, along the leading edge. With displacement, the crude oil enters the small channel, thus reaching the state of the original oil content of the connate water, resulting in an increase in the residual oil saturation. Because the displaced water in the original oil-containing state is mainly the bypass water, which indicates that a substantial amount of water has not been displaced, this results in the rise in the connate water saturation. In the process of oil displacement by water, the leading edge of the water drive is non-piston. Only after the water break though is the other space reached. With more cycles of oil–water displacements, both the connate water saturation and the residual oil saturation increase, resulting in the reduction in the effective storage space.

3.2. Gas–Water Relative Permeability Characteristics during Multicycle Displacements

The seepage curve characteristics of different permeability cores are shown in Figure 4.
Figure 4 shows the changes in irreducible water saturation, residual oil saturation, and other characteristic values of high- and low-permeability cores under three rounds of mutual drive.
In the process of the gas storage cycle, hysteresis is obvious in the gas and water relative permeability curves. With more cycles of gas–water displacement, the relative permeability is decreased, and the simultaneous flow regime in the relative permeability curve becomes narrowed. However, this trend stabilizes after multiple cycles. In addition, the relative permeability curves reveal that “water invasion” and “water withdrawal” occur repeatedly in the cycles of gas–water displacements. The effective seepage flow ability is stable after multiple cycles, and the relative permeability hysteresis effect has an important influence on the well capacity for several periodic transition zones in the early stage of the gas reservoir.
The experimental results (see Table 4) show that after long-term operation, the gas reservoir is affected by water transportation, which reduces the availability of pore space and increases the gas flow resistance, affecting the reservoir expansion, and its injection and production capacities. With the increase in gas and water displacement cycles, the relative permeability decreased significantly in the first three injection and production cycles (see Figure 5A). The relative permeability decreased compared with the previous cycle. The connate water saturation and residual gas saturation increased with multiple cycles of gas and water displacements, and the whole process gradually stabilized. Due to the poor pore-throat sizes in the low-permeability core, and the high binding water saturation, a large amount of dead gas exists in the reservoir space, which leads to high residual gas saturation.
During the process of multiple cycles of gas and water displacements, the permeability of gas and water both showed an obvious downward trend, and the permeability capacity in the two-phase area was poor. After multiple rounds of mutual drive, gas explored the connate water space, and connate water saturation decreased slightly; more gas remained in the formation, increasing residual gas saturation after the first round, indicating that multiple rounds of gas–water drive have less influence on the seepage law of a low-permeability core.
After the core was subjected to the oil and water displacements, the connate water saturation decreased and the residual oil saturation increased, resulting in a decrease in the effective flow space and permeability capacity. However, the low-permeability core was less influenced by multiple rounds of mutual drive, and the phase seepage law change after multiple rounds was not obvious.

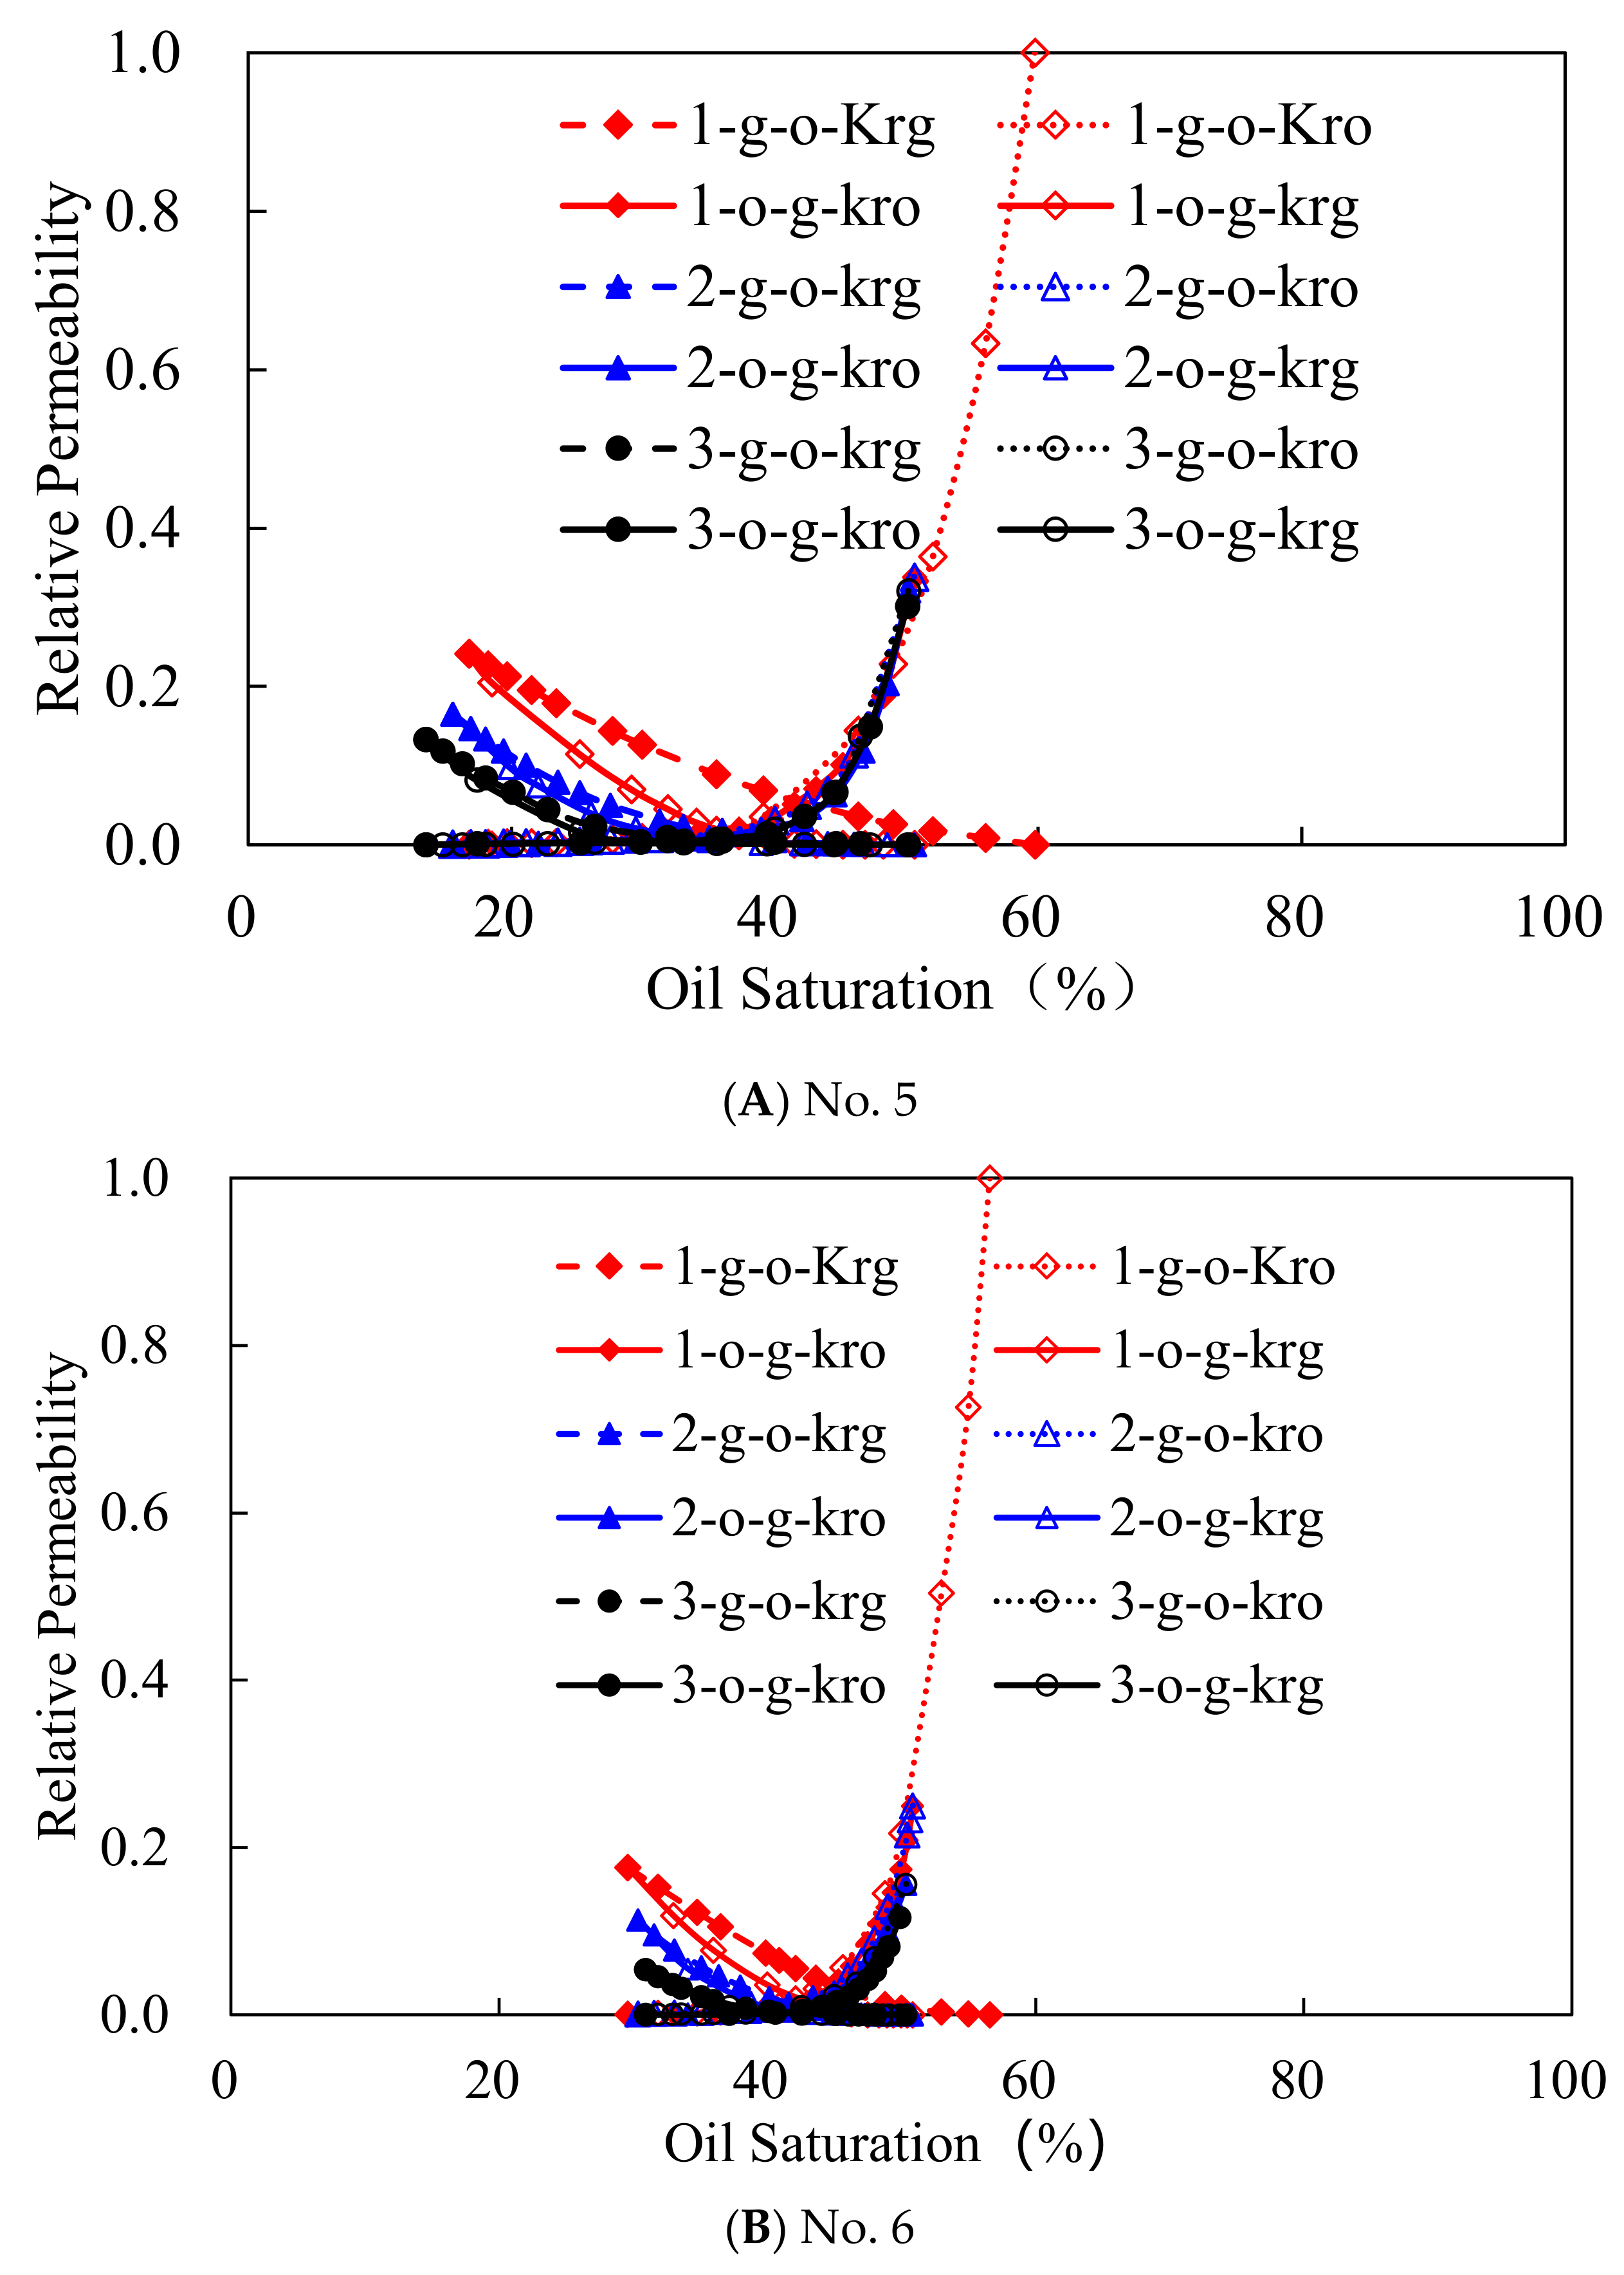
3.3. Gas–Oil Relative Permeability Characteristics during Multicycle Displacements

The seepage curve characteristics of different permeability cores are shown in Figure 6.
From Table 5, we can see that during the first round of the gas–oil displacement, the two-phase seepage interval is wide, i.e., 61%, that the original oil saturation of the rock core is 16.75%, and that the residual gas saturation is 10.42%. The relative permeability of the gas phase rose rapidly, indicating good gas permeability in the porous medium. In the process of the reverse oil drive, the law of oil seepage did not change significantly, except for the endpoint value, while the law of gas seepage changed significantly, showing a trend of rapid decline. This is due to the residual gas saturation that narrows the oil seepage channel. After multiple rounds of gas–oil mutual drive, the two-phase seepage capacity had decreased, the gas excavated the residual oil, which reduced the residual oil saturation, more gas remained in the formation, but the residual gas saturation was limited, and more connate water was produced. However, the change in the second and third cycles was much less than in the first and second cycles, indicating that the influence of multiple gas oil mutual drive was gradually decreased.

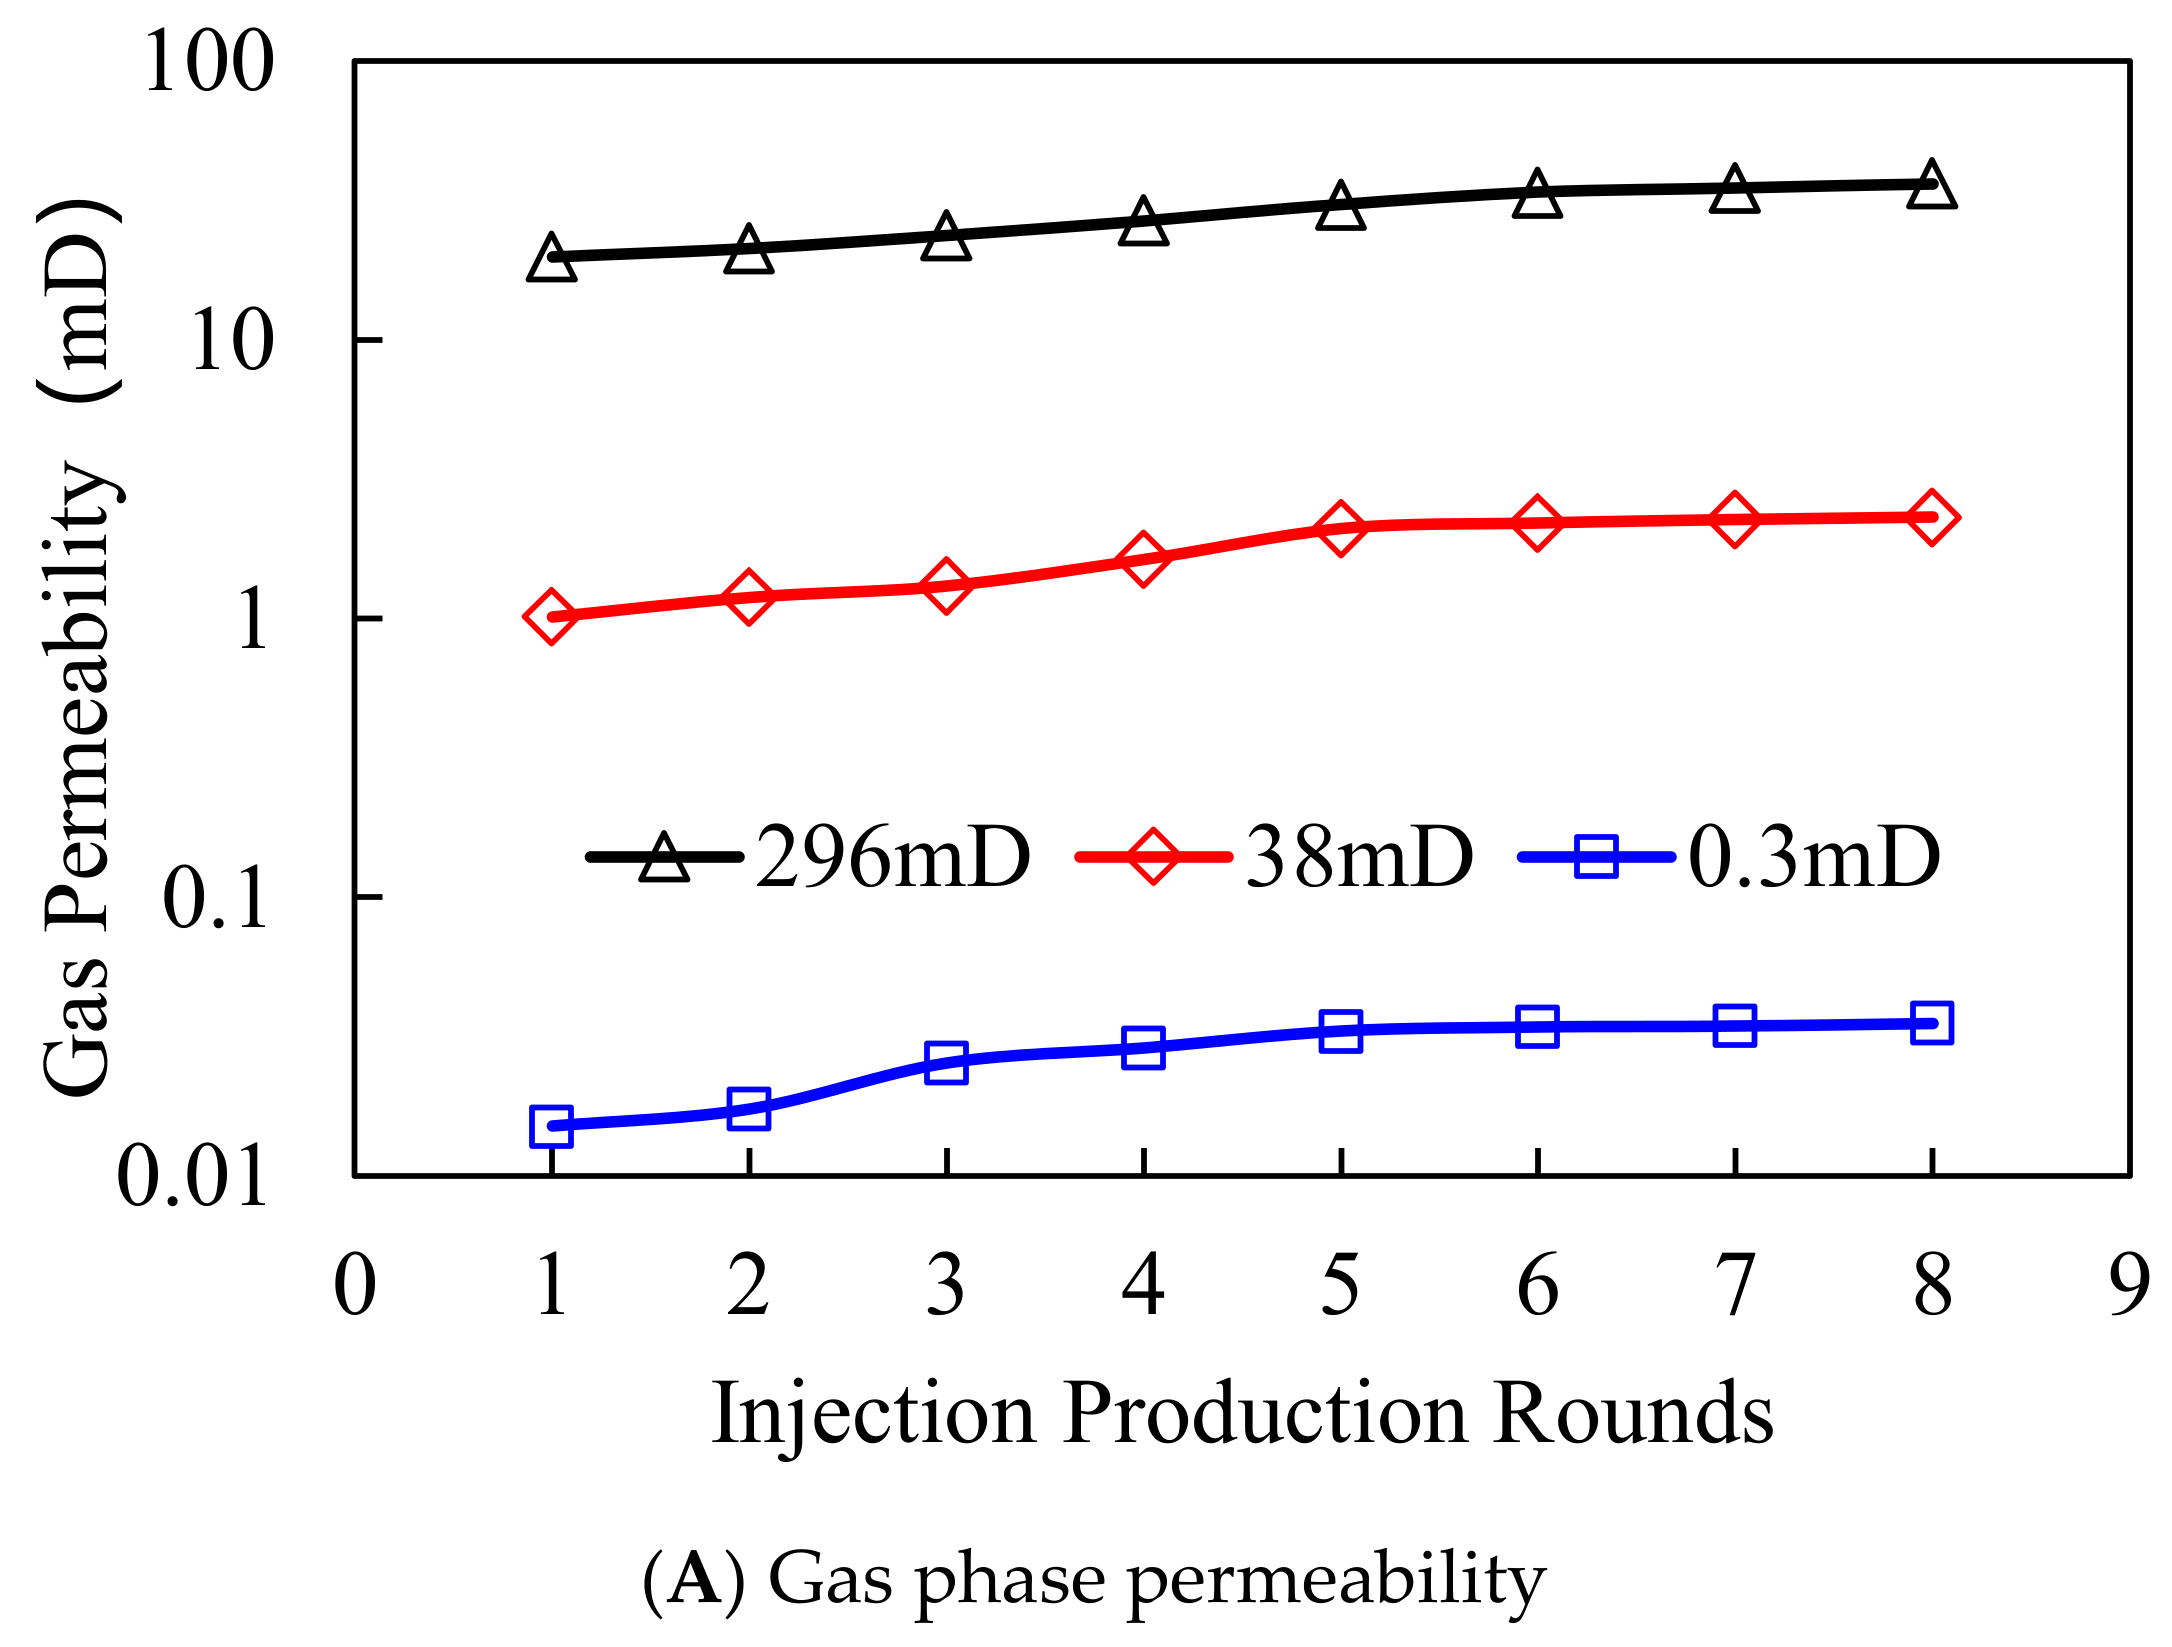
3.4. Results of the Multicycle Injection and Production of Different Permeability Cores

Figure 7 shows the gas phase permeability change under different injection cycles.
Multiple rounds of injection and production can improve the gas phase permeability of the core, further improve the efficiency of displacement, and expand the storage capacity of the core (reservoir). The displacement efficiency of high-seepage conditions is obviously the best, the gas permeability increases the most, and it still has a higher appreciation in the later period. The low-permeability core only increased significantly under the first two injections. Generally, regardless of high- and low-seepage conditions, multiple rounds of injection and production have a certain effect on improving the gas phase permeability of the core. However, with the increase in the injection and production cycles, the growth effect worsens; the lower the permeability, the earlier the peak growth rate appears.
Each round of injection and production can further excavate the remaining oil in the rock sample, and multiple rounds of gas injection can destroy the liquid balance conditions inside the core and expand the storage capacity; the higher the cumulative extraction degree, the better the sweep efficiency and the storage capacity. Eight rounds of injection and production will improve the cumulative recovery to different degrees, and in the high-permeability core, it could reach up to 16% (see Figure 8). With an increase in injection–production cycles, the increase in the recovery was different; the peak occurred in round 5, and the cumulative increase was smaller afterwards. The overall recovery factor in the medium- and low-permeability cores was limited, the growth rate was low, the extraction rate after eight rounds of injection mining was only 3%, and the capacity was limited. With increasing injection and production cycles, the subsequent growth rate was lower, and the effect was low.
Overall, multiple rounds of injection and production are conducive to improving the permeability of the gas, and the improvement effect on the high-permeability core is more significant. With the increase in the injection–production cycles, the improvement effect worsens, and the improvement effect in the low-permeability core is low.

4. Conclusions

Combined with the two-phase seepage mechanism and the injection–production operation mode in the reconstruction of underground gas storage, the experimental research method can accurately simulate the seepage law. On this basis, it is recognized that during the construction of underground gas storage after reservoir reconstruction, although the mutual displacement cycle of oil–water two phase systems increases during the construction of the reservoir, the effective gas storage space will be reduced by 3–4%, but the impact is gradually weakened. Multicycle gas injection can continuously excavate irreducible water and residual oil saturation and improve gas-phase seepage capacity. A reservoir with high permeability can increase the relative permeability of the gas phase by 10% and the storage space by 3%. The increase in reservoir growth under medium- and low-permeability conditions is relatively weak. In the process of construction and application, the mutual displacement of oil–water two-phase systems can be effectively reduced, and the reservoir can be reconstructed into underground gas storage through multicycle gas injection. Our study provides experimental and theoretical support for the technical development of oil reservoir reconstruction for underground gas storage in China.

Author Contributions

Conceptualization, S.Z. and G.G.; methodology, Q.X. and W.L.; software, H.H.; validation, Q.W. and Y.S.; formal analysis, S.Z.; investigation, G.G.; resources, S.Z.; data curation, G.G. and S.Y.; writing—original draft preparation, G.G. and S.Z.; writing—review and editing, S.Z. and S.Y.; project administration, Q.W. and Y.S.; funding acquisition, S.Z. and Q.X. All authors have read and agreed to the published version of the manuscript.

Funding

This work was supported in part by the Natural Science Foundation of Chongqing (cstc2021jcyj-msxmX0522) and the Natural Science Foundation of Chongqing (cstc2020jcyj-msxmX0216), and in part by the Bayu Scholars Program.

Informed Consent Statement

Informed consent was obtained from all subjects involved in the study.

Data Availability Statement

The data supporting the findings of this study are available from the corresponding author upon reasonable request.

Conflicts of Interest

The authors declare no conflict of interest.

Nomenclature

fo(Sw)oil phase fractional flow rate;
V o ¯ ( t ) and V ¯ ( t ) have no secondary cumulative oil production or liquid extraction volume, expressed by the fraction of the pore volume;
I the value of the relative injection capacity, also known as the flow capacity ratio;
Δp0initial drive pressure, MPa;
Δp(t)displacement pressure difference at t moment, MPa;
Swevalue of water saturation of rock sample outlet end surface;
Swbound water saturation, decimal;
Sg:avaverage gas saturation, %;
Vwaccumulated export water volume, mL;
qgigas flow during two-phase flow, mL/s;
qggas flow during single-phase flow, mL/s;
fggas content (decimal number);
fwwater content (decimal number);
μginjection gas viscosity, mPa·s;
μwviscosity of simulated formation water in saturated rock samples, mPa·s;
Cantihypertensive volume factor (decimal number);
P3rock sample inlet pressure (absolute), MPa;
P4rock sample outlet pressure (absolute), MPa.
Kro(Swi)relative permeability of the oil phase in the bound water state, mD
Krw(Sor)value of relative permeability of water phase in residual oil, mD;
Sorresidual oil saturation, decimal number;
m: nconstant;
1-g-o-Kro1 represents turn; g-o represents gas flooding; Kro represents relative permeability of oil phase.

References

  1. Jza, B.; Yta, B.; Tza, B.; Kya, B.; Xwa, B.; Qi, Z. Natural gas market and underground gas storage development in China. J. Energy Storage 2020, 29, 101338. [Google Scholar]
  2. Nils, L.; David, W. Gas storage valuation in incomplete markets. Eur. J. Oper. Res. 2021, 288, 318–330. [Google Scholar]
  3. Tang, Y.; Long, K.; Wang, J.; Xu, H.; Wang, Y.; He, Y.; Shi, L.; Zhu, H. Change of phase state duringMulti-wheel injection and production process of condensate gas reservoir based underground gas storage. Pet. Explor. Dev. 2021, 48, 395–406. [Google Scholar] [CrossRef]
  4. Toosheh, E.K.; Jafri, A.; Teymouri, A. Gas-water-rock interactions and factors affecting gas storage capacity during natural gas storage in a low permeability aquifer. Pet. Explor. Dev. 2018, 45, 1123–1128. [Google Scholar] [CrossRef]
  5. Shao, J.; You, L.; Kang, Y.; Chen, M.; Zhang, N. Experimental study on stress sensitivity of underground gas storage. J. Pet. Sci. Eng. 2020, 195, 107577. [Google Scholar] [CrossRef]
  6. Zhang, S.; Yan, Y.; Sheng, Z.; Yan, X. Uncertainty failure risk quantitative assessments for underground gas storage near-wellbore area. J. Energy Storage 2021, 36, 102393. [Google Scholar] [CrossRef]
  7. Wang, J.K.; Li, Y.H.; Xu, S.J.; Li, C.; Wang, J.M.; He, R.W.; Zhang, J.L. Change mechanism of pore structure and filling efficiency during injection production of sandstone underground gas storage. J. Nat. Gas Sci. Eng. 2022, 97, 104366. [Google Scholar] [CrossRef]
  8. Al-Khdheeawi, E.; Vialle, S.; Barifcani, A.; Iglauer, S. Impact of reservoir wettability and heterogeneity on CO2 -plume migration and trapping capacity. Int. J. Greenh. Gas Control 2017, 58, 142–158. [Google Scholar] [CrossRef]
  9. Al-Khdheeawi, E.; Vialle, S.; Barifcani, A.; Iglauer, S. Influence of CO2-wettability on CO2 migration and trapping capacity in deep saline aquifers. Greenh. Gases 2016, 7, 328–338. [Google Scholar] [CrossRef] [Green Version]
  10. Al-Khdheeawi, E.; Vialle, S.; Barifcani, A.; Iglauer, S. Influence of injection well configuration and rock wettability on CO2 plume behaviour and CO2 trapping capacity in heterogeneous reservoirs. J. Nat. Gas. Sci. Eng. 2017, 43, 190–206. [Google Scholar] [CrossRef]
  11. Al-Khdheeawi, E.; Vialle, S.; Barifcani, A.; Sarmadivaleh, M.; Zhang, Y.; Iglauer, S. Impact of salinity on CO2 containment security in highly heterogeneous reservoirs. Greenh. Gases 2017, 8, 93–105. [Google Scholar] [CrossRef]
  12. Niz, V.E. A Numerical and Physical Study of Relative Permeability in High-Pressure Air Injection Process. Ph.D. Thesis, University of Calgary, Calgary, AB, Canada, 2009. [Google Scholar]
  13. Durucan, S.; Ahsan, M.; Syed, A.; Shi, J.; Korre, A. Two Phase Relative Permeability of Gas and Water in Coal for Enhanced Coalbed Methane Recovery and CO2 Storage. Energy Procedia 2013, 37, 6730–6737. [Google Scholar] [CrossRef] [Green Version]
  14. Christoforos, B.; Giulia, C.; Carmela, F.; Mantegazzi, A.; Rocca, V.; Tango, G.; Trillo, F. Multidisciplinary Analysis of Ground Movements: An Underground Gas Storage Case Study. Remote Sens. 2020, 12, 3487. [Google Scholar]
  15. Zhu, S.J.; Ye, Z.B.; Zhang, J.; Xue, X.S.; Chen, Z.H.; Xiang, Z.P. Research on optimal timing range for early polymer injection in sandstone reservoir. Energy Rep. 2020, 6, 3357–3364. [Google Scholar] [CrossRef]
  16. Niz-Velasquez, E.; Moore, R.G.; van Fraassen, K.C.; Mehta, S.; Ursenbach, M. Experimental and numerical modeling of three-phase flow under high-pressure air injection. SPE Reserv. Eval. Eng. 2010, 13, 782–790. [Google Scholar] [CrossRef]
  17. Oak, M.J. Three-Phase Relative Permeability of Water-Wet Berea; Paper presented at the SPE/DOE Enhanced Oil Recovery Symposium; SPE: Tulsa, OK, USA, 1990; p. 20183. [Google Scholar]
  18. Withjack, E.M.; Devier, C.; Michael, G. The Role of X-ray Computed Tomography in Core Analysis; Paper presented at the SPE Western Regional/AAPG Pacific Section Joint Meeting; SPE: Long Beach, CA, USA, 2003; p. 83467. [Google Scholar]
  19. Lu, W.; Liu, Q.; Zhang, Z. Measurement of three-phase relative permeabilities. Pet. Explor. Dev. 2012, 39, 713–719. [Google Scholar] [CrossRef]
  20. Maini, B.B.; Nicola, F.; Goldman, J. Measurements and Estimation of Three-Phase Relative Permeability; Petroleum Recovery Institute: Calgary, AB, Canada, 1990. [Google Scholar]
  21. Ao, X.; Wang, B.B.; Qu, H.; Xiang, Z.P.; Luo, Z. Swelling of Shales with Slickwater in Carbon Dioxide. Energy Fuels 2021, 35, 5122–5129. [Google Scholar] [CrossRef]
  22. Shi, L.T.; Zhu, S.J.; Zhang, J.; Wang, S.X.; Xue, X.S. Research into polymer injection timing for Bohai heavy oil reservoirs. Pet. Sci. 2015, 12, 129–134. [Google Scholar] [CrossRef] [Green Version]
  23. Zhao, S.; Pu, W.F. Investigation into the effect of polymer microspheres (PMs) on oil-water relative permeability and oil-in-water emulsion stability for enhanced oil recovery. J. Dispers. Sci. Technol. 2021, 42, 1695–1702. [Google Scholar] [CrossRef]
  24. Ao, X.; Lu, Y.Y.; Tang, J.R.; Chen, Y.; Li, H. Investigation on the physics structure and chemical properties of the shale treated by supercritical CO2. J. CO2 Util. 2017, 20, 274–281. [Google Scholar] [CrossRef]
  25. Beltrán, A.; Hernández-Díaz, D.; Chávez, O.; Garcia, A.; Zenit, R. Experimental study of the effect of wettability on the relative permeability for air–water flow through porous media. Int. J. Multiph. Flow 2019, 120, 103091. [Google Scholar] [CrossRef]
  26. Modaresghazani, J.; Moore, R.G.; Mehta, S.A.; Fraassen, K.C.V. Investigation of the relative permeabilities in two-phase flow of heavy oil/water and three-phase flow of heavy oil/water/gas systems. J. Pet. Sci. Eng. 2019, 172, 681–689. [Google Scholar] [CrossRef]
Figure 1. Schematic diagram of experimental flow of mutual drive.
Processes 10 00756 g001
Figure 2. Schematic diagram of multiwheel injection and mining experiments.
Processes 10 00756 g002
Figure 3. The characteristics of the multiwheel oil and water mutual flow seepage curve of cores 1 and 2. (1-g-o-Kro–1 represents turn; g-o represents gas flooding; Kro represents relative permeability of oil phase).
Processes 10 00756 g003
Figure 4. Characteristics of the multiwheel air–water interdrive penetration curves of cores No. 3 and 4. (1-g-o-Kro–1 represents turn; g-o represents gas flooding; Kro represents relative permeability of oil phase).
Processes 10 00756 g004
Figure 5. Microscopic interpretation of residual gas formation in rock core after gas–water mutual drive. (A) a closed gas formed by the card break; (B) a closed gas formed by the circumflow; (C) a closed gas formed by the blind end.
Processes 10 00756 g005
Figure 6. Multiwheel secondary gas–oil interdrive seepage curve of cores No. 5 and 6. (1-g-o-Kro–1 represents turn; g-o represents gas flooding; Kro represents relative permeability of oil phase).
Processes 10 00756 g006
Figure 7. Effect of multi cycle gas injection on permeability change of cores with different permeability.
Processes 10 00756 g007aProcesses 10 00756 g007b
Figure 8. Acquisition degree of different permeabilities at eight rounds.
Processes 10 00756 g008
Table 1. Basic physical properties and classification of experimental cores for relative permeability test.
NumberPermeability
mD
Porosity
%
Length
cm
Diameter
cm
Experiment Type
1266.6416.574.822.51Oil–water seepage
20.875.674.782.52Oil–water seepage
3238.3615.174.762.51Gas–water seepage
41.235.174.782.52Gas–water seepage
5269.3316.514.822.51Gas–oil seepage
635.649.804.832.47Gas–oil seepage
Table 2. Core physical properties and oil–water saturation parameters before injection–production experiment.
Core NumberLength
cm
Diameter
cm
Porosity
%
Permeability
mD
Water Saturation before Gas Drive, %Oil Saturation before Gas Drive, %
14.822.5115.44296.5872.1427.86
24.892.5321.7138.0366.5133.49
34.822.524.330.3364.3535.65
Table 3. Characteristic Values of Multiwheel Oil and Water Drive with Different Penetration.
Interdrive CycleSwi, %Soi, %Effective Gas Storage SpaceKro(Swi)Krw(Soi)Isopoint Permeability
134.6925.8339.480.760.650.11
237.2326.3536.420.550.250.06
339.2527.8632.890.440.080.02
143.6633.6922.650.400.100.02
244.1434.1721.690.140.090.02
345.5535.6518.800.050.050.01
Table 4. Key parameter values of relative permeability under multiple rounds of mutual drive in cores with different permeability.
Penetration Rate Interdrive WheelSwi, %Sgi, %Effective Gas Storage SpaceKrg(Swi)Krw(Sgi)
266 mD141.704.6553.650.300.31
239.988.6551.370.170.25
339.0711.3049.630.160.21
0.8 mD163.5010.6225.880.220.17
261.9014.4823.620.130.09
360.5215.6523.830.110.07
Table 5. Characteristic values of multiwheel secondary gas–oil interdrive seepage with different permeability rates.
Penetration RateInterdrive WheelSoiDisplacement EfficiencySwiSgiKro(Sgi)Krg(Soi)
278 mD116.7533.833910.4222.3315.94
215.5534.5938.7511.1121.1610.91
313.4836.5738.7511.2019.928.81
33 mD129.5927.0043.416.850.250.18
230.3620.4742.327.340.160.11
330.9519.3942.327.790.120.05
Publisher’s Note: MDPI stays neutral with regard to jurisdictional claims in published maps and institutional affiliations.

