Article

LCA-Based Carbon Footprint Accounting of Mixed Rare Earth Oxides Production from Ionic Rare Earths

1
College of Resource and Environmental Engineering, Jiangxi University of Science and Technology, Ganzhou 341000, China
2
Jiangxi Key Laboratory of Mining & Metallurgy Environmental Pollution Control, Jiangxi University of Science and Technology, Ganzhou 341000, China
3
Key Lab of Environmental Engineering and Pollution Ecology, Chinese Academy of Sciences, Shenyang 110016, China
*
Authors to whom correspondence should be addressed.
Processes 2022, 10(7), 1354; https://doi.org/10.3390/pr10071354
Submission received: 10 June 2022 / Revised: 1 July 2022 / Accepted: 7 July 2022 / Published: 12 July 2022

Abstract

:
At present, there are significant knowledge gaps in the research on the resource and environmental effects of rare earth exploitation, especially the carbon emission coefficient. This study applies the life cycle assessment approach to calculate the carbon footprint of producing mixed oxide rare earths using ionic rare earth resources and analyze the sources and influencing factors of the carbon footprint. The results show that the carbon footprint of producing 1 kg of mixed oxide rare earths using ionic rare earths is 17.8~24.3 kg CO2 eq, but its uncertainty is 15.54%; the total carbon footprint from 2012 to 2017 reaches 1.6 × 10⁸~2.19 × 10⁸ kg CO2 eq/year, and after 2018, the carbon footprint decreases to 1.51 × 10⁸~2.07 × 10⁸ kg CO2 eq /year. The total carbon footprint of illegal mining is around 1.50 × 10⁸~1.59 × 10⁸ kg CO2 eq/ year. In principle, the higher the recovery rate, the lower the carbon footprint of 1 kg REO production, but with the increase in the recovery rate, the carbon footprint reduction benefit brought by the increase in the unit recovery rate shows a downward trend. Finally, the new generation of magnesium salt leaching technology, while alleviating ammonia nitrogen pollution in ionic rare earth mines, will increase the carbon footprint of the product.

1. Introduction

Rare earths are a critical strategic resource in the global supply chain [1]. Global rare earth oxide (REO) production has rapidly increased over the past 30 years, from 60,000 t in 1989 to 240,000 t in 2020 [2,3]. According to USGS statistics, China’s REO production reached a cumulative total of 2.56 million t between 1995 and 2020, accounting for 82% of the total global production, with an annual production between 2005 and 2010 that once accounted for 97% [3]. However, the actual contribution of rare earth production from China should be much higher than the USGS data due to the large amount of rare earth resources that were privately mined, pirated, and smuggled for a considerable period of time and were therefore not included in the statistics [4,5]. The unique metallogenic geological characteristics of rare earth resources and their physicochemical properties also forces rare earth development to face a series of ecological risks and deep-seated environmental problems that threaten the sustainable development of the rare earth industry [6,7,8]. In the past three decades, scholars have published a number of research results on the environmental effects of rare earth development as well as environmental cost assessments of the process of rare earth resource development and utilization [9] and the environmental impacts arising from rare earth processing [10] and life cycle evaluations of rare earth products [11]. However, we have found that there are still many challenges and knowledge gaps in the analysis of the carbon footprint of rare earth development. Generally, the types of rare earths are mainly divided into light and heavy rare earths [12]. Heavy rare earth elements are crucial to the development, modernization, and national defense construction of high-tech industries [13]. There are ionic rare earth mines in the Jiangxi Province of southern China; however, since 2014, rare earth mining in Jiangxi Province has faced a complete shutdown for rectification due to severe pollution [14].
The carbon footprint is one of the most essential environmental indicators of products and services and has become more critical and prominent due to climate change [15,16]. Therefore, carrying out carbon footprint accounting of rare earth resource development is also essential for formulating low-carbon development strategies for the industry [17,18]. Current studies on carbon footprint in the field of rare earths are mainly from the product perspective, covering topics such as rare earth oxides [17], rare earth metals [19], and NdFeB (Neodymium Magnets) permanent magnet materials [11], and recycling processes, such as NdFeB scrap recycling [20] from the recycling technology perspective [12]. However, there are still knowledge gaps in the carbon footprint accounting of rare earth development, particularly from the life cycle assessment perspective. Therefore, this study takes the development of ionic rare earth resources in Jiangxi Province, China, as the research object and accounts for its carbon emissions based on the life cycle assessment method. This research studies the carbon footprint of the ionic rare earth production process of mixed oxide rare earths and analyzes its influencing factors in addition to presenting targeted strategies to guide the development of ionic rare earths in Jiangxi Province, China, towards low-carbon emissions and provides knowledge and contributes data to the study of the environmental effects of the international rare earth development process.

2. Materials and Methods

2.1. Carbon Footprint Accounting

Carbon footprint analysis is a widely accepted method for assessing direct and indirect carbon emissions of products over their life cycle and is a crucial way to effectively evaluate greenhouse gas emissions [21]. There are two main types of carbon footprint calculation methods, namely “bottom-up” process analysis (PA), which is based on life cycle assessment, and “top-down” economics input–output analysis (EIO) [22]. Life cycle assessment methods have been applied to account for the carbon footprint of the production process of various rare earth products [17]. For example, Vahidi et al. accounted for the carbon footprint of the in situ leaching stage of ionic rare earths in Gannan, China, based on the LCA method and the Ecoinvent database [18] and then used the same method the following year for the solvent extraction phase of ionic rare earths [23]. However, the above studies only accounted for the carbon footprint of the ionic rare earth development process. This study, however, which is based on the local LCA tool and localized data, calculates and analyze the carbon footprint of the ionic rare earth resource development process based on the actual product production process.

2.2. Life Cycle Assessment Approach

As an essential environmental management tool, life cycle assessment (LCA) is used to assess relevant environmental factors and their potential impacts on the whole life cycle of a product or service [24]. The methodological framework of all LCA techniques is based on ISO standard 14040, which can be divided into four parts: objective and scope definition, inventory analysis, impact assessment, and results interpretation [25]. This paper adopts the life cycle carbon footprint database and online accounting system eFootprint, developed by Yike Environment (IKE), and analyzes the uncertainty of the results using the built-in logic formula.

2.3. System Boundary and Process Unit

The system boundary is the whole process of ionic rare earths, from mining to obtaining mixed oxide rare earth products. This includes the in situ leaching stage to produce rare earth carbonate and the oxidation scorch stage to produce mixed oxide rare earths. All raw materials, energy, and resources are used from “door to door” (B2B) for quantitative analysis throughout the whole life cycle. The equipment, infrastructure, and waste disposal phases are not included in this study. The system and boundaries are shown in Figure 1.
(1) In situ leaching process and inventory: The leaching process of ionic rare earth ores has undergone three generations of processes: pond leaching, heap leaching, and in situ leaching. In situ leaching enriches the rare earth ions adsorbed on clay minerals in the leaching solution by the leaching agent [26]. The cations with higher exchange potential in the leaching agent are exchanged with the rare earth ions in the adsorbed state, so that the rare earth ions can enter the leaching solution. Then, through the collection system, the obtained rare earth enrichment solution is collected in the mother liquor treatment plant. After the processes of de-binding, precipitation, and retreatment, dewatering is used to obtain the rare earth carbonate (REC) product [27]. In this inventory analysis, the inputs and outputs we consider are mainly the data that can be collected by the enterprise when conducting the environmental impact assessment, in which electricity is chosen as an average because of the geographical disparity considered in the selection of the nature of the data. Ammonium salt leaching is the use of ammonium sulfate as a leaching agent and ammonium bicarbonate as a precipitant, the product of which is rare earth carbonate (92% rare earth oxide folded). The main process for the production of 1 kg of rare earth carbonate is shown in Table 1.
(2) Magnesium salt leaching uses magnesium sulfate as a leaching agent and magnesium oxide as a precipitant, and the resulting product is rare earth hydroxide. The main inventory list for producing 1kg of rare earth hydroxide is shown in Table 2.
(3) Oxidation scorching process and inventory: Oxidation scorching is a further process for rare earth carbonate obtained from the in situ leaching process, and the resulting product is mixed oxide rare earths (content of 92%). The specific inventory list for the production of 1 kg of mixed oxide rare earths is shown in Table 3. In the inventory analysis, the inputs and outputs we considered are mainly the data that can be collected by the enterprise when conducting the environmental impact assessment. The analysis is abandoned for the input materials and outputs that cannot be collected.

2.4. Data Sources and Assumptions

The relevant data of the life cycle inventory of the ionic rare earth development process are mainly extracted from the in situ leaching process EIA (Environmental Impact Assessment) reports, the public data of the in situ companies, and the data of the production companies located in southern China’s Ganzhou City in Jiangxi Province,—where there is an important base of ionic rare earth mines. In addition, we assume that all of the transportation included in the statistics are undertaken by gasoline trucks (rated with a capacity of 8 t).

3. Results

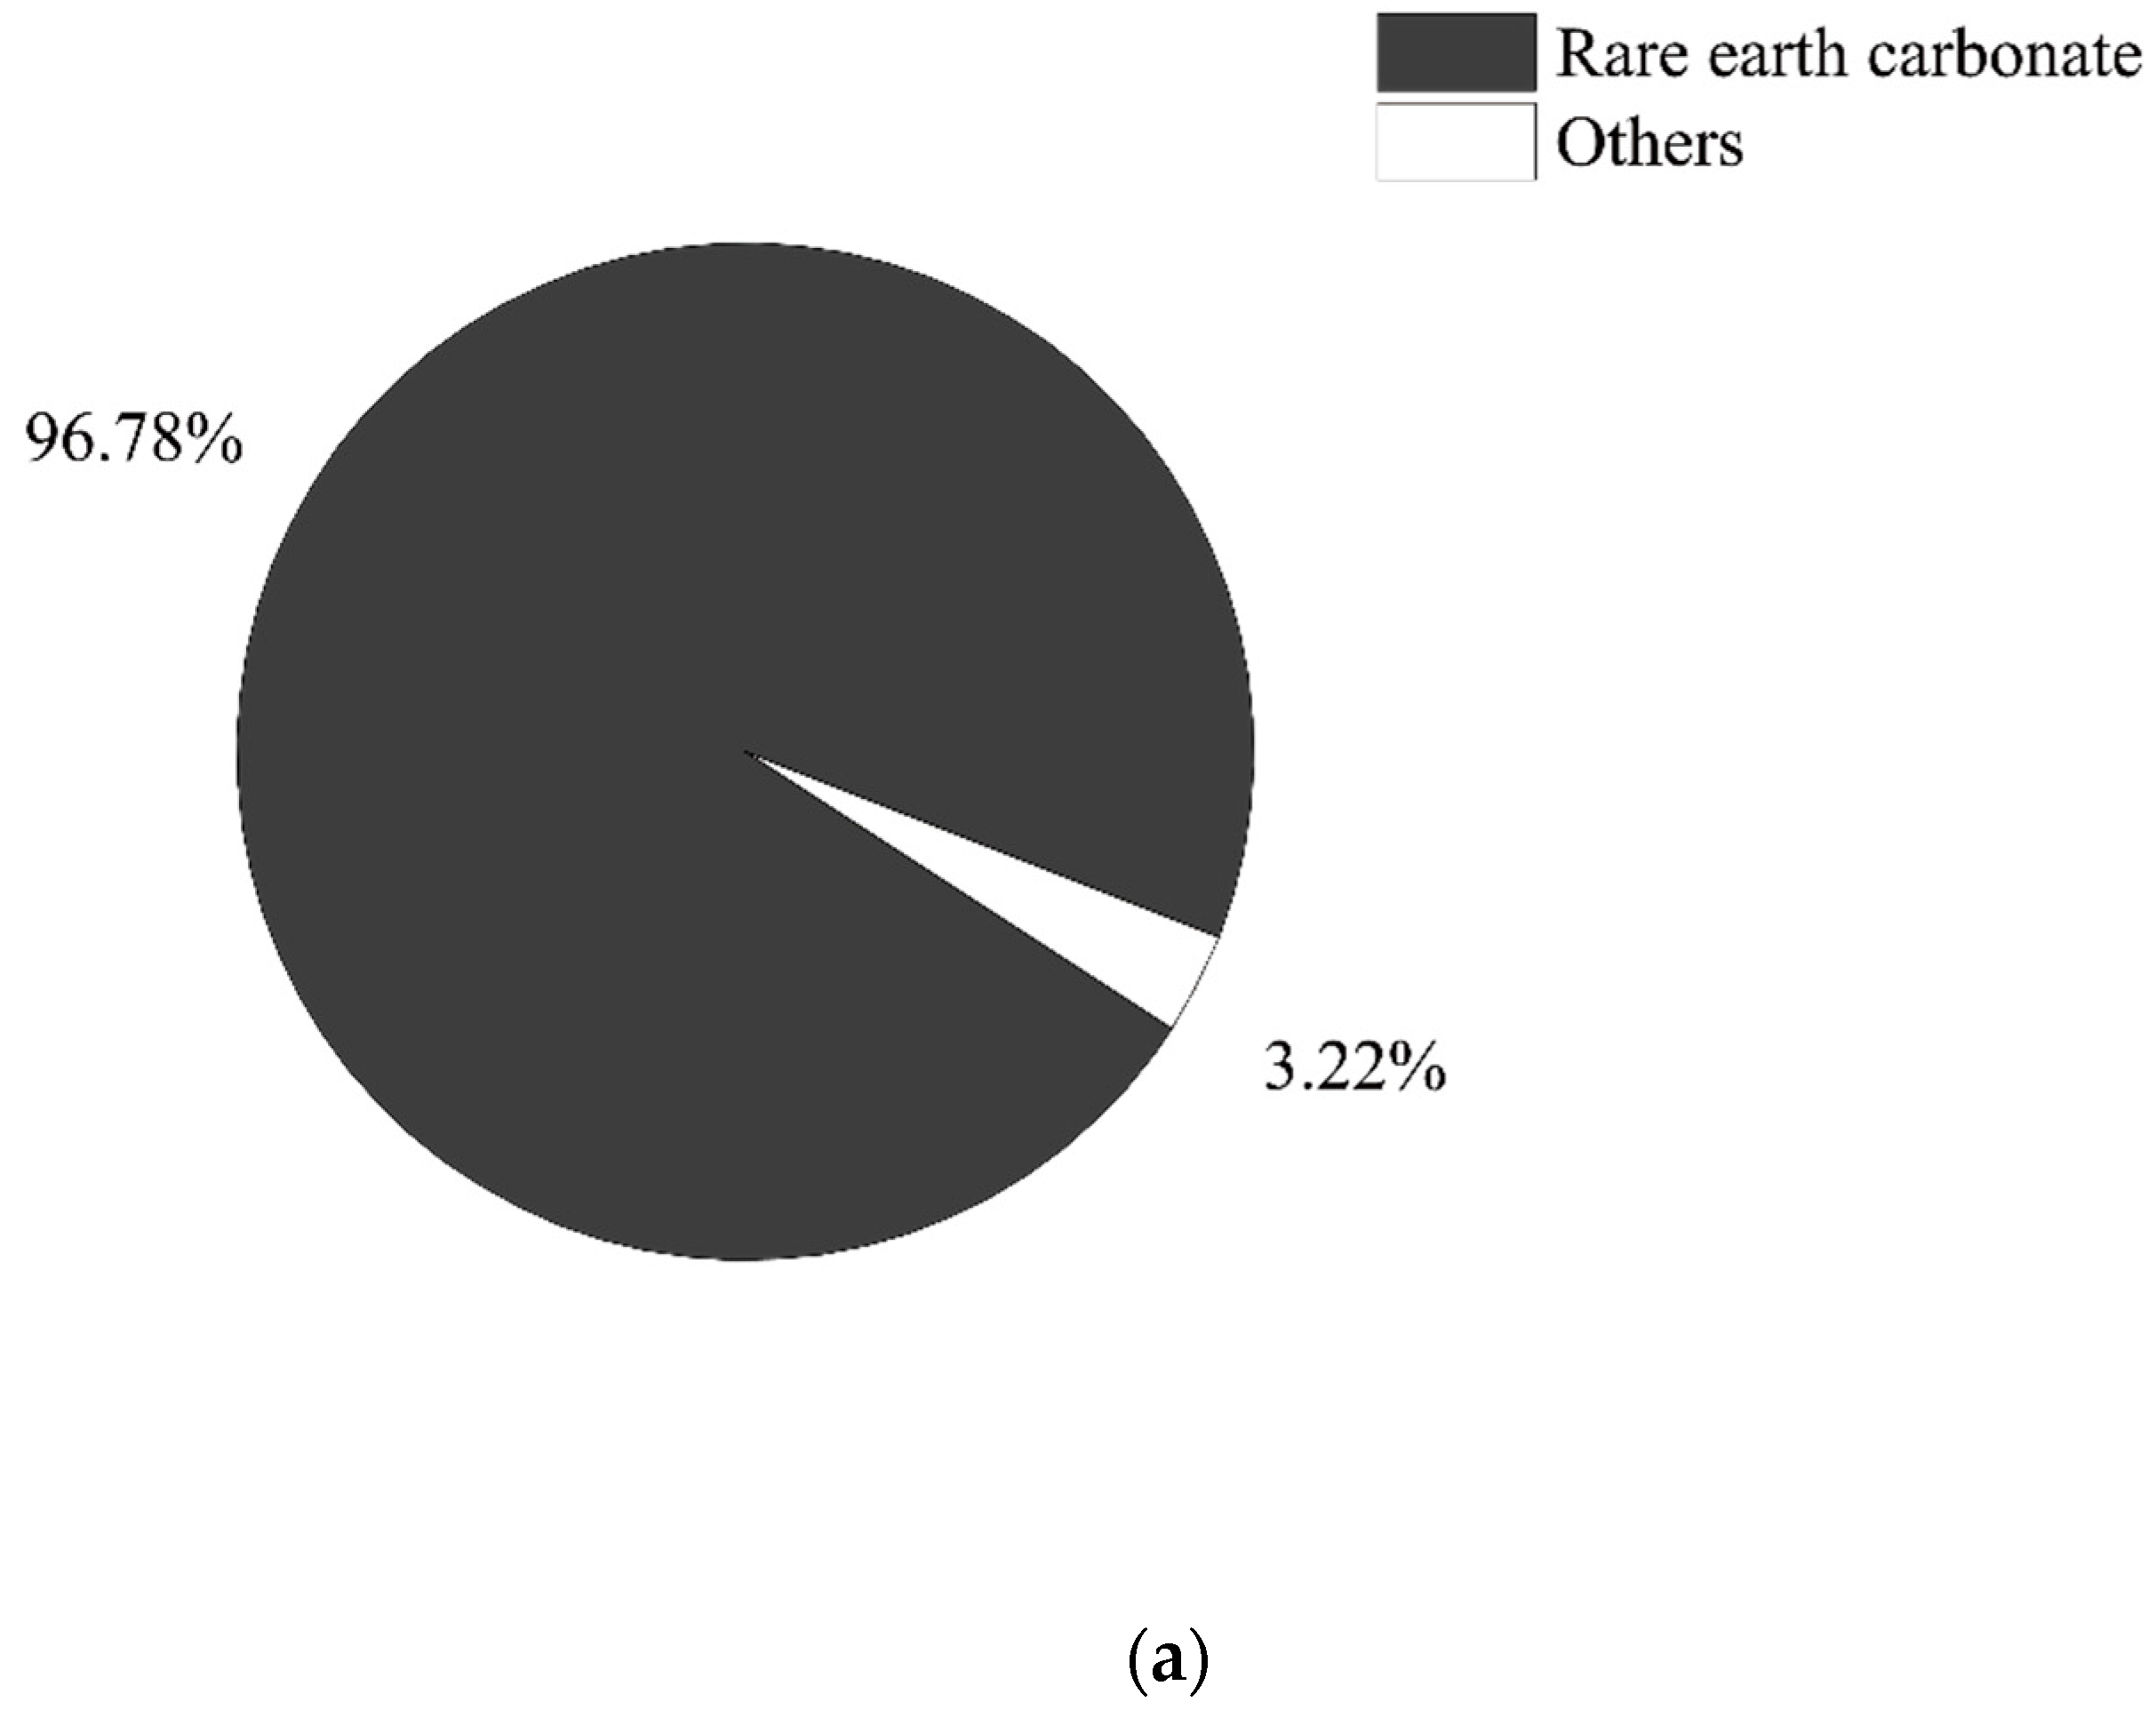
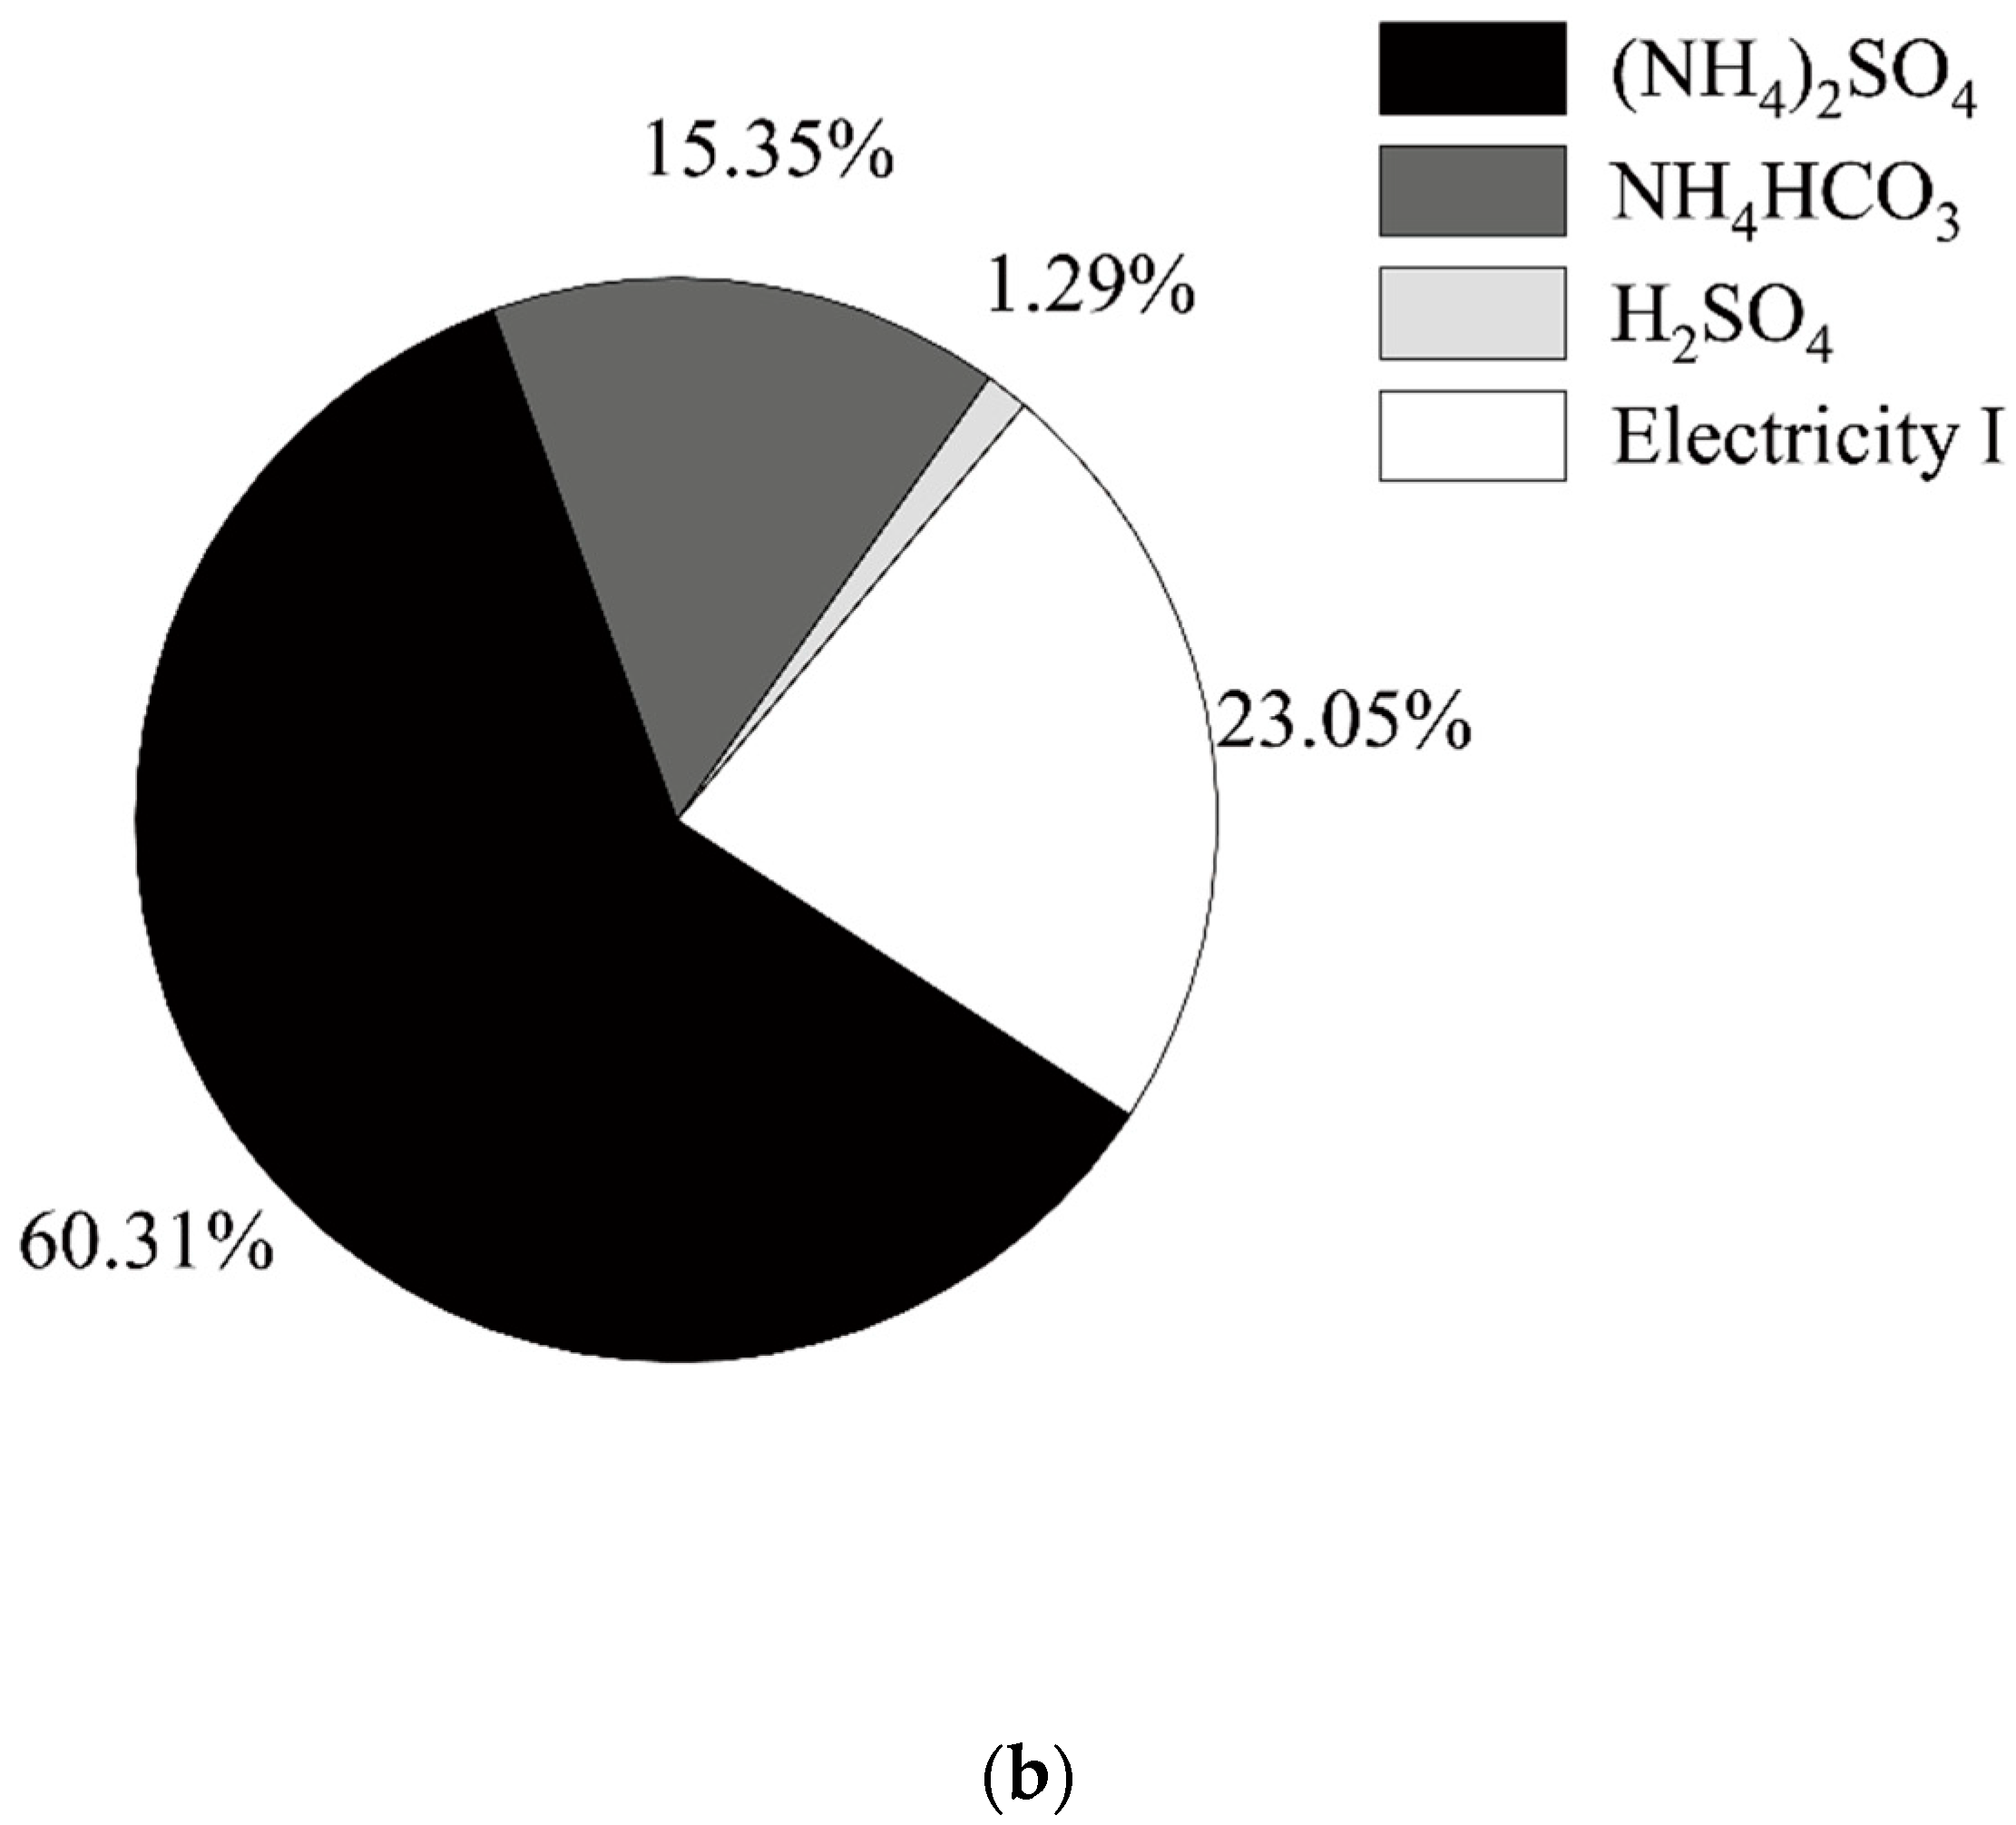
3.1. Carbon Footprint Analysis of Rare Earth Development

The LCA-based accounting results show that the carbon footprint of developing ionic rare earths to produce mixed oxide rare earths is 21.08 kg CO2 eq/kg REO. However, due to the uncertainty of some parameters in each step of ionic rare earth development, the carbon footprint of the ionic rare earth production process of oxide rare earths is also uncertain, with an uncertainty degree of 15.54% (Table 4).
The carbon footprint contribution of the in situ leaching process is as follows, in descending order: ammonium sulfate (60.31%), electricity (23.05%), ammonium bicarbonate (15.35%), and sulfuric acid (1.29%). The carbon footprint contribution of rare earth carbonate produced in the in situ leaching process is the main source of the oxidation scorch process, accounting for 96.78% of the total contribution. Therefore, the carbon footprint of the development of ionic rare earths for the production of mixed oxide rare earths mainly comes from the in situ leaching stage (Figure 2).

3.2. Carbon Footprint Analysis under the Total Mining Control Target from 2012 to 2021

In 2006, the government started to implement the policy of total mining volume control, and in 2012, it standardized the allocation scheme of the directive production plan target [28]. After 2011, the new process of in situ leaching began to be popularized and applied [27]. Therefore, we counted the control targets of total ionic rare earth ore mining (converted to 92% REO) issued by the state from 2012 to 2021. Among them, the total mining volume in 2012 was not reported in the literature, so we assumed that the total mining volume was consistent with the year before and after, i.e., the amount mined in 2012 was 9000 t. According to the literature reports [5,19], we also assumed that the amount of illegally mined rare earths is 1/4 of the total amount of legal mining and that the consumption of ammonium sulfate, ammonium bicarbonate, sulfate, and electricity is 26.23 kg, 4.5 kg, 1.15 kg, and 12.8 kWh/kg REO, respectively (Lee et al. 2018). The results, as shown in Figure 3, show that the total carbon footprint from 2012 to 2017 amounted to 1.6 × 10⁸~2.19 × 10⁸ kg CO2 eq/year; after 2018, as the total amount of the indicator decreased, the carbon footprint decreased to 1.51 × 10⁸~2.07 × 10⁸ kg CO2 eq/year. From 2012 to 2017, the total amount of carbon footprint from the illegal mining of ionic rare earths reached 1.59 × 10⁸ kg CO2 eq /year, and after 2018, it fell to 1.5 × 10⁸ kg CO2 eq/year.

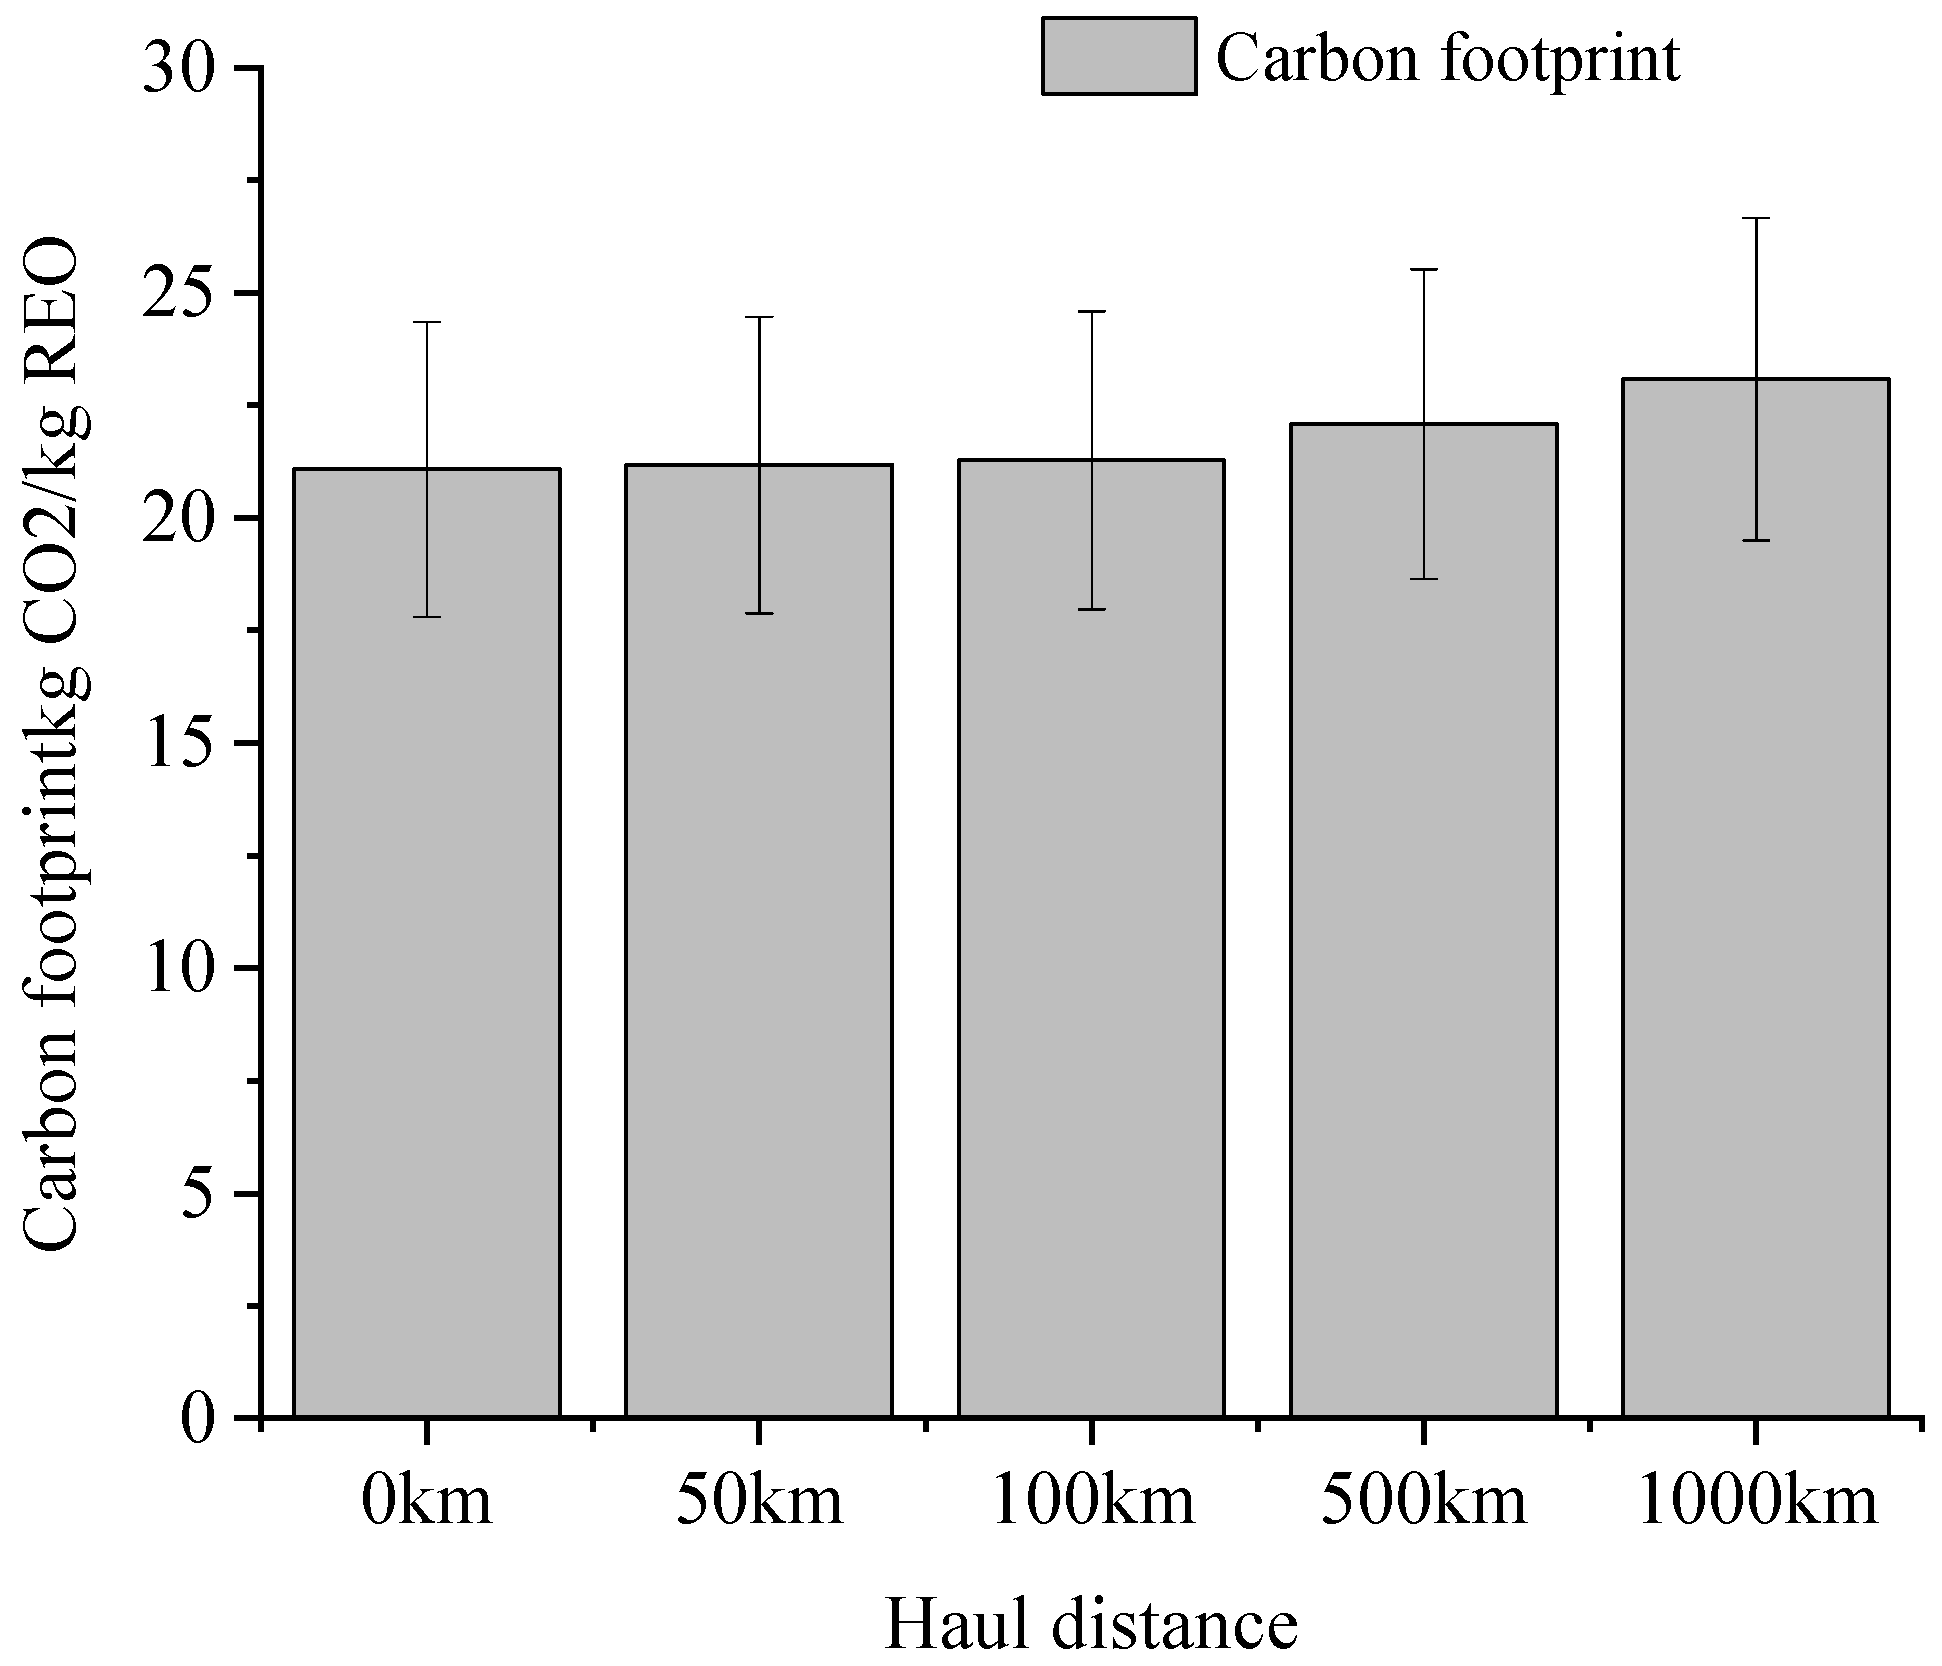
3.3. Effect of Material Transport Distance on Carbon Footprint of Ionic Rare Earth Development

The calculation results are realistic, and the carbon footprint caused by using a truck (rated load 8 t) to move 1 km per 1 kg of material transported is 1.05 × 10⁻⁴ kgCO2 eq. The total annual transport volume of the in situ leaching process is 98,400 t, of which 73,700 t are transported in and 24,700 t are transported out. The average transport volume per 1 kg of oxide rare earth product produced is 14.16 kg. Assuming that the average transportation distances are 0 km, 50 km, 100 km, 150 km, and 200 km, the obtained carbon footprint results are shown in Figure 4. When producing 1 kg of rare earth oxide product with an average transportation distance of 100 km, the carbon emission from the transportation process is 0.95% of that from the processing process. Therefore, we conclude that the material transportation process has a negligible impact on the carbon footprint of the ionic rare earth development and the production process of mixed oxide rare earths.

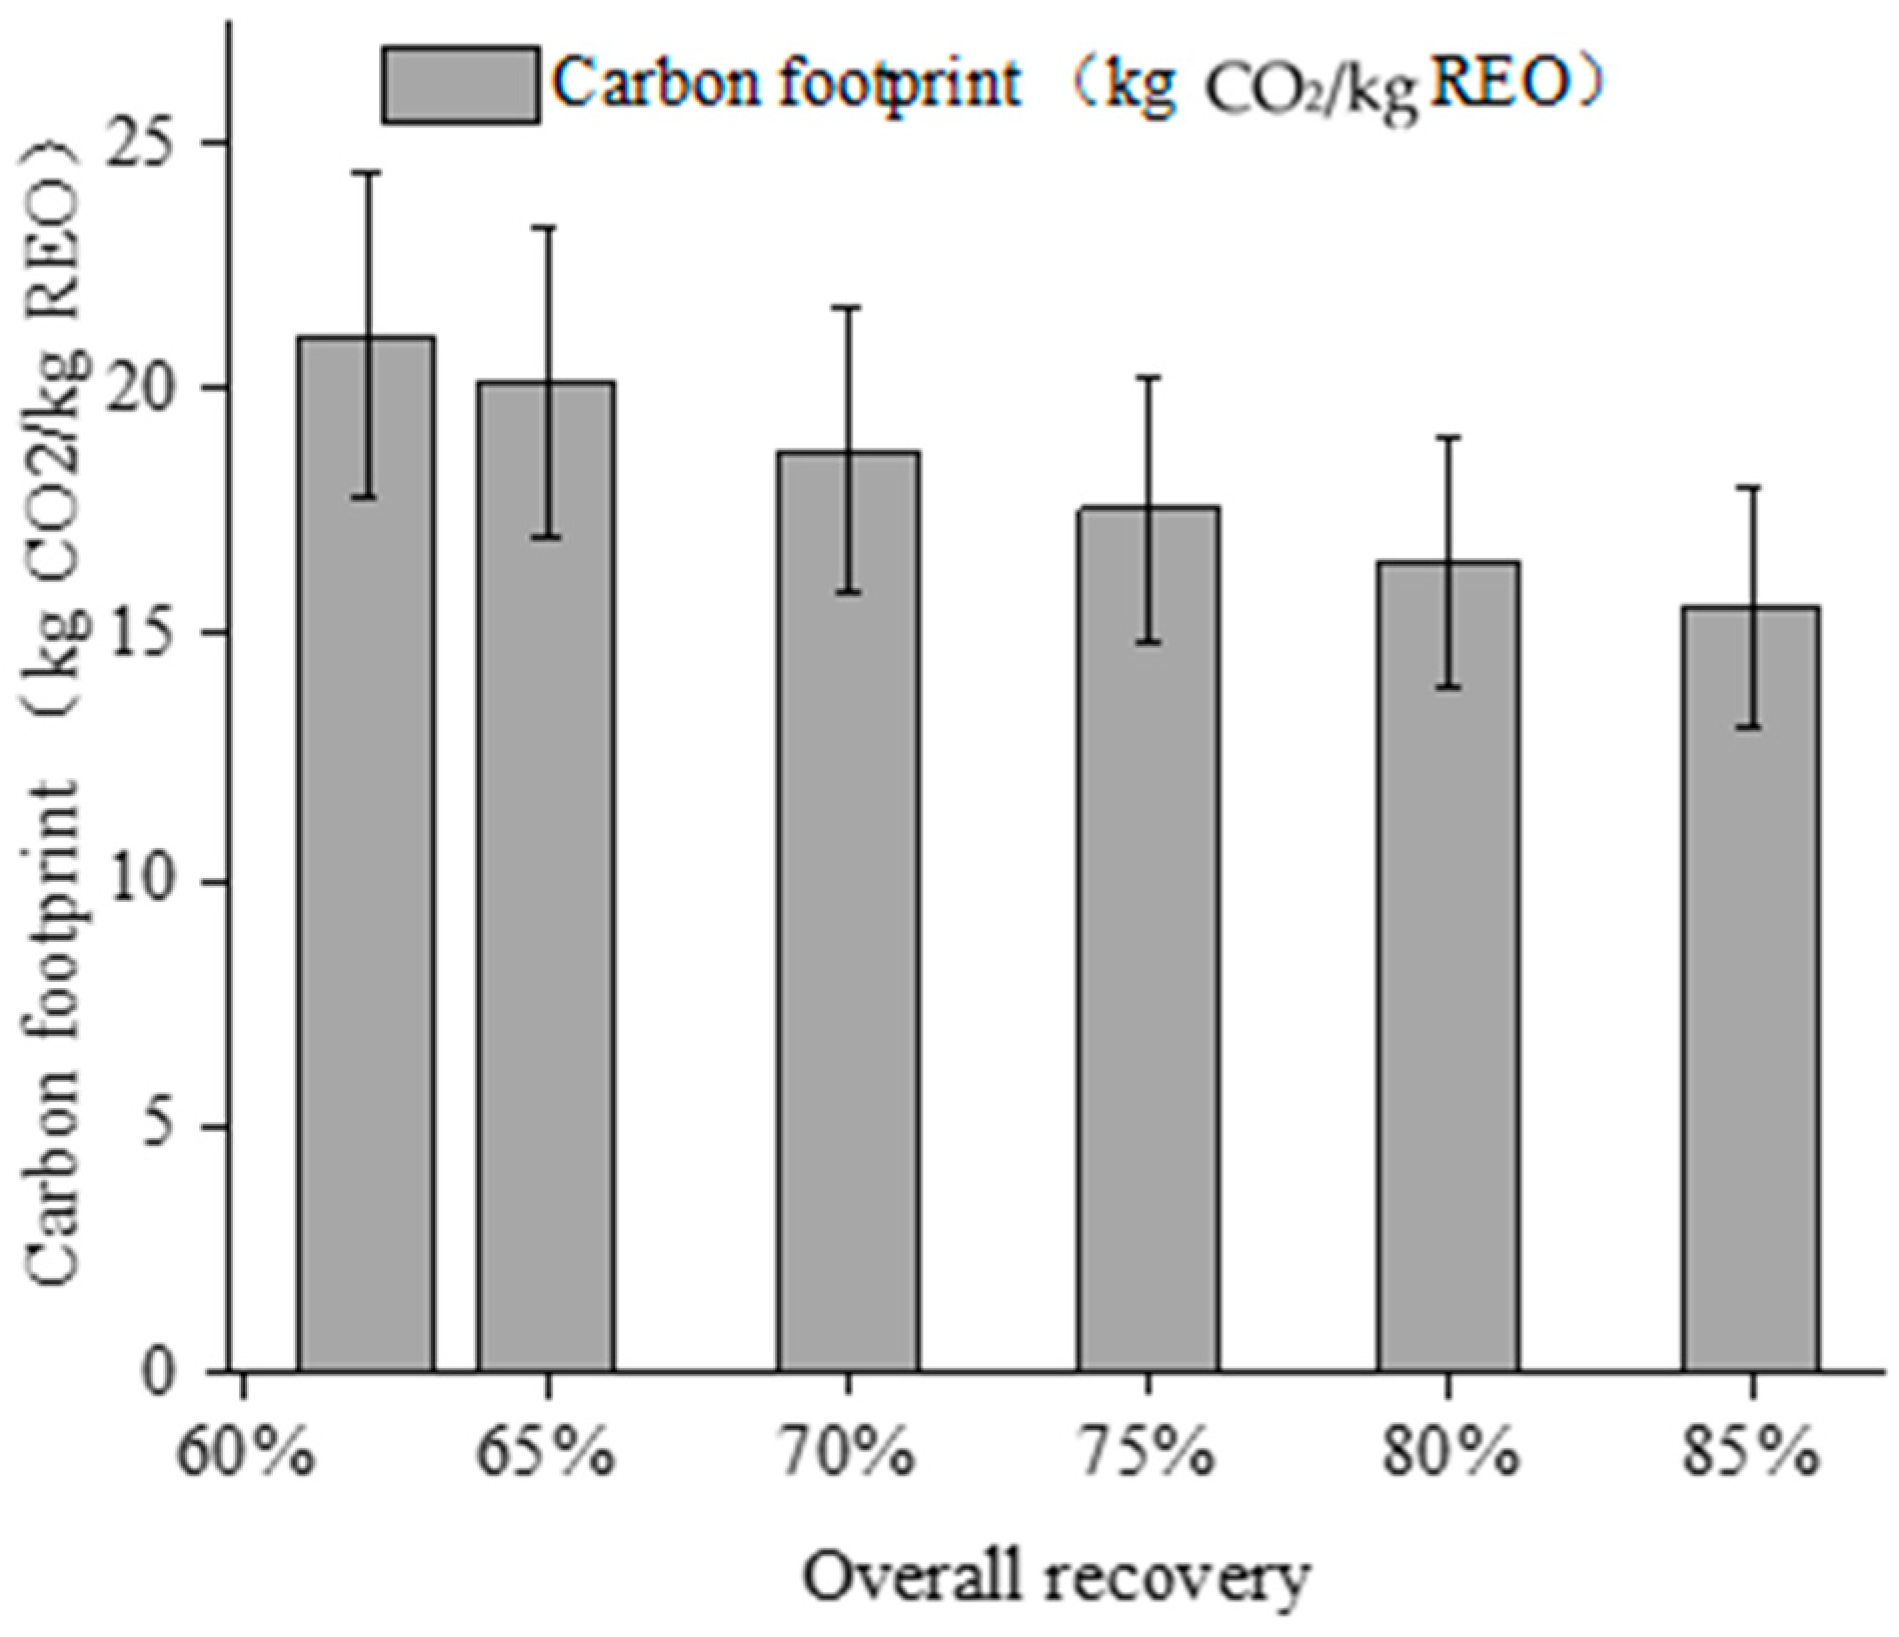
3.4. Effect of Product Recovery on the Carbon Footprint of Ionic Rare Earth Development

The efficiency of ionic rare earth development and utilization is a crucial factor affecting the yield of rare earth products. Improving the extraction and processing efficiency of rare earth elements can increase the yield of rare earth products while keeping the raw material input constant, thus reducing the carbon footprint of rare earth products. We conducted a scenario simulation based on the total rare earth recovery rate (leaching rate, mother liquor leaching recovery rate, and mother liquor treatment recovery rate), i.e., increasing the recovery rate from 62% to 85%. The evaluation results of the carbon footprint are shown in Figure 5. We found that when the total recovery rate increases from 62% to 85%, the carbon footprint decreases from 21.08 kg CO2 eq/kg REO to 15.56 kg CO2 eq/kg REO, for a reduction of 26.19%. The results show that the increase in the rare earth recovery rate has a significant positive benefit on reducing the carbon footprint of ionic rare earth development. However, as the recycling rate increases, the benefit of reducing the carbon footprint brought by the increase in the unit recovery rate shows a downward trend. When the recovery rate increases from 62% to 70%, the carbon footprint decreases by about 1.38% on average for each percentage point increase in the recovery rate; when the recovery rate increases from 80% to 85%, the carbon footprint decreases by about 1.12% on average for each percentage point increase in the recovery rate.

3.5. Impact of Technological Change on Carbon Footprint

Ammonium salt leach ore can cause serious ammonia nitrogen pollution problems [29]. With technological advances in rare earth development, this process is being improved to use magnesium salt leach ore instead of from ammonium salt leach ore. We compared the carbon footprint emission scenarios of magnesium salt leach ore with ammonium salt leach ore using technological process substitution for part of the inventory, while other conditions were not changed, and the results are shown in Table 5 and Figure 6. The results show that the rare earth enrichment process of magnesium salt leaching to produce the same content of oxide rare earths emits 41.42 kg CO2 eq/kg REO more than the process of ammonium salt leaching to produce carbonate rare earths. The carbon footprint of magnesium salt leaching is about 2.87–3.04 times higher than that of ammonium salt leaching.

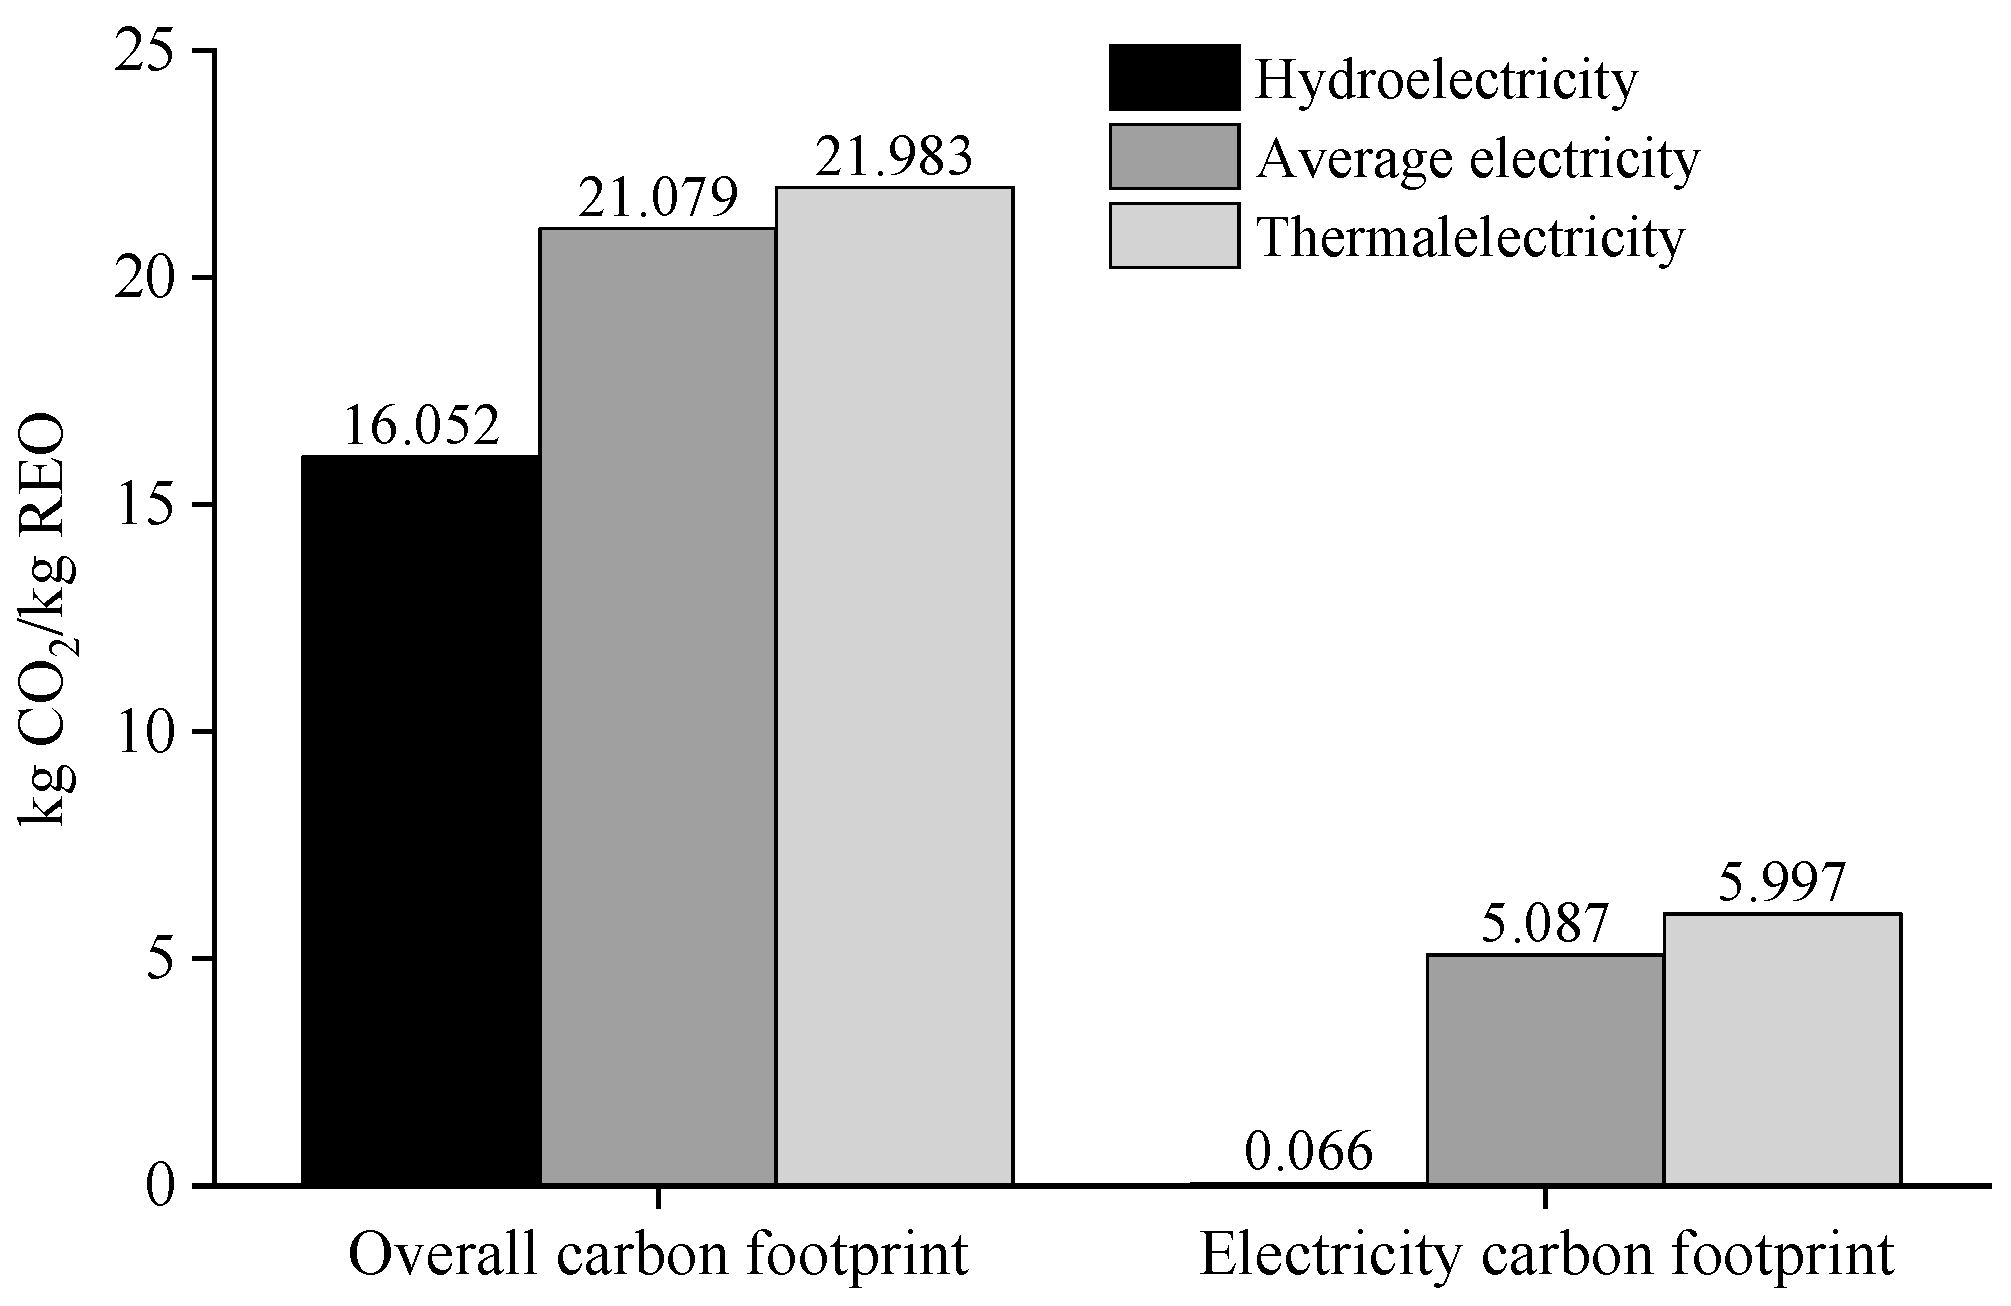
3.6. Impact of Clean Energy Use on Carbon Footprint

The accounting results show that electricity (national average) contributes 24.19% of the carbon footprint in the production of rare earth oxides based on ammonium leach ore. Figure 7 shows the results of electricity (national average) being replaced with hydroelectricity and southern thermal power. Compared to thermal and national average electricity, hydroelectricity can greatly reduce the carbon footprint of ionic rare earth development to produce oxidized rare earths by 5.931 and 5.021 kg CO2 eq/kg REO, respectively.

4. Conclusions

Based on the life cycle evaluation theory, the carbon footprint of developing ionic rare earth to produce 1 kg of mixed oxide rare earth products was calculated, and the main influencing stages and main factors were extracted for targeted emission reduction analysis. From the results of the whole process of carbon footprint assessment, the carbon footprint of the process of developing ionic rare earths to produce mixed oxide rare earths is high, and the main contribution comes from ammonium sulfate, ammonium bicarbonate, and electricity invested in the rare earth carbonate production process. From 2012 to 2017, the total carbon footprint reached 1.6 × 10⁸~2.19 × 10⁸ kg CO2 eq/year, and the carbon footprint decreased to 1.51 × 10⁸~2.07 × 10⁸ kg CO2 eq/year after 2018. Although the amount of illegal mining is much smaller than the amount of legal mining, the carbon footprints produced by the two are similar. The material transportation distance has less influence on the carbon footprint of the process of ionic rare earth development to produce mixed oxide rare earths. The higher the rare earth recovery rate, the lower the carbon footprint of producing 1 kg REO, but as the recovery rate increases, the benefit of reducing carbon brought by the increase in the unit recovery rate shows a downward trend. Magnesium salt leaching may result in an increase in carbon footprint while mitigating ammonia and nitrogen pollution in ionic rare earth mines; the use of clean energy has a greater impact on the carbon footprint contribution of developing ionic rare earths to produce mixed oxide rare earths. The use of clean energy, such as hydropower, with a lower carbon footprint can effectively reduce the carbon footprint of the ionic rare earth development process.

Author Contributions

Conceptualization, D.Z. and B.X.; methodology, C.W.; software, C.W.; formal analysis, C.W.; data curation, D.Z.; writing—original draft preparation, C.W.; writing—review and editing, B.X.; supervision, B.X.; project administration, D.Z.; funding acquisition, D.Z. and B.X. All authors have read and agreed to the published version of the manuscript.

Funding

This research was funded by the National Key R&D Program of China (2019YFC1805100); National Natural Science Foundation of China (51664024, 21767012, 41971166); Jiangxi Qianren Program (jxsq2018102126), and Beijing Social Science Foundation Key Project (17JDGLA035).

Institutional Review Board Statement

Not applicable.

Informed Consent Statement

Not applicable.

Data Availability Statement

The data presented in this study are available on request from the corresponding author.

Conflicts of Interest

The authors declare no conflict of interest.

References

  1. Alonso, E.; Sherman, A.M.; Wallington, T.J.; Everson, M.P.; Field, F.R.; Roth, R.; Kirchain, R.E. Evaluating rare earth element availability: A case with revolutionary demand from clean technologies. Environ. Sci. Technol. 2012, 46, 3406–3414. [Google Scholar] [CrossRef] [PubMed]
  2. Zhang, B.; Ning, Y.K.; Cao, F.; Zhang, Y. Current situation of worldwide rare earth resources. Multipurp. Util. Miner. Resour. 2018, 4, 7–12. [Google Scholar]
  3. USGS (U.S. Geological Survey). Mineral Commodity Summaries (1996–2021) [R/OL]. Available online: https://pubs.usgs.gov/periodicals/mcs2021/mcs2021-rare-earths.pdf (accessed on 20 April 2022).
  4. Zheng, G.D.; Wang, K.; Chen, Q.S.; Zhang, Y.F. The change of world rare earth industrial structure and the problems faced by China’s rare earth industry. Acta Geosci. Sin. 2021, 42, 265–272. [Google Scholar]
  5. Lee, J.C.K.; Wen, Z.G. Pathways for greening the supply of rare earth elements in China. Nat. Sustain. 2018, 1, 598–605. [Google Scholar] [CrossRef]
  6. Wang, Z. Research on the development of China’s rare earth resources and environment protection. J. Zhejiang Univ. Tech. Soc. Sci. 2015, 14, 13–17. [Google Scholar]
  7. Balaram, V. Rare earth elements: A review of applications, occurrence, exploration, analysis, recycling, and environmental impact. Geosci. Front. 2019, 10, 1285–1303. [Google Scholar] [CrossRef]
  8. Tian, S.; Li, K.; Møller, P.; Ying, S.C.; Wang, L.; Li, Z.; Roursgaard, M.; Liang, T. Assessment of reactive oxygen species production and genotoxicity of rare earth mining dust: Implications for public health and mining management. Sci. Total Environ. 2020, 740, 139759. [Google Scholar] [CrossRef]
  9. Ma, G.; Wang, X.; Yu, F.; Wu, Q. Evaluation of environmental costs of rare earth exploitation and analysis of their spatial difference characteristics in China. Res. Environ. Sci. 2017, 30, 817–824. [Google Scholar]
  10. Xu, F.; Li, H.; Wang, X. Progress in environmental problems and cost assessment of Ion-adsorption rare earth mining. Chin. Rare Earths 2020, 41, 119–127. [Google Scholar]
  11. Marx, J.; Schreiber, A.; Zapp, P.; Walachowicz, F. Comparative life cycle assessment of NdFeB permanent magnet production from different rare earth deposits. ACS Sustain. Chem. Eng. 2018, 6, 5858–5867. [Google Scholar] [CrossRef]
  12. Hu, A.H.; Kuo, C.H.; Huang, L.H.; Su, C.C. Carbon footprint assessment of recycling technologies for rare earth elements: A case study of recycling yttrium and europium from phosphor. Waste Manag. 2017, 60, 765–774. [Google Scholar] [CrossRef] [PubMed]
  13. Gai, S.; Li, C.; Yang, P.; Lin, J. Recent progress in rare earth micro/nanocrystals: Soft chemical synthesis, luminescent properties, and biomedical applications. Chem. Rev. 2014, 114, 2343–2389. [Google Scholar] [CrossRef] [PubMed]
  14. Li, Q.; Qin, L.; Wang, G.S.; Luo, S.H.; Long, P.; Peng, C. Status of research on ion adsorption type rare earth leaching mechanism. Chin. J. Rare Earths 2021, 39, 543–554. [Google Scholar]
  15. Lohmann, P.M.; Gsottbauser, E.; Doherty, A.; Kontoleon, A. Do carbon footprint labels promote climatarian diets? Evidence from a large-scale field experiment. J. Environ. Econ. Manag. 2022, 114, 102693. [Google Scholar] [CrossRef]
  16. Zhao, L.; Feng, J.; Dong, H. Analysis of carbon footprint and reduction approach of magnesia production in China. J. Clean. Prod. 2022, 334, 130194. [Google Scholar] [CrossRef]
  17. Bailey, G.; Joyce, P.J.; Schrijvers, D.; Schulze, R. Review and new life cycle assessment for rare earth production from bastnsite, ion adsorption clays and lateritic monazite. Resour. Conserv. Recycl. 2020, 155, 104675. [Google Scholar] [CrossRef]
  18. Vahidi, E.; Navarro, J.; Zhao, F. An initial life cycle assessment of rare earth oxides production from ion-adsorption clays. Resour. Conserv. Recycl. 2016, 113, 1–11. [Google Scholar] [CrossRef] [Green Version]
  19. Lee, J.; Wen, Z. Rare earths from mines to metals: Comparing environmental impacts from China’s main production pathways. J. Ind. Ecol. 2017, 21, 1277–1290. [Google Scholar] [CrossRef]
  20. Schulze, R.; Abbasalizadeh, A.; Bulach, W.; Schebek, L.; Buchert, M. An ex-ante LCA study of rare earth extraction from NdFeB magnet scrap using molten salt electrolysis. J. Sustain. Met. 2018, 4, 493–505. [Google Scholar] [CrossRef] [Green Version]
  21. Wiedmann, T.; Barrett, J. A Review of the ecological footprint indicator-perceptions and methods. Sustainability 2010, 2, 1645–1693. [Google Scholar] [CrossRef] [Green Version]
  22. Liang, Y.; Su, J.; Xi, B.; Yu, Y.; Ji, D.; Sun, Y.; Cui, C.; Zhu, J. Life cycle assessment of lithium-ion batteries for greenhouse gas emissions. Resour. Conserv. Recycl. 2016, 117, 285–293. [Google Scholar] [CrossRef]
  23. Vahidi, E.; Fu, Z. Environmental life cycle assessment on the separation of rare earth oxides through solvent extraction. J. Environ. Manag. 2017, 203, 255–263. [Google Scholar] [CrossRef] [PubMed]
  24. Pryshlakivsky, J.; Searcy, C. Life cycle assessment as a decision-making tool: Practitioner and managerial considerations. J. Clean. Prod. 2021, 309, 127344. [Google Scholar] [CrossRef]
  25. Pryshlakivsky, J.; Searcy, C. Fifteen years of ISO 14040: A review. J. Clean. Prod. 2013, 57, 115–123. [Google Scholar] [CrossRef]
  26. Guo, Z.; Jin, J.; Zhao, K. Current status of ion adsorption-based rare earth mining process and theory research. Rare Earths 2018, 39, 132–141. [Google Scholar]
  27. Li, C. Application of new in-situ leaching process in ionic rare earth ore. Nonferrous Met. Sci. Eng. 2011, 2, 63–67. [Google Scholar]
  28. Yi., L.; Zheng, M. Assessment of the effect of the total rare earth mining control policy in China. Nonferrous Met. Sci. Eng. 2021, 12, 120–126. [Google Scholar]
  29. Wang, G.; Xie, F.; Luo, S.; Peng, C.; Qin, L.; Hong, B.; Yao, K. Ionic rare earth leaching and ammonia-nitrogen residual pattern under empirical injection of in-situ leaching ore. Chin. J. Nonferrous Met. 2020, 30, 1454–1465. [Google Scholar]
Figure 1. System boundary.
Processes 10 01354 g001
Figure 2. Carbon footprint analysis of ionic rare earth development. (a) Carbon footprint contribution of in situ leaching. (b) Oxidative burning carbon footprint contribution.
Processes 10 01354 g002aProcesses 10 01354 g002b
Figure 3. Carbon footprint of ion-type rare earth development from 2012 to 2021.
Processes 10 01354 g003
Figure 4. Effect of material transport distance on carbon footprint of ionic rare earth development.
Processes 10 01354 g004
Figure 5. Effect of product recovery rate on carbon footprint of ionic rare earth development.
Processes 10 01354 g005
Figure 6. Impact of technological transformation on carbon footprint.
Processes 10 01354 g006
Figure 7. Impact of clean energy use on carbon footprint.
Processes 10 01354 g007
Table 1. Life cycle inventory data of ammonium leaching process.
List InventoryUnitQuantitySpecifications
InputsAmmonium sulfate (NH4)2 SO4kg6.00Technical pure
Ammonium bicarbonate NH4 HCO3kg4.00Technical pure
Sulfuric acid H2 SO4kg0.6098%
Waterm30.25River water
ElectricitykW·h5.00National average electricity
OutputsAmmonia nitrogenkg0.61/
Cdkg1.32 × 10−3/
Pdkg0.13/
Askg2.83 × 10−5/
Hgkg4.68 × 10−6/
NH4+kg0.61/
Table 2. Life cycle inventory data of the magnesium salt leaching process.
InventoryUnitQuantitySpecifications
InputsMagnesium sulfate heptahydrate MgSO4·7H2Okg1.60Technical pure
Magnesium oxide MgOkg1.08Technical pure
Sulfuric acid H2SO4kg0.6598%
Waterm31.73River water
ElectricitykW·h5.00National average electricity
OutputsSO42−kg0.91/
Table 3. Life cycle inventory data for the oxidation scorching process.
InventoryUnitQuantitySpecifications
InputsTap waterm36.13 × 10−4/
ElectricitykW h4.12 × 10−1/
Natural gasNm32.59 × 10−198%
OutputsWater vaporkg3.84/
Carbon dioxide CO2kg2.20 × 10−1/
Ammonia NH4kg1.27 × 10−3/
Particulate matterkg3.52 × 10−4/
Dustkg4.16 × 10−5/
Table 4. Carbon footprint results and uncertainties.
Name of IndicatorAbbreviation (Unit)LCA ResultUncertaintyUpper and Lower Limits (95% Confidence Interval)
Global Warming PotentialGWP (kg CO2 eq)21.0815.54%[17.8~24.3]
Table 5. Carbon footprint results and uncertainties of magnesium salt leaching ore.
Name of IndicatorAbbreviation (Unit)LCA ResultUncertaintyUpper and Lower Limits (95% Confidence Interval)
Global Warming PotentialGWP (kg CO2 eq)62.518.17%[51.1~73.8]
Publisher’s Note: MDPI stays neutral with regard to jurisdictional claims in published maps and institutional affiliations.

