Article

Use of Typical Wastes as Biochars in Removing Diethyl Phthalate (Det) from Water

1
Aulin College, Northeast Forestry University, Harbin 150040, China
2
CATS Environmental Technology (Beijing) Co., Ltd., Beijing 100071, China
3
College of Life Science, Northeast Forestry University, Harbin 150040, China
4
Anji Guoqian Environmental Technology Co., Ltd., Huzhou 313300, China
*
Author to whom correspondence should be addressed.
Processes 2022, 10(7), 1369; https://doi.org/10.3390/pr10071369
Submission received: 13 April 2022 / Revised: 21 June 2022 / Accepted: 21 June 2022 / Published: 13 July 2022

Abstract

:
Diethyl phthalate (DEP), one of the six typical PAEs priority pollutants declared by the US EPA, has attracted tremendous attention due to its widespread pollution and was selected as the adsorbate in this study. Properties of biochar samples obtained from three different feedstocks, i.e., sawdust (SDBC), rice straw (RSBC), and giant reed (GRBC), pyrolyzed at 400 °C as well as their ability to adsorb DEP from an aqueous solution were investigated. The results showed that the adsorption kinetics were well fitted with the pseudo-second-order model (R2 > 0.99) and the intraparticle diffusion model (R2 > 0.98). The maximal adsorption capacity of the DEP by the prepared biochar was in an order of GRBC (46.04 mg g−1) > RSBC (31.54 mg g−1) > and SDBC (18.39 mg g−1). The higher adsorption capacity of DEP by GRBC is mainly attributed to the higher surface area. The reduction in adsorption capacity of the biochar against DEP with an increase in the solution pH (from 2.5 to 10.0) was possibly due to promoting the electrostatic repulsion between the DEP and the surface of the biochar. However, the increasing sodium ionic strength promoted the adsorption of the biochar, which could be interpreted by the reduced solubility of the DEP due to enhancing “salting out” effects as increasing sodium concentration. In addition, it was favorable for the adsorption of DEP onto the biochars at a lower temperature (15 °C) and the calculated ∆G0 was less than zero, indicating that the adsorption was a spontaneous and exothermic process. These experiments designate that these derived biochars can be used as an inexpensive adsorbent for the purification of PAEs contaminated water.

1. Introduction

Phthalates are man-made chemicals that are commonly used in personal care products, such as cosmetics, lotions and perfumes, indoor housing goods including flooring made of polyvinyl chloride (PVC), shower curtains, consumer materials (toys, electronics, food packaging, food containers), and medical equipment. There are two types of phthalates, i.e., (i) high-molecular-weight phthalates (2-methylphenyl) phthalate (DEHP) and butyl benzyl phthalate (BBzP) which are mainly used in PVC flooring, food packaging, and food containers, (ii) low-molecular-weight phthalates including diethyl phthalate (DEP) and dibutyl phthalate (DBP) are mostly used in personal care product [1]. As a result of extensive utilization of goods and materials having phthalates, biomarkers of exposure to these chemicals, namely, phthalate metabolites in urine, are broadly spotted in the general population [2,3].
Phthalate esters (PAEs) were widely used as plasticizers to increase the flexibility, durability, and longevity of polymer materials [4]. However, PAEs could not connect with these polymers through chemical interactions; thus, they were intended to release into the atmosphere, freshwater, sediments, soils, and landfills secondly [5]. Ultimately, most of PAEs migrated and transformed in water through direct discarded, rain wash, or run-off [6,7]. PAEs could interfere (with) the normal hormone-regulated processes of the animals, it is proven that they have potentially carcinogenic and mutagenic effects on human beings [8,9].
The current treatment methods for DEP include abiotic membrane filtration, photodegradation [10], advanced oxidation [11], biodegradation [12], and adsorption [13]. Among these approaches, biodegradation and adsorption are considered to be the most effective ways, but the former is limited by bacteria cultures, oxygen content, and a pretty long period [14,15]. As an operability without a highly efficient, environmentally friendly, and low-cost technology, adsorption has been widely used to adsorb PAEs in recent decades [16,17]. The adsorbents used in PAEs adsorption included many carbon-based adsorbents such as activated carbons [18], carbon nanotubes [19], biochar [20], and graphene oxide [21].
Contamination of soil and water has become extremely complicated. For example, water by organic contaminants including phthalate esters has recently become a critical issue [22]. As a result, there is an urgent need for remediation of contaminated water using environmentally safe and low-cost sorbents such as biochar. Biochar is produced by thermochemical conversion of organic substances in oxygen-limited environment. Biochar has rich and stable carbon content and can be used alone as an additive. It has a significant effect on improving the soil environment and improving fertilizer utilization. As a promising remediation amendment, biochar is a solid, carbon-rich material, produced from biomass through thermal decomposition in a closed system with little or no oxygen [23]. There are studies about the adsorption of PAEs by biochars in recent years. Sun et al. [24] prepared a series of chars using grass and wood as feedstock materials, with different treatment temperatures (200 to 700 °C), to check the PAEs adsorption performance. The sorption capacity of amorphous biochar (HTT = 400 °C) was maximum, mainly because of hydrophobic partitioning and specific H-bonding jointly. Their findings showed that feedstocks influence PAE sorption intensity and mechanism. Abdul et al. [25] explored the DMP, DEP, and dibutyl phthalate (DBP) adsorption behaviors and performances by biochar and biochar–graphene (BG) nanosheet composites and concluded that the BG composites had a higher adsorption capacity comparatively to biochar dominated by the π–π EDA donor–acceptor interaction and pore-diffusion mechanisms. In addition, the effects of environmental reaction conditions on adsorption behavior by different ingredients biochar with significant differences in physicochemical properties remain unclear. Biochar properties are affected by several technological parameters, mainly pyrolysis temperature and feedstock kind, which differentiation can lead to products with a wide range of values of pH, specific surface area, pore volume, CEC, volatile matter, ash, and carbon content. High pyrolysis temperature promotes the production of biochar with a strongly developed specific surface area, high porosity, pH as well as the content of ash and carbon, but with low values of CEC and content of volatile matter. This is most likely due to a significant degree of organic matter decomposition. Biochars produced from animal litter and solid waste feedstocks exhibit lower surface areas, carbon content, volatile matter, and high CEC compared to biochars produced from crop residue and wood biomass, even at higher pyrolysis temperatures. The reason for this difference is considerable variation in lignin and cellulose content as well as in moisture content of biomass. The physicochemical properties of biochar determine the application of this biomaterial as an additive to improve soil quality [26]. Favorable properties of biochar include its high surface area and porosity, and ability to adsorb a variety of compounds, including nutrients, organic contaminants, and some gases. Physical and chemical properties of biochars are dictated by the feedstock and production processes (pyrolysis or gasification temperature, conversion technology, and pre- and post-treatment processes, if any), which vary widely across commercially produced biochars [27]. Several commercially available biochars derived from waste wood are characterized for physical and chemical properties that can signify their relevant environmental applications. Parameters characterized include: physical properties (particle size distribution, specific gravity, density, porosity, surface area), hydraulic properties (hydraulic conductivity and water holding capacity), and chemical and electrochemical properties (organic matter and organic carbon contents, pH, oxidation–reduction potential and electrical conductivity, zeta potential, carbon, nitrogen and hydrogen (CHN) elemental composition, polycyclic aromatic hydrocarbons (PAHs), heavy metals, and leachable PAHs and heavy metals) [28]. A wide range of fixed carbon (0–47.8%), volatile matter (28–74.1%), and ash contents (1.5–65.7%) were observed among tested biochars. A high variability in surface area (0.1–155.1 g/m2) and PAH and heavy metal contents of the solid phase among commercially available biochars was also observed (0.7–83 mg kg−1), underscoring the importance of pre-screening biochars prior to application [29].
In the present study, we have combined the experiments to investigate the adsorption behavior and mechanism of PAEs on biochars. We choose three biochars derived from different feedstock materials as adsorbents and select DEP as a model adsorbate of PAEs. Adsorption experiments and adsorption influence factors were employed to analyze the adsorption behavior and to predict the adsorption mechanisms [30,31]. Therefore, the specific aims are: (1) to elucidate the DEP adsorption capacities on biochars derived from different biomass feedstocks; (2) to investigate the influence of pH, ionic strength, and temperature in the reaction system on the DEP sorption capacity; (3) to explore how the composition of biochars determines the characteristic and further affects the adsorption effect of DEP; and (4) to figure out the underlying adsorption mechanisms [32]. This work can help to understand the relationship between the physicochemical properties of biochars and the mechanisms of DEP sorption onto biochars, thereby presenting the necessary data for screening the biochar adsorbents for effective DEP removal [33,34].
There are two main innovations in the research. Firstly, the adsorption properties of various biochar on DEP in solution are analyzed, and the adsorption effects of biochar on dep under different conditions are discussed. At the same time, the biochar is compared with activated carbon and graphene. Secondly, a continuous adsorption column experiment and desorption experiment were used to simulate the adsorption of DEP by the adsorbent, so as to understand the adaptability and stability of biochar.

2. Materials and Methods

2.1. Materials Collection and Processing

Guarantee grade reagents DEP was purchased from Sigma-Aldrich Co. DEP >99.9%. For comparison, coal-based activated carbon (CBAC), coconut shell-based activated carbon (CSAC), and graphene nanosheets (GR) were selected as reference materials. In this study, three kinds of biomass waste namely sawdust, giant reed, and rice straw were chosen and collected locally. The collected feedstock materials were dried, milled, and sieved to achieve a homogenized particle size fraction in the 50–100 mesh range. Nearly 1 g of biomass sample was taken onto an aluminum tray, and the sample was heated to constant weight at 105°C under a halogen lamp. The dried sample was used for further research.

2.2. Biomass Pyrolysis and Experimental Process

Slow pyrolysis was carried out at 400 °C by placing 30 g of biomass content in a hyper-quality quartz boat within the reactor tube’s core for a residence time of 2 h. During pyrolysis experiments, N2 gas was flowed as a purge gas into the tubular reactor to purge the residual air, and its flow rate was fixed at 500 mL min−1 by using a mass flow controller. Ceramic tube blocks were positioned on both ends of the sample quartz boat to avoid energy loss from the tube chamber. The temperature was raised at a rate of 10 °C/min by an automated PID controller. The sample was held for 60 min after reaching the selected highest heating temperature (400 °C). The biochar sample was cooled to room temperature before being removed from the furnace chamber. The prepared biochar was labeled as SDBC (sawdust biochar), GRBC (giant reed biochar), and RSBC (rice straw biochar), respectively. Before further study, all the samples were milled to move through a 60-mesh sieve.

2.3. Physico-Chemical Characterization

The mass balance technique was used to determine the biochar yield (recovery rate). The CHN elemental analyzer (MicroCube, Elementar, Germany) was used to assess the elemental composition (C, H, N, O, S) of biochar. A 1:10 (w/v) ratio of KCl solution (1.0 mol/L) was used to assess the pH values of all samples. Proximate tests of feedstock materials were conducted according to ASTM International using a muffle furnace. The most relevant modified ASTM D1762-84 approach to biochar was applied for proximate analysis of biochar. Using the following Equation (1), FC content was measured by difference.
Fixed   carbon ( % ) = 100 ( MC + Ash + VM )
The zeta potentials of the biochars at various pH values were measured using a Zetasizer 3000 HSA system. The elemental results obtained were used to measure the atomic H/C, O/C, and (O + N)/C ratios, which are representative of aromaticity, bonding mechanism carbonization strength, and polarity [35]. The characterization details (yield, Ash, FC, VM, pH, SABET, and detailed description of elemental composition) of biochar samples are given in Table 1.

2.4. Surface Area and Porosity

The surface area was calculated using a Brunauer–Emmett–Teller model based on the N2 adsorption isotherm. All the samples were degassed at 250 °C for four hours under vacuum before analysis. The surface area was calculated using the Brunauer, Emmett, and Teller (BET) approach from adsorption data with relative pressures (P/Po) ranging from 0.02 to 0.22. Total pore volume (Vtot) and average pore diameter (Davg) were determined at P/Po = 0.99. Vmico and Vmeso are the micropore and mesopore volume, and Dmicro is the average micropore diameter, which were analyzed by the NLDFT method.

2.5. Morphology and Functional Groups Analysis

The morphologies and microstructures of all derived biochar samples were investigated by using scanning electron microscopy (SEM, S4800, Hitachi, Tokyo, Japan), coupled with electron dispersive X-ray analysis (EDX, Hitachi, Japan). A Fourier transformed infrared spectrometer (FT-IR, Spectrum One, PerkinElmer, Waltham, MA, USA) with a resolution of 4 cm−1 was used to validate the functional groups on the surface of derived biochars before and after adsorption.

2.6. Adsorption and Desorption Experiments

The sorption kinetics and DEP isotherms by derived biochars were determined using a batch equilibration technique. Adsorption tests for biochars and GR were carried out in 20 mL glass vials, while 60 mL glass vials with Teflon-lined screw caps were used for activated carbon (AC). The kinetic adsorption experiment was carried out from 24 to 360 h at room temperature (298 K) with an initial DEP concentration (C0) of 20 mg L−1. Adsorption isotherms were performed with DEP initial concentrations ranging from 100 to 1000 mg L−1. Defined quantities of sorbents were applied to DEP solutions in 20 mL (biochars and graphene) or 60 mL vials (ACs) to achieve 20–80% uptake of the initially applied sorbate at equilibrium. The vials were shaken for 5 days at room temperature without adjusting the initial solution pH values (6.8–7.0) and ionic strength. The vials were shaken in the dark at 140 rpm until they reached equilibrium. During this process, samples were taken out at interval times to find out the DEP concentration in the solution for adsorption kinetics analysis. For investigating the effect of pH on DEP adsorption, it was carried out by adjusting the initial solution pH value at a range of 2.5–10. For the effect of ionic strength on DEP adsorption, the initial solution of NaCl concentration was previously set at a range of 0.001–0.2 M. Blank experiments were conducted following the adsorption experiment procedure except that no sorbents were added. DEP losses due to photodegradation adsorption to the vials were found to be less than 3% of the DEP dosed.
For desorption kinetics, DEP-loaded sorbents were firstly prepared by mixing sorbents and DEP solution with the same solid-to-solution ratios in adsorption kinetics. After loading with DEP, the derived DEP-coated sorbents were filtered and freeze-dried. Similar to adsorption kinetics, fixed amounts of DEP-loaded sorbents were added into either 20 mL (biochars and graphene) or 60 mL vials (ACs), and the vials were shaken in the dark at 140 rpm for 10 d. During this process, the DEP concentration in the solution was determined at interval times. Desorption kinetics was also conducted on the basis of batch experiments.
The adsorption experiment was used to investigate the potential application ability of biochar to DEP, and the desorption experiment was used to analyze the desorption kinetics. The desorption kinetics of DEP on biochar adsorbent is shown in Formula (2).
S t S 0 = F f a s t e k f a s t t + F s l o w e k s l o w t
where S 0 represents the dep concentration attached to the adsorbent before desorption; S t represents the dep concentration attached to the adsorbent after t time desorption; F f a s t . F s l o w represents the distribution ratio of fast and slow desorption, and the sum of the two is 1; k f a s t . k s l o w is the reaction rate constant.

2.7. Analysis of DEP

To avoid any cosolvent influence, the volume proportion of methanol for each vial’s ultimate solution was held below 0.1 percent (v/v). The concentration of DEP was measured by HPLC (1260 Series, Agilent Technologies, Japan) equipped with a reversed-phase C18 analytical column (4.6 mm × 250 mm, 5 um) and a UV detector. The detection wavelength for DEP was set at 228 nm after determining its maximum adsorption. The mobile phase solvent profile was 8:2 (v:v) of methanol and ultrapure water at a constant flow rate of 1 mL min−1. The temperature of the column was kept at 40 °C, whereas the injection volume was 20 μL and the retention time of DEP was 3.9 min.

2.8. Statistical Analysis

The adsorption amount (Qt) was calculated according to:
Q t = C 0 C t V m
where Qt represents DEP adsorption quantity at time t (mg g−1), m denotes biochar mass (g), V is the solution volume (L), and C0 and Ct are the initial concentration and concentration at time t, respectively, of DEP in solution.
The adsorption isotherms of DEP sorption onto biochars were described using Langmuir (Equation (4)) and Freundlich (Equation (5)) models:
Q e = Q m K L C e 1 + K L C e  
Q e = K F C e N    
where Ce is the equilibrium aqueous concentration of DEP (mg L−1), Qe is the equilibrium adsorbed concentration of DEP (mg g−1). The parameters KL (L mg−1) and KF (mg g−1) (mg L−1)−N are the adsorption coefficients of Langmuir and Freundlich, respectively. Qm (mg g−1) is the maximum adsorption capacity of DEP. The N is often used as an indicator of isotherm nonlinearity.
The kinetics of DEP sorption onto biochars and desorption from biochars was fitted using pseudo-first-order kinetic equation (Equation (6)), pseudo-second-order kinetic model (Equation (7)), intra-particle diffusion model (Equation (8)), and two-compartment first-order kinetic model (Equation (9)), which are presented as follows:
Q t = Q e ( 1 e k 1 · t )  
Q t = k 2 · Q e 2 · t 1 + k 2 · Q e · t
Q t = k 3 · t 0 . 5 + b
Q d Q e = f fast 1 e k fast · t + f slow 1 e k slow · t
where k1 (h−1) is the pseudo-first-order rate constant, k2 (g mg−1 h−1) is the rate constant of the pseudo-second-order adsorption, k3 (mg g−1 h−0.5) is the intraparticle diffusion rate constant, and b is a constant. ffast and fslow are the distribution ratios of fast desorption and slow desorption, respectively, and ffast + fslow = 1, kfast (h−1) and kslow (h−1) are the rate constants of the fast and slow desorption process. Qd is the desorption amount of DEP at t time and Qe (mg g−1) is the equilibrium adsorption concentration of DEP. The thermodynamic process of DEP sorption on biochars was described using the equations below [36,37].
G 0 = R T   ln   K
ln 1 C e =   ln   K + H R T
G 0 = H 0 T S 0
where K is the thermodynamic equilibrium constant without units and estimated to be KL approximately, R (8.314 J·mol−1·K−1) is the gas constant, and T (K) is the absolute temperature. ∆G0 is the Gibbs energy change, ∆H0 is the enthalpy change, and ∆S0 is the entropy change. ∆H0 can be calculated from the respective slope of the plot of ln 1/Ce against 1/T theoretically yields straight lines.
The contribution ratios of adsorption and partitioning of DEP sorption on biochars were calculated using the dual model:
Q t = Q ad + Q p = Q am · K a · C e 1 + K a · C e + K p · C e
where Ce (mg L−1) is the equilibrium aqueous concentration of DEP. Qad (mg g−1) and Qp (mg g1) are the adsorptions and partition portions, respectively, Qam (mg g−1) is the equilibrium adsorption capacity of DEP, Ka (L mg−1) and Kp (L mg−1) are the absorbed coefficient and the partitioning coefficient, respectively.

3. Results and Discussion

3.1. Characteristics of Feedstocks

Biomass is a complex biological fuel that is developed from organic or non-organic materials, a renewable and sustainable source of energy [38]. Woody and non-woody biomass are the two types of biomass. Woody biomass is mainly made up of forestry and tree residues. Low moisture, low ash, high calorific value, high bulk density, etc., are all features of woody biomass. On the other hand, for non-woody biomass (agricultural crops and residues, livestock waste, municipal, and industrial solid waste), vice versa phenomena are found [39]. The physicochemical properties of biomass have a major impact on the quality of derived biochar. The moisture, ash, VM, and FC contents of the feedstock SD were 2.41, 0.7, 94.88, and 2.01%; for feedstock GR were 7.5, 4.87, 68.12, and 19.51%, and for feedstock RS were 6.43, 14.23, and 73.22, respectively. All the feedstock materials contain lower content of carbon (<50 wt%) than their corresponding biochars derived at 400 °C.

3.2. Characteristics of Biochars

3.2.1. Mass Yield, Proximate and Elemental Composition

In this study, the biomasses used were significantly different from each other. Table 1 lists results from the basic analysis and physicochemical characteristics of feedstock and its biochars produced at 400 °C. The yield of biochar ranged from 44.26% (SDBC) to 33.37% (corn straw). The trends in mass yield were slightly different depending on the kind of feedstock; although, the treatment temperature during pyrolysis was the same. The loss in mass yield of agricultural feedstocks is usually greater than that of woody biomass because of their higher hemicellulose level [40].
The proximate analysis results indicate that the VM of all derived biochars declined, and FC boosted up differently based on feedstock type and especially the ash content of biomass. As predicted, the removal of VM and inorganics accumulation in biomasses resulted in increased ash content in all derived biochars as the temperature reached 400 °C. The processing of biochars with various physicochemical properties is facilitated by a wide range of moisture and ash content in biomass.
The biochars varied widely in their elemental composition largely because of the differences in the feedstock. The C and H content in the derived biochar would greatly affect its pyrolysis activity. After pyrolysis, the C and H contents in all derived biochars were found to increase. The C content ranged from 51.70% (for RS) to 77.01% (for GR), indicating that different biomass materials have different degrees of carbonization at the same treatment temperature. Almost all derived biochars had a lower range of N and S material, which was largely determined by the feedstock and pyrolysis temperature. This phenomenon of N loss by the obtained biochars may be attributed to volatilization and is consistent with previous findings. The worthiness of a biochar can be assessed by measuring aromaticity, carbonization degree, and maturation level, conducted by calculating molar ratios of H/C and O/C [41]. The aromaticity (H/C) and bulk polarity (O=N/C) for all derived biochars decreased as compared to their corresponding feedstock material. As per the European Biochar Certificate (EBC), biochars are described as pyrolyzed materials that contain >50 percent total carbon, <0.7 H/C, and <0.4 O/C [42]. Therefore, based on EBC guidelines, all pyrolyzed biomasses derived were biochars.

3.2.2. Surface Morphology

Scanning electron microscope (SEM) micrographs were used to examine the visual biochar display. The porous structure of produced biochar is demonstrated by the surface morphology. More pores on the surfaces were clearly witnessed in all derived biochars. As the volatiles were released during pyrolysis, the solid matrix of biomass components (hemicellulose, cellulose, lignin, and extractives) became softened, resulting in the development of swollen structures and bubbles [43]. The surface of the rod-shaped biochars was relatively flat and abundant in the micro-porous structure, and the surface of the husk biochar was rough. Volatiles obstruct some pores, and the ash content may minimize pore volume.

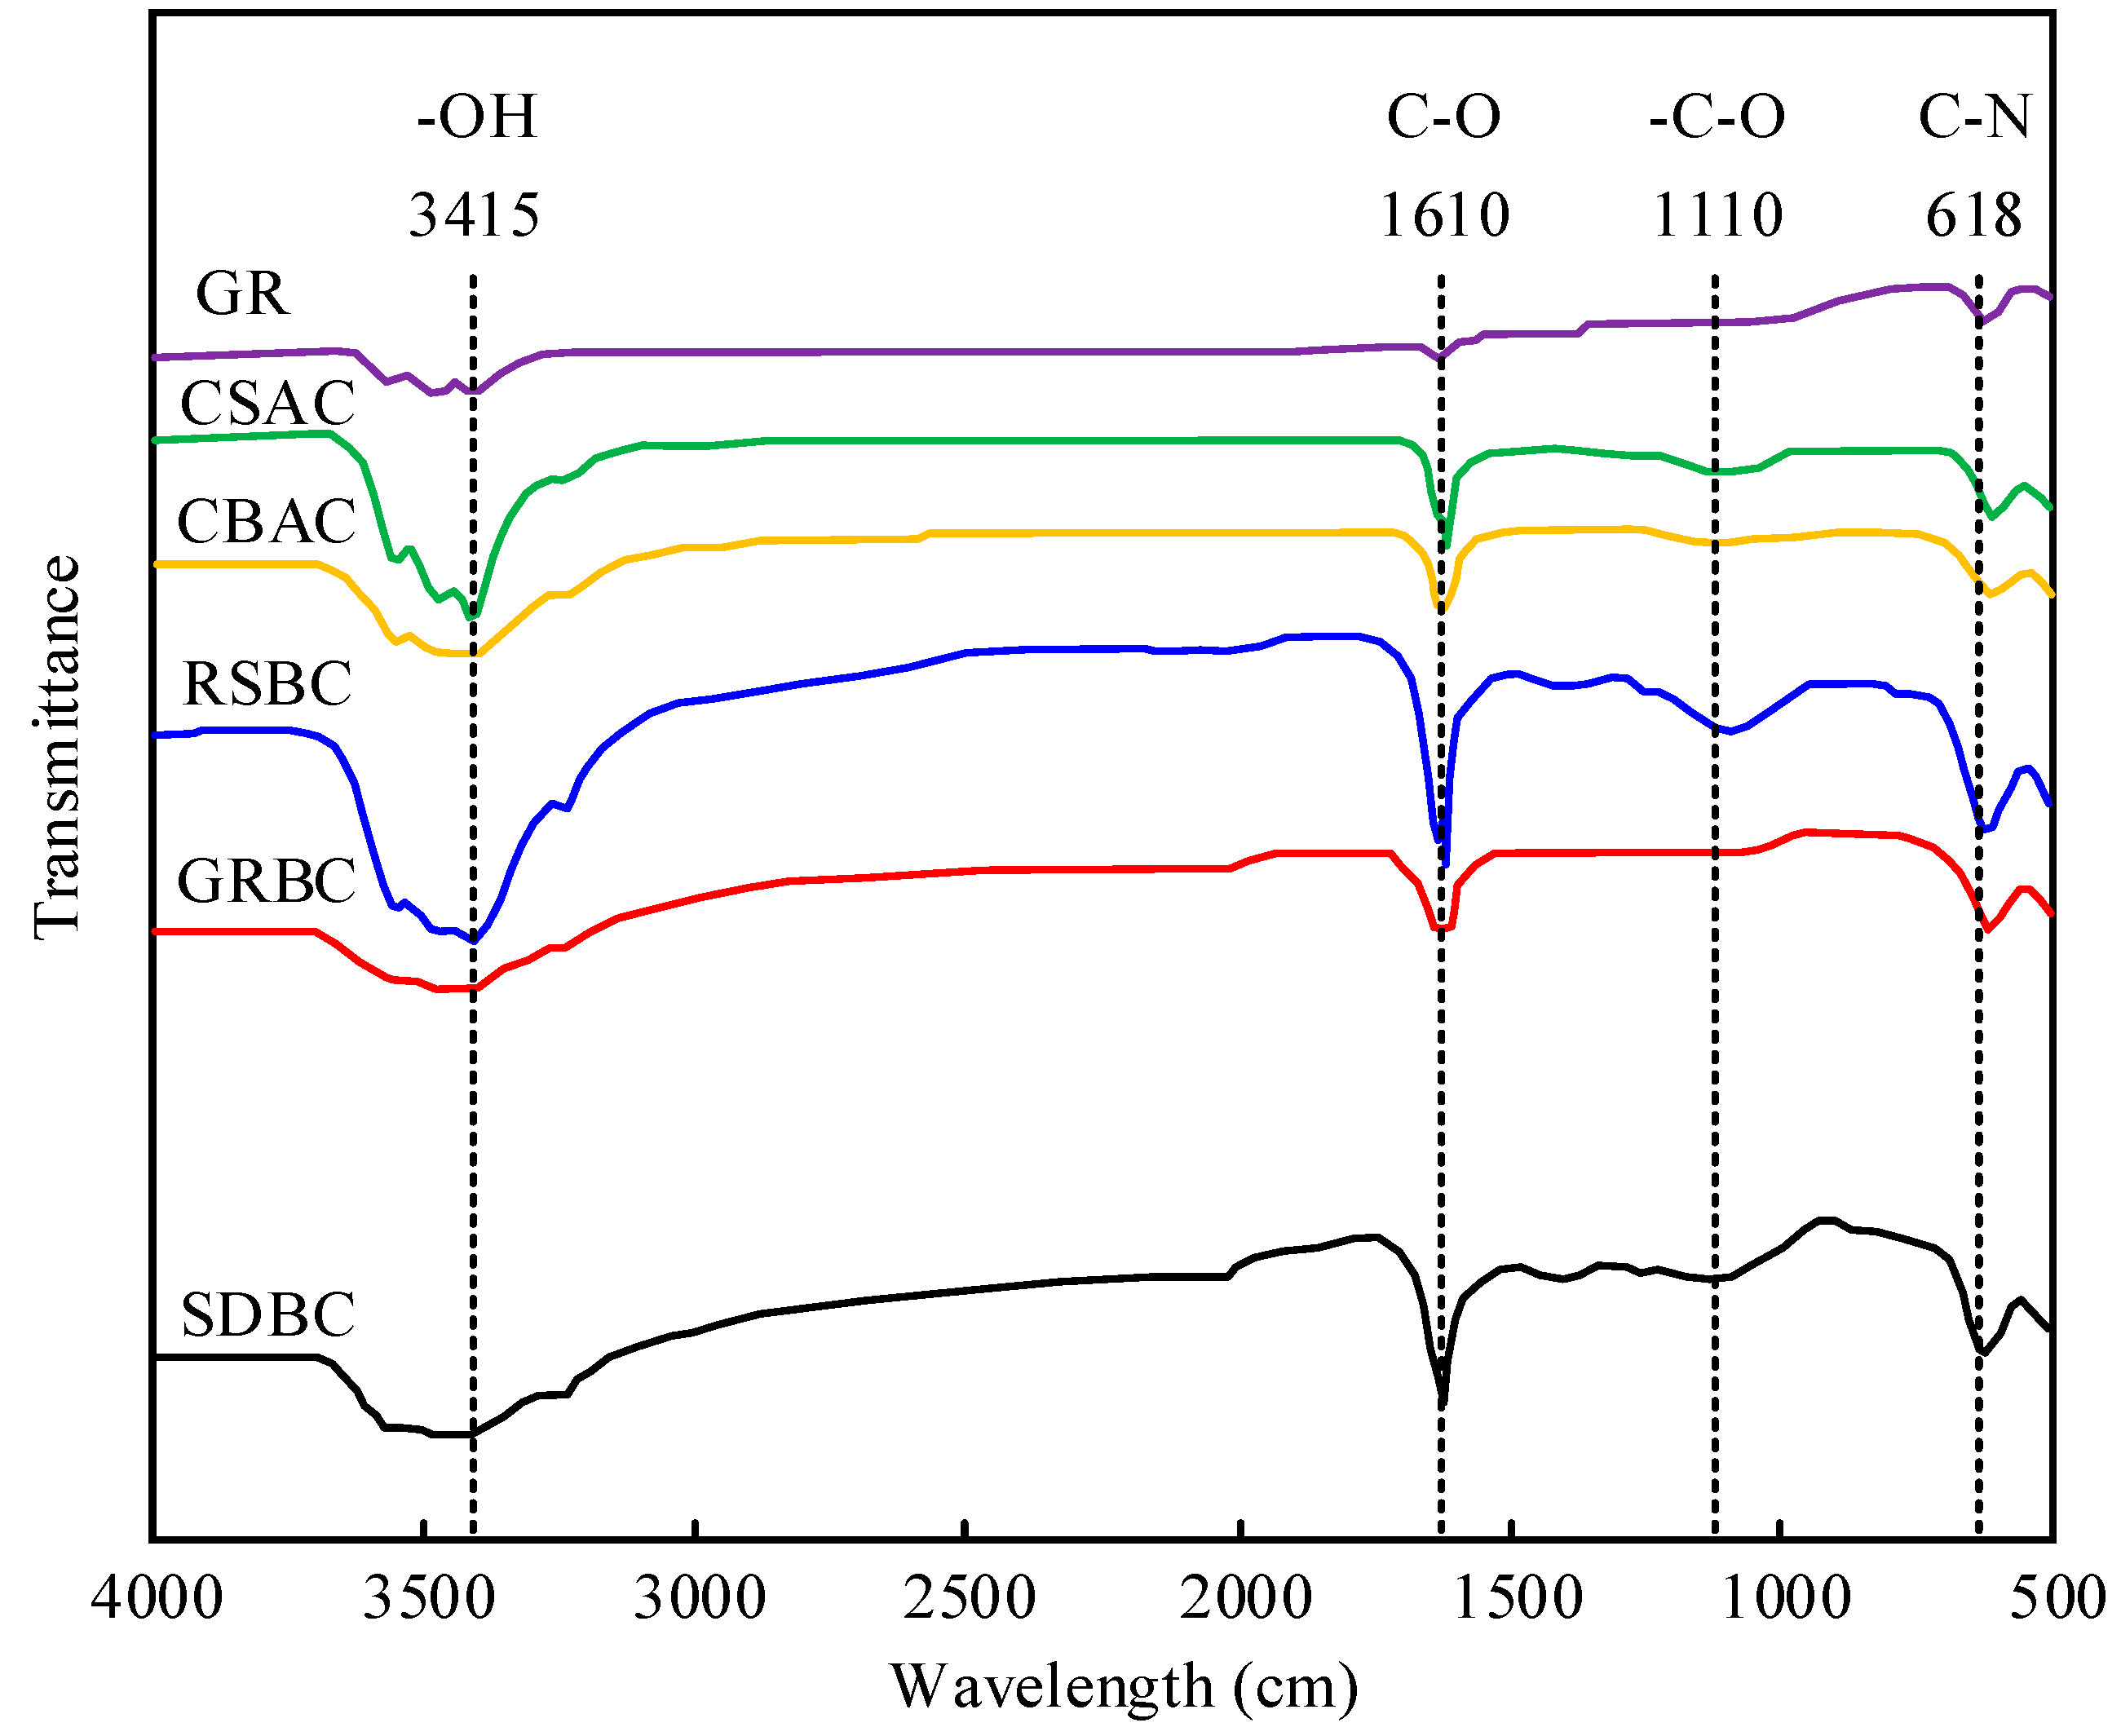
3.2.3. Change in Surface Functional Groups (FTIR Spectroscopy)

FTIR spectra were used to examine the qualitative and quantitative proportions of surface functional groups. Figure 1 indicates the FTIR spectra of all derived biochar samples treated at the same temperature. The typical spectrum of FTIR for biochar materials affirms various absorbance bands and variations in the distribution of several functional groups. Several bands around 3400 may be assigned to the aliphatic O–H stretching, from 1610 to 1640 cm−1 for carboxyl O–C=O stretching, from 1080 to 1110 cm−1 for alkoxy C–O stretching, at 1644 cm−1, 1420 cm−1 and 618 cm−1 for benzene ring C=C, –CH2, and C–N stretching were observed. The peak intensities at 1610 were progressively enhanced with increasing aromaticity, indicating an augment of C=O bonds following the decomposition and dehydration process. Moreover, studies showed that when the pyrolysis temperature was lower than 500 °C, the aromatic C=O bond was greatly retained [44].

3.2.4. pH, Electric Conductivity, Surface Area, Porosity

The amount and structure of inorganic mineral components determine the chemical features (pH, EC) of biochar. The pH and EC of all derived biochars were higher compared to their corresponding feedstock.
The surface area of Biochar (BET) is a critical factor in determining its ability to adsorb and retain contaminants and nutrients. The surface area of all obtained biochars increased, especially that of the giant reed biochar which increased from 3.21 to 49.63 m2 g−1 (Table 2). Increased treatment temperature results in precipitation of VM, which later raises the number of micropores, causing an increase in the specific surface area and pore volume [45]. In general, the surface area of derived biochar increases with the pyrolysis process, due to the generation of porosity [46]. Moreover, the surface area of CBAC was as high as 798.50 m2/g. The micropores for GRBC and RHBC were abundant, and for other biochars were very limited. Overall, the interactions between different biochars and DEP at the solid–water interface could be influenced by significantly different pore structures and physicochemical properties of biochars.
The pH of all biochar ranged from 8.81 (SDBC) to 9.72 (RSBC), which was mainly due to the ash content and high aromaticity of biochar [47]. The ash content of different biochars ranged from 10.85 to 31.37, and it could be found at 30.68 and 31.37 for RSBC and GRBC.

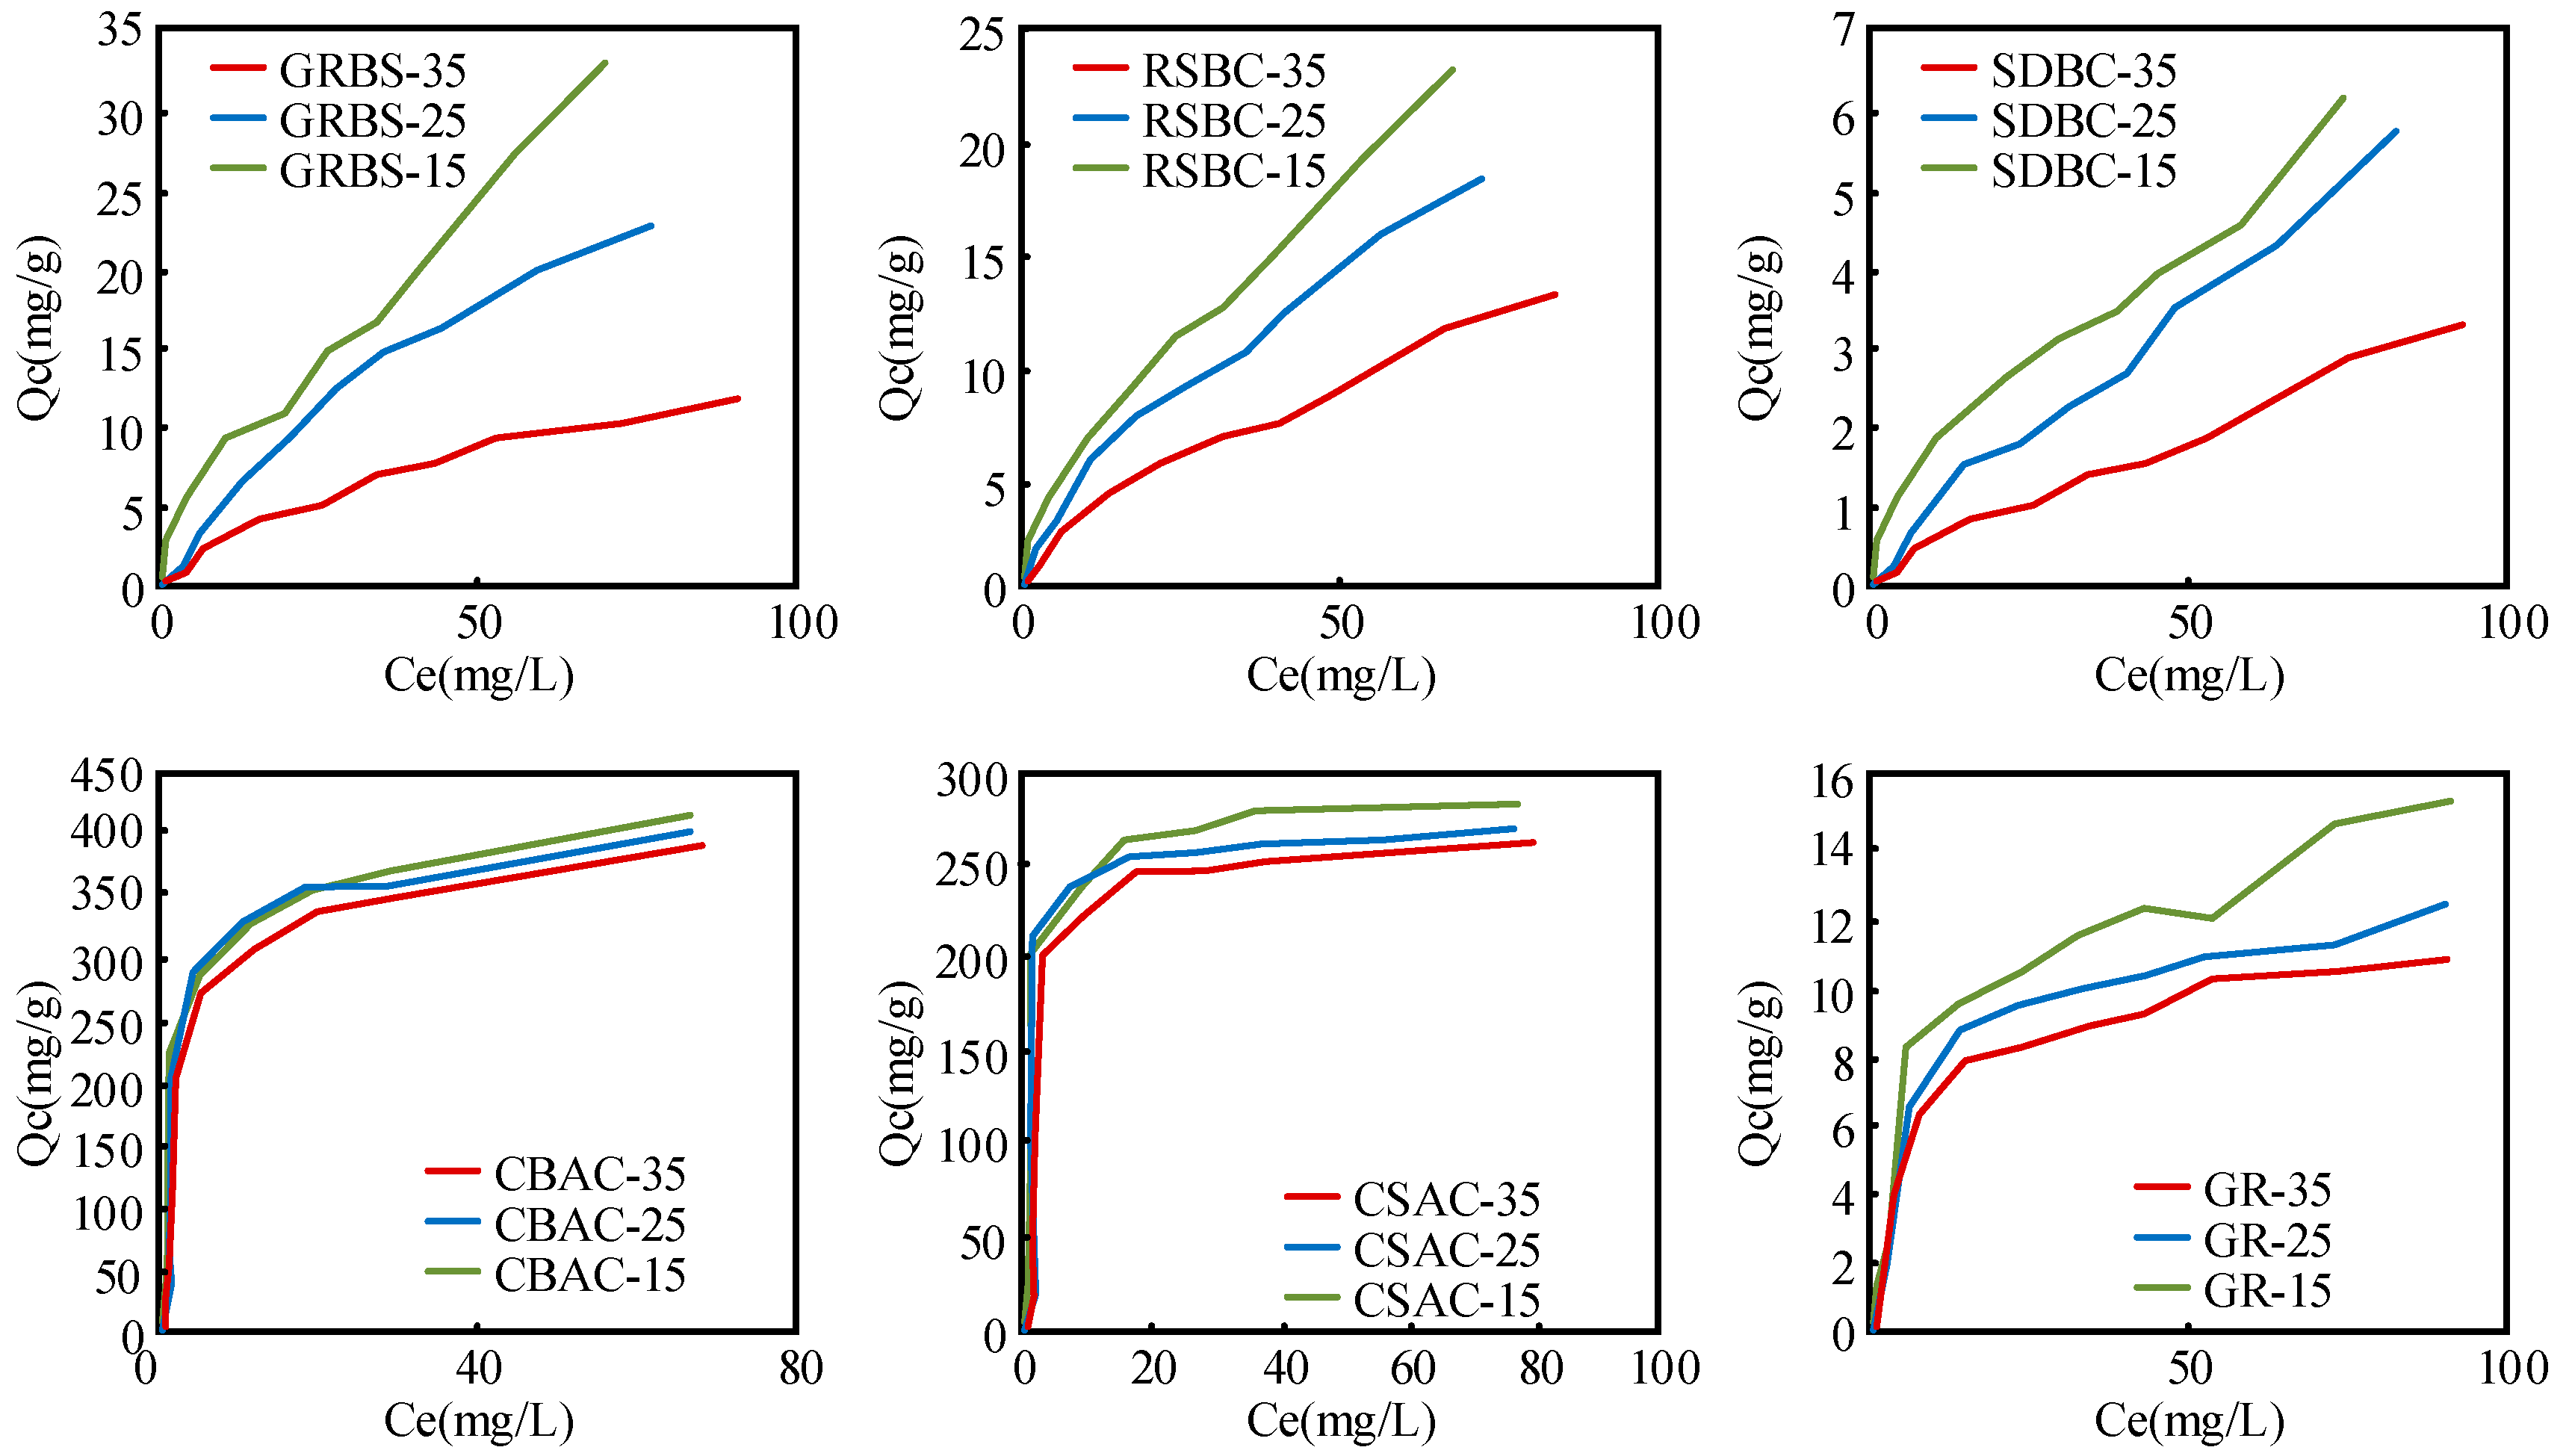
3.3. Adsorption Isotherms of DEP on Biochars

The adsorbed isotherms could be applied to type-I (simple L-shaped) according to the IUPAC, which usually happened upon the interface of the microporous [48]. Therefore, the Langmuir model (LM) and the Freundlich model (FM) were used to describe the isotherms. The fitting parameters are listed in Table 3. It seemed that the FM fitted better than LM with an adjusted coefficient radj2 above 0.989. The N values ranked in the order of RSBC < GRBC < CSBC < SDBC (0.79). Lower N values indicated less heterogeneous and a wider adsorption site distribution while higher N values implied a more homogeneous surface with a limited sorption site on the biochars surface [49], implying that there were more potential sites on the RSBC surface, thereby improving the adsorption of DEP on it.
The sorption coefficient Kd values were calculated by the given Ce and corresponding Qe (Kd = Qe/Ce, L g−1). It represented the bulks for biochar’s sorption and as the Ce values increased, the Kd values for all the adsorbents dramatically decreased. The Kd values were lower ranked in the order of CSBC < SDBC < WSBC < RHBC < GRBC < RSBC under low concentration (Ce = 0.5 mg L−1), compared with the Kd values at a high concentration (Ce = 50 mg L−1) which ranked in the order of CSBC < SDBC < WSBC < RHBC < RSBC < GRBC. This phenomenon could mainly be attributed to the different adsorption mechanisms at various DEP concentrations. The maximal adsorption capacity of the DEP by the biochars was in an order of GRBC (46.04 mg g−1) > RSBC (31.54 mg g−1) > SDBC (18.39 mg g−1) > RHBC (11.40 mg g−1) > WSBC (10.28 mg g−1) > CSBC (5.08 mg g−1). Interestingly, the Qe was relatively high for SDBC, which had relatively low Kd values, thus it had further proved the different adsorption mechanisms among biochars. As shown in Table 1, the O/C and (O + N)/C ratios of SDBC were far less than other biochars, which means less aromaticity and polarity, but a strong hydrophobic interaction that might dominate the adsorption of insoluble DEP on SDBC. Moreover, this finding was consistent with previous research that wood biochar was found to have stronger hydrophobic partitioning into soft alkyl carbon of PAEs in comparison to grass biochars.
The adsorption capacities of two kinds of activated carbon on DEP were much higher than in other carbonaceous materials. For example, the Qm (359.58 mg g−1) of CBAC is 7.81 and 70.78 times of GRBC. What is more, similar studies were found in the adsorption coefficient Kd, which was also much larger than other adsorbents. These results together demonstrated the superiority of adsorption capacities in adsorbing DEP of ACs relative to biochars.

3.4. Effect of pH, Ionic Strength, and Temperature on Adsorption

Adsorption of PAEs on carbonaceous materials (e.g., activated carbon, coal–chitosan composites) was highly dependent upon pH values, which influenced the properties of sorbent surfaces and pollutants [50,51]. Batch sorption experiments were carried out at pH values ranging between 2.5 and 10 to estimate the adsorption capacities of DEP. The equilibrium absorption capacity (Qe) is depicted in Figure 2a. Obviously, the process of DEP adsorptive was decided by the pH from the data. The best adsorption capacity was observed at acidic pH 2.5, and the Qe decreased markedly with the initial pH value increased except for CSBC.
To investigate the effect of pH on the adsorption process, we examined the electrical properties of the adsorbents and DEP. Surfaces of biochars were electronegative throughout the pH range, which may be due to the protons being abstracted from the -COOH group of biochars to form the carboxylate group in solution, whereas the RHBC’s highest electronegativity may be attributed to the existence of a large number of silicate groups [52]. In contrast, the ACs and GR experienced a change in surface charge from positive to negative with pH increased. In the case of DEP, one hydrophobic group (aromatic) and two carboxylic groups (pKa1 = 3, pKa2 = 5.4) are present in phthalic acid, respectively [53]. Because of the high H+ ion concentration in solution, it occurred in the shape of phthalic acid at lower acidic pH values. The negative groups of phthalic acid (H2-PA) molecules existed when it comes to a pH of more than 3. For a pH between 3 and 5.4, it was H2-PA/H-PA, and for a pH greater than 5.4, it was presented as H2-PA/ H-PA2−. Therefore, it means diverse interactions between DEP and adsorbents with different charges. As revealed by Ayranci and Bayram [54], it was attributable to electrostatic interactions between DEP and ACs. However, the DEP adsorption on biochars could be attributed to hydrophobicity and dispersion, and the increase in hydroxyl ions at a basic pH range dominated to form aqua complexes thereby restraining the sorption process.
The ionic strength (IS) influences on the adsorption of DEP to all derived biochars are depicted in Figure 2c. The adsorption of DEP to biochars was significantly increased by 18.32% to 68.45% with an increasing NaCl concentration from 1 mM to 200 mM, indicating that it was favorable for adsorption with a higher IS concentration. A number of studies have shown that ionic strength can promote the accumulation of carbon materials to form a highly dense framework because of the squeezing-out impact, thereby inhibiting the binding of organic contaminants [55,56]. On the other hand, other studies found that the Kd value of organic solute sorbed to non-aqueous phases increased as ionic strength increased [57,58], and the sorption capacities were significantly connected with the presence of dissolved ions, which had an influence on solute solubility in neutral aqueous, because of the salting-out and electrostatic screening effects [59,60]. Nevertheless, there is no significant effect of IS on DEP adsorption to K/Ca-clay minerals. Therefore, the effect of IS on adsorption capacities depended on the virtual input of these two differing effects. The little effect on the adsorption of DEP by GR suggests that the two kinds of effects might be too mild since no squeezing-out effect on graphite was found [61]. Therefore, it was highly dependent on the solubility of the organic pollutant adsorption process; with the increased NaCl concentration, the solubility of DEP was reduced, which made it certain that more adsorption would occur between DEP and biochars due to the “salting-out effect’’.
Estimations of the free energy ∆G0 during the adsorption process were calculated using the LM isotherm. Then, the ∆H0 and ∆S0 values were obtained derived from the Van’t Hoff equation. The variation of the values at different temperatures means the adsorption thermodynamic process. As shown in Figure 3, from the DEP adsorption isotherms at three different temperatures (15 °C, 25 °C, and 35 °C) of adsorbents, it could be clearly seen that a lower temperature facilitated DEP adsorption, and the calculated ∆G0 was less than zero, indicating that the adsorption processes were spontaneous. The different negative values of ∆H0 indicate the adsorption processes of the heterogeneous surface of the biochars. Initially, a more negative ∆H0 means that DEP molecules adsorb on the adsorbent surface at high-energy sites, but with the increasing adsorbate concentration, the high-energy sites on the surface were occupied, and the ∆H0 value was less negative, meaning that DEP molecules had to adsorb on the relatively low-energy sites surface [62]. The big changes in ∆H0 and ∆S0 values for GRBC mean that it was a complicated combination of micropore filling, hydrogen bonding, and π–π interactions together for the adsorption of DEP on GRBC.

3.5. Adsorption and Desorption Kinetics

The adsorption kinetics reflected the solid–liquid interface reaction rate and revealed the chemical adsorption mechanism to some extent. Adsorption kinetics was studied using pseudo-first-order and pseudo-second-order kinetic models. The Pseudo-second-order kinetic model looks perfect with high correlation coefficients (R2adj > 0.916) than the pseudo-first-order model. It reached adsorption equilibrium within approximately 196 h, a much slower adsorption rate than ACs and GR. The adsorption rate (k2) of biochars decreased as followed by CSBC > WSBC > RHBC > RSBC > GRBC > SDBC, and it seemed that different biochars’ porosities and variations may trigger diffusive interaction time at the start of the sorption process. Due to ample pore structure in the CSBC surface trap, the higher k2 obtained results for CSBC indicated maximum movement of DEP molecules on biochar surfaces in a short period of time (Figure 1). However, the Qe of CSBC was the lowest, which might be due to its relatively low SA and total pore volume.
In pursuance of making the adsorption mechanisms and rate-controlling measures more understandable, the intra-particle diffusion model was also used to match the adsorption kinetics. The GRBC showed the highest k3 value following RSBC > RHBC > WSBC > SDBC > CSBC, the contrast rank between k3 values and k2 values means that biochars that had fast adsorption capacities might have a simple surface diffusion effect, mainly dominated by the less layered porous structure internally for the diffusion and transport of DEP molecules. On the contrary, there were plenty of adsorbed sites on GRBC for working initially when the concentration of DEP was relatively high. The contaminant diffused, migrated to the surface of the biochars immediately, and the adsorption sites to the surface of biochars were consumed. Then, the DEP molecules with functional groups started spreading and coupled with the GRBC internal channel with different functional groups; this was a relatively slow and long adsorption process. Thereby, intra-particle diffusion was the dominant factor during this progress. Eventually, the adsorbed sites of the biochars were all completely taken up and it would reach the adsorption equilibrium.
The desorption kinetics of DEP is displayed in Figure 3, and the desorption parameters including fast and slow rates were analyzed by the two-compartment first-order model, as listed in Table 3. The desorption process was relatively slow. The Ffast values were less than 0.25, much lower than Fslow, while the slow desorption rate constants (kslow) were much smaller (three or four orders of magnitude) than fast desorption rate constants (kfast). On the other hand, the DEP equilibrium desorption efficiency was less than 10.5%, except for CSBC, meaning that it was stable for the DEP adsorption on biochars.

3.6. Adsorption Mechanisms

The dual model was used to assess the contributions of adsorption and partitioning of DEP on biochars, as shown in Figure 3. It fitted well for all the biochars with the adjusted coefficient radj2 above 0.99. The amount of adsorption (Qad) and partitioning (Qp) of DEP on biochars was calculated based on the calculated Qam and constants with different initial DEP concentrations. The adsorption (79.25–93.72%) of DEP was greater than partitioning at a low concentration range; however, the partitioning (56–84.13%) dominated the adsorption process at a higher DEP concentration, except for GRBC which held a relatively high Qad (89.61–93.82%) at all stages. This might be due to the occupied adsorption site with the increased DEP concentration, and partitioning into the hydrophobicity and a polarity structure of biochars [63]. The Qad values increased SDBC < RSBC < GRBC at the low concentration and this result is consistent with the Kd values calculated from the FM model. Surface polarity might have a high effect on the adsorption affinity; however, there was no virtual correlation between the values of Kd and (O + N)/C, because the character of biochars derived from different raw materials might vary greatly. Therefore, the mechanism was complex, and pore filling was not the only adsorption mechanism.

3.7. Comparison of Adsorption Effect

The agricultural waste biochar was made from sawdust, reed, and rice straw. In order to specifically analyze the difference in adsorption effect between the proposed biochar and other biochar, a comparative experiment was constructed, as shown in Figure 4. It can be seen that comparing the adsorption effect between agricultural waste biochar and other biochar shows that the curve change trend between them is consistent.

4. Conclusions

Dep is a control pollutant in the quality standard of drinking water in China, so effective adsorption of DEP in water is the key to ensuring the quality of drinking water. In the study, biochar was used to treat DEP in water. In order to analyze the removal effect of biochar on DEP in water, sawdust, reed, and rice straw were pyrolyzed into biochar at 400 °C. The experiment showed that the surface area of biochar participating in the test significantly increased. The surface area of CBAC was as high as 798.50 m2/g. The higher surface area increased the adsorption capacity of biochar; that is, a more efficient adsorption performance. It was found that the higher the pH, the lower the adsorption capacity. When the pH value was 2.5, the adsorption effect was the best. In addition, with the increase in NaCl concentration, the solubility of DEP decreased under the action of biochar. The stability of DEP adsorption on biochar was determined by the desorption experiment. The results showed that the equilibrium desorption efficiency of DEP was less than 10.5%, indicating that the adsorption of DEP on biochar was stable. Finally, the difference in the adsorption effect between biochar made from agricultural waste and other biochar was compared. The results showed that the adsorption effects of the two biochar were similar. Therefore, from the research results, it can be seen that pyrolysis of agricultural wastes and other biomass wastes into biochar as an adsorbent for organic pollutants is an effective technology to utilize typical waste resources.

Author Contributions

Conceptualization, Z.C., X.B. and H.J.; Data curation, Z.C. and X.B.; Formal analysis, Z.C.; Writing—original draft, Z.C.; Writing—review & editing, H.J. All authors have read and agreed to the published version of the manuscript.

Funding

This research received no external funding.

Data Availability Statement

The data used to support the findings of this study are available from the corresponding author upon request.

Conflicts of Interest

The authors declare that they have no competing interests.

References

  1. Shin, H.M.; Dhar, U.; Calafat, A.M.; Nguyen, V.; Schmidt, R.J.; Hertz-Picciotto, I. Temporal trends of exposure to phthalates and phthalate alternatives in california pregnant women during 2007–2013: Comparison with other populations. Environ. Sci. Technol. 2020, 54, 13157–13166. [Google Scholar] [CrossRef] [PubMed]
  2. Ahmad, N.; Younus, H.A.; Chughtai, A.H.; Van Hecke, K.; Danish, M.; Gaoke, Z.; Verpoort, F. Development of Mixed metal Metal-organic polyhedra networks, colloids, and MOFs and their Pharmacokinetic applications. Sci. Rep. 2017, 7, 832. [Google Scholar] [CrossRef] [Green Version]
  3. Akram, B.; Ahmad, K.; Khan, J.; Khan, B.A.; Akhtar, J. Low-temperature solution-phase route to sub-10 nm titanium oxide nanocrystals having super-enhanced photoreactivity. N. J. Chem. 2018, 42, 10947–10952. [Google Scholar] [CrossRef]
  4. Zeng, F.; Cui, K.; Xie, Z.; Wu, L.; Liu, M.; Sun, G.; Lin, Y.; Luo, D.; Zeng, Z. Phthalate esters (PAEs): Emerging organic contaminants in agricultural soils in peri-urban areas around Guangzhou, China. Environ. Pollut. 2008, 156, 425–434. [Google Scholar] [CrossRef] [PubMed]
  5. Gao, D.W.; Wen, Z.D. Phthalate esters in the environment: A critical review of their occurrence, biodegradation, and removal during wastewater treatment processes. Sci. Total Environ. 2016, 541, 986–1001. [Google Scholar] [CrossRef] [PubMed]
  6. Liu, H.; Cui, K.; Zeng, F.; Chen, L.; Cheng, Y.; Li, H.; Li, S.; Zhou, X.; Zhu, F.; Ouyang, G.; et al. Occurrence and distribution of phthalate esters in riverine sediments from the Pearl River Delta region, South China. Mar. Pollut. Bull. 2014, 83, 358–365. [Google Scholar] [CrossRef]
  7. Zhang, Z.M.; Zhang, H.H.; Zhang, J.; Wang, Q.W.; Yang, G.P. Occurrence, distribution, and ecological risks of phthalate esters in the seawater and sediment of Changjiang River Estuary and its adjacent area. Sci. Total Env. 2018, 619–620, 93–102. [Google Scholar] [CrossRef]
  8. Marx, J.L. Phthalic acid esters: Biological impact uncertain. Science 1972, 178, 46–47. [Google Scholar] [CrossRef]
  9. Meng, X.-Z.; Wang, Y.; Xiang, N.; Chen, L.; Liu, Z.; Wu, B.; Dai, X.; Zhang, Y.-H.; Xie, Z.; Ebinghaus, R. Flow of sewage sludge-borne phthalate esters (PAEs) from human release to human intake: Implication for risk assessment of sludge applied to soil. Sci. Total Environ. 2014, 476, 242–249. [Google Scholar] [CrossRef]
  10. Oehlmann, J.; Schulte-Oehlmann, U.; Kloas, W.; Jagnytsch, O.; Lutz, I.; Kusk, K.O.; Wollenberger, L.; Santos, E.; Paull, G.C.; Van Look, K.J.W.; et al. A critical analysis of the biological impacts of plasticizers on wildlife. Philos. Trans. R. Soc. B Biol. Sci. 2009, 364, 2047–2062. [Google Scholar] [CrossRef] [Green Version]
  11. Sun, J.; Wu, X.; Gan, J. Uptake and metabolism of phthalate esters by edible plants. Environ. Sci. Technol. 2015, 49, 8471–8478. [Google Scholar] [CrossRef]
  12. Hung, C.H.; Yuan, C.; Li, H.W. Photodegradation of diethyl phthalate with PANi/CNT/TiO2 immobilized on glass plate irradiated with visible light and simulated sunlight-effect of synthesized method and pH. J. Hazard. Mater. 2017, 322, 243–253. [Google Scholar] [CrossRef] [PubMed]
  13. Yang, G.P.; Zhao, X.K.; Sun, X.J.; Lu, X.L. Oxidative degradation of diethyl phthalate by photochemically-enhanced Fenton reaction. J. Hazard. Mater. 2005, 126, 112–118. [Google Scholar] [CrossRef] [PubMed]
  14. Roslev, P.; Vorkamp, K.; Aarup, J.; Frederiksen, K.; Nielsen, P.H. Degradation of phthalate esters in an activated sludge wastewater treatment plant. Water Res. 2007, 41, 969–976. [Google Scholar] [CrossRef] [PubMed]
  15. Chen, Z.; Hu, Z.; Wang, J.; Wang, X.; Niu, X.; Wang, Y.; Shen, Y.; Teng, W.; Fan, J.; Zhang, W.-X. Synthesis of mesoporous silica-carbon microspheres via self-assembly and in-situ carbonization for efficient adsorption of Di-n-butyl phthalate. Chem. Eng. J. 2019, 369, 854–862. [Google Scholar] [CrossRef]
  16. Liang, D.W.; Zhang, T.; Fang, H.H. Anaerobic degradation of dimethyl phthalate in wastewater in a UASB reactor. Water Res. 2007, 41, 2879–2884. [Google Scholar] [CrossRef]
  17. Mesdaghinia, A.; Azari, A.; Nodehi, R.N.; Yaghmaeian, K.; Bharti, A.K.; Agarwal, S.; Gupta, V.K.; Sharafi, K. Removal of phthalate esters (PAEs) by zeolite/Fe3O4: Investigation on the magnetic adsorption separation, catalytic degradation and toxicity bioassay. J. Mol. Liq. 2017, 233, 378–390. [Google Scholar] [CrossRef]
  18. Wang, F.; Yao, J.; Sun, K.; Xing, B.S. Adsorption of Dialkyl Phthalate Esters on Carbon Nanotubes. Environ. Sci. Technol. 2010, 44, 6985–6991. [Google Scholar] [CrossRef]
  19. Wu, Y.; Si, Y.; Zhou, D.; Gao, J. Adsorption of diethyl phthalate ester to clay minerals. Chemosphere 2015, 119, 690–696. [Google Scholar] [CrossRef]
  20. Coughlin, R.W.; Ezra, F.S. Role of surface acidity in the adsorption of organic pollutants on the surface of carbon. Environ. Sci. Technol. 1968, 2, 291–297. [Google Scholar] [CrossRef]
  21. Wang, Z.; Zheng, H.; Luo, Y.; Deng, X.; Herbert, S.; Xing, B. Characterization and influence of biochars on nitrous oxide emission from agricultural soil. Environ. Pollut. 2013, 174, 289–296. [Google Scholar] [CrossRef] [PubMed]
  22. Lu, L.; Wang, J.; Chen, B. Adsorption and desorption of phthalic acid esters on graphene oxide and reduced graphene oxide as affected by humic acid. Environ. Pollut. 2018, 232, 505–513. [Google Scholar] [CrossRef] [PubMed]
  23. Nie, T.; Yang, X.; Chen, H.; Müller, K.; Shaheen, S.M.; Rinklebe, J.; Song, H.; Xu, S.; Wu, F.; Wang, H. Effect of biochar aging and co-existence of diethyl phthalate on the mono-sorption of cadmium and zinc to biochar-treated soils. J. Hazard. Mater. 2021, 408, 124850. [Google Scholar] [CrossRef] [PubMed]
  24. Sun, K.; Jin, J.; Keiluweit, M.; Kleber, M.; Wang, Z.; Pan, Z.; Xing, B. Polar and aliphatic domains regulate sorption of phthalic acid esters (PAEs) to biochars. Bioresour. Technol. 2012, 118, 120–127. [Google Scholar] [CrossRef]
  25. Abdul, G.; Zhu, X.; Chen, B. Structural characteristics of biochar-graphene nanosheet composites and their adsorption performance for phthalic acid esters. Chem. Eng. J. 2017, 319, 9–20. [Google Scholar] [CrossRef]
  26. Tomczyk, A.; Sokołowska, Z.; Boguta, P. Biochar physicochemical properties: Pyrolysis temperature and feedstock kind effects. Rev. Environ. Sci. Biotechnol. 2020, 19, 191–215. [Google Scholar] [CrossRef] [Green Version]
  27. Erin, N.; Yargicoglu, B.Y.S.; Krishna, R. Reddy, Kurt Spokas. Physical and chemical characterization of waste wood derived biochars. Waste Manag. 2015, 36, 256–268. [Google Scholar]
  28. Décima, M.A.; Marzeddu, S.; Barchiesi, M.; Di Marcantonio, C.; Chiavola, A.; Boni, M.R. A Review on the Removal of Carbamazepine from Aqueous Solution by Using Activated Carbon and Biochar. Sustainability 2021, 13, 11760. [Google Scholar] [CrossRef]
  29. Marzeddu, S.; Cappelli, A.; Ambrosio, A.; Décima, M.A.; Viotti, P.; Boni, M.R. A Life Cycle Assessment of an Energy-Biochar Chain Involving a Gasification Plant in Italy. Land 2021, 10, 1256. [Google Scholar] [CrossRef]
  30. Liu, Y.; Shen, L.; Huang, Z.; Liu, J.; Xu, Y.; Li, R.; Zhang, M.; Hong, H.; Lin, H. A novel in-situ micro-aeration functional membrane with excellent decoloration efficiency and antifouling performance. J. Mebrane Sci. 2022, 641, 119925. [Google Scholar] [CrossRef]
  31. Yu, F.; Cheng, Y.J.; Xing, S.Y.; Wang, Y.J.; Ma, J. A comprehensive review on flow-electrode capacitive deionization: Design, active material and environmental application. Sep. Purif. Technol. 2022, 281, 119870. [Google Scholar] [CrossRef]
  32. Fan, X.L.; Cai, J.; Zhong, M.; Bian, Y.R.; Jiang, X. Mechanistic insights into primary biotransformation of diethyl phthalate in earthworm and significant SOD inhibitory effect of esterolytic products. Chemosphere 2022, 288, 132491. [Google Scholar] [CrossRef] [PubMed]
  33. Li, J.; Du, H.X.; Guan, Y.B.; Ma, M.; Rennenberg, H. The symbiotic system of sulfate-reducing bacteria and clay-sized fraction of purplish soil strengthens cadmium fixation through iron-bearing minerals. Sci. Total Environ. 2022, 820, 153253. [Google Scholar] [CrossRef] [PubMed]
  34. Huang, Z.Y.; Liu, Y.; Xu, Y.C.; Li, R.J.; Hong, H.C.; Shen, L.G.; Lin, H.J. Facile synthesis of 2D TiO2@MXene composite membrane with enhanced separation and antifouling performance. J. Membr. Sci. 2021, 640, 119854. [Google Scholar] [CrossRef]
  35. Abbas, Q.; Liu, G.; Yousaf, B.; Ali, M.U.; Ullah, H.; Munir, M.A.M.; Liu, R. Contrasting effects of operating conditions and biomass particle size on bulk characteristics and surface chemistry of rice husk derived-biochars. J. Anal. Appl. Pyrolysis 2018, 134, 281–292. [Google Scholar] [CrossRef]
  36. Suliman, W.; Harsh, J.B.; Abu-Lail, N.I.; Fortuna, A.M.; Dallmeyer, I.; Garcia-Perez, M. Influence of feedstock source and pyrolysis temperature on biochar bulk and surface properties. Biomass Bioenergy 2016, 84, 37–48. [Google Scholar] [CrossRef]
  37. Garcia-Delgado, R.A.; Cotoruelo-Minguez, L.M.; Rodriguez, J.J. Equilibrium Study of Single-Solute Adsorption of Anionic Surfactants with Polymeric XAD Resins. Sep. Sci. Technol. 2006, 27, 975–987. [Google Scholar] [CrossRef]
  38. Liu, Y. Is the Free Energy Change of Adsorption Correctly Calculated? J. Chem. Eng. Data 2009, 54, 1981–1985. [Google Scholar] [CrossRef]
  39. Jafri, N.; Wong, W.Y.; Doshi, V.; Yoon, L.W.; Cheah, K.H. A review on production and characterization of biochars for application in direct carbon fuel cells. Process Saf. Environ. Prot. 2018, 118, 152–166. [Google Scholar] [CrossRef]
  40. Tag, A.T.; Duman, G.; Ucar, S.; Yanik, J. Effects of feedstock type and pyrolysis temperature on potential applications of biochar. J. Anal. Appl. Pyrolysis 2016, 120, 200–206. [Google Scholar] [CrossRef]
  41. Crombie, K.; Mašek, O.; Sohi, S.P.; Brownsort, P.; Cross, A. The effect of pyrolysis conditions on biochar stability as determined by three methods. GCB Bioenergy 2013, 5, 122–131. [Google Scholar] [CrossRef] [Green Version]
  42. Aghoghovwia, M.P.; Hardie, A.G.; Rozanov, A.B. Characterisation, adsorption and desorption of ammonium and nitrate of biochar derived from different feedstocks. Environ. Technol. 2020, 43, 774–787. [Google Scholar] [CrossRef] [PubMed]
  43. Guerrero, M.; Ruiz, M.P.; Millera, Á.; Alzueta, M.U.; Bilbao, R. Characterization of Biomass Chars Formed under Different Devolatilization Conditions: Differences between Rice Husk and Eucalyptus. Energy Fuels 2008, 17, 1275–1284. [Google Scholar] [CrossRef]
  44. Wang, Z.; Deng, X.; Zhao, J.; Xing, B. Characteristics and nutrient values of biochars produced from giant reed at different temperatures. Bioresour. Technol. 2013, 130, 463–471. [Google Scholar]
  45. Wang, H.; Fang, C.; Wang, Q.; Chu, Y.; Song, Y.; Chen, Y.; Xue, X. Sorption of tetracycline on biochar derived from rice straw and swine manure. RSC Adv. 2018, 8, 16260–16268. [Google Scholar] [CrossRef] [Green Version]
  46. Paethanom, A.; Yoshikawa, K. Influence of pyrolysis temperature on rice husk char characteristics and its tar adsorption capability. Energies 2012, 5, 4941–4951. [Google Scholar]
  47. Beesley, L.; Moreno-Jiménez, E.; Gomez-Eyles, J.L.; Harris, E.; Robinson, B.; Sizmur, T. A review of biochars’ potential role in the remediation, revegetation and restoration of contaminated soils. Environ. Pollut. 2011, 159, 3269–3282. [Google Scholar] [CrossRef]
  48. Xuan, W.; Zhu, C.; Liu, Y.; Cui, Y. Mesoporous metal-organic framework materials. Chem. Soc. Rev. 2012, 41, 1677–1695. [Google Scholar] [CrossRef]
  49. Xing, B.; Pignatello, J.J.; Gigliotti, B. Competitive Sorption between Atrazine and Other Organic Compounds in Soils and Model Sorbents. Environ. Sci. Technol. 1996, 31, 2432–2440. [Google Scholar]
  50. Mohan, S.V.; Shailaja, S.; Krishna, M.R.; Sarma, P.N. Adsorptive removal of phthalate ester (Di-ethyl phthalate) from aqueous phase by activated carbon: A kinetic study. J. Hazard. Mater. 2007, 146, 278–282. [Google Scholar] [CrossRef]
  51. Shaida, M.A.; Dutta, R.K.; Sen, A.K. Removal of diethyl phthalate via adsorption on mineral rich waste coal modified with chitosan. J. Mol. Liq. 2018, 261, 271–282. [Google Scholar] [CrossRef]
  52. Lee, Y.; Park, J.; Ryu, C.; Gang, K.S.; Yang, W.; Park, Y.K.; Jung, J.; Hyun, S. Comparison of biochar properties from biomass residues produced by slow pyrolysis at 500 degrees C. Bioresour. Technol. 2013, 148, 196–201. [Google Scholar] [CrossRef] [PubMed]
  53. Khan, N.A.; Jung, B.K.; Hasan, Z.; Jhung, S.H. Adsorption and removal of phthalic acid and diethyl phthalate from water with zeolitic imidazolate and metal-organic frameworks. J. Hazard. Mater. 2015, 282, 194–200. [Google Scholar] [CrossRef]
  54. Ayranci, E.; Bayram, E. Adsorption of phthalic acid and its esters onto high-area activated carbon-cloth studied by in situ UV-spectroscopy. J. Hazard. Mater. 2005, 122, 147–153. [Google Scholar] [CrossRef]
  55. Cho, H.H.; Huang, H.; Schwab, K. Effects of solution chemistry on the adsorption of ibuprofen and triclosan onto carbon nanotubes. Langmuir 2011, 27, 12960–12967. [Google Scholar] [CrossRef] [PubMed]
  56. Xu, R.K.; Xiao, S.C.; Yuan, J.H.; Zhao, A.Z. Adsorption of methyl violet from aqueous solutions by the biochars derived from crop residues. Bioresour. Technol. 2011, 102, 10293–10298. [Google Scholar] [CrossRef] [PubMed]
  57. Means, J.C. Influence of salinity upon sediment-water partitioning of aromatic hydrocarbons. Mar. Chem. 1995, 51, 3–16. [Google Scholar] [CrossRef]
  58. Turner, A.; Rawling, M.C. The influence of salting out on the sorption of neutral organic compounds in estuaries. Water Res. 2001, 35, 4379–4389. [Google Scholar] [CrossRef]
  59. Oh, S.; Wang, Q.; Shin, W.S.; Song, D.-I. Effect of salting out on the desorption-resistance of polycyclic aromatic hydrocarbons (PAHs) in coastal sediment. Chem. Eng. J. 2013, 225, 84–92. [Google Scholar] [CrossRef]
  60. Zhang, S.; Shao, T.; Bekaroglu, S.S.; Karanfil, T. Adsorption of synthetic organic chemicals by carbon nanotubes: Effects of background solution chemistry. Water Res. 2010, 44, 2067–2074. [Google Scholar] [CrossRef]
  61. Liu, F.F.; Zhao, J.; Wang, S.; Du, P.; Xing, B. Effects of solution chemistry on adsorption of selected pharmaceuticals and personal care products (PPCPs) by graphenes and carbon nanotubes. Environ. Sci. Technol. 2014, 48, 13197–13206. [Google Scholar] [CrossRef] [PubMed]
  62. Zhang, W.; Xu, Z.; Pan, B.; Hong, C.; Jia, K.; Jiang, P.; Zhang, Q.; Pan, B. Equilibrium and heat of adsorption of diethyl phthalate on heterogeneous adsorbents. J. Colloid Interface Sci. 2008, 325, 41–47. [Google Scholar] [CrossRef] [PubMed]
  63. Lian, F.; Huang, F.; Chen, W.; Xing, B.; Zhu, L. Sorption of apolar and polar organic contaminants by waste tire rubber and its chars in single- and bi-solute systems. Environ. Pollut. 2011, 159, 850–857. [Google Scholar] [CrossRef] [PubMed]
Figure 1. Characterized biochars FTIR spectra of biochars.
Processes 10 01369 g001
Figure 2. Effect of pH and ionic strength on DEP adsorption by absorbents.(a) Effect of pH on the adsorption of SDBC, RSBC and GRBC; (b) Effect of pH on the adsorption of CBNC, CSAC and GR; (c) The ionic strength (IS) influences on the adsorption of SDBC, RSBC and GRBC; (d) he ionic strength (IS) influences on the adsorption of CBNC, CSAC and GR.
Processes 10 01369 g002
Figure 3. Effect of temperature on DEP adsorption onto absorbents.
Processes 10 01369 g003
Figure 4. Comparison of biochar source types.
Processes 10 01369 g004
Table 1. Bulk elemental composition, ash content, atomic ratio, pH, and EC for raw biomasses and biochars.
/Raw SDSDBCRaw GRGRBCRaw RSRSBCCSACCBACGR
Yield (%)--44.26--36.58--43.7------
C (%)47.568.248.3877.0138.1751.789.6986.0198.13
H (%)0.42.854.952.365.432.620.60.890.52
N (%)4.321.280.340.120.640.60.010.190.3
S (%)0.210.010.010.010.060.070.040.010.02
O (%)10.14.1939.769.6452.1314.37.362.560.21
Moisture2.411.237.53.26.432.92------
Ash0.723.474.879.8514.2330.62.3110.340.84
VM94.869.5268.1214.1773.2221.4------
FC2.015.7819.5172.786.1244.9------
H/C0.090.41.130.341.690.60.070.010.05
O/C0.150.040.590.141.020.20.0820.030.02
(O + N)/C0.70.270.620.241.070.240.0830.030.05
pH6.18.815.689.596.569.7210.159.115.19
EC (dS m−1)0.810.8936.12.022.1111.8------
Table 2. Pore structure parameters of the adsorbents.
/Raw SDSDBCRaw GRGRBCRaw RSRSBCCSACCBACGR
SBETβ (m2/g) 11.077.3549.636.7436.53549.90798.5035.11
Smicro--2.72--30.63--15.87773.80934.6035.76
Smeso--6.64--36.71--10.2352.6878.0124.05
Vtot (cm3/g)--0.01--0.05--0.020.340.450.05
Vmicro--0.01--0.01--0.020.280.330.01
Vmeso--0.01--0.05--0.020.070.110.04
Davg (nm)--4.83--4.65--5.232.502.275.30
Dmicro--2.38--1.56--1.961.411.302.35
Table 3. Parameters of DEP sorption isotherm on different biochars fitted by Langmuir and Freundlich models.
SamplesLangmuir ModelFreundlich Model
Qm (mg g−1)KL (L mg−1)Radj2Kd (L g−1)KF (mg g−1 (mg L−1)-N)NηRadj2Kd
Ce = 0.5
mg L−1
Ce = 5
mg L−1
Ce = 50
mg L−1
Ce = 0.5
mg L−1
Ce = 5
mg L−1
Ce = 50
mg L−1
SDBC18.390.530.980.090.090.070.170.790.980.200.120.08
GRBC46.040.010.990.600.570.361.130.710.991.380.700.36
RSBC31.540.010.970.570.530.301.300.620.991.690.710.29
CSAC261.046.960.96406.0150.705.21186.010.100.84348.0043.605.46
CBAC359.581.980.80358.0165.307.12215.010.150.98387.0055.107.84
GR10.940.370.933.421.420.214.420.220.967.571.270.21
Publisher’s Note: MDPI stays neutral with regard to jurisdictional claims in published maps and institutional affiliations.

