
Controlled Germination of Faba Beans: Drying, Thermodynamic Properties and Physical-Chemical Composition

 , , ,
, , ,  , , , ,
Abstract
:1. Introduction
2. Materials and Methods
2.1. Material
2.2. Processing and Germination of Seeds
2.3. Drying Procedure
2.4. Data Modeling
2.5. Determination of the Effective Diffusion Coefficient and Activation Energy
2.6. Determination of the Thermodynamic Properties
2.7. Physicochemical Characterization
2.8. Statistical Analysis
3. Results
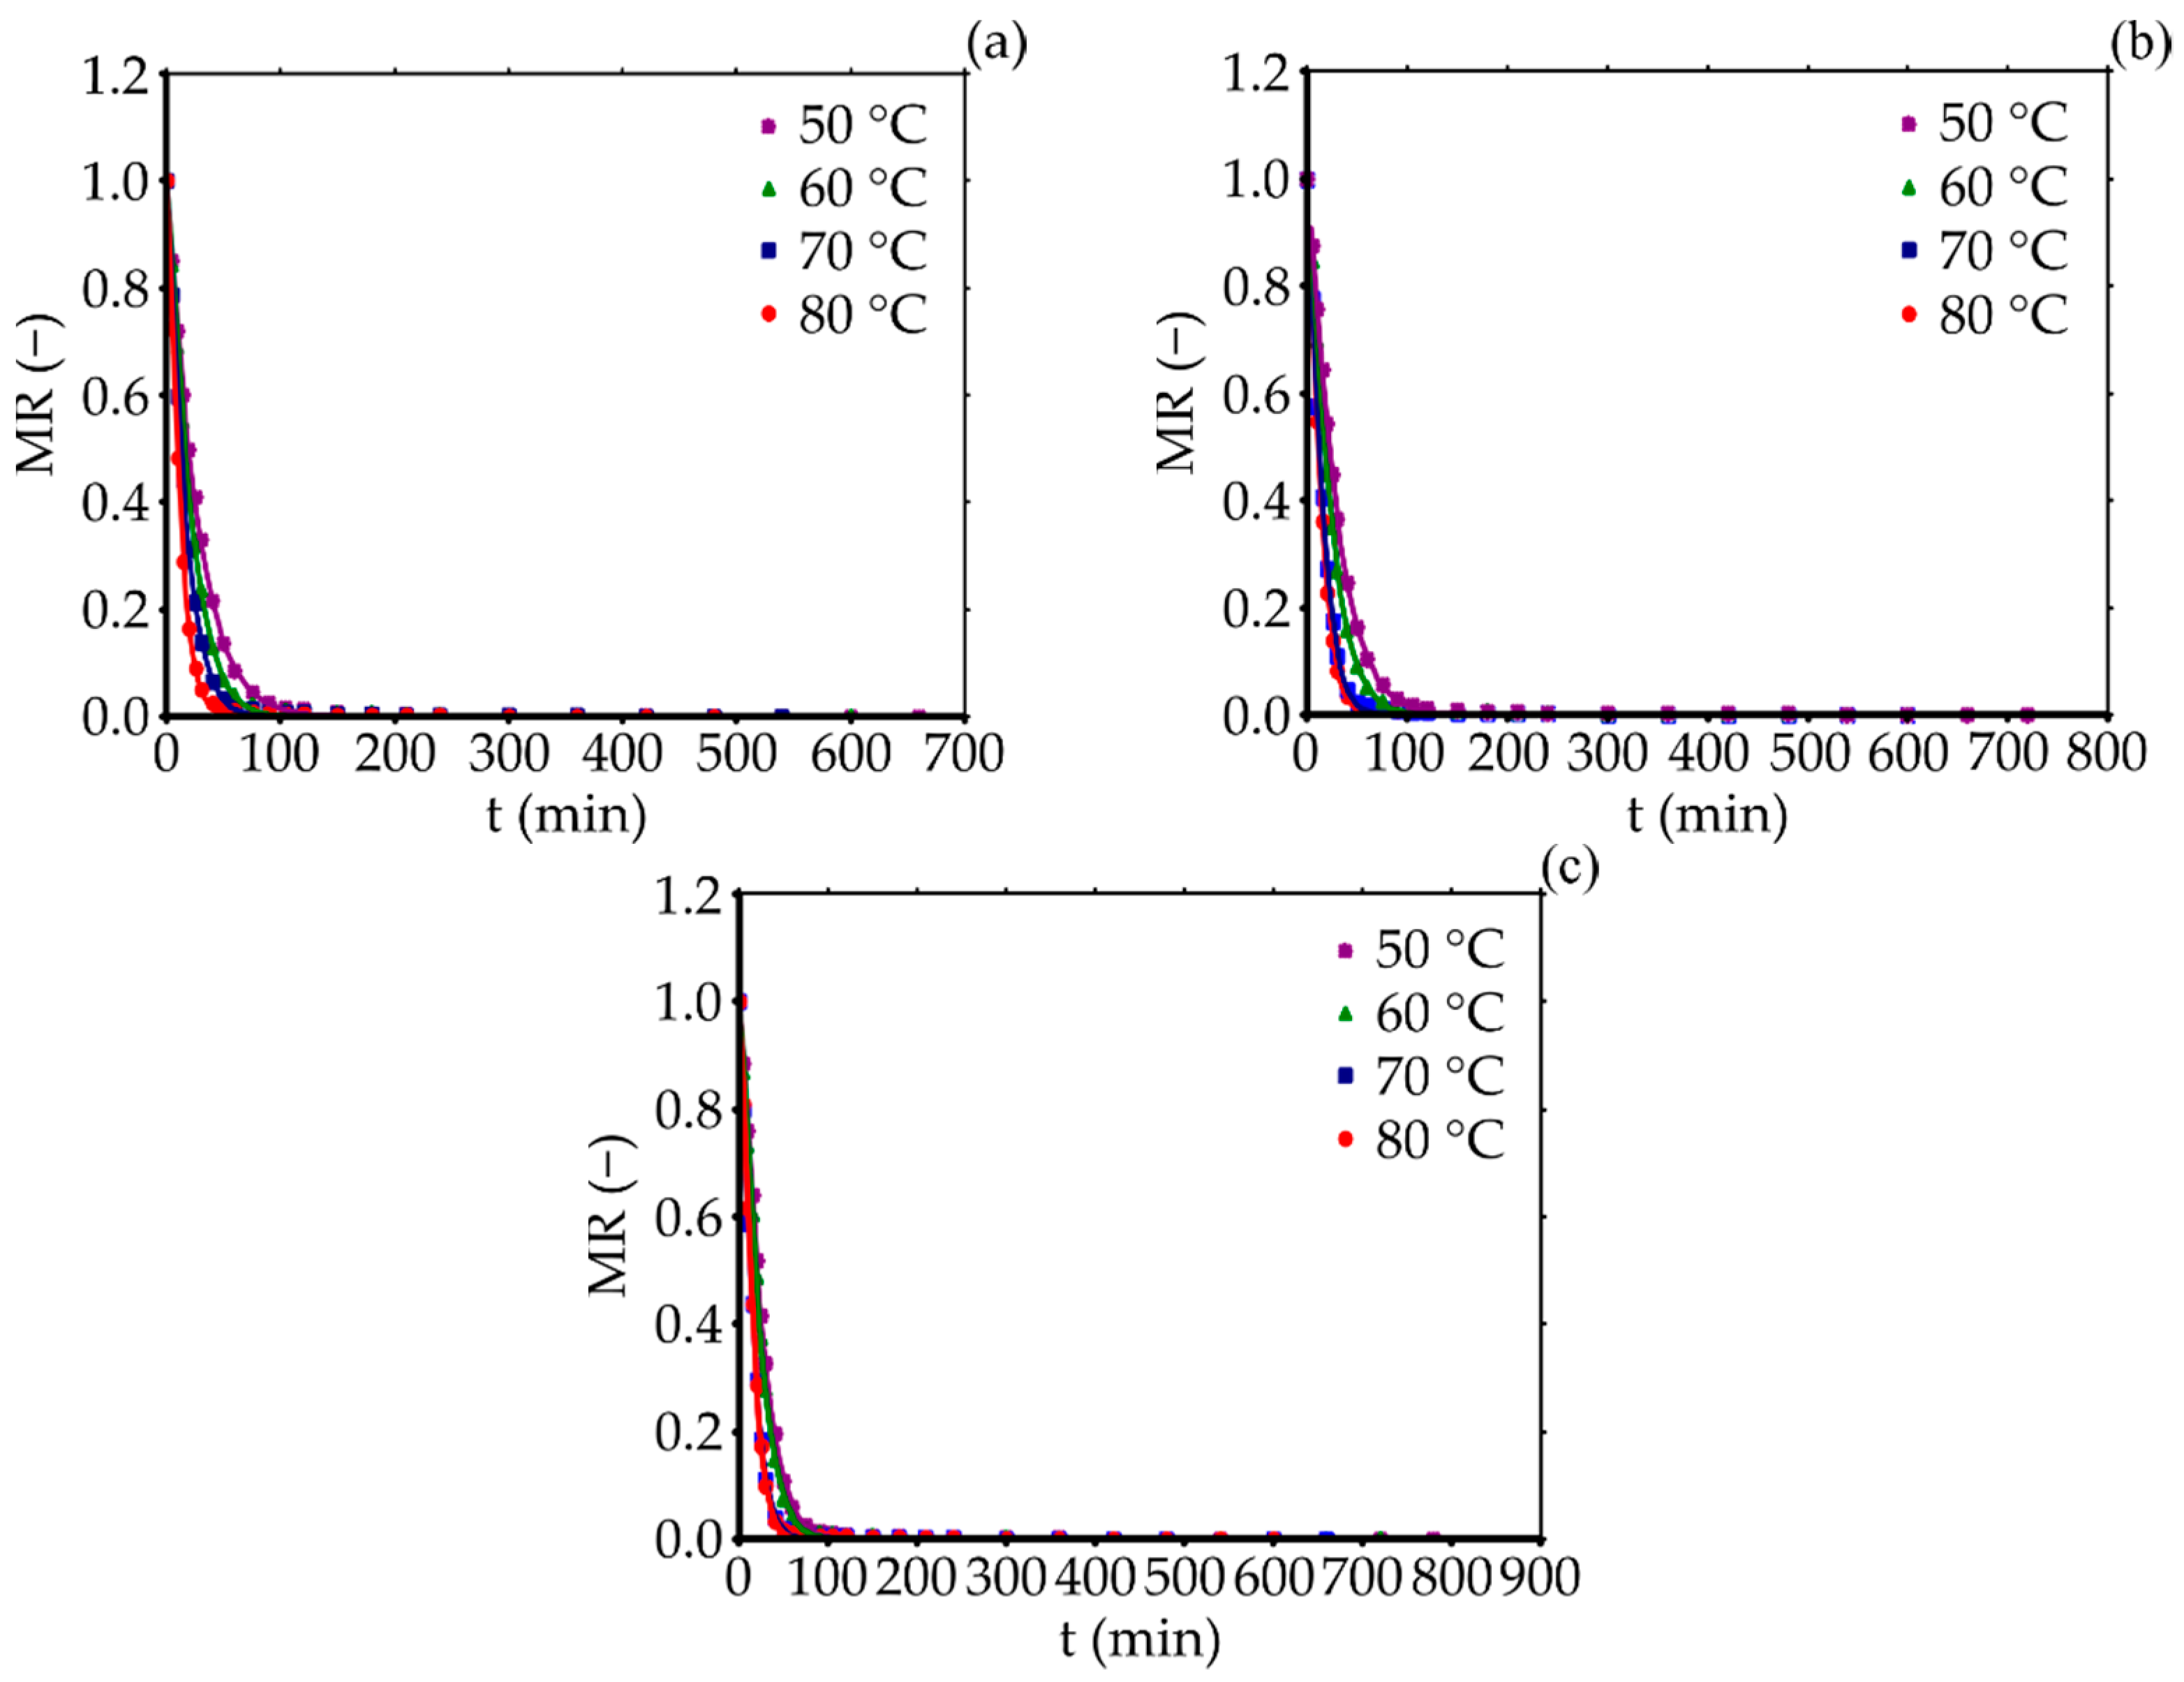
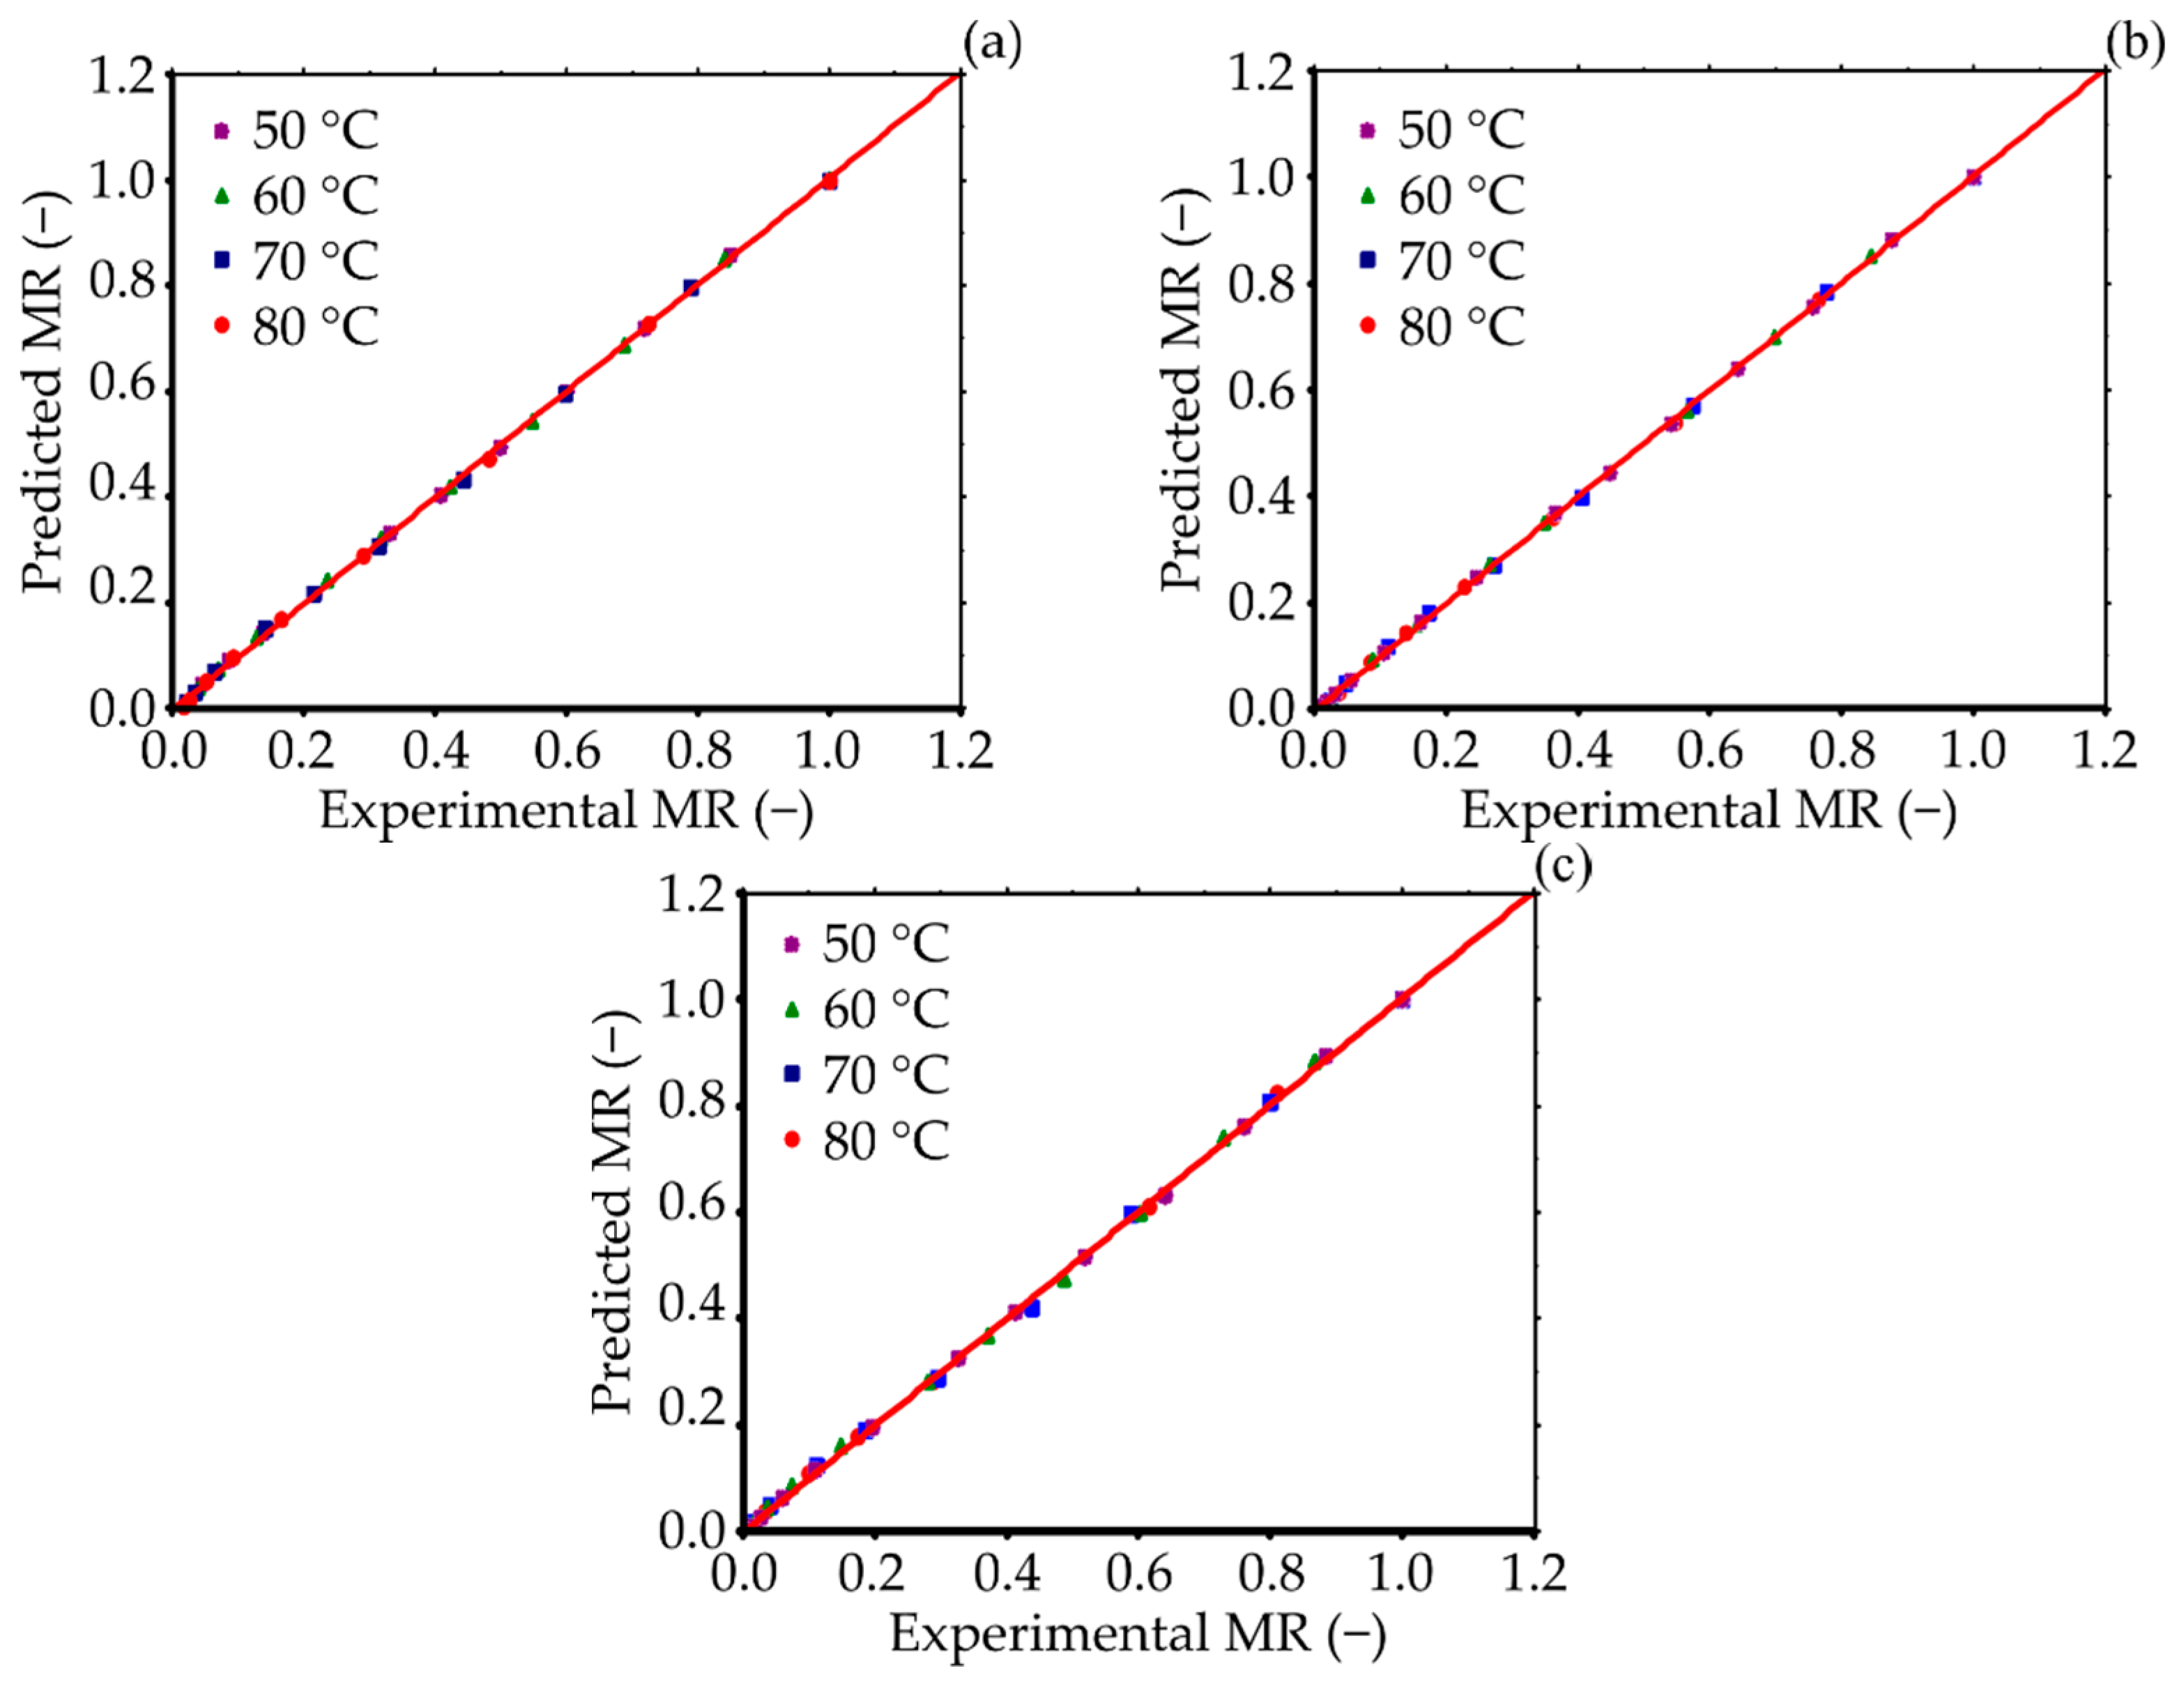
3.1. Mathematical Modeling of Drying Kinetics
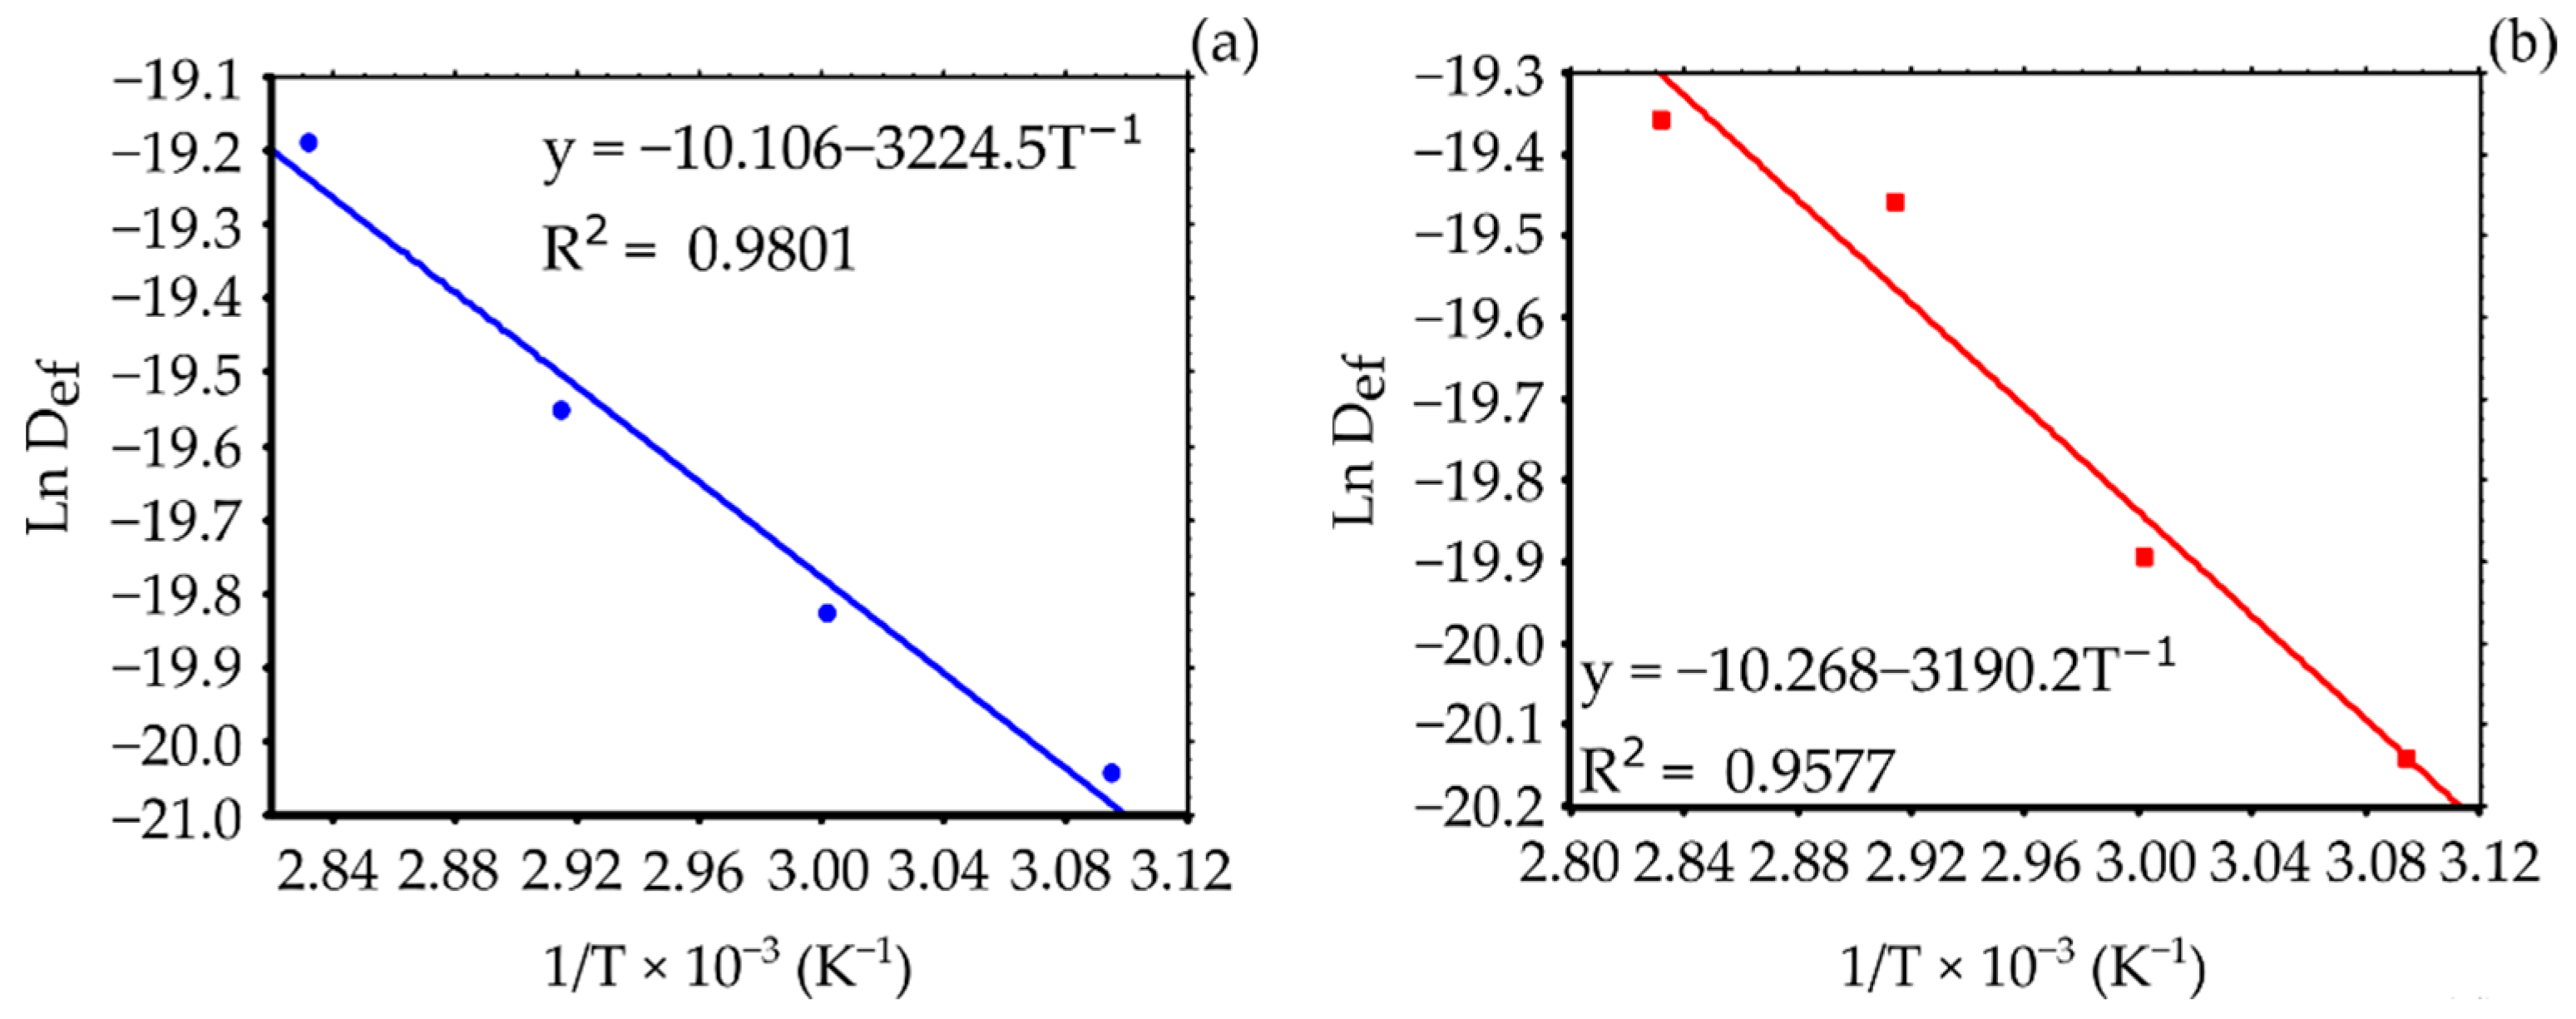
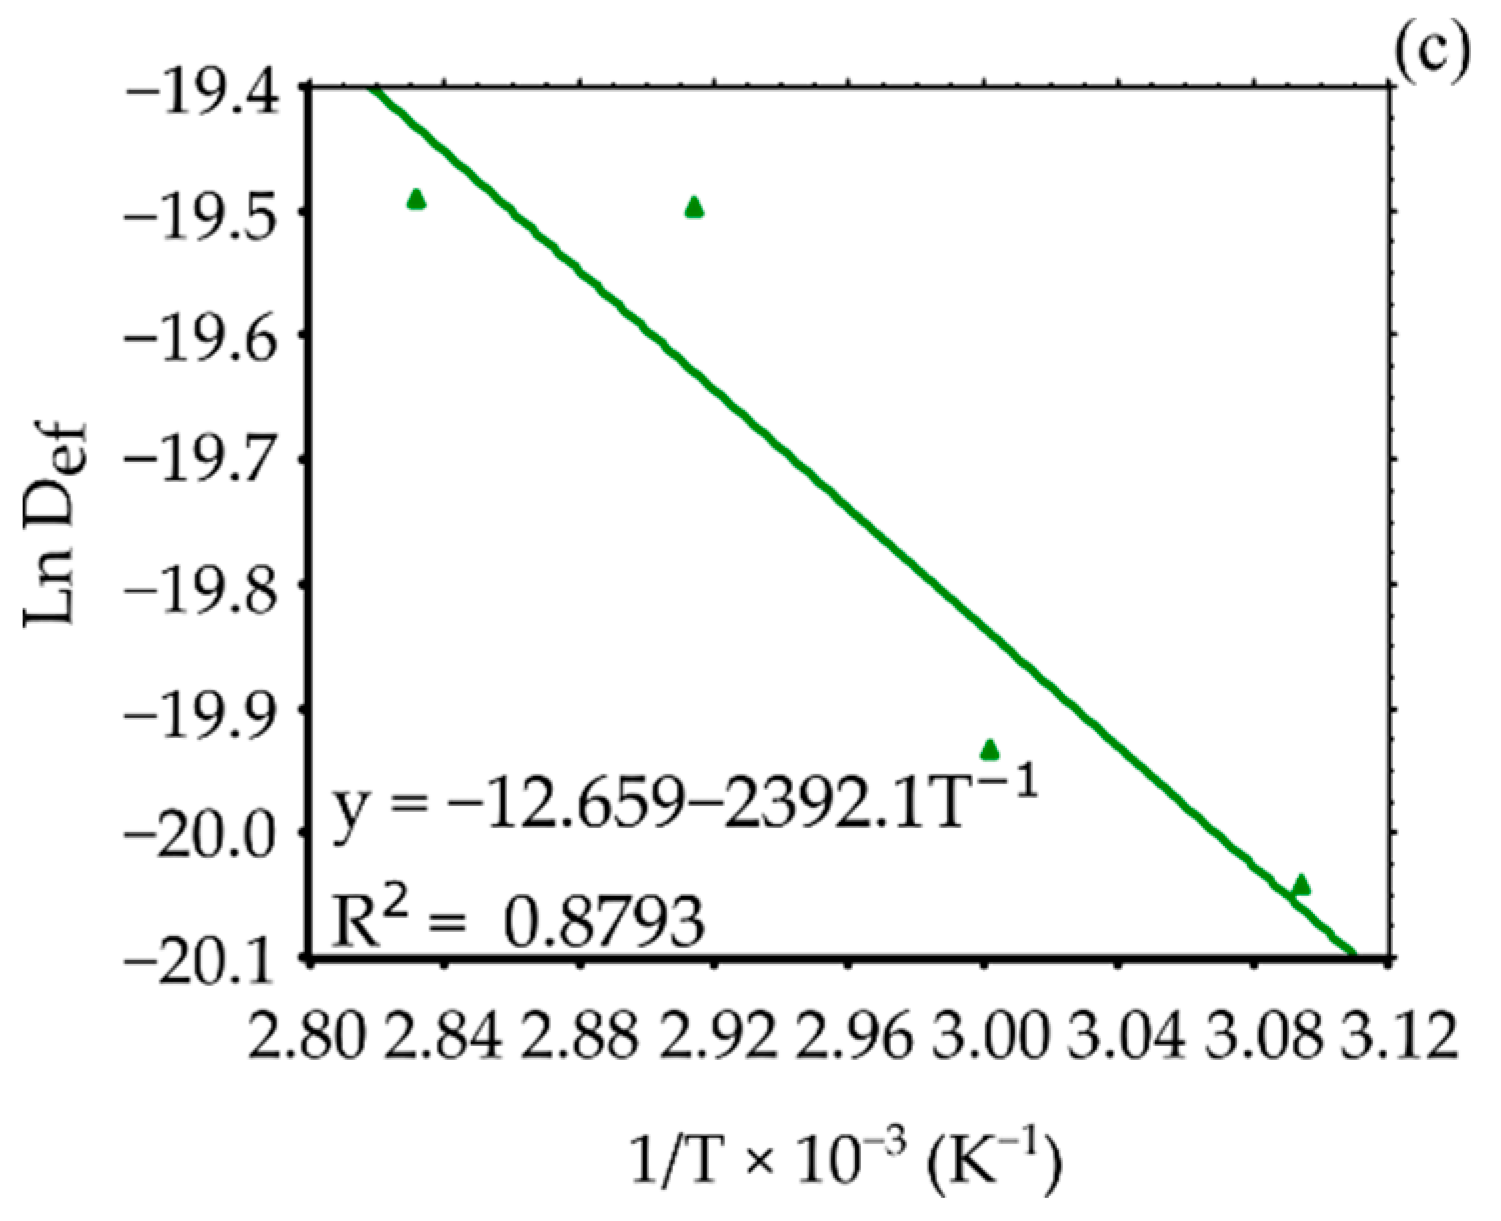
3.2. Diffusion Coefficient and Activation Energy
3.3. Thermodynamic Properties
3.4. Physicochemical Characterization
4. Conclusions
Author Contributions
Funding
Data Availability Statement
Acknowledgments
Conflicts of Interest
References
- Kokalis-Burelle, N.; McSorley, R.; Wang, K.-H.; Saha, S.K.; McGovern, R.J. Rhizosphere Microorganisms Affected by Soil Solarization and Cover Cropping in Capsicum Annuum and Phaseolus Lunatus Agroecosystems. Appl. Soil Ecol. 2017, 119, 64–71. [Google Scholar] [CrossRef]
- IBGE. Instituto Brasileiro de Geografia e Estatística. Produção Agrícola Municipal. IBGE, 2019. Available online: http://www.sidra.ibge.gov.br (accessed on 4 February 2019).
- E Lacerda, R.R.; do Nascimento, E.S.; de Lacerda, J.T.J.G.; da Silva Pinto, L.; Rizzi, C.; Bezerra, M.M.; Pinto, I.R.; Filho, S.M.P.; de Paulo Texeira Pinto, V.; Filho, G.C.; et al. Lectin from Seeds of a Brazilian Lima Bean Variety (Phaseolus lunatus L. Var. Cascavel) Presents Antioxidant, Antitumour and Gastroprotective Activities. Int. J. Biol. Macromol. 2017, 95, 1072–1081. [Google Scholar] [CrossRef] [PubMed]
- Da Silva, S.I.A.; Souza, T.; Santos, D.; da Silva Souza, R.F. Avaliação Dos Componentes de Produção Em Variedades Crioulas de Fava Cultivadas No Agreste da Paraíba. Rev. De Ciências Agrárias 2019, 42, 731–742. [Google Scholar]
- Oshodi, A.A.; Aletor, V.A. Functional Properties of Haemagglutinins (Lectins) Extracted from Some Edible Varieties of Lima Beans (Phaseolus lunatus Linn). Int. J. Food Sci. Nutr. 1993, 44, 133–136. [Google Scholar] [CrossRef]
- Abarshi, M.M.; Abubakar, A.L.; Garba, A.; Mada, S.B.; Ibrahim, A.B.; Maruthi, M.N. Molecular Detection and Characterisation of Horsegram Yellow Mosaic Virus (HgYMV) Infecting Lima Bean (Phaseolus lunatus) in India. Niger. J. Biotechnol. 2017, 33, 41–48. [Google Scholar] [CrossRef]
- Suriya, M.; Baranwal, G.; Bashir, M.; Reddy, C.K.; Haripriya, S. Influence of Blanching and Drying Methods on Molecular Structure and Functional Properties of Elephant Foot Yam (Amorphophallus paeoniifolius) Flour. LWT—Food Sci. Technol. 2016, 68, 235–243. [Google Scholar] [CrossRef]
- Hidar, N.; Ouhammou, M.; Mghazli, S.; Idlimam, A.; Hajjaj, A.; Bouchdoug, M.; Jaouad, A.; Mahrouz, M. The Impact of Solar Convective Drying on Kinetics, Bioactive Compounds and Microstructure of Stevia Leaves. Renew. Energy 2020, 161, 1176–1183. [Google Scholar] [CrossRef]
- Santos, K.C.; Guedes, J.S.; Rojas, M.L.; Carvalho, G.R.; Augusto, P.E.D. Enhancing Carrot Convective Drying by Combining Ethanol and Ultrasound as Pre-Treatments: Effect on Product Structure, Quality, Energy Consumption, Drying and Rehydration Kinetics. Ultrason. Sonochem. 2021, 70, 105304. [Google Scholar] [CrossRef]
- Onwude, D.I.; Hashim, N.; Janius, R.B.; Nawi, N.M.; Abdan, K. Modeling the Thin-Layer Drying of Fruits and Vegetables: A Review. Compr. Rev. Food Sci. Food Saf. 2016, 15, 599–618. [Google Scholar] [CrossRef]
- Castro, A.M.; Mayorga, E.Y.; Moreno, F.L. Mathematical Modelling of Convective Drying of Fruits: A Review. J. Food Eng. 2018, 223, 152–167. [Google Scholar] [CrossRef]
- Santos, N.C.; Almeida, R.L.J.; da Silva, G.M.; Monteiro, S.S.; André, A.M.M.C.N. Effect of Ultrasound Pre-Treatment on the Kinetics and Thermodynamic Properties of Guava Slices Drying Process. Innov. Food Sci. Emerg. Technol. 2020, 66, 102507. [Google Scholar] [CrossRef]
- De Oliveira, D.E.C.; Resende, O.; Chaves, T.H.; Souza, K.A.; de Souza Smaniotto, T.A. Propriedades Termodinâmicas Das Sementes de Pinhão-Manso. Biosci. J. 2014, 30, 147–157. [Google Scholar]
- De Farias Leite, D.D.; de Melo Queiroz, A.J.; de Figueirêdo, R.M.F.; Lima, L.S.L. Mathematical Drying Kinetics Modeling of Jackfruit Seeds (Artocarpus heterophyllus Lam.). Rev. Ciência Agronômica 2019, 50, 361–369. [Google Scholar] [CrossRef]
- Ministério da Agricultura, Pecuária e Abastecimento. Regras Para Análise De Sementes; Ministério da Agricultura: Brasília, Brazil, 2009; 399p.
- Saleh, H.M.; Hassan, A.A.; Mansour, E.H.; Fahmy, H.A.; El-Bedawey, A.E.-F.A. Melatonin, Phenolics Content and Antioxidant Activity of Germinated Selected Legumes and Their Fractions. J. Saudi Soc. Agric. Sci. 2019, 18, 294–301. [Google Scholar] [CrossRef]
- Setia, R.; Dai, Z.; Nickerson, M.T.; Sopiwnyk, E.; Malcolmson, L.; Ai, Y. Impacts of Short-Term Germination on the Chemical Compositions, Technological Characteristics and Nutritional Quality of Yellow Pea and Faba Bean Flours. Food Res. Int. 2019, 122, 263–272. [Google Scholar] [CrossRef] [PubMed]
- Brasil Ministério da Saúde; Agência Nacional De Vigilância Sanitária. Métodos Químicos E Físico-Químicos Para Análise de Alimentos; Ministério da Saúde: Brasilia, Brazil, 2005; p. 1017f.
- Lewis, W.K. The rate of drying of solid materials. J. Ind. Eng. Chem. 1921, 13, 427–432. [Google Scholar] [CrossRef]
- Page, G.E. Factors Influencing the Maximum Rate of Air Drying Shelled Corn in Thin-Layers. Master’s Thesis, Purdue University, West Lafayette, IN, USA, 1949. [Google Scholar]
- Henderson, S.M.; Pabis, S. Grain drying theory I: Temperature effect on drying coefficient. J. Agric. Eng. Res. 1961, 6, 169–174. [Google Scholar]
- Karathanos, V.T. Determination of water content of dried fruits by drying kinetics. J. Food Eng. 1999, 39, 337–344. [Google Scholar] [CrossRef]
- Thompson, T.L.; Peart, P.M.; Foster, G.H. Mathematical simulation of corn drying: A new model. Trans. ASAE 1968, 11, 582–586. [Google Scholar] [CrossRef]
- Yagcioglu, A.; Degirmencioglu, A.; Cagatay, F. Drying characteristics of laurel leaves under different conditions. In Proceedings of the 7th International Congress on Agricultural Mechanization and Energy, Adana, Turkey, 26–27 May 1999; pp. 565–569. [Google Scholar]
- Henderson, S.M. Progress in developing the thin layer drying equation. Trans. ASAE 1974, 17, 1167–1168. [Google Scholar] [CrossRef]
- Midilli, A.; Kucuk, H.; Yapar, Z. A New Model for Single-Layer Drying. Dry. Technol. 2002, 20, 1503–1513. [Google Scholar] [CrossRef]
- Sharaf-Eldeen, Y.I.; Blaisdell, J.L.; Hamdy, M.Y. A model for ear corn drying. Trans. ASAE 1980, 23, 1261–1265. [Google Scholar] [CrossRef]
- Verma, L.R.; Bucklin, R.A.; Endan, J.B.; Wratten, F.T. Effects of Drying Air Parameters on Rice Drying Models. Trans. ASAE 1985, 28, 296–301. [Google Scholar] [CrossRef]
- Crank, J. The Mathematics of Diffusion, 1st ed.; Clarendon Press: Oxford, UK, 1975. [Google Scholar]
- Da Silva, H.W.; Rodovalho, R.S.; Velasco, M.F.; Silva, C.F.; Vale, L.S.R. Kinetics and Thermodynamic Properties Related to the Drying of “Cabacinha” Pepper Fruits. Rev. Bras. Eng. Agrícola Ambient. 2016, 20, 174–180. [Google Scholar] [CrossRef] [Green Version]
- Miller, G.L. Use of Dinitrosalicylic Acid Reagent for Determination of Reducing Sugar. Anal. Chem. 1959, 31, 426–428. [Google Scholar] [CrossRef]
- Yemm, E.W.; Willis, A.J. The Estimation of Carbohydrates in Plant Extracts by Anthrone. Biochem. J. 1954, 57, 508–514. [Google Scholar] [CrossRef] [Green Version]
- De Assis Santos e Silva, F.; de Azevedo, C.A.V. The Assistat Software Version 7.7 and Its Use in the Analysis of Experimental Data. Afr. J. Agric. Res. 2016, 11, 3733–3740. [Google Scholar] [CrossRef] [Green Version]
- Da Silva, E.C.O.; da Silva, W.P.; Gomes, J.P.; Silva, C.M.D.P.S.; Alexandre, H.V.; Farias, V.S.O.; de Melo, B.A.; Queiroz, A.J.M.; de Figuiredo, R.M.F. Drying of Albedo and Whole Peel of Yellow Passion Fruit. J. Agric. Sci. 2019, 11, 501. [Google Scholar] [CrossRef]
- Lisboa, H.M.; Araujo, H.; Paiva, G.; Oriente, S.; Pasquali, M.; Duarte, M.E.; Mata, M.E.R.M.C. Determination of Characteristic Properties of Mulatto Beans (Phaseolus vulgaris L.) during Convective Drying. J. Agric. Food Res. 2019, 1, 100003. [Google Scholar] [CrossRef]
- Rahmanian-Koushkaki, H.; Nourmohamadi-Moghadami, A.; Zare, D.; Karimi, G. Experimental and Theoretical Investigation of Hot Air- Infrared Thin Layer Drying of Corn in a Fixed and Vibratory Bed Dryer. Eng. Agric. Environ. Food 2017, 10, 191–197. [Google Scholar] [CrossRef]
- Zielinska, M.; Michalska, A. Microwave-Assisted Drying of Blueberry (Vaccinium corymbosum L.) Fruits: Drying Kinetics, Polyphenols, Anthocyanins, Antioxidant Capacity, Colour and Texture. Food Chem. 2016, 212, 671–680. [Google Scholar] [CrossRef] [PubMed]
- Chielle, D.P.; Bertuol, D.A.; Meili, L.; Tanabe, E.H.; Dotto, G.L. Convective Drying of Papaya Seeds (Carica papaya L.) and Optimization of Oil Extraction. Ind. Crops Prod. 2016, 85, 221–228. [Google Scholar] [CrossRef]
- Hasan, A.A.M.; Bala, B.K.; Rowshon, M.K. Thin Layer Drying of Hybrid Rice Seed. Eng. Agric. Environ. Food 2014, 7, 169–175. [Google Scholar] [CrossRef]
- Chaji, H.; Hedayatizadeh, M. Quality Assessment and Kinetics of Dehydrated Watermelon Seeds: Part 1. Eng. Agric. Environ. Food 2017, 10, 178–185. [Google Scholar] [CrossRef]
- Hemis, M.; Choudhary, R.; Gariépy, Y.; Raghavan, V.G.S. Experiments and Modelling of the Microwave Assisted Convective Drying of Canola Seeds. Biosyst. Eng. 2015, 139, 121–127. [Google Scholar] [CrossRef]
- De Melo Silva, L.M.; de Sousa, F.C.; de Sousa, E.P.; Cavalcanti Mata, M.E.R.M.; Duarte, M.E.M. Modelos de Predição da Cinética de Secagem Dos Grãos de Guandu. Braz. J. Food Technol. 2014, 17, 310–318. [Google Scholar] [CrossRef] [Green Version]
- De Lima Ferreira, J.P.; de Melo Queiroz, A.J.; de Figueirêdo, R.M.F.; da Silva, W.P.; Gomes, J.P.; da Costa Santos, D.; Paiva, Y.F.; do Nascimento Silva, S.; Amadeu, L.T.S.; de Lima, T.L.B.; et al. Mathematical Modelling of Drying Kinetics and Effective Diffusivity of Germinated Pumpkin Seeds. Sylwan 2021, 165, 347–376. [Google Scholar]
- Madamba, P.S.; Driscoll, R.H.; Buckle, K.A. The Thin-Layer Drying Characteristics of Garlic Slices. J. Food Eng. 1996, 29, 75–97. [Google Scholar] [CrossRef]
- Guimarães, R.M.; de Oliveira, D.E.C.; Resende, O.; de Santana Silva, J.; de Rezende, T.A.M.; Egea, M.B. Thermodynamic Properties and Drying Kinetics of ‘Okara’. Rev. Bras. Eng. Agrícola Ambient. 2018, 22, 418–423. [Google Scholar] [CrossRef] [Green Version]
- Resende, O.; de Oliveira, D.E.C.; Costa, L.M.; Ferreira, W.N., Jr. Drying Kinetics of Baru Fruits (Dipteryx alata Vogel). Eng. Agrícola 2018, 38, 103–109. [Google Scholar] [CrossRef] [Green Version]
- Zogzas, N.P.; Maroulis, Z.B.; Marinos-Kouris, D. Moisture Diffusivity Data Compilation in Foodstuffs. Dry. Technol. 1996, 14, 2225–2253. [Google Scholar] [CrossRef]
- De Morais, M.F.; dos Santos, J.R.O.; dos Santos, M.P.; da Costa Santos, D.; da Costa, T.N.; Lima, J.B. Modeling and Thermodynamic Properties of ‘Bacaba’ Pulp Drying. Rev. Bras. Eng. Agrícola Ambient. 2019, 23, 702–708. [Google Scholar] [CrossRef] [Green Version]
- Shafaei, S.M.; Masoumi, A.A.; Roshan, H. Analysis of Water Absorption of Bean and Chickpea during Soaking Using Peleg Model. J. Saudi Soc. Agric. Sci. 2016, 15, 135–144. [Google Scholar] [CrossRef] [Green Version]
- Carvalho Lago, C.; Noreña, C.P.Z. Thermodynamic Analysis of Sorption Isotherms of Dehydrated Yacon (Smallanthus sonchifolius) Bagasse. Food Biosci. 2015, 12, 26–33. [Google Scholar] [CrossRef]
- Chen, J.; Wang, Y.; Lang, X.; Ren, X.; Fan, S. Evaluation of Agricultural Residues Pyrolysis under Non-Isothermal Conditions: Thermal Behaviors, Kinetics, and Thermodynamics. Bioresour. Technol. 2017, 241, 340–348. [Google Scholar] [CrossRef]
- Corrêa, J.L.G.; Rasia, M.C.; Mulet, A.; Cárcel, J.A. Influence of Ultrasound Application on Both the Osmotic Pretreatment and Subsequent Convective Drying of Pineapple (Ananas comosus). Innov. Food Sci. Emerg. Technol. 2017, 41, 284–291. [Google Scholar] [CrossRef]
- Silva, L.P.; dos Santos, S.G.F.; Queiroz, J.S.; Rodovalho, R.S.; Buso, W.H.D. Drying Kinetics of Soybean Grains. Científica 2020, 48, 99. [Google Scholar] [CrossRef]
- Ministério da Agricultura, Pecuária e Abastecimento. Regulamento Técnico Da Farinha De Mandioca; Ministério da Agricultura, Pecuária e Abastecimento: Brasília, Brazil, 2011; p. 6f.
- Ministério da Saúde. Agência Nacional De Vigilância Sanitária, Regulamento Técnico Para Produtos De Cereais, Amidos, Farinhas E Farelos; Ministério da Saúde: Brasília, Brazil, 2005; p. 6f.
- Khouryieh, H.; Aramouni, F. Physical and Sensory Characteristics of Cookies Prepared with Flaxseed Flour. J. Sci. Food Agric. 2012, 92, 2366–2372. [Google Scholar] [CrossRef] [PubMed]
- Santos, N.C.; da Silva, W.P.; Barros, S.L.; Almeida, R.L.J.; Brito Araújo, A.J.; da Silva Nascimento, A.P. Red Rice (Oryza sativa L.) Use in Flour Production: Convective Drying and Bioactive Quality. J. Food Process Eng. 2020, 43, e13490. [Google Scholar] [CrossRef]
- Olagunju, O.; Mchunu, N.; Durand, N.; Alter, P.; Montet, D.; Ijabadeniyi, O. Effect of Milling, Fermentation or Roasting on Water Activity, Fungal Growth, and Aflatoxin Contamination of Bambara Groundnut (Vigna subterranea (L.) Verdc). LWT 2018, 98, 533–539. [Google Scholar] [CrossRef]
- Dueñas, M.; Sarmento, T.; Aguilera, Y.; Benitez, V.; Mollá, E.; Esteban, R.M.; Martín-Cabrejas, M.A. Impact of Cooking and Germination on Phenolic Composition and Dietary Fibre Fractions in Dark Beans (Phaseolus vulgaris L.) and Lentils (Lens culinaris L.). LWT—Food Sci. Technol. 2016, 66, 72–78. [Google Scholar] [CrossRef]
- Singh, A.; Sharma, S.; Singh, B. Effect of Germination Time and Temperature on the Functionality and Protein Solubility of Sorghum Flour. J. Cereal Sci. 2017, 76, 131–139. [Google Scholar] [CrossRef]
- Xu, M.; Jin, Z.; Simsek, S.; Hall, C.; Rao, J.; Chen, B. Effect of Germination on the Chemical Composition, Thermal, Pasting, and Moisture Sorption Properties of Flours from Chickpea, Lentil, and Yellow Pea. Food Chem. 2019, 295, 579–587. [Google Scholar] [CrossRef] [PubMed]
- Silva, M.L.T.; Brinques, G.B.; Gurak, P.D. Utilização de Farinha de Subproduto de Brotos Para Elaboração de Massa Alimentícia Fresca. Braz. J. Food Technol. 2019, 22, e2018063. [Google Scholar] [CrossRef]
- Kadam, D.M.; Balasubramanian, S. Foam Mat Drying of Tomato Juice. J. Food Processing Preserv. 2011, 35, 488–495. [Google Scholar] [CrossRef]
- De Araújo, C.S.P.; de Andrade, F.H.A.; Galdino, P.O.; de Caldas Pinto, M.d.S. Desidratação de Batata-Doce Para Fabricação de Farinha. Agropecuária Cient. No Semiárido 2015, 11, 33–41. [Google Scholar]
- Reis, D.S.; Figueiredo Neto, A.; de Vasconcelos Ferraz, A.; de Freitas, S.T. Produção e Estabilidade de Conservação de Farinha de Acerola Desidratada Em Diferentes Temperaturas. Braz. J. Food Technol. 2017, 20. [Google Scholar] [CrossRef] [Green Version]
- Santos, N.C.; Silva, W.P.; Barros, S.L.; Araújo, A.J.B.; Gomes, J.P.; Almeida, R.L.J.; Nascimento, A.P.S.; Almeida, R.D.; e Silva, C.M.D.P.S.; Queiroz, A.J.M.; et al. Study on Drying of Black Rice (Oryza sativa L.) Grains: Physical-Chemical and Bioactive Quality. J. Agric. Sci. 2019, 11, 203. [Google Scholar] [CrossRef]
- Amadeu, L.T.S.; de Melo Queiroz, A.J.; de Figueirêdo, R.M.F.; Paiva, Y.F.; de Lima Ferreira, J.P.; dos Reis, C.G.; da Silva, R.C.; Araújo, K.T.A.; Coelho, N.O.; de Sá Carneiro, E.F. Farinha de Sementes Germinadas de Abóbora: Aspectos Físicos, Físico-Químicos e Colorimétricos. Res. Soc. Dev. 2021, 10, e18810313005. [Google Scholar] [CrossRef]
- De Rezende Queiroz, E.; de Abreu, C.M.P.; dos Santos, C.M.; Simão, A.A. Composição Química e Fitoquímica das Farinhas Da Casca e Da Semente de Lichias (Litchi chinensis Sonn) Cultivar “Bengal”. Ciência Rural 2015, 45, 329–334. [Google Scholar] [CrossRef]
- Sikorski, Z.E.; Pokorny, J.; Damodaran, S. Interações Físicas e Químicas Dos Componentes Dos Alimentos. In Química de Alimentos de Fennema; Damodaran, S., Parkin, K.L., Fennema, O.R., Eds.; Artmed: Porto Alegre, Brazil, 2010; Volume 1, p. 900. [Google Scholar]
- Moongngarm, A.; Saetung, N. Comparison of Chemical Compositions and Bioactive Compounds of Germinated Rough Rice and Brown Rice. Food Chem. 2010, 122, 782–788. [Google Scholar] [CrossRef]
- Driscoll, R. Food Dehydration. In Food Processing: Principles and Applications; Smith, J.S., Hui, Y.H., Eds.; Blackwell Publishing Professional: Ames, IA, USA, 2004; Volume 1. [Google Scholar]
- Núcleo de Estudos e Pesquisas em Alimentos. Tabela Brasileira de Composição de Alimentos (TACO); Universidade Estadual de Campinas: Campinas, Brazil, 2011; 164p. [Google Scholar]
- Cornejo, F.; Novillo, G.; Villacrés, E.; Rosell, C.M. Evaluation of the Physicochemical and Nutritional Changes in Two Amaranth Species (Amaranthus quitensis and Amaranthus caudatus) after Germination. Food Res. Int. 2019, 121, 933–939. [Google Scholar] [CrossRef] [PubMed]


| Model Name | Equation | References | |
|---|---|---|---|
| Newton | (2) | [19] | |
| Page | (3) | [20] | |
| Henderson and Pabis | (4) | [21] | |
| Modified Henderson and Pabis | (5) | [22] | |
| Thompson | (6) | [23] | |
| Logarithmic | (7) | [24] | |
| Two terms | (8) | [25] | |
| Midilli | (9) | [26] | |
| Approximation of Diffusion | (10) | [27] | |
| Two-term exponential | (11) | [27] | |
| Verma | (12) | [28] |
| Models | T (°C) | OVP | RS | B | ||||||
|---|---|---|---|---|---|---|---|---|---|---|
| R² | MSD | χ² | R² | MSD | χ² | R² | MSD | χ² | ||
| Newton | 50 | 0.9991 | 0.0119 | 1.4696 | 0.9984 | 0.0165 | 2.8440 | 0.9957 | 0.0262 | 7.1549 |
| 60 | 0.9975 | 0.0193 | 3.8834 | 0.9982 | 0.0162 | 2.7445 | 0.9953 | 0.0270 | 7.5771 | |
| 70 | 0.9980 | 0.0176 | 3.2418 | 0.9975 | 0.0190 | 3.7827 | 0.9961 | 0.0241 | 6.0580 | |
| 80 | 0.9970 | 0.0204 | 4.3462 | 0.9968 | 0.0212 | 4.6884 | 0.9940 | 0.0302 | 9.5150 | |
| Page | 50 | 0.9999 | 0.0040 | 0.1757 | 0.9999 | 0.0037 | 0.1518 | 0.9999 | 0.0038 | 0.1585 |
| 60 | 0.9999 | 0.0048 | 0.2529 | 0.9999 | 0.0041 | 0.1823 | 0.9998 | 0.0054 | 0.3176 | |
| 70 | 0.9998 | 0.0058 | 0.3726 | 0.9998 | 0.0055 | 0.3307 | 0.9997 | 0.0064 | 0.4415 | |
| 80 | 0.9997 | 0.0060 | 0.3912 | 0.9997 | 0.0064 | 0.4505 | 0.9998 | 0.0062 | 0.4183 | |
| Henderson and Pabis | 50 | 0.9994 | 0.0096 | 0.9975 | 0.9989 | 0.0124 | 1.6673 | 0.9970 | 0.0203 | 4.4385 |
| 60 | 0.9981 | 0.0156 | 2.6597 | 0.9987 | 0.0130 | 1.8245 | 0.9965 | 0.0219 | 5.2130 | |
| 70 | 0.9984 | 0.0157 | 2.7129 | 0.9980 | 0.0171 | 3.1914 | 0.9969 | 0.0216 | 5.0900 | |
| 80 | 0.9974 | 0.0188 | 3.8938 | 0.9974 | 0.0192 | 4.0333 | 0.9952 | 0.0271 | 7.9877 | |
| Modified Henderson and Pabis | 50 | 0.9994 | 0.0096 | 1.2073 | 0.9989 | 0.0124 | 2.0007 | 0.9970 | 0.0203 | 5.2840 |
| 60 | 0.9981 | 0.0156 | 3.2856 | 0.9987 | 0.0130 | 2.2086 | 0.9965 | 0.0219 | 6.2556 | |
| 70 | 0.9984 | 0.0157 | 3.3512 | 0.9980 | 0.0171 | 3.9006 | 0.9969 | 0.0216 | 6.2211 | |
| 80 | 0.9974 | 0.0188 | 4.8673 | 0.9974 | 0.0192 | 4.9823 | 0.9952 | 0.0271 | 9.7628 | |
| Thompson | 50 | 0.9974 | 0.0207 | 4.6441 | 0.9981 | 0.0174 | 3.2902 | 0.9953 | 0.0280 | 8.4414 |
| 60 | 0.9970 | 0.0221 | 5.3326 | 0.9974 | 0.0206 | 4.6071 | 0.9928 | 0.0350 | 13.2843 | |
| 70 | 0.9979 | 0.0180 | 3.5467 | 0.9973 | 0.0196 | 4.1802 | 0.9959 | 0.0247 | 6.6588 | |
| 80 | 0.9927 | 0.0315 | 10.9041 | 0.9957 | 0.0247 | 6.6753 | 0.9924 | 0.0339 | 12.5472 | |
| Logarithmic | 50 | 0.9994 | 0.0096 | 1.0440 | 0.9989 | 0.0124 | 1.7365 | 0.9971 | 0.0200 | 4.5178 |
| 60 | 0.9982 | 0.0155 | 2.7747 | 0.9987 | 0.0129 | 1.9020 | 0.9967 | 0.0216 | 5.2967 | |
| 70 | 0.9984 | 0.0157 | 2.8464 | 0.9980 | 0.0171 | 3.3336 | 0.9969 | 0.0214 | 5.2362 | |
| 80 | 0.9974 | 0.0188 | 4.0958 | 0.9974 | 0.0192 | 4.2343 | 0.9953 | 0.0268 | 8.2042 | |
| Two terms | 50 | 0.9994 | 0.0096 | 1.0925 | 0.9989 | 0.0124 | 1.8189 | 0.9970 | 0.0203 | 4.8277 |
| 60 | 0.9981 | 0.0156 | 2.9397 | 0.9987 | 0.0130 | 1.9983 | 0.9965 | 0.0219 | 5.6874 | |
| 70 | 0.9984 | 0.0157 | 2.9984 | 0.9980 | 0.0171 | 3.5105 | 0.9969 | 0.0216 | 5.5990 | |
| 80 | 0.9974 | 0.0188 | 4.3265 | 0.9974 | 0.0192 | 4.4578 | 0.9952 | 0.0271 | 8.7865 | |
| Midilli | 50 | 0.9999 | 0.0037 | 0.1628 | 0.9999 | 0.0033 | 0.1315 | 0.9999 | 0.0035 | 0.1467 |
| 60 | 0.9999 | 0.0046 | 0.2511 | 0.9999 | 0.0039 | 0.1771 | 0.9998 | 0.0050 | 0.2922 | |
| 70 | 0.9998 | 0.0055 | 0.3663 | 0.9998 | 0.0053 | 0.3409 | 0.9997 | 0.0062 | 0.4647 | |
| 80 | 0.9998 | 0.0057 | 0.3928 | 0.9997 | 0.0061 | 0.4523 | 0.9998 | 0.0060 | 0.4252 | |
| Approximation of Diffusion | 50 | 0.9999 | 0.0037 | 0.1547 | 0.9999 | 0.0033 | 0.1233 | 0.9999 | 0.0038 | 0.1615 |
| 60 | 0.9999 | 0.0044 | 0.2193 | 0.9999 | 0.0038 | 0.1599 | 0.9998 | 0.0059 | 0.3987 | |
| 70 | 0.9998 | 0.0055 | 0.3429 | 0.9983 | 0.0157 | 2.8032 | 0.9976 | 0.0191 | 4.1524 | |
| 80 | 0.9970 | 0.0204 | 4.8037 | 0.9977 | 0.0180 | 3.7214 | 0.9960 | 0.0247 | 6.9530 | |
| Two-term exponential | 50 | 0.9991 | 0.0122 | 1.6292 | 0.9983 | 0.0169 | 3.0821 | 0.9956 | 0.0265 | 7.5949 |
| 60 | 0.9974 | 0.0195 | 4.1739 | 0.9981 | 0.0165 | 2.9612 | 0.9952 | 0.0273 | 8.0462 | |
| 70 | 0.9979 | 0.0180 | 3.5331 | 0.9975 | 0.0190 | 3.9547 | 0.9960 | 0.0244 | 6.4809 | |
| 80 | 0.9998 | 0.0059 | 0.3800 | 0.9997 | 0.0061 | 0.4106 | 0.9939 | 0.0305 | 10.1270 | |
| Verna | 50 | 0.9999 | 0.0037 | 0.1547 | 0.9999 | 0.0033 | 0.1233 | 0.9957 | 0.0262 | 7.7511 |
| 60 | 0.9975 | 0.0193 | 4.2718 | 0.9982 | 0.0162 | 2.9940 | 0.9953 | 0.0270 | 8.2360 | |
| 70 | 0.9980 | 0.0176 | 3.5660 | 0.9975 | 0.0190 | 4.1430 | 0.9961 | 0.0241 | 6.6349 | |
| 80 | 0.9979 | 0.0170 | 3.3346 | 0.9968 | 0.0212 | 5.1572 | 0.9940 | 0.0302 | 10.4212 | |
| Variety | T (°C) | k | n |
|---|---|---|---|
| OVP | 50 | 0.0257 | 1.1067 |
| 60 | 0.0233 | 1.2085 | |
| 70 | 0.0339 | 1.1829 | |
| 80 | 0.0426 | 1.2444 | |
| RS | 50 | 0.0194 | 1.1591 |
| 60 | 0.0242 | 1.1731 | |
| 70 | 0.0342 | 1.2149 | |
| 80 | 0.0351 | 1.2453 | |
| B | 50 | 0.0138 | 1.2923 |
| 60 | 0.0151 | 1.3030 | |
| 70 | 0.0273 | 1.2749 | |
| 80 | 0.0211 | 1.3669 |
| Variety | T (°C) | Def × 10−9 (m²/s) | R² |
|---|---|---|---|
| OVP | 50 | 1.9763 | 0.9887 |
| 60 | 2.4541 | 0.9849 | |
| 70 | 3.2291 | 0.9874 | |
| 80 | 4.6411 | 0.9851 | |
| RS | 50 | 1.7890 | 0.9860 |
| 60 | 2.2939 | 0.9865 | |
| 70 | 3.5491 | 0.9868 | |
| 80 | 3.9182 | 0.9859 | |
| B | 50 | 1.9761 | 0.9809 |
| 60 | 2.2026 | 0.9810 | |
| 70 | 3.4098 | 0.9841 | |
| 80 | 3.4303 | 0.9805 |
| Variety | Ea (kJ/mol) | D0 (m²/s) | R² |
|---|---|---|---|
| OVP | 26.8085 | 4.0834 × 10⁻⁵ | 0.9801 |
| RS | 26.5233 | 3.4727 × 10⁻⁵ | 0.9577 |
| B | 19.8879 | 3.1788 × 10⁻⁶ | 0.8783 |
| Variety | T (°C) | ΔH (kJ/mol) | ΔS (kJ/mol K) | ΔG (kJ/mol) |
|---|---|---|---|---|
| OVP | 50 | 24.1218 | −0.3296 | 130.6312 |
| 60 | 24.0387 | −0.3299 | 133.9284 | |
| 70 | 23.9555 | −0.3301 | 137.2281 | |
| 80 | 23.8724 | −0.3303 | 140.5303 | |
| RS | 50 | 23.8367 | −0.3309 | 130.7812 |
| 60 | 23.7535 | −0.3312 | 134.0919 | |
| 70 | 23.6704 | −0.3314 | 137.4051 | |
| 80 | 23.5872 | −0.3317 | 140.7208 | |
| B | 50 | 17.2013 | −0.3508 | 130.5696 |
| 60 | 17.1181 | −0.3511 | 134.0791 | |
| 70 | 17.0350 | −0.3513 | 137.5911 | |
| 80 | 16.9518 | −0.3516 | 141.1056 |
| Drying Conditions | Water Content (g/100 g w.b.) | Water Activity (Decimal) | Ashes (g/100 g d.b.) | pH | Alcohol-Soluble Acidity (mL NaOH/100 g d.b.) | Total Sugars (g/100 g d.b.) | Reducing Sugars (g/100 g d.b.) | Crude Protein (g/100 g d.b.) | Starch (g/100 g d.b.) |
|---|---|---|---|---|---|---|---|---|---|
| OVP/FG | 52.73 ± 0.13 c | 0.996 ± 0.00 a | 4.11 ± 0.17 cde | 4.25 ± 0.02 h | 3.90 ± 0.00 c | 4.50 ± 0.34 i | 2.47 ± 0.04 h | 22.53 ± 0.85 ab | 45.41 ± 0.22 h |
| OVP/50 | 4.70 ± 0.07 e | 0.211 ± 0.00 d | 4.26 ± 0.10 cd | 4.44 ± 0.02 g | 0.58 ± 0.00 e | 10.54 ± 0.04 e | 2.26 ± 0.02 i | 24.62 ± 0.65 a | 54.35 ± 0.80 bcd |
| OVP/60 | 3.98 ± 0.05 f | 0.169 ± 0.01 f | 4.41± 0.16 abc | 4.48 ± 0.01 f | 0.38 ± 0.00 g | 10.49 ± 0.05 e | 2.29 ± 0.02 i | 24.07 ± 1.35 a | 52.36 ± 1.74 def |
| OVP/70 | 2.69 ± 0.08 hi | 0.130 ± 0.00 h | 4.69 ± 0.09 ab | 4.49 ± 0.01 f | 0.38 ± 0.00 ij | 10.22 ± 0.07 ef | 2.35 ± 0.03 hi | 22.52 ± 0.50 ab | 55.31 ± 0.67 b |
| OVP/80 | 2.53 ± 0.07 i | 0.119 ± 0.00 i | 4.80 ± 0.05 a | 4.50 ± 0.02 f | 0.38 ± 0.00 jl | 9.85 ± 0.11 f | 2.40 ± 0.01 hi | 23.74 ± 0.87 a | 49.75 ± 0.67 g |
| RS/FG | 56.27 ± 0.21 b | 0.998 ± 0.00 a | 4.12 ± 0.13 cde | 4.28 ± 0.02 h | 4.21 ± 0.00 b | 6.79 ± 0.03 g | 3.20 ± 0.10 fg | 23.20 ± 0.73 a | 55.58 ± 0.30 b |
| RS/50 | 4.22 ± 0.06 f | 0.244 ± 0.00 b | 3.85 ± 0.03 ef | 4.60 ± 0.01 de | 0.38 ± 0.00 g | 12.28 ± 0.06 c | 3.16 ± 0.01 g | 13.83 ± 0.64 d | 53.00 ± 0.75 cde |
| RS/60 | 3.23 ± 0.06 g | 0.199 ± 0.00 e | 3.56 ± 0.15 f | 4.70 ± 0.01 c | 0.38 ± 0.00 h | 12.10 ± 0.11 c | 3.37 ± 0.07 e | 10.71 ± 0.38 e | 52.66 ± 0.60 de |
| RS/70 | 2.32 ± 0.06 ij | 0.146 ± 0.00 g | 3.89 ± 0.11 def | 4.80 ± 0.01 b | 0.38 ± 0.00 jl | 11.72 ± 0.06 d | 3.89 ± 0.02 b | 9.89 ± 0.64 e | 55.06 ± 0.67 bc |
| RS/80 | 1.55 ± 0.04 l | 0.118 ± 0.00 i | 3.91 ± 0.13 def | 4.84 ± 0.01 a | 0.37 ± 0.00 m | 11.66 ± 0.12 h | 4.20 ± 0.05 a | 13.91 ± 0.23 d | 50.17 ± 0.96 fg |
| B/FG | 62.64 ± 0.21 a | 0.996 ± 0.00 a | 4.20 ± 0.12 cde | 4.27 ± 0.03 h | 4.91 ± 0.00 a | 6.26 ± 0.04 h | 3.65 ± 0.07 cd | 25.35 ± 0.63 a | 61.88 ± 0.32 a |
| B/50 | 5.18 ± 0.02 d | 0.222 ± 0.00 c | 4.37 ± 0.02 bc | 4.46 ± 0.02 fg | 0.58 ± 0.00 d | 14.27 ± 0.20 ª | 3.75 ± 0.02 bc | 8.40 ± 0.45 e | 51.15 ± 0.69 efg |
| B/60 | 4.06 ± 0.02 f | 0.193 ± 0.00 e | 4.39 ± 0.15 bc | 4.56 ± 0.02 e | 0.58 ± 0.00 f | 13.90 ± 0.08 a | 3.58 ± 0.04 d | 10.04 ± 0.66 e | 53.43 ± 0.00 bcd |
| B/70 | 3.00 ± 0.04 gh | 0.135 ± 0.00 h | 4.08 ± 0.21 cde | 4.58 ± 0.01 de | 0.38 ± 0.00 hi | 13.25 ± 0.04 b | 3.32 ± 0.06 ef | 19.47 ± 0.48 c | 49.98 ± 0.68 g |
| B/80 | 2.14 ± 0.05 j | 0.111 ± 0.00 i | 4.07 ± 0.11 cd e | 4.62 ± 0.00 d | 0.38 ± 0.00 l | 10.41 ± 0.19 e | 3.42 ± 0.02 e | 19.84 ± 0.78 bc | 49.54 ± 0.67 g |
Publisher’s Note: MDPI stays neutral with regard to jurisdictional claims in published maps and institutional affiliations. |
© 2022 by the authors. Licensee MDPI, Basel, Switzerland. This article is an open access article distributed under the terms and conditions of the Creative Commons Attribution (CC BY) license (https://creativecommons.org/licenses/by/4.0/).
Share and Cite
Amadeu, L.T.S.; Queiroz, A.J.d.M.; Figueirêdo, R.M.F.d.; Ferreira, J.P.d.L.; Silva, W.P.d.; Gomes, J.P.; Paiva, Y.F.; Costa, C.C.; Moura, H.V.; Santos, D.d.C.; et al. Controlled Germination of Faba Beans: Drying, Thermodynamic Properties and Physical-Chemical Composition. Processes 2022, 10, 1460. https://doi.org/10.3390/pr10081460
Amadeu LTS, Queiroz AJdM, Figueirêdo RMFd, Ferreira JPdL, Silva WPd, Gomes JP, Paiva YF, Costa CC, Moura HV, Santos DdC, et al. Controlled Germination of Faba Beans: Drying, Thermodynamic Properties and Physical-Chemical Composition. Processes. 2022; 10(8):1460. https://doi.org/10.3390/pr10081460
Chicago/Turabian StyleAmadeu, Lumara Tatiely Santos, Alexandre José de Melo Queiroz, Rossana Maria Feitosa de Figueirêdo, João Paulo de Lima Ferreira, Wilton Pereira da Silva, Josivanda Palmeira Gomes, Yaroslávia Ferreira Paiva, Caciana Cavalcanti Costa, Henrique Valentim Moura, Dyego da Costa Santos, and et al. 2022. "Controlled Germination of Faba Beans: Drying, Thermodynamic Properties and Physical-Chemical Composition" Processes 10, no. 8: 1460. https://doi.org/10.3390/pr10081460
APA StyleAmadeu, L. T. S., Queiroz, A. J. d. M., Figueirêdo, R. M. F. d., Ferreira, J. P. d. L., Silva, W. P. d., Gomes, J. P., Paiva, Y. F., Costa, C. C., Moura, H. V., Santos, D. d. C., Lima, A. R. C. d., & Silva, H. A. (2022). Controlled Germination of Faba Beans: Drying, Thermodynamic Properties and Physical-Chemical Composition. Processes, 10(8), 1460. https://doi.org/10.3390/pr10081460