Abstract
Medical materials are the most important, fundamental resources necessary for emergency relief of major infectious disease disasters. The scientific and optimal allocation of emergency medical materials is the key to reducing casualties and losses in epidemic regions, and to improving the effectiveness and efficiency of rescue operations. In response to the cross-border characteristics of major infectious diseases, the imbalance of material storage, and the differences of supply across regions, a multi-objective optimization model for a multi-regional collaborative allocation of emergency medical materials was developed. Then, an improved adaptive genetic algorithm (IAGA) was designed and applied to solve the proposed model. Finally, a case study of the collaborative response to the COVID-19 epidemic in the Yangtze River Delta of China was conducted for model verification. The results show that collaborative allocation can improve the material satisfaction rate at demand points, especially under peak demand pressure during the early stage of the response, and can meet all material needs at all demand points in the shortest possible amount of time. The proposed model can achieve the effective integration and mutual sharing of emergency materials across regions, and improve the efficiency of emergency material utilization and rescue efforts. The material allocation scheme considers the difference coefficients in different regions, which is conducive to enhancing the flexibility of decision-making and the practical applicability of collaborative allocation operations. A comparative analysis of the algorithms shows that the proposed IAGA is an effective method for managing large-scale multi-regional emergency material allocation optimization problems, as it has higher solving efficiency, better convergence, and stronger stability.
1. Introduction
Major infectious disease outbreaks have occurred in all corners of the globe in recent years, including the SARS virus in 2003, H1N1 influenza in 2009, the Ebola epidemic in West Africa in 2014, and the global COVID-19 emergency, which began in 2019. These diseases have caused severe casualties and economic and property losses, seriously impacting entire societies [1,2]. The governments of many countries have attached great importance to the emergency management of large-scale infectious diseases [3].
Infectious disease outbreaks tend to be unexpected, sudden, and largely unavoidable. However, their impacts and losses can be significantly reduced by an effective allocation plan for emergency medical materials [4,5]. The fundamental objective of emergency management operations in response to major infectious diseases is to minimize the casualties and losses in the epidemic region. In the epidemic response and rescue process, emergency medical materials play a vital role in reducing casualties and infections in the affected region and in improving the effectiveness and efficiency of disease treatment, in general [6]. Compared with traditional intraregional resource allocation problems, the cross-regional collaborative allocation of emergency materials constitutes a new research topic. There are many inherent challenges to the cross-regional collaborative allocation of emergency medical materials for responding to major infectious diseases. Due to the suddenness of major infectious diseases and the speed of their spread, a large amount of time-sensitive and non-substitutable medical rescue supplies must be swiftly distributed after the outbreak; but in practice, different types of materials tend to be unevenly distributed, and the storage and availability of these materials widely differ across different regions or cities [7]. Furthermore, different infectious diseases have disparate incubation periods, making it impossible to accurately and immediately obtain relevant information regarding the medical materials necessary for emergency response. The spread of a major infectious disease can easily cross political, functional, and geographic boundaries, rendering traditional crisis response strategies incapable of reaching the desired effects across borders due to structural obstacles [8]. Therefore, in this context, the formulation of a scientific and reasonable multi-regional collaborative optimization emergency medical material allocation plan to maximize the utilization efficiency and effectiveness of medical materials during a major infectious disease epidemic is a practical problem that urgently needs to be solved.
Many previous researchers have explored the issue of medical material allocation in emergency logistics scenarios in recent years, as the frequency and severity of disasters have continued to increase [9]. Emergency medical materials are different from general goods in that they have uncertain demand characteristics, tight delivery deadlines, and low substitutability [6]. Most of the existing research is concerned with constructing and solving models to support decision-making regarding emergency medical material allocation [10,11,12,13]. For example, Pan et al. [14] proposed a model for allocating emergency medical materials according to injury severity, and validated their method based on an earthquake disaster. Li and Zheng [15] constructed an integrated optimization model that accounts for emergency repair scheduling in earthquake disaster-affected road networks and the allocation of rescue materials. The capacity of the proposed model to improve emergency rescue performance was verified based on the Wenchuan earthquake. Chen et al. [16] proposed an anti-influenza drug allocation optimization method based on demand predictions. Arora et al. [17] considered maximum success rate as the goal in an emergency medical material allocation scenario, and proposed an allocation model based on cost constraints. Büyüktahtakın et al. [18] established an optimization model for emergency material allocation site selection based on the 2014 Ebola epidemic in West Africa. Tallon et al. [19] presented that, after the disaster, there may be a shortage of medical supplies, and injured people may need treatment more than other affected people, so they evaluated the equity of the emergency medical material plan according to the 24-h mortality rate. Sun et al. [20] considered rescue vehicles, medical facility capacities, survival probabilities, and victims’ psychological states for establishing a site selection and victim transfer model for earthquake disaster relief; their model was designed to minimize the psychological cost of the victims and maximize the number of survivors. Liu et al. [21] established an emergency logistics network optimization model for infectious diseases based on site selection and service levels. Ni and Zhao [22] proposed an emergency medical resource allocation model considering delay cost and penalty cost, focusing on the allocation of medical resources in the initial emergency rescue stage of sudden natural disasters. However, these studies focused primarily on the intra-regional allocation of emergency medical materials, ignoring the importance of multi-regional collaborative allocation of emergency medical resources during large-scale disaster relief operations.
Considering the actual needs of emergency rescue operations, the importance of multi-regional collaborative emergency planning has gradually attracted the attention of scholars [23]. The existing research mainly focuses on the regional collaborative mode [24], influencing factors [25,26] and collaborative mechanism [27]. However, the existing research on the multi-regional collaborative allocation model of emergency materials is mainly based on the rescue operations for natural disasters and accidents. For example, Cao et al. [28] proposed a cross-regional emergency material allocation model for natural disasters centered on equity, which considers survivors’ risk acceptability and perceived satisfaction. Wang [29] developed a multiperiod allocation optimization model for emergency materials based on regional self-rescue and cross-regional collaborative rescue efforts, and took the case study based on the Wenchuan Earthquake as an example for verifying the effectiveness of cross-regional emergency material collaborative allocation. Qiu et al. [30] constructed a regional collaborative response strategy selection model based on evolutionary game theory for accidents and disasters, mainly discussing the impact of vertical administrative constraints on cross-regional collaboration, and analyzed the collaborative strategy selection and evolution path of local governments. Lv et al. [31] proposed a trans-regional petroleum emergency allocation model based on super-network theory, whose optimization objective is to ensure the lowest allocation cost and delivery time.
In summary, it is crucial to consider multi-regional collaborative allocation of emergency medical materials for large-scale disaster emergency rescue operations. This brief review of the research regarding medical material allocation and regional collaborative rescue operations provides a theoretical basis for our proposed multi-regional collaborative allocation model of emergency medical materials. However, there are still gaps in the existing research. Firstly, previous research on the allocation of emergency medical materials is mostly based on the intra-regional emergency rescue mode, ignoring the cross-border nature of the spread of major infectious diseases, and rarely considering the particularity of the emergency medical logistics involved in supply allocation during an epidemic. Secondly, although the advantages of multi-regional collaborative emergency response have gradually been studied by some researchers, most of the relevant literature are qualitative studies, regarding the mode or mechanism of regional collaborative emergency response, while the current modeling research on multi-regional collaborative allocation of emergency materials mostly focuses on natural disasters (e.g., earthquakes) and safety accidents. Finally, existing multi-regional emergency medical resource allocation modeling analyses have rarely considered both the efficiency and equity of multiple emergency periods in their decision-making criteria and objectives.
Therefore, this study proposes a multi-regional collaborative optimal allocation model of emergency medical materials that is specifically applied to emergency rescue operations for major infectious diseases. The proposed model can simultaneously consider capture efficiency goals (allocation time and cost) and equity goals (system loss). The main contributions of this work can be summarized as follows:
- A multi-objective optimization model for emergency medical material collaborative allocation is formulated, which simultaneously considers time, cost, and loss, and the trade-off between these three decision criteria is explored.
- A multi-regional collaborative allocation approach of emergency medical materials is proposed, which considers a variety of the difference coefficients in different regions, including the vulnerability and importance of demand points, the urgency of demand, the vulnerability of victims, and the timeliness of emergency medical materials.
- An IAGA algorithm is developed to solve the model so that decision-makers can handily select the best possible emergency medical material allocation strategy.
- The advantages of multi-regional collaborative allocation for improving rescue efficiency and effectiveness are illustrated through the case of the collaborative response to the COVID-19 epidemic in the Yangtze River Delta of China.
2. Model and Method
2.1. Problem Description
Major infectious diseases spread across multiple regions, regardless of borders. The response to these epidemics should not occur only within a certain region; it is a problem shared by multiple affected regions. The outbreak of a major infectious disease can cause rapid spread across regions, each possessing different quantities and types of medical materials, and with different respective abilities to procure and reserve different materials. The demand for certain medical materials also varies across different regions due to the severity of the epidemic and the characteristics of the victims. Certain types of materials may be in extremely short supply in a certain region while other regions have a surplus. In this study, the unique characteristics of different regions, victims, demands, and materials affecting epidemic emergency response operations were taken into account to develop a medical material allocation model. The proposed model was designed to be multi-regional, collaborative, scientific, and able to promote the effective and efficient sharing of emergency medical materials in multiple periods. The issue of optimization for a multi-regional and multi-periodic collaborative allocation of emergency medical materials for major infectious diseases in this article is shown in Figure 1.
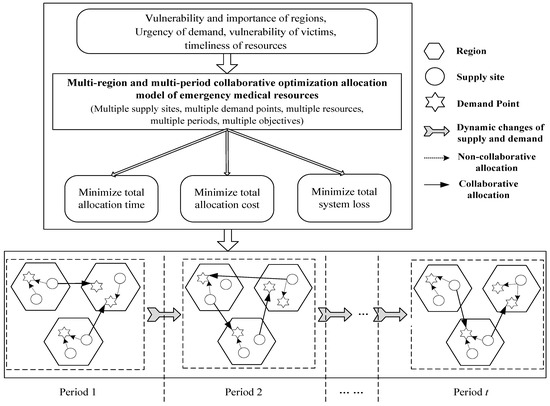
Figure 1.
Multi-regional and multi-periodic collaborative optimal allocation of emergency medical materials.
2.2. Research Hypothesis
The following basic assumptions were made in developing the proposed model:
- (1)
- The regions are independent of each other and the medical materials for emergency rescue can be transported to each region; all vehicles transporting materials are the same.
- (2)
- The available supply of materials at the supply site within each region in each period is known, and the demand at the affected point within each region in each time period can be estimated through the existing technology and information. The distance from supply site to demand point is known, as well.
- (3)
- Seven days is regarded as one emergency period, and the material requirements of each demand point can be fully satisfied following an entire emergency material allocation period.
2.3. Mathematical Model
The notations listed in Table 1 are used throughout this article.

Table 1.
Notation.
Based on the above-mentioned notations, a multi-regional collaborative optimal allocation model of emergency medical materials for major infectious diseases is formulated:
- The first objective is to minimize the total time necessary for the collaborative allocation of emergency medical materials, including route transportation time, loading time at the supply site, and unloading time at the demand point.
- The second objective is to minimize the total cost of collaborative emergency medical material allocation, including fixed transportation costs, variable allocation costs, and penalty costs for material shortages.
- The third objective is to minimize the total system loss caused by unmet materials at all demand points.
The constraints for the proposed multi-objective optimization model are as follows.
Constraint (4) indicates that the probability of the quantity of emergency medical materials allocated to a demand point by a supply site in each period does not exceed its real material demand in that period under the confidence level . That is, the materials cannot be allocated prior to the demand arising. Constraint (5) indicates the material flow conservation limit at the supply site in each period. That is, the sum of the inventory in the previous period and the latest amount raised in this period is equal to the sum of the allocated amount in this period and the remaining inventory at the end of the period. Constraint (6) requires that the demand for emergency medical materials at each demand point be satisfied to the greatest extent possible in each period. Constraint (7) indicates that, if the supply site allocates materials to the demand point, the corresponding transportation cost must be paid; it also reflects the capacity limitation. Constraint (8) indicates that the material allocation satisfaction rate at each demand point in each period must not be lower than the preset minimum value. Constraint (9) is an expression of the shortage or unsatisfied amount of emergency medical materials at each demand point in each period. Constraint (10) requires that the binary variables must be equal to 0 or 1. Constraints (11) and (12) indicate the nonnegativity of decision variables.
2.4. Solution Method
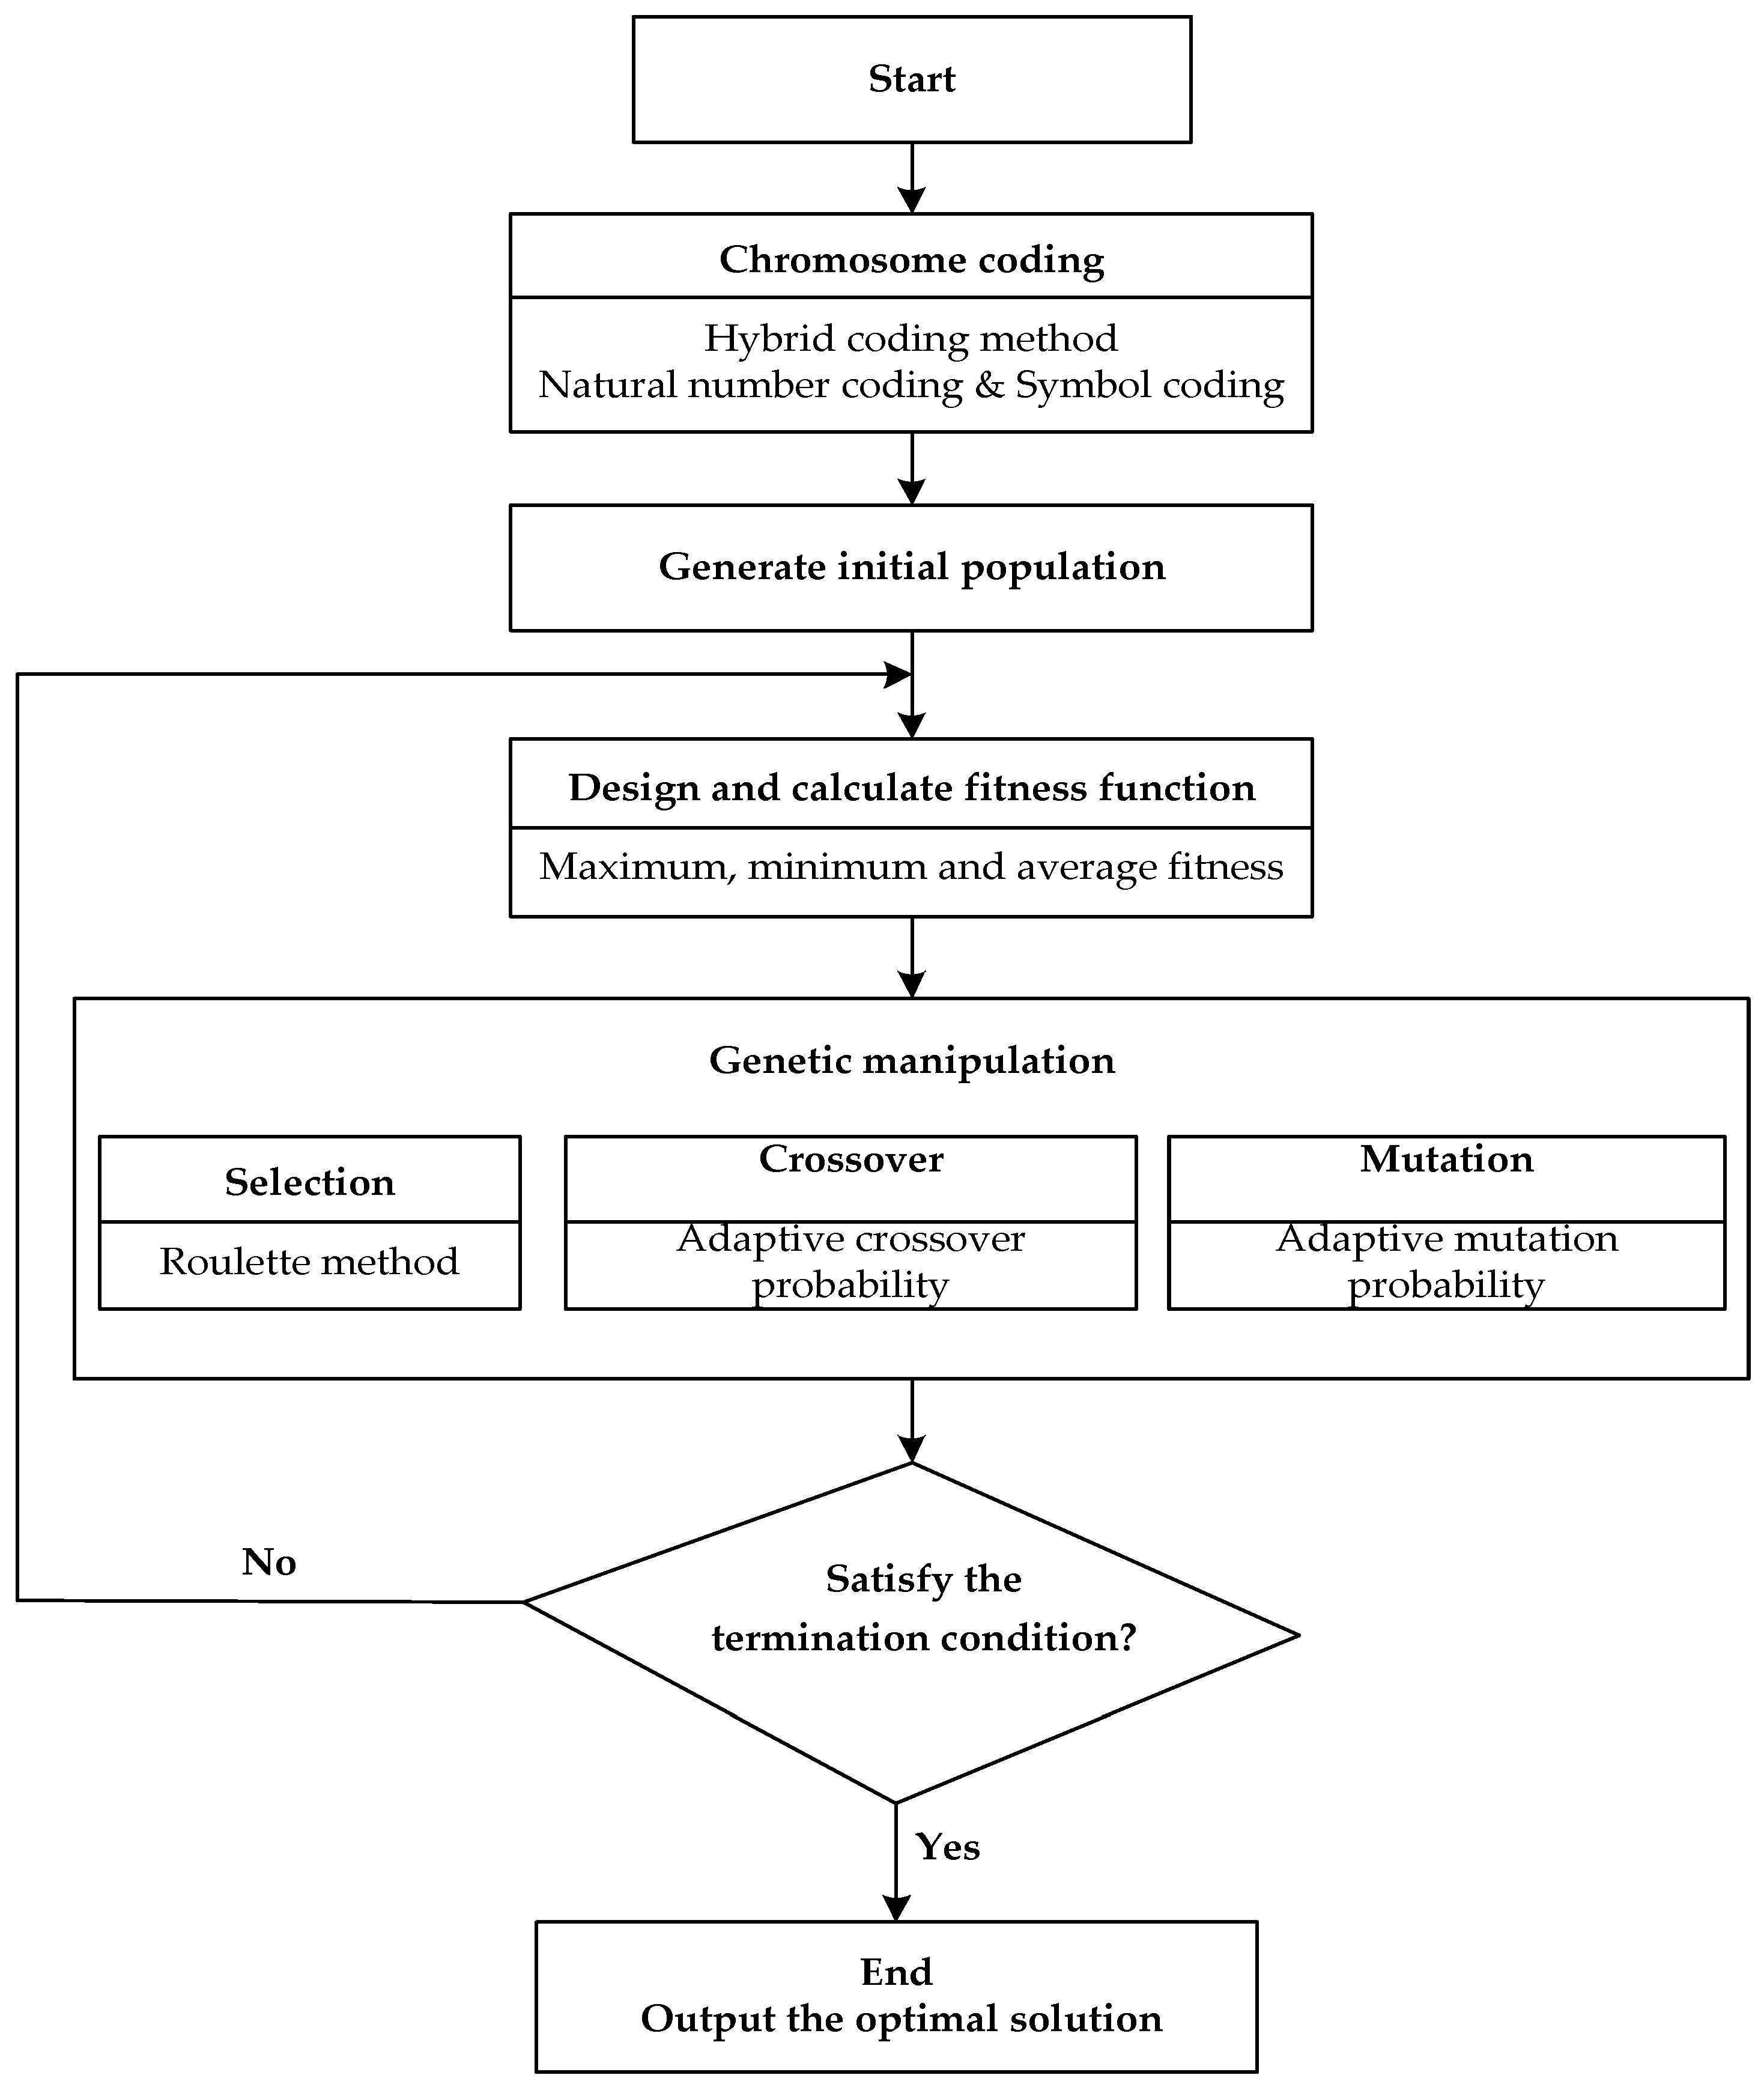
The multi-regional collaborative optimal allocation of emergency medical materials proposed in this paper is a complex decision-making problem. The model involves multiple objectives and multiple factors, and belongs to the NP-hard problem. For the solution of this problem, it is necessary to adopt an appropriate, fast, and effective algorithm (either by developing a new one or by finding one in literature) to improve the decision-making efficiency and effectiveness in the case of an emergency rescue [32,33,34]. Genetic algorithm (GA), which has diverse coding techniques, strong search directionality and good operability, is a typical method for solving optimization problems; it has been successfully applied in studies on vehicle scheduling, path optimization, and transportation management problems [35]. However, in practical application, it also has the disadvantages of slow convergence speed and a high tendency towards local optimization [36]. Therefore, we propose an improved genetic algorithm based on an adaptive strategy to solve the shortcomings of the basic GA by designing adaptive crossover probability and mutation probability, thereby meeting the requirements for solving the model. The flow of the improved adaptive genetic algorithm (IAGA) we designed to solve the multi-regional collaborative optimal allocation problem of emergency medical materials is shown in Figure 2.
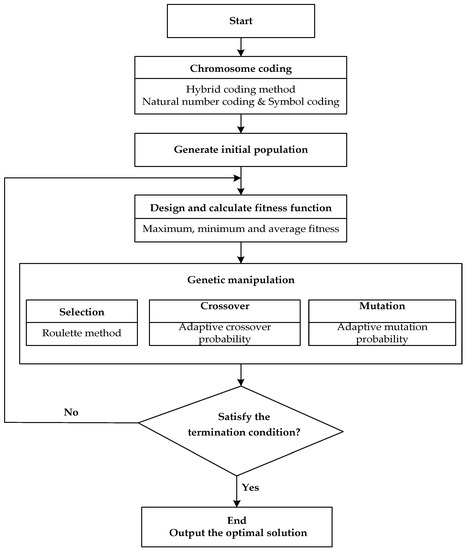
Figure 2.
Basic flow of improved genetic algorithm.
Step 1. Chromosome coding. Combined with the basic characteristics of the research question and decision variables, we used a hybrid coding method for genetic coding in this study. The demand quantity of medical materials was coded by natural number method; all of the regions affected by the epidemic, regions requiring rescue operations, supply sites, demand points, emergency medical materials, and emergency periods were coded by symbolic method. The specific coding process is as follows:
① The demand quantity of emergency medical materials is coded by assuming that there are eight demand points that need rescue medical materials. The demand quantity of each demand point is 6, 9, 7, 3, 8, 8, 5, and 6 units of materials. The corresponding genetic code is 69738856. The code of all regions affected by the epidemic is denoted by , the code of regions requiring rescue operations is denoted by , the code of supply sites is denoted by , the code of demand points is denoted by , the code of emergency medical materials is denoted by , and the emergency periods are denoted by .
② The rescue site completes a cross-regional emergency medical material allocation task as a basic gene. For example, represents the allocation of material from the supply site in region to the demand point in region during the period .
③ The gene segments of all supply sites are paralleled in sequence from small to large according to the number of supply sites in different regions, thus forming an individual.
Step 2. Generate initial population. To improve the global search performance and quality of GA, the initial random number is transformed to a value between the minimum demand and the actual demand, and the transformation formula is as follows:
where represents the initial random number and represents the generated random transformation multiple.
Step 3. Design fitness function. The proposed three objective functions are respectively total time , total cost , and total loss . Each objective function is normalized to obtain , , and , and the weights are given respectively , , and , where . Then the fitness function is:
Step 4. Selection. Selection is the process of selecting high-quality individuals from a population to form a new population with the purpose of avoiding loss of genetic information and improving global convergence. In this paper, the roulette method was used to select the new population, and the dominant individuals obtained in Step 3 were added to the new population to improve the quality of the population. represents the probability that the individual is selected, and represents the fitness of the individual. Equation (15) indicates that the selection probability of an individual is directly proportional to its fitness value.
Step 5. Corssover and mutation. To improve the convergence speed and global search ability of the GA, inspired by Liu et al. [37], we designed the adaptive change rules of crossover and mutation, so that the crossover and mutation probability adaptively adjusts the change according to the similarity degree of population, so as to achieve global optimization. The adaptive crossover and mutation probability functions are designed as functions related to the evolutionary algebra , as shown in Equations (16) and (17), respectively.
where and represent the crossover probability and mutation probability of the generation, and their values are calculated from the fitness value of the previous generation chromosome population. , , , , , , and are adaptive adjustment parameters of auxiliary crossover and mutation probability, satisfying , . , , and represent the maximum, minimum, and average fitness of the population, respectively. Fitmin(e)/Fitmax(e) reflects the approximation degree of the whole population. reflects the distribution of individual fitness within the population. The closer the two are, the more similar the individuals of this generation are, and they may fall into local optimum. When and , the approximation degree of the population is great. This situation is generally in the late stage of iterative evolution. In this case, small crossover probability and large mutation probability should be selected to generate new individuals and jump out of local optimal. When and , it is in the middle and late stage of evolution, and the population approximation degree is large, so the crossover probability should be maintained and the mutation probability should be appropriately increased. In other cases, it is generally in the early and middle stages of iterative evolution, and the approximation degree of the population is small, so large crossover probability and small mutation probability should be selected to improve the evolution speed and protect excellent individuals.
Step 6. Termination condition of algorithm. In general, when the fitness value of the current solution does not show any significant improvement, or the number of iterations for solving the evolution reaches a certain multiple of the current population size, the algorithm can be terminated, and the individual with the maximum fitness appearing in the evolution process is regarded as the optimal solution of the model.
3. Case Study and Results
3.1. Case Description and Data Setting
The sudden occurrence and rapid spread of major infectious diseases require a collaborative emergency response from multiple cities. Since the outbreak of COVID-19, the Yangtze River Delta region (Jiangsu, Zhejiang, Anhui, and Shanghai) has given full play to the collaborative advantages of integrated development, coordinated and promoted joint prevention and control of the epidemic, successively established multiple collaboration mechanisms including information exchange regarding confirmed and suspected cases, mutual assistance for supply distribution guarantees, sharing of medical diagnoses and treatment plans, and consultations for doctors treating critically ill patients [38]. These cooperative mechanisms provide a strong guarantee for effective epidemic prevention and control in the Yangtze River Delta. Due to the destructive degree and rescue effect in this epidemic, the collaborative response to COVID-19 in the Yangtze River Delta of China was chosen to be a case study, given that it is representative of an effective demonstration of collaborative response measures in a disaster relief context.
Medical drugs () and disposable protective clothing () were selected for the purposes of the case study as urgently needed materials. Relevant parameters were set by combining actual and simulated data. It was assumed that the above three provinces, and one city each, have (2, 2, 1, 1) supply sites and (2, 3, 2, 1) demand points. The transportation time and total distance for all regional supply sites to allocate materials to demand points were determined according to a Baidu map. The average transportation cost per unit distance for moving emergency medical materials from the supply site to the demand point was found to be 10 RMB. The minimum material allocation coverage rate for each demand point in each period was set to . The latest amounts of materials raised at the supply sites and the forecast demand for materials at the demand points in different regions at the beginning of each period are shown in Table 2. The loading time of unit material at the supply site, the unloading time of unit material at the demand point, and the penalty cost of unit material shortage are shown in Table 3. The maximum material transportation volume and fixed transportation cost for the allocation of materials from supply sites to demand points in each region are shown in Table 4. The vulnerability coefficient, importance coefficient, demand urgency coefficient, victim vulnerability coefficient, and timeliness coefficient of emergency medical materials at different demand points in each period are shown in Table 5. We solved the computational case in MATLAB R2016a on a computer with an Intel (R) Core (TM) 1.90 GHz processor with 16.0 GB of RAM. The IAGA parameters were set as follows: population size , maximum number of iterations , , , , , , , , , .
Table 2.
The latest amounts of materials raised and the forecast demand for materials in different regions at the beginning of each time period.
Table 3.
Loading and unloading time of unit material, and penalty cost of unit material shortage.
Table 4.
Maximum transportation and fixed transportation cost from supply site to demand point.
Table 5.
Difference coefficients of disaster area, victims, demand, and materials.
3.2. Result Analysis
3.2.1. Time, Cost, and System Loss of Collaborative Material Allocation per Period
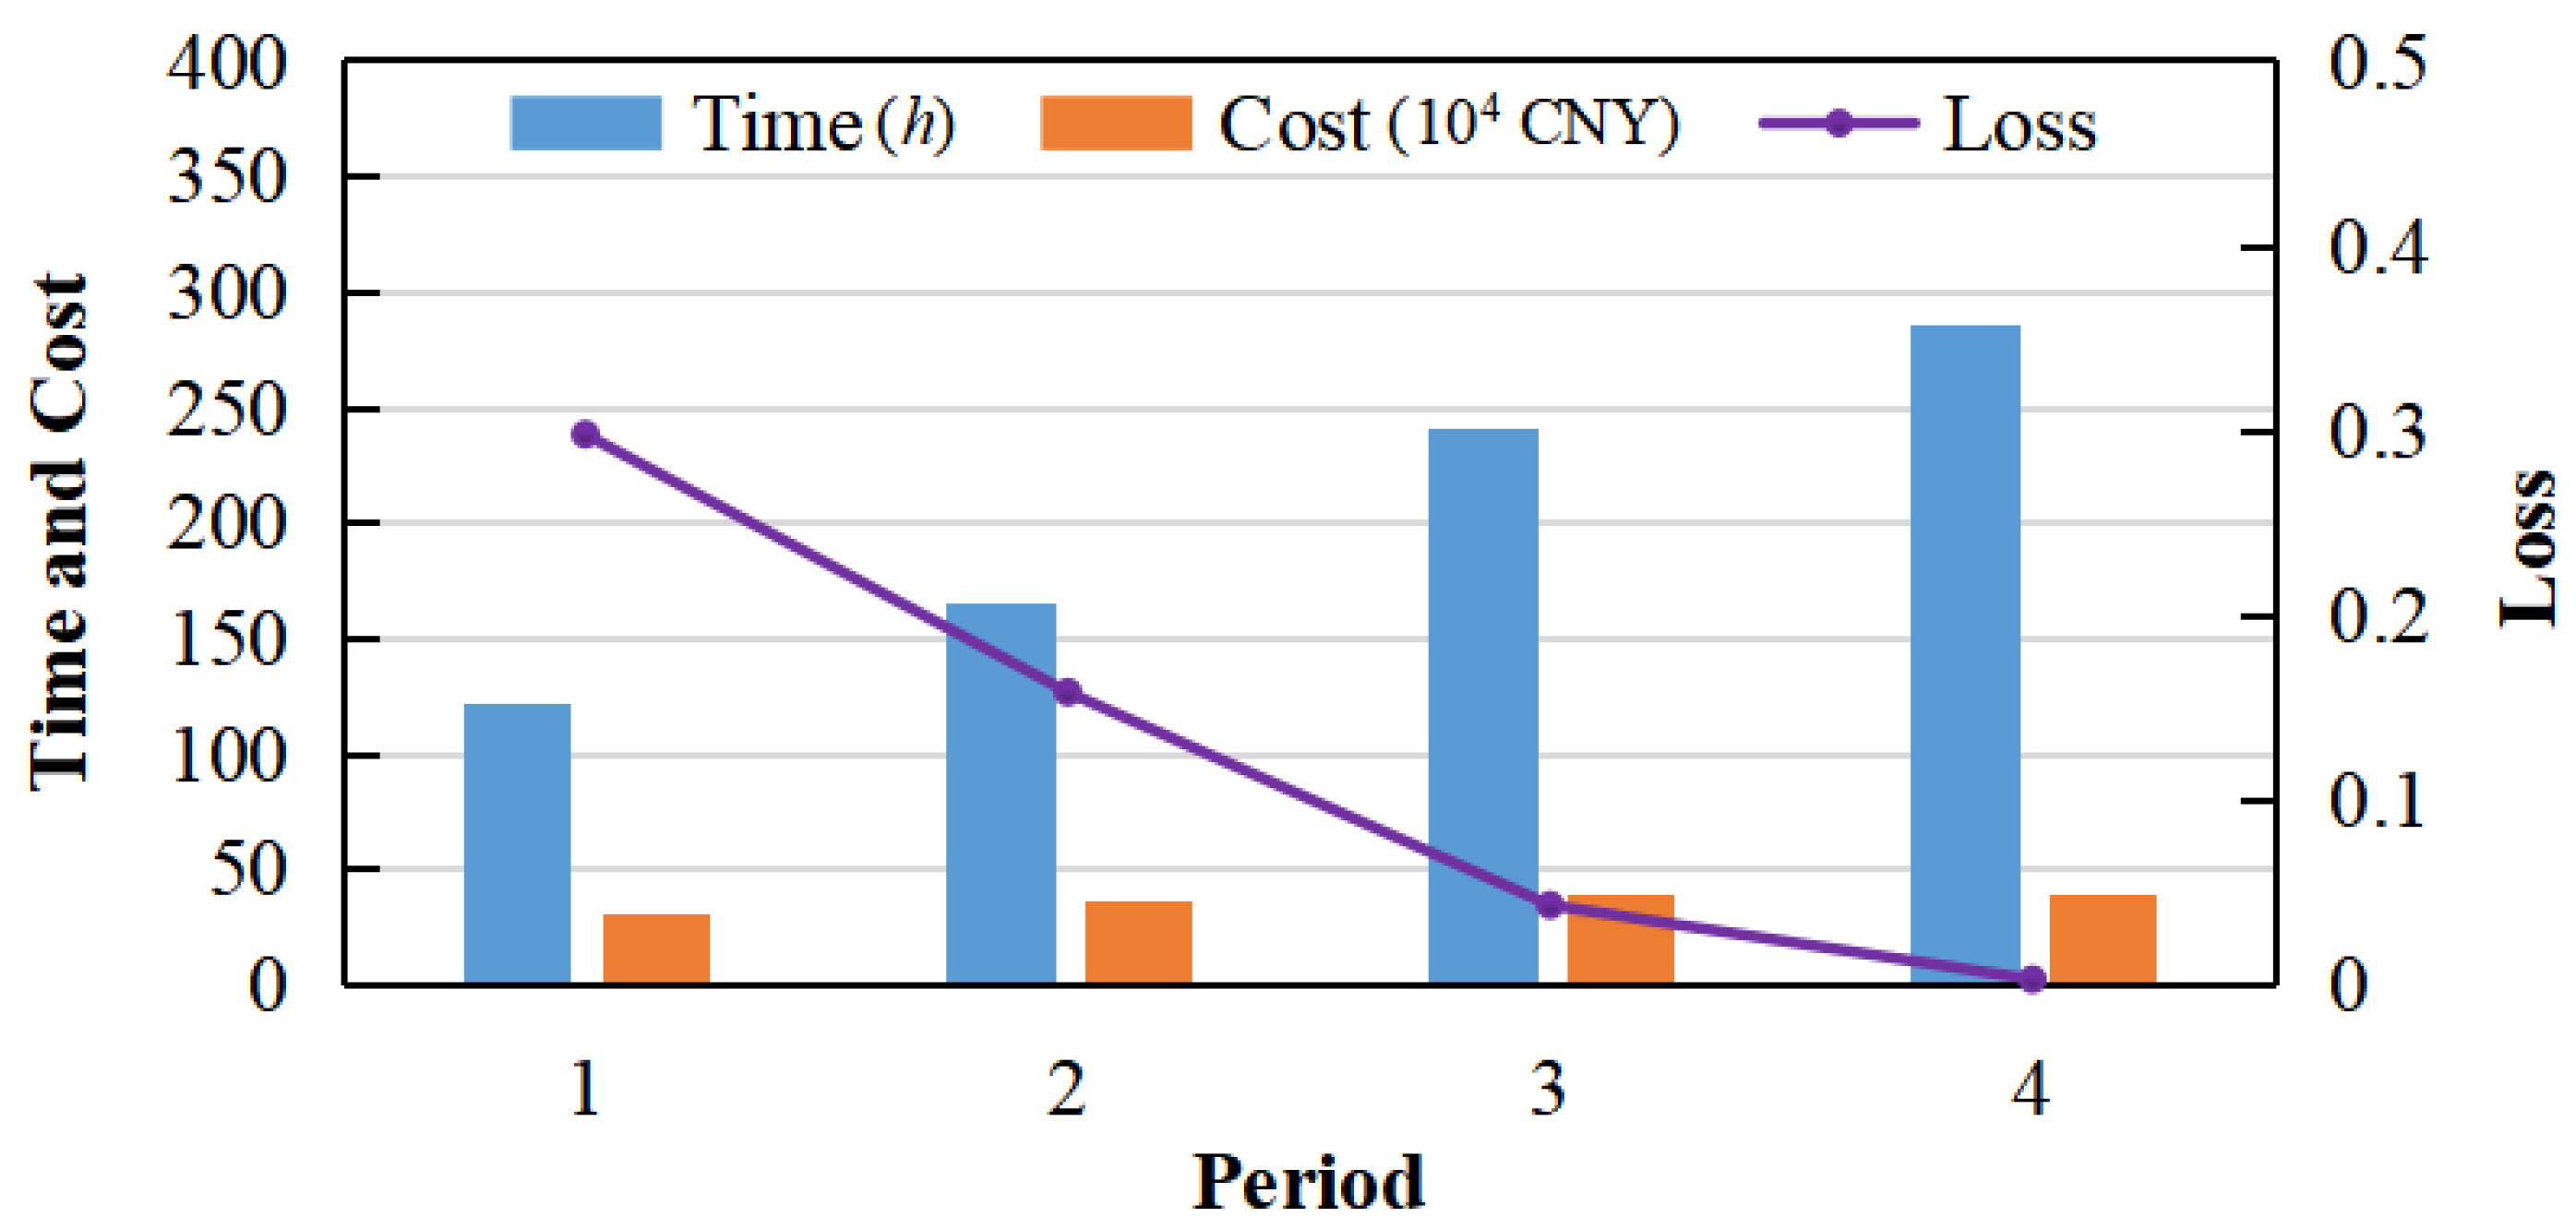
The time, cost, and system loss of the collaborative allocation of materials in each period are shown in Figure 3. The system loss of emergency material allocation in each period gradually decreases until reaching zero at the end of the fourth period. This indicates that the proposed model enables the material demands at all demand points in all regions to be met by rescue activities throughout entire emergency period. Meanwhile, the time and cost for allocating emergency materials in each period increase over time, which suggests that there is a decrease in system loss at each demand point that sacrifices some time and cost. This is because the materials are limited in the initial stages of the rescue process. In consideration of time and cost, limited materials tend to be allocated to nearby areas first, so there is shorter time and lower cost for material allocation initially with relatively low shortage. However, with the gradual increase in material supply, the quantity of materials allocated to each demand point in each period increases to compensate for previous shortages at various demand points. Thus, the loss of each demand point is gradually reduced while the time and cost for material allocation increases, to some extent.

Figure 3.
Time, cost, and system loss of collaborative material allocation in each period.
3.2.2. Material Satisfaction Rate of Each Demand Point in Each Period
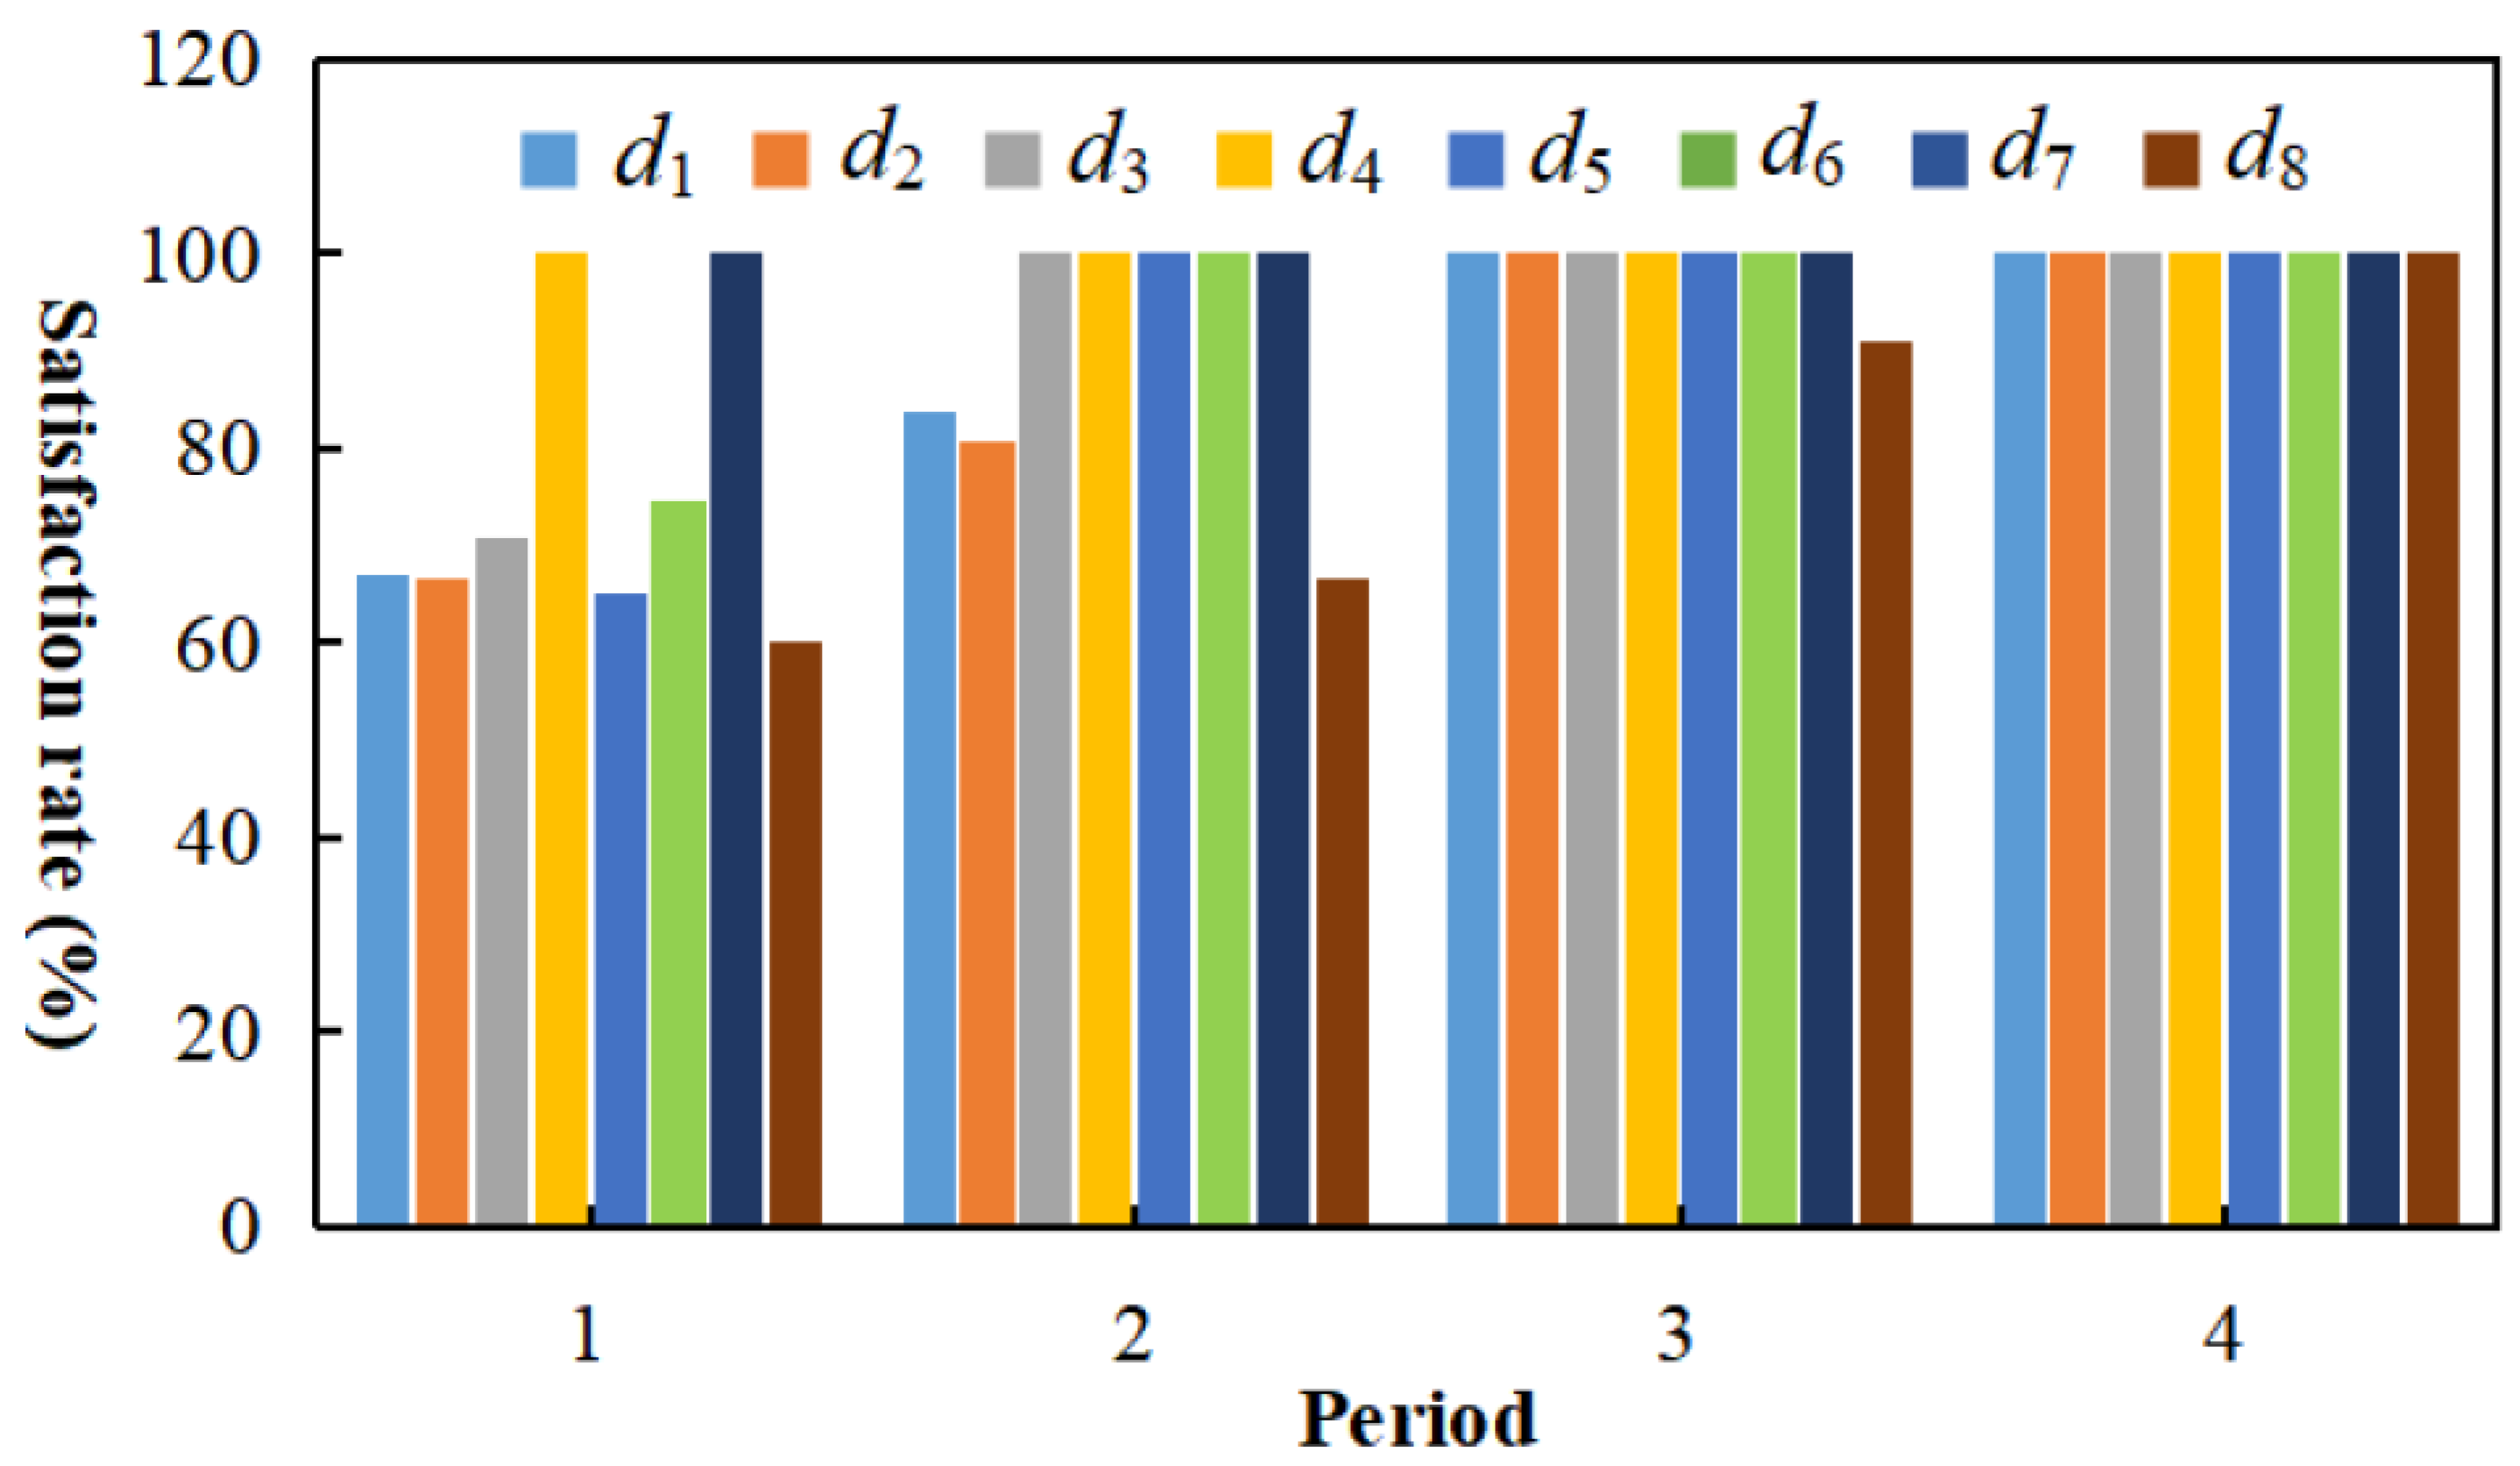
The material satisfaction rates of demand points in different regions in each period, as shown in Figure 4 and Figure 5, are consistently higher than 60%. This indicates that the proposed model satisfies the rescue material demand of demand points across different regions. The model appears to guarantee the equity of multi-periodic material allocation to a certain extent, as well. When materials are extremely scarce, the proposed model may ensure that each demand point obtains a certain proportion of the required materials, thus preventing a certain demand point from suffering serious loss. For example, the total demand for the first material in the first period at the three demand points in the region is about 6.5, but the total supply of this region is only 1. If there is no collaborative material allocation, some demand points in the region can only obtain a small portion, if any, of the necessary materials. Almost all demand points in the region will face serious shortages. However, with the collaborative allocation of materials, the regions and , where materials are relatively adequately supplied, can allocate some of the materials to the demand points in the region .
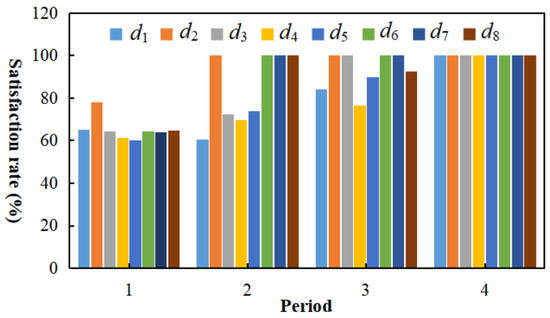
Figure 4.
Satisfaction rate of each demand point for material in each period.
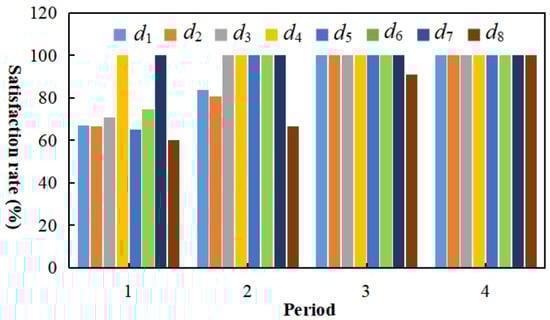
Figure 5.
Satisfaction rate of each demand point for material in each period.
3.2.3. Allocation Path and Amount of Various Types of Materials in Each Period
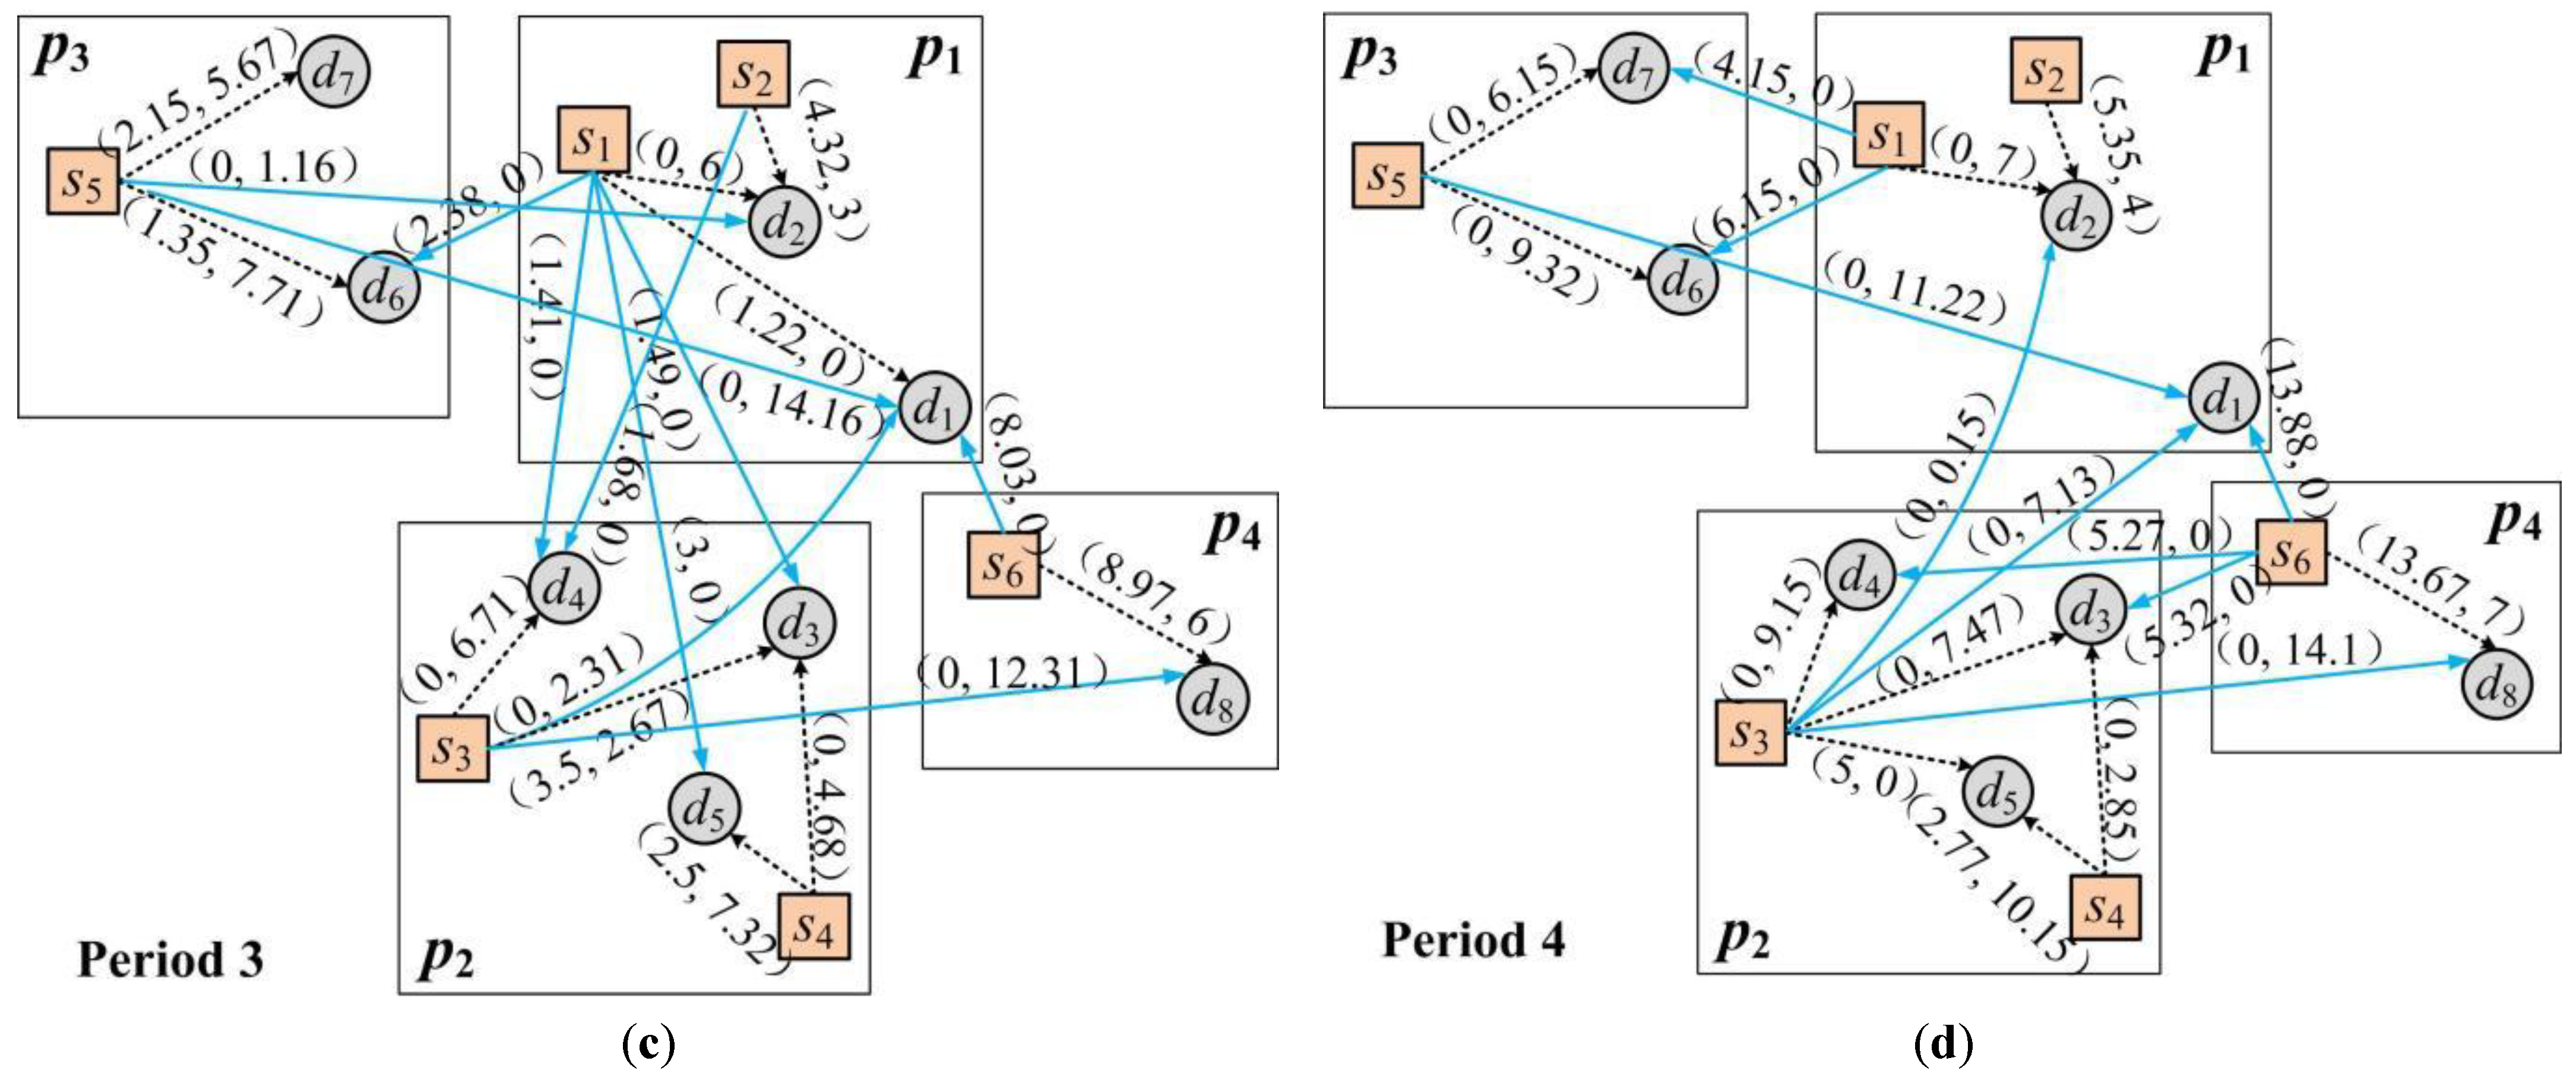
The allocation path and amount of various materials in each period are shown in Figure 6. The proposed model appears to combine the territorial allocation principle with the nearby allocation principle while comprehensively accounting for various coefficients of difference, including the vulnerability, importance, overall demand urgency, victim characteristics, and timeliness of the demand point on the basis of allocation time, cost, and system loss. The model can maximize the satisfaction rate and ensure the optimal allocation of emergency medical materials.
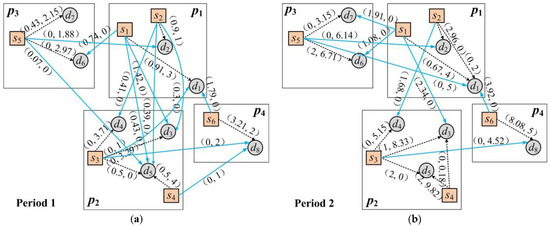
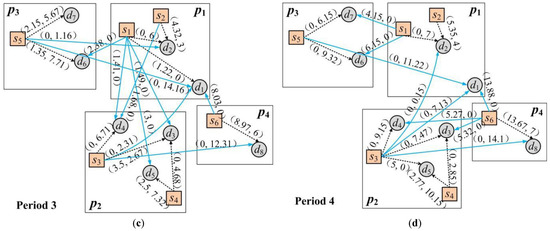
Figure 6.
Allocation path and amount of materials and in each period. (a) Path and amount of material allocation in the first period; (b) Path and amount of material allocation in the second period; (c) Path and amount of material allocation in the third period; (d) Path and amount of material allocation in the fourth period. (Note: → represents collaborative allocation, and ⇢ represents non-collaborative allocation).
3.2.4. Comparison of Collaborative and Non-Collaborative Allocation
The overall satisfaction rates of two types of materials in each period in cases of collaborative versus non-collaborative allocation are shown in Figure 7. The rates for both materials increase over time until reaching 100% at the end of the fourth period. The model allows for the free allocation and exchange of various types of materials across different regions under comprehensive consideration of time, cost, and system loss. Thus, the rate of satisfaction gradually increases until satisfying the demands at all demand points, with an increase in the overall material supply.
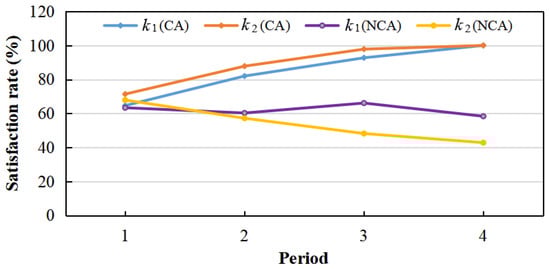
Figure 7.
Total material satisfaction rate per period under collaborative and non-collaborative allocation.
Figure 7 also shows where the satisfaction rates decrease over time when materials are not collaboratively allocated. It is impossible in this case to achieve a material satisfaction rate of over 60% at each demand point in each period. In the absence of collaboration, supply points in each region can only allocate materials to the demand points in one region per period. Even if there are still materials remaining after allocation to certain demand points, the supply points can only retain them until the next emergency period for allocation to the demand points in their region. There may be an extreme excess of a certain material at the supply point even if there is a demand point in another region that is in dire need. The supply and demand for materials is imbalanced, shortages abound, and the demand is ultimately not satisfied.
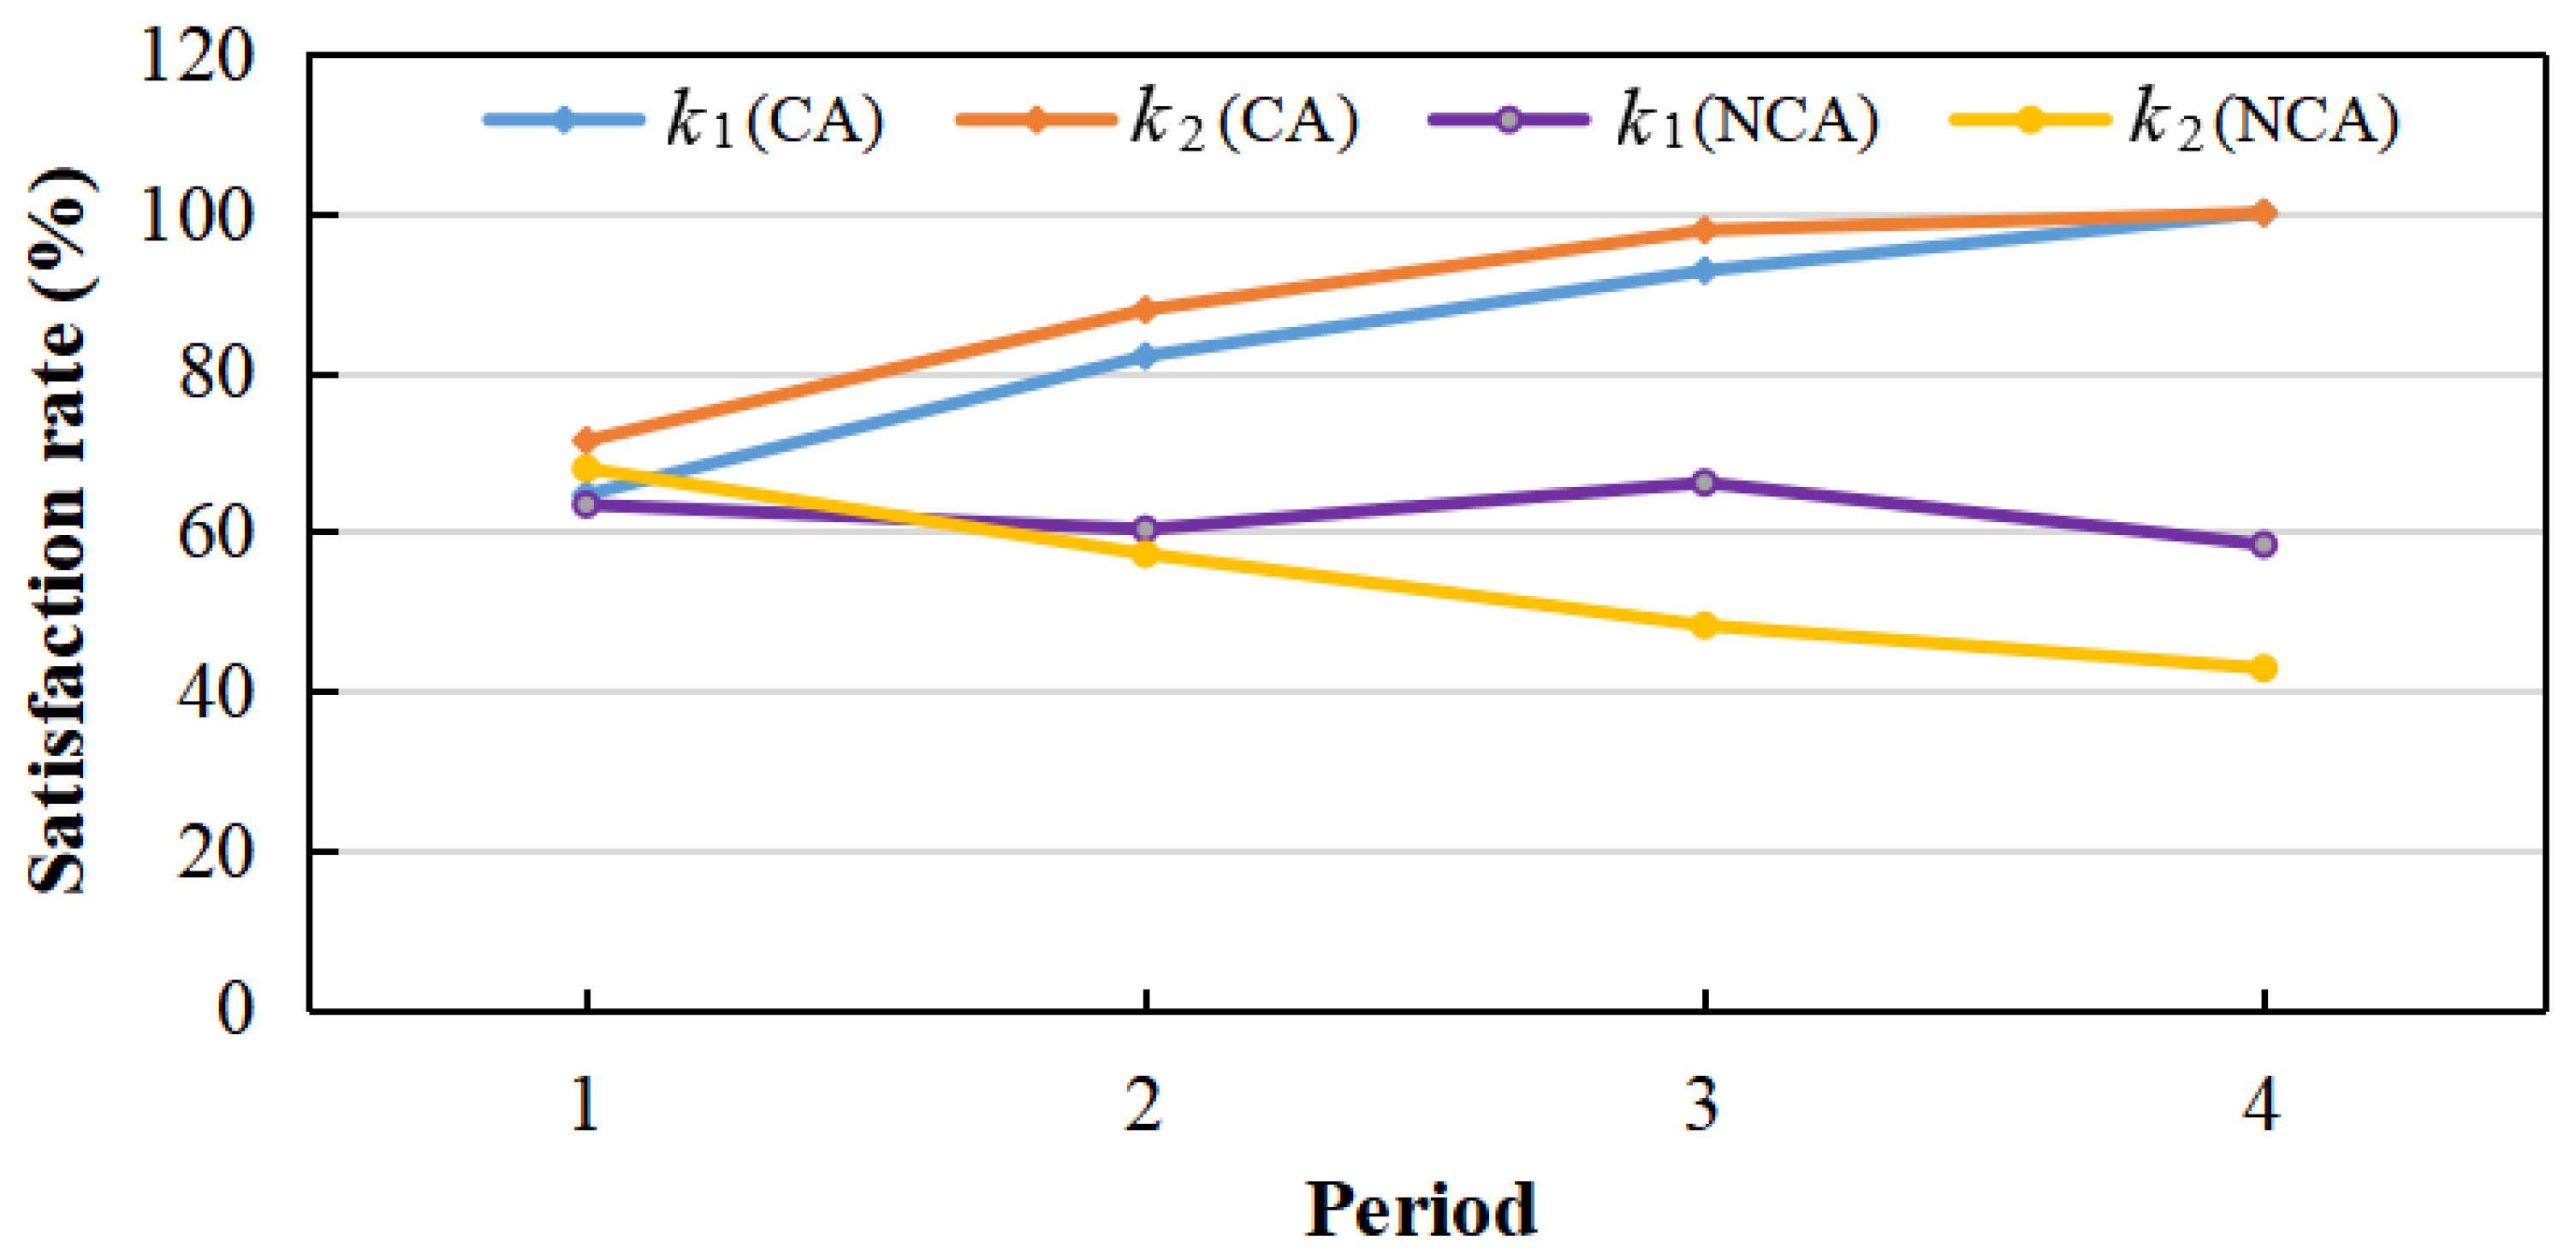
Consider an example wherein the supply of materials is sufficient (supply 70 and 80, demand 44 and 34) but the supply of materials is insufficient (supply 30 and 20, demand 80 and 54) throughout the emergency period in the regions and . Alternately, the supply of materials (supply 130 and 120, demand 85 and 43) is sufficient, but the supply of materials (supply 20 and 10, demand 45 and 22) is insufficient in the regions and . The satisfaction rate of each demand point in the regions and for the materials and the satisfaction rate of each demand point in the regions and for the materials under collaborative versus non-collaborative conditions are shown in Table 6.
Table 6.
Comparison of satisfaction rates of emergency medical materials at each demand point under two situations of collaborative allocation (CA) and non-collaborative allocation (NCA).
As can been seen in Table 6, collaborative allocation appears to improve the satisfaction rate of each demand point for emergency materials in each period, and satisfies all material requirements of all demand points in a relatively short time. As the supply continues to increase, the effects and advantages of collaborative allocation grow increasingly significant. For example, in the absence of collaborative allocation, the satisfaction rate of material at the demand point in the region , and the satisfaction rate of the materials at the demand point in the region are very low throughout the emergency period. The material requirements of the two demand points are not met until the end of the entire rescue activity (fourth period). After collaborative allocation is adopted, Table 6 also shows that the demand of the demand point for materials is fully satisfied in the third period. The demand of the demand point for materials is fully met in the fourth period. Collaborative allocation allows a certain proportion of materials to be provided to demand points with extreme shortages, even when the supply is limited in the initial stage of rescue. This ensures the equitable allocation of emergency medical materials while also maximizing the overall effects of rescue operations. This shows that the proposed model can realize the effective, fair, and collaborative allocation of emergency medical materials in multiple regions, thus verifying the validity and feasibility of the model.
3.2.5. Verification of IAGA Effectiveness
To verify the effectiveness of the proposed IAGA, we ran 30 random operations on the algorithm while maintaining the same conditions and parameters. The best and the worst total allocation time were 815 and 821, respectively, with a difference of only 0.73%; the best and worst total allocation costs were 145 and 147, respectively, with a difference of 1.36%; and the best and worst total losses were 0.5 and 0.505, respectively, making only a 0.99% difference. The calculation result is relatively stable, thus, the algorithm has strong stability. Moreover, the emergency material allocation path is consistent among the 30 generated schemes, which indicates that the IAGA algorithm has strong stability.
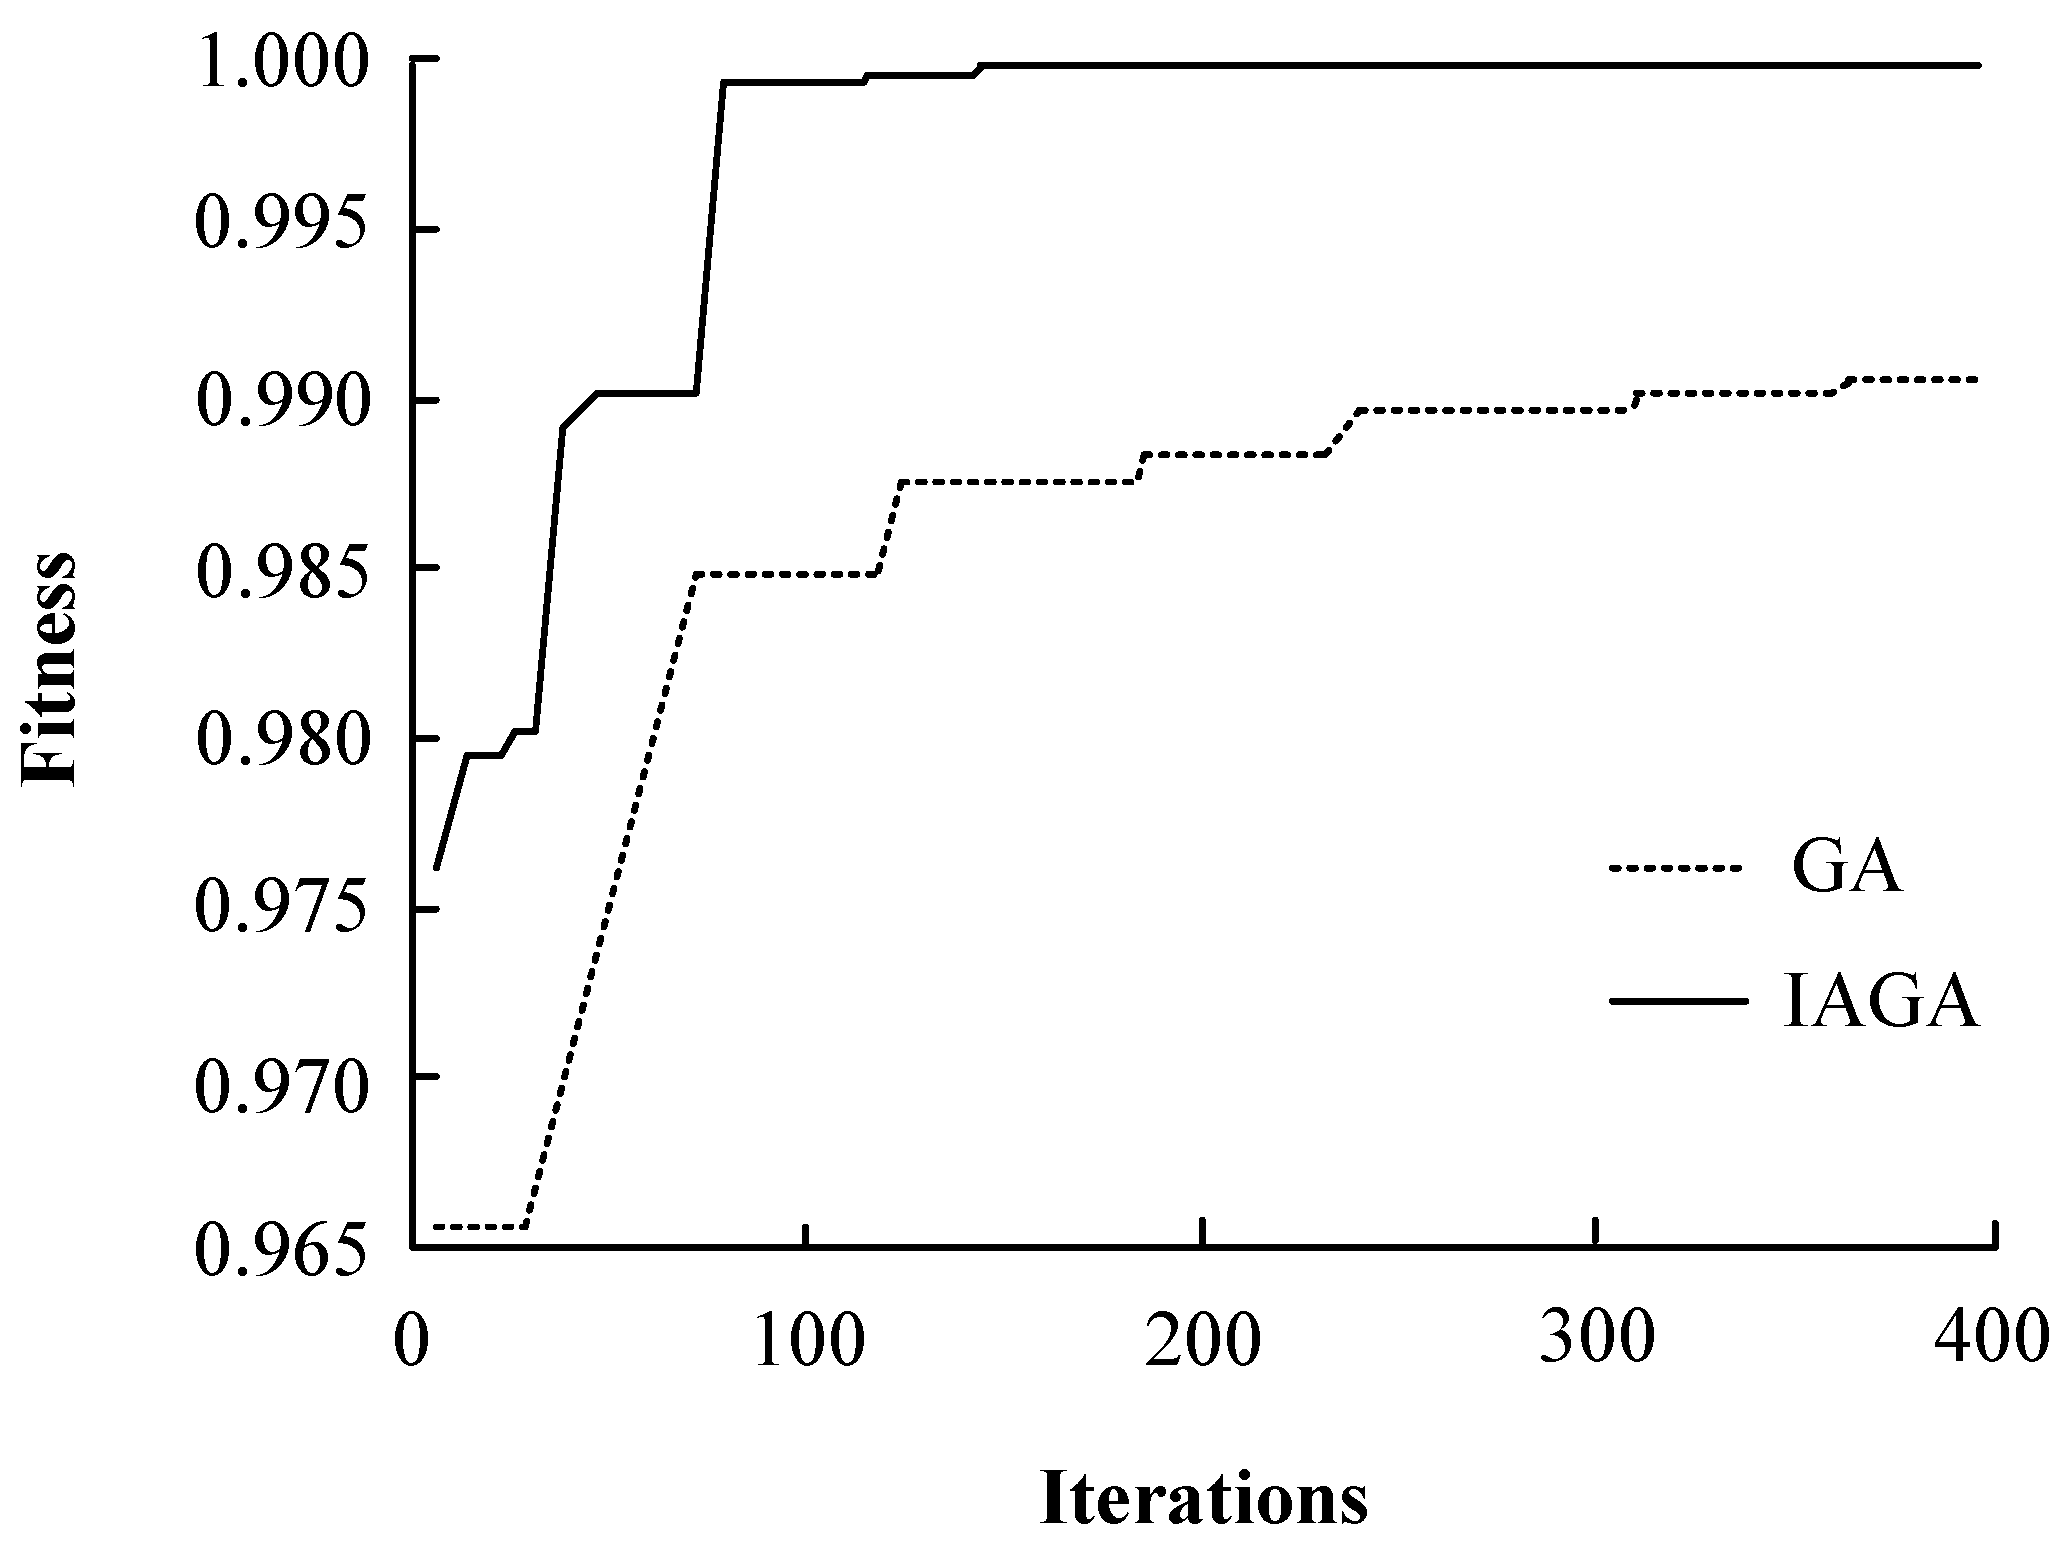
We also compared our IAGA against the basic GA to further validate its effectiveness. After 400 evolutionary iterations under the same conditions and parameters, the fitness evolution curves of IAGA and GA were obtained, respectively, as shown in Figure 8.

Figure 8.
Fitness evolution curves of IAGA and GA.
It can be seen from Figure 8 that IAGA can achieve high fitness at the early stage of iteration. As the iteration continues, although the basic GA has a fast search speed at the initial stage of operation, after it falls into local optimum in 138 iterations, the offspring within the population tend to be similar. At this time, the small mutation probability cannot meet the algorithm’s requirement of obtaining new individuals different from the population, and it falls into local optimum until the end of 400 iterations. Although the convergence speed of IAGA is slow at the initial stage of operation, after 36 iterations, the convergence speed is improved by increasing the crossover probability and reducing the mutation probability. When the operation falls into local optimization in the later stage, the ability of IAGA to explore new solutions is increased by reducing the crossover probability and increasing the mutation probability, thereby causing a steady progression of jumps away from the local optimization and towards the optimal solution, until finally, the global optimal solution is effectively obtained in 143 iterations.
We ran the IAGA and GA 100 times, independently. The results are shown in Table 7. The proposed IAGA is superior to the GA in terms of computing time, which shows that IAGA can quickly and accurately obtain the appropriate EMA scheme, which is very important in the case of emergency response operations. In addition, the optimal convergence times, average convergence values, and relative convergence error rate are also significantly better than the basic GA. We attribute that to the introduction of adaptive crossover and mutation probability function, which not only prevents falling into local optimization, but also improves the convergence speed and global search ability of the algorithm.
Table 7.
Performance comparison of IAGA and GA (100 times).
4. Conclusions and Outlook
This paper proposed a multi-objective optimization model for multi-regional collaborative allocation of emergency medical materials. This model minimizes the total time and total costs for material allocation and prioritizes equity in minimizing any system loss due to dissatisfied material demands. An IAGA method was developed to obtain high-quality emergency medical material allocation schemes. Finally, a case study was conducted based on the collaborative response to COVID-19 across the Yangtze River Delta region to validate the model.
The research results show that the proposed model can balance efficiency and equity, realize effective integration and sharing of emergency materials between regions, and improve the utilization efficiency and rescue effect of emergency materials allocation. We also find that collaborative allocation can improve the satisfaction rate for emergency materials at various demand points. Even in the case of extreme shortage of materials at the initial stage of a rescue operation, the model can ensure that each region obtains a certain proportion of the required materials and can effectively prevent a certain region from suffering a severe shortage. As the supply continues to increase, the advantages of collaborative allocation grow increasingly significant. Finally, the material allocation scheme considers a variety of difference coefficients in different regions in each period, such as the vulnerability and importance of demand points, the urgency of overall demand, the vulnerability of victims, and the timeliness of materials, each of which are conducive to improving the decision-making flexibility of multi-regional material collaborative allocation and the practical applicability of the scheme, and more in line with the actual characteristics of emergency rescue operations after the outbreak of a major infectious disease. Additionally, the proposed IAGA can be effectively applied to cross-regional emergency rescue decision-making. It has significant advantages in terms of solution efficiency, stability, convergence effects, and optimization capability. In practice, it could save valuable time for emergency relief operations and provide decision support for obtaining high-quality or optimal material allocation schemes. The model provides practical and applicable plans that conform to the actual characteristics of emergency rescue operations after the outbreak of a major infectious disease.
The research findings provide several management implications for coping with COVID-19 in real-world scenarios.
First, the scientific and optimal allocation of emergency medical materials plays a vital role in rescue operations after a major infectious disease outbreak. The relevant management departments need to attach great importance to the allocation process, and efficiency and equity need to be considered simultaneously.
Second, major infectious diseases have a significant cross-border nature, and their impact is extremely extensive. Emergency rescue activities require a multi-regional collaborative response, especially via the establishment of a scientific and reasonable joint prevention and control linkage mechanism, to build a shared community for future multi-regional emergency rescue response.
Third, the effective promotion and implementation of multi-regional collaborative emergency response needs to consider many aspects, such as resource sharing, information sharing, and risk communication.
Although this study shows great promise for improving the collaborative allocation of emergency medical materials across multiple regions, and the results can provide useful strategies for supporting emergency rescue during major infectious disease outbreaks, it is important to note that, in this study, only road transportation modes were considered. Different material transportation modes (e.g., air or rail) have different effects on actual allocation efficiency and emergency material allocation. Various transportation modes should be integrated into the proposed model as necessary. Therefore, further research is necessary to investigate the multi-regional collaborative optimal allocation of emergency medical materials based on multiple transportation modes.
Author Contributions
Conceptualization, Y.W. and X.Z.; methodology, Y.W.; software, Y.W.; validation, Y.W. and X.Z.; formal analysis, Y.W.; investigation, Y.W. and X.Z.; resources, Y.W.; data curation, Y.W. and X.Z.; writing—original draft preparation, Y.W.; writing—review and editing, Y.W.; visualization, Y.W. and X.Z.; supervision, X.Z.; project administration, Y.W.; funding acquisition, Y.W. All authors have read and agreed to the published version of the manuscript.
Funding
This research was funded by the National Social Science Foundation of China (No. 21CGL044).
Institutional Review Board Statement
Not applicable.
Informed Consent Statement
Not applicable.
Data Availability Statement
The data presented in this study are available within the article.
Conflicts of Interest
The authors declare no conflict of interest.
References
- Pollack, H.A. Disaster preparedness and social justice in a public health emergency. J. Health Politics Policy Law 2020, 45, 907–920. [Google Scholar] [CrossRef]
- Sheu, J.B.; Haghani, A. Dynamic relief-demand management for emergency logistics operations under large-scale disasters. Transp. Res. Part E Logist. Transp. Rev. 2010, 46, 1–17. [Google Scholar] [CrossRef]
- Liang, J.C.; Xie, J.C.; Wang, X.; Wang, R.; Jin, T.; Wang, S.J. Research on the construction and application mode of digital plans for sudden water pollution events. Processes 2022, 10, 883. [Google Scholar] [CrossRef]
- Galindo, G.; Batta, R. Review of recent developments in OR/MS research in disaster operations management. Eur. J. Oper. Res. 2013, 230, 201–211. [Google Scholar] [CrossRef]
- Jiang, Y.; Yuan, Y. Emergency logistics in a large-scale disaster context: Achievements and challenges. Int. J. Environ. Res. Public Health 2019, 16, 779. [Google Scholar] [CrossRef] [PubMed] [Green Version]
- He, Y.; Liu, N. Methodology of emergency medical logistics for public health emergencies. Transp. Res. Part E Logist. Transp. Rev. 2015, 79, 178–200. [Google Scholar] [CrossRef] [PubMed]
- Zhu, L.; Guo, D.; Gu, J.; Du, Y.Q. System dynamics analysis of cross-regional coordinative emergency materials allocation under severe epidemics—A case study on H1N1 joint response in the Yangtze River Delta. Syst. Eng. 2017, 35, 105–112. [Google Scholar]
- Boin, A. The new world of crises and crisis management: Implications for policy making and research. Rev. Policy Res. 2009, 26, 367–377. [Google Scholar] [CrossRef]
- Sheu, J.; Pan, C. A method for designing centralized emergency supply network to respond to large-scale natural disasters. Transp. Res. Part B Methodol. 2014, 67, 284–305. [Google Scholar] [CrossRef]
- Mete, H.O.; Zabinsky, Z.B. Stochastic optimization of medical supply location and distribution in disaster management. Int. J. Prod. Econ. 2010, 126, 76–84. [Google Scholar] [CrossRef]
- Anaya-Arenas, A.M.; Renaud, J.; Ruiz, A. Relief distribution networks: A systematic review. Ann. Oper. Res. 2014, 223, 53–79. [Google Scholar] [CrossRef] [Green Version]
- Özdamar, L.; Ertem, M.A. Models, solutions and enabling technologies in humanitarian logistics. Eur. J. Oper. Res. 2015, 244, 55–65. [Google Scholar] [CrossRef]
- Hoyos, M.C.; Morales, R.S.; Akhavan-Tabatabaei, R. OR models with stochastic components in disaster operations management: A literature survey. Comput. Ind. Eng. 2015, 82, 183–197. [Google Scholar]
- Pan, X.; Liu, Q.; Ye, C. Study on decision making of medical emergency resource allocation considering the degree of injured wounded. J. Syst. Sci. Math. Sci. 2019, 39, 1159–1170. [Google Scholar]
- Li, S.; Zheng, B. Integrated dynamic optimization for post-earthquake road network repair schedule and relief distribution. Manag. Rev. 2019, 31, 238–251. [Google Scholar]
- Chen, W.Y.; Alain, G.; Angel, R. Modeling the logistics response to a bioterrorist anthrax attack. Eur. J. Oper. Res. 2016, 254, 458–471. [Google Scholar]
- Arora, H.; Raghu, T.S.; Vinze, A. Resource allocation for demand surge mitigation during disaster response. Decis. Support Syst. 2010, 50, 304–315. [Google Scholar]
- Büyüktahtakın, I.E.; Des-Bordes, E.; Kıbış, E.Y. A new epidemics-logistics model: Insights into controlling the Ebola virus disease in West Africa. Eur. J. Oper. Res. 2017, 265, 1046–1063. [Google Scholar] [CrossRef]
- Tallon, J.M.; Zheng, L.; Wei, J.; Dick, W.; Papadopoulos, G.; Djurdjev, O. Population-based analysis of the effect of a comprehensive, systematic change in an emergency medical services resource allocation plan on 24-hour mortality. Can. J. Emerg. Med. 2020, 22, 86–94. [Google Scholar]
- Sun, H.; Chai, L.; Zhang, L.; Zhao, Z. Multi-objective dynamic facility location-transportation problem in emergency humanitarian logistics. Chin. J. Manag. Sci. 2020, 28, 103–112. [Google Scholar]
- Liu, M.; Li, Y.; Cao, J.; Zhang, D. An optimal design of emergency logistics network for epidemic controlling based on service level. Chin. J. Manag. Sci. 2020, 28, 11–20. [Google Scholar]
- Ni, Y.; Zhao, L. Study on deployment of emergency medical resources with injury condition consideration. Logist. Technol. 2015, 34, 115–118. [Google Scholar]
- Green, L.V.; Kolesar, P.J. Improving emergency responsiveness with management science. Manag. Sci. 2004, 50, 1001–1014. [Google Scholar] [CrossRef]
- Calixto, E.; Larouvere, E.L. The regional emergency plan requirement: Application of the best practices to the Brazilian case. Saf. Sci. 2010, 48, 991–999. [Google Scholar] [CrossRef]
- Boin, A.; Rhinard, M.; Ekengren, M. Managing transboundary crises: The emergence of European union capacity. J. Conting. Crisis Manag. 2014, 22, 131–142. [Google Scholar]
- Olsson, E.K. Transboundary crisis networks: The challenge of coordination in the face of global threats. Risk Manag. 2015, 17, 91–108. [Google Scholar] [CrossRef]
- Ansell, C.; Boin, A.; Keller, A. Managing transboundary crises: Identifying the building blocks of an effective response system. J. Contingencies Crisis Manag. 2010, 18, 195–207. [Google Scholar] [CrossRef]
- Cao, C.; Li, C.; Qu, T.; Yang, Q. A bi-level programming model for relief trans-regional scheduling: Taking into consideration survivors’ perceived satisfaction and risk acceptability. J. Manag. Sci. China 2019, 22, 111–126. [Google Scholar]
- Wang, Y. Multiperiod optimal allocation of emergency resources in support of cross-regional disaster sustainable rescue. Int. J. Disaster Risk Sci. 2021, 12, 394–409. [Google Scholar]
- Qiu, Y.; Shi, X.L.; Hua, G.W. Regional cooperative strategies for emergency response to accidents and disasters under longitudinal administrative constraint—Case study in Beijing-Tianjin-Hebei region. Manag. Rev. 2019, 31, 240–249. [Google Scholar]
- Lv, T.; Nie, Y.; Wang, C.L.; Gao, J. Cross-regional emergency scheduling planning for petroleum based on the supernetwork model. Pet. Sci. 2018, 15, 666–679. [Google Scholar] [CrossRef] [Green Version]
- Chen, L.; Wang, Y.; Guo, G. An improved genetic algorithm for emergency decision making under resource constraints based on prospect theory. Algorithms 2019, 12, 43. [Google Scholar] [CrossRef] [Green Version]
- Baker, K. Computational results for the flowshop tardiness problem. Comput. Ind. Eng. 2013, 64, 812–816. [Google Scholar] [CrossRef]
- Herrmann, F. Using Optimization models for scheduling in enterprise resource planning systems. Systems 2016, 4, 15. [Google Scholar] [CrossRef] [Green Version]
- Novoa, C.; Storer, R. An approximate dynamic programming approach for the vehicle routing problem with stochastic demands. Eur. J. Oper. Res. 2009, 196, 509–515. [Google Scholar] [CrossRef]
- Kyriklidis, C.; Vassiliadis, V.; Kirytopoulos, K.; Dounias, G. Hybrid nature-inspired intelligence for the resource leveling problem. Oper. Res. 2014, 14, 387–407. [Google Scholar] [CrossRef]
- Liu, J.; Zou, R.; Han, Q.; Wang, W.; Qi, D. Approach to optimizing the location & allocation of the emergency material reserve based on the adaptive genetic algorithm. J. Saf. Environ. 2021, 21, 295–302. [Google Scholar]
- China News Service (CNS). Establishing Multiple Collaborative Mechanisms to Promote Joint Prevention and Control of Epidemic Situation in Yangtze River Delta. Available online: http://www.chinanews.com/sh/2020/04-01/9144159.shtml (accessed on 10 January 2022).


Publisher’s Note: MDPI stays neutral with regard to jurisdictional claims in published maps and institutional affiliations. |
© 2022 by the authors. Licensee MDPI, Basel, Switzerland. This article is an open access article distributed under the terms and conditions of the Creative Commons Attribution (CC BY) license (https://creativecommons.org/licenses/by/4.0/).