Abstract
Slag and Al/Mg oxide modified Douglas fir biochar (AMOB) were compared for their phosphate adsorbing abilities for use individually or in combination for simulated agriculture run-off remediation in wetlands. Aqueous batch and column sorption experiments were performed for both low-cost materials. AMOB was prepared in bulk using a novel green method. Material analyses included XRD, elemental analysis, SEM, EDX, and BET. Biochar and slag have different phosphate removal mechanisms. In short residence times (≤2 h), adsorption phenomena dominate for both adsorbents. Surface area likely plays a role in adsorption performance; slag was measured to be 4.1 m2/g while biochar’s surface area was 364.1 m2/g. In longer residence times (>2 h), the slow leaching of metals (Ca, Al, and Mg) from slag continue to remove phosphate through the precipitation of metal phosphates. In 24 h, slag removed more free phosphate from the solution than AMOB. Preliminary fixed bed column adsorption of slag or AMOB alone and in tandem was performed adopting a scaled-up model that can be used to remediate agricultural runoff with high phosphate content. Additionally, a desorption study was performed to analyze the efficiency of material regeneration. While AMOB does not release any adsorbed phosphates, slag slowly releases 5.7% adsorbed phosphate over seven days.
1. Introduction
Phosphorus is a limited resource and one of three macronutrients needed for plant growth [1,2,3]. In soils, plants mainly uptake inorganic phosphorus in the form of orthophosphate ions [4]. Depending on soil acidity, the speciation ratio varies, but H2PO4− and HPO42− are the dominant species in natural waters. In order to support the world’s current growing population, farmers must replenish phosphorus in soils using phosphate fertilizers, primarily ammonium phosphate [3,5]. However, phosphorus that is not taken up by crops can make its way to nearby bodies of water via stormwater runoff and erosion [6,7,8]. In many cases, this can lead to the development of ‘dead zones.’
Dead zones are caused by excess plant nutrients, including phosphates, introduced via agricultural practices into a watershed [6,9]. Unnaturally high phosphate concentrations can lead to uncontrolled algae growth. This algae blocks the sun, which limits biodiversity by effectively killing other aquatic plants [9]. When the algae die, it dramatically increases the biological oxygen demand. As bacteria break down the decomposing algae, the water’s dissolved oxygen content drops until it is unsuitable to host marine life [3,7]. Marine life that is unable to leave these hypoxic waters suffocates. Worldwide, the number of dead zones has increased by 800%, from 49 to 405 locations since the 1960s [3]. Responsible agriculture requires combating the growth of existing, as well as the prevention of new dead zones through the management of agricultural phosphate [3,5]. Removing phosphates from agricultural runoff before it is introduced into waterways can help prevent dead zones [2,4,8]. The Chemistry and Landscape Architecture Departments at Mississippi State University have teamed up to develop materials and methods that can ultimately be used to prevent agricultural nutrients from entering our natural waters, and field studies are underway that complement the lab work presented here.
Several methods exist for removing phosphate from water, including precipitation, osmosis, and adsorption onto sorbents [4,8]. Although effective in the lab, none of these are currently used in large scale agriculture. Optimized sorbent materials and methods development would minimize cost, maximize adsorption capacity, use ‘green chemistry’ principles, and include the ability to regenerate usable phosphate for reincorporation into soils.
Slag is a co-product of the steel industry and therefore is inexpensive and often landfilled [4,10,11]. It is obtained by scraping off the impurities that float to the surface of smelted steel. Slag is composed mainly of calcium (16.2–39.1%), iron (0.3–29.5%), aluminum (1.0–8.8%), silicon (5.6–15.4%), and some heavy metals (<1.0%) [10]. The exact composition will vary depending on the smelting process. Biochar is a highly porous carbonaceous material with a surface area ranging from 6 to 6000 m2/g [12]. It is formed by the incomplete combustion of organic materials via pyrolysis. Biochar is environmentally friendly, readily available as a by-product of the biofuel industry, exhibits stability in soils, has high surface areas, and is inexpensive [12]. Biochar’s highly aromatic structure with hydroxyl and carboxylic acid groups is similar to activated carbon. However, biochar is available at a much lower cost. Direct comparisons reveal that biochar can be more selective in analyte adsorption than activated carbon. As a result, biochar is increasingly important in water remediation and soil amendment [13].
Biochar does not inherently retain phosphate; it releases it slowly [14,15]. The biochar used here was engineered to contain Mg and Al oxides using the principles of green chemistry. This modification increases phosphate adsorption by forming low solubility phosphate/metal oxide/hydroxide bonds [14]. Previous lab work indicates that a 2:1 Al/Mg ratio biochar has a high phosphate capacity. Therefore this ratio was compared with slag that naturally contains iron, calcium, and aluminum [16]. Biochar and slag were used in parallel studies to determine their ability to remove phosphate from simulated agricultural runoff (batch studies) using field conditions (pH and temperature). The adsorption data were used to design a future field study of a fully functional phosphate removing forebay treatment system. Preliminary data from a column study that better simulates conditions found with agriculture runoff into wetlands are included.
2. Experimental
2.1. Biochar Modification
Douglas fir biochar, obtained from Biochar Supreme Inc. (Environment Ultra), was produced as a by-product from the gasification of timber industry waste wood. Auger-fed, chipped (approximately 3 in.) wet green wood was introduced into the air-fed updraft gasifier at 900–1000 °C with a residence time of 1–10 s [15,17,18]. We aimed to prepare large quantities of the modified biochar using the principles of green chemistry. First, dried biochar (13.7 kg) was placed in a rotating barrel. Aluminum sulfate hydrate (10.1 kg) and magnesium sulfate hydrate (4.4 kg) were dissolved in 22.0 L of water and then sprayed into the biochar while being mixed. The biochar completely adsorbed the salt solution creating a slurry with no waste liquid (green chemistry). This biochar was then spread out and dried in a solar kiln for 3 days with temperatures reaching approximately 46.1 °C inside the kiln during the day to reduce the energy used in drying (green chemistry). Next, 2.0 kg of NaOH was dissolved into 35.0 L of water. This basic solution was sprayed into the biochar, creating a slurry with no waste and left to sit overnight before drying in the solar kiln for three days before being collected. This collected Aluminum (Al)/Magnesium (Mg) Oxide Biochar (AMOB) underwent a final rinsing to remove any excess NaOH and metal salts before being dried in the solar kiln.
The base treatment forms layered double hydroxides (LDHs). These are ionic solids with large anion sorption capacities. The general chemical composition of LDHs can be described by the formula [M2+(1−α)M3+α(OH−)2]α+[An−]α/n •mH2O. For our purposes, Mg2+ is the divalent cation, Al3+ is the trivalent cation, and SO42− is the interlayer anion [14]. Mg and Al are the most frequently used metal LDH precursors for phosphate adsorption. In LDH, the M2+ and M3+ ions form long sheets of repeating octahedral units with shared edges. Each sheet can stack through hydrogen bonding by hydroxyl group protons. LDHs are host-guest materials consisting of positively charged metal hydroxide sheets with intercalated anions and water molecules. LDHs exhibit exceptional anionic pollutant adsorption abilities because of their easily exchangeable interlayer anions and large surface areas [19].
2.2. Biochar and Slag Particle Size
Slag (Levy Corporation, a Mississippi steel recycling facility) and AMOB were ground using a ball mill and sifted through 300–150 µm sieves.
2.3. Sorbent Characterization
Biochar chemical composition (CHN) was determined through combustion analysis via total carbon analysis; metal content was determined following sample digestion (HNO3) using EPA Method 3051A and analyzed via ICP-OES [15,20]. Ash content was determined using ASTM method D-2974-87 [21]. An initial mass of approximately 1.0 g was weighed and placed in an uncapped crucible. This crucible was transferred to a muffle furnace and heated to 750 °C. This temperature was held for 3 h before the contents were placed in a desiccator and allowed to cool to room temperature before re-weighing. The ash content is taken by the following equation [15].
The PZC (Point of Zero Charge) was determined using a HANNA Instruments HI 2211 pH/ORP Meter adjusted using HNO3 and NaOH. Biochar surface morphology was imaged using scanning electron microscopy (JEOL JSM-6500F FE-SEM, operated at 20 kV). Biochar samples were coated on a metal stub attached with carbon tape and then sputtered-coated under argon with a 25 nm layer of platinum using an EMS 150T ES sputter coater. For scanning electron microscopy-energy-dispersive X-ray spectroscopy (JEOL JSM-6500F FE-SEM), samples were affixed to a carbon stub using carbon tape. The surface area was determined using a Brunnauer–Emmett–Teller (BET) analyzer (Micromeritics TriStar II PLUS). XRD analysis was performed using a Rigaku Ultima III X-ray Diffraction System.
2.4. Batch Sorption Studies
A range of adsorption conditions was used to compare AMOB and slag. Surface adsorption removal of phosphate was highlighted at low phosphate concentrations. AMOB removes phosphate primarily through surface adsorption. Phosphate removal from a combination of surface adsorption and precipitation was highlighted at increased phosphate concentrations with slag. Slag releases metal ions in water that can form low solubility precipitates with phosphate. Thus, with biochar, the surface adsorption mechanism is dominant. We see fast kinetics, while with the slag, we have fast surface adsorption followed by a long phase where phosphate is removed through a combination of surface adsorption and leaching.
Calibration standards were prepared via serial dilution of reagent grade 1000 mg/L PO43− solution and deionized water. Batch sorption experimental solutions were made from a 1000 mg/L stock solution prepared with reagent grade NaH2PO4 and deionized water [1]. The pH dependence for metal adsorption was evaluated in triplicate, using 20 mL 500 mg/L PO43− solution and 0.050 g of adsorbent. Phosphate removal was determined after 24 h at 25 °C after shaking at 150 rpm.
Kinetics analysis was done triplicate from 30 s to 24 h at 25 °C using 20 mL of 500 mg/L PO43− solution and 0.050 g of adsorbent at pH 5.0. The samples were shaken at 150 rpm in a temperature-controlled shaker. The molybdenum blue method was used with a UV-VIS Spectrometer to determine PO43− concentration after time intervals ranging from 15 min to 24 h.
Adsorption isotherm samples of 0.050 g biochar in triplicates were introduced to 20 mL PO43− solutions ranging from 5.0 to 500 mg/L at pH 5 [22,23]. Samples were then placed on a temperature-controlled shaker at 150 rpm at 25, 35, and 45 °C. Solutions were then filtered with Whatman No. 1 filter paper before quantification using UV Vis.
3. Results and Discussion
3.1. Sorbent Characterization
3.1.1. X-ray-Diffraction (XRD)
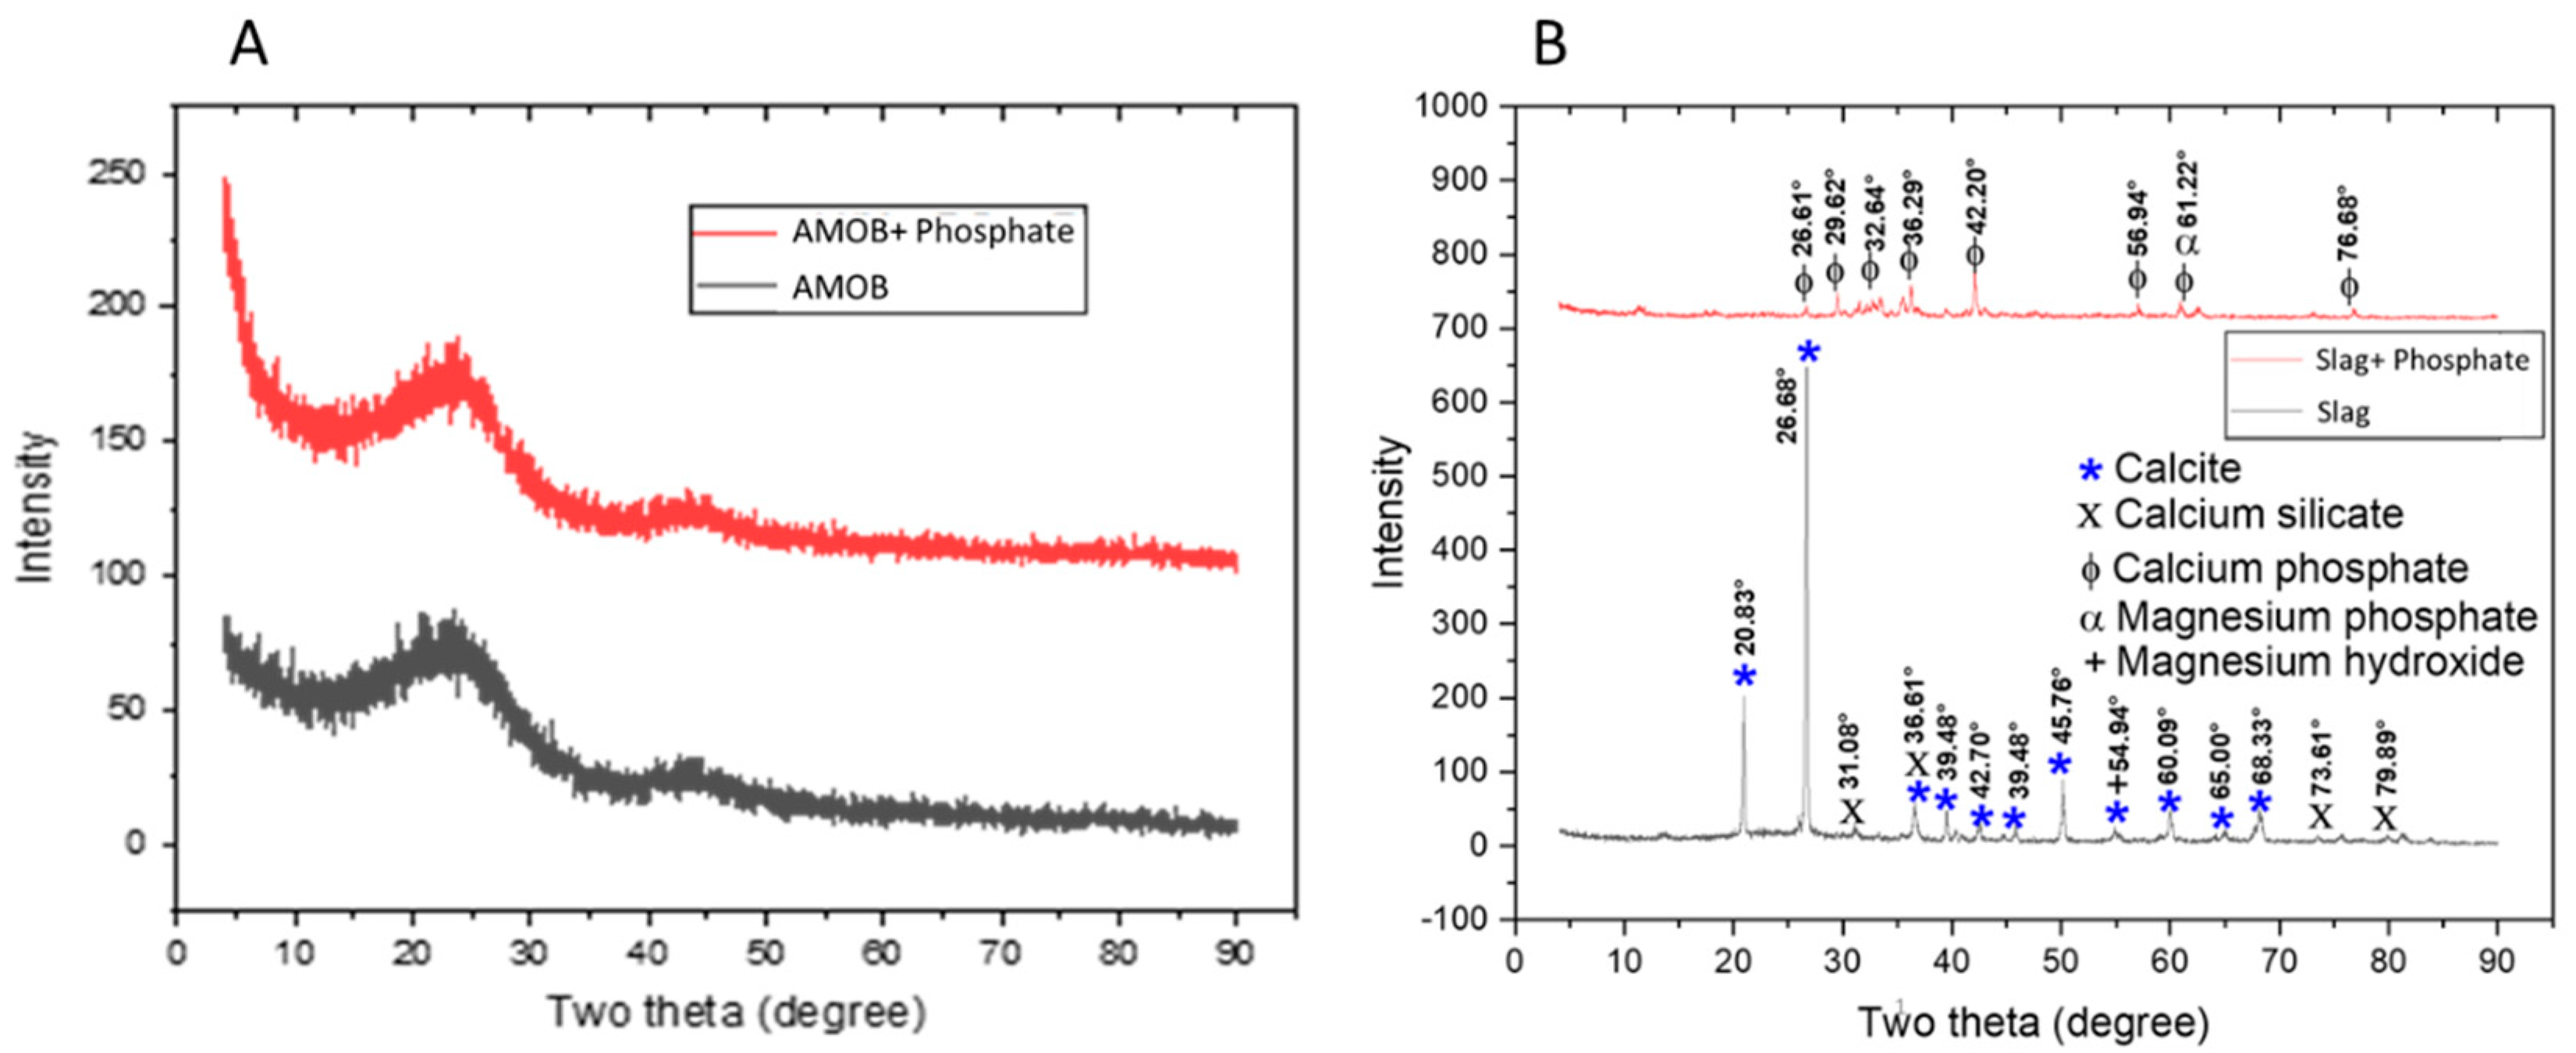
Aluminum Magnesium Oxide Biochar (AMOB) and slag were characterized using various methods. The ash content for AMOB was found to be 14.9%. XRD spectra for biochar and slag before and after adsorption of phosphate are found in Figure 1. Biochar is an amorphous solid with XRD spectra very similar to that of graphite. Although metal oxides are present in this char, the crystallinity is not significant enough to be seen in the spectra. Biochar has a broad peak near 25 degrees, characteristic of amorphous solids and corresponds to the random porous structure, a common feature of biochar [14]. The slag XRD spectrum features many sharp, high intensity peaks corresponding to calcite, calcium silicate, and magnesium hydroxide prior to phosphate adsorption. After phosphate adsorption, peaks appear in the XRD consistent with calcium phosphate and magnesium phosphate (Figure 1).
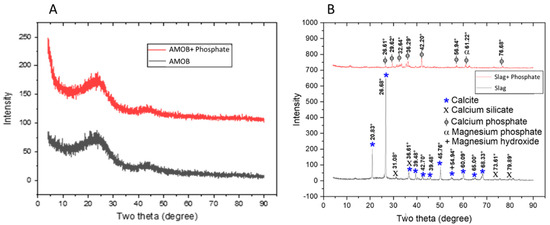
Figure 1.
XRD spectra for (A) AMOB and (B) slag with and without the addition of phosphate.
3.1.2. Elemental Analysis
The elemental analysis of the two sorbents using ASTM Method D7573 and can be found in Table 1. BET analysis indicates that both sorbents contain similar pore diameters. However, AMOB has approximately 90 times more total surface area than slag. Again, this is similar to results reported in the literature [24].

Table 1.
Elemental analysis and surface area data.
3.1.3. Point of Zero Charge
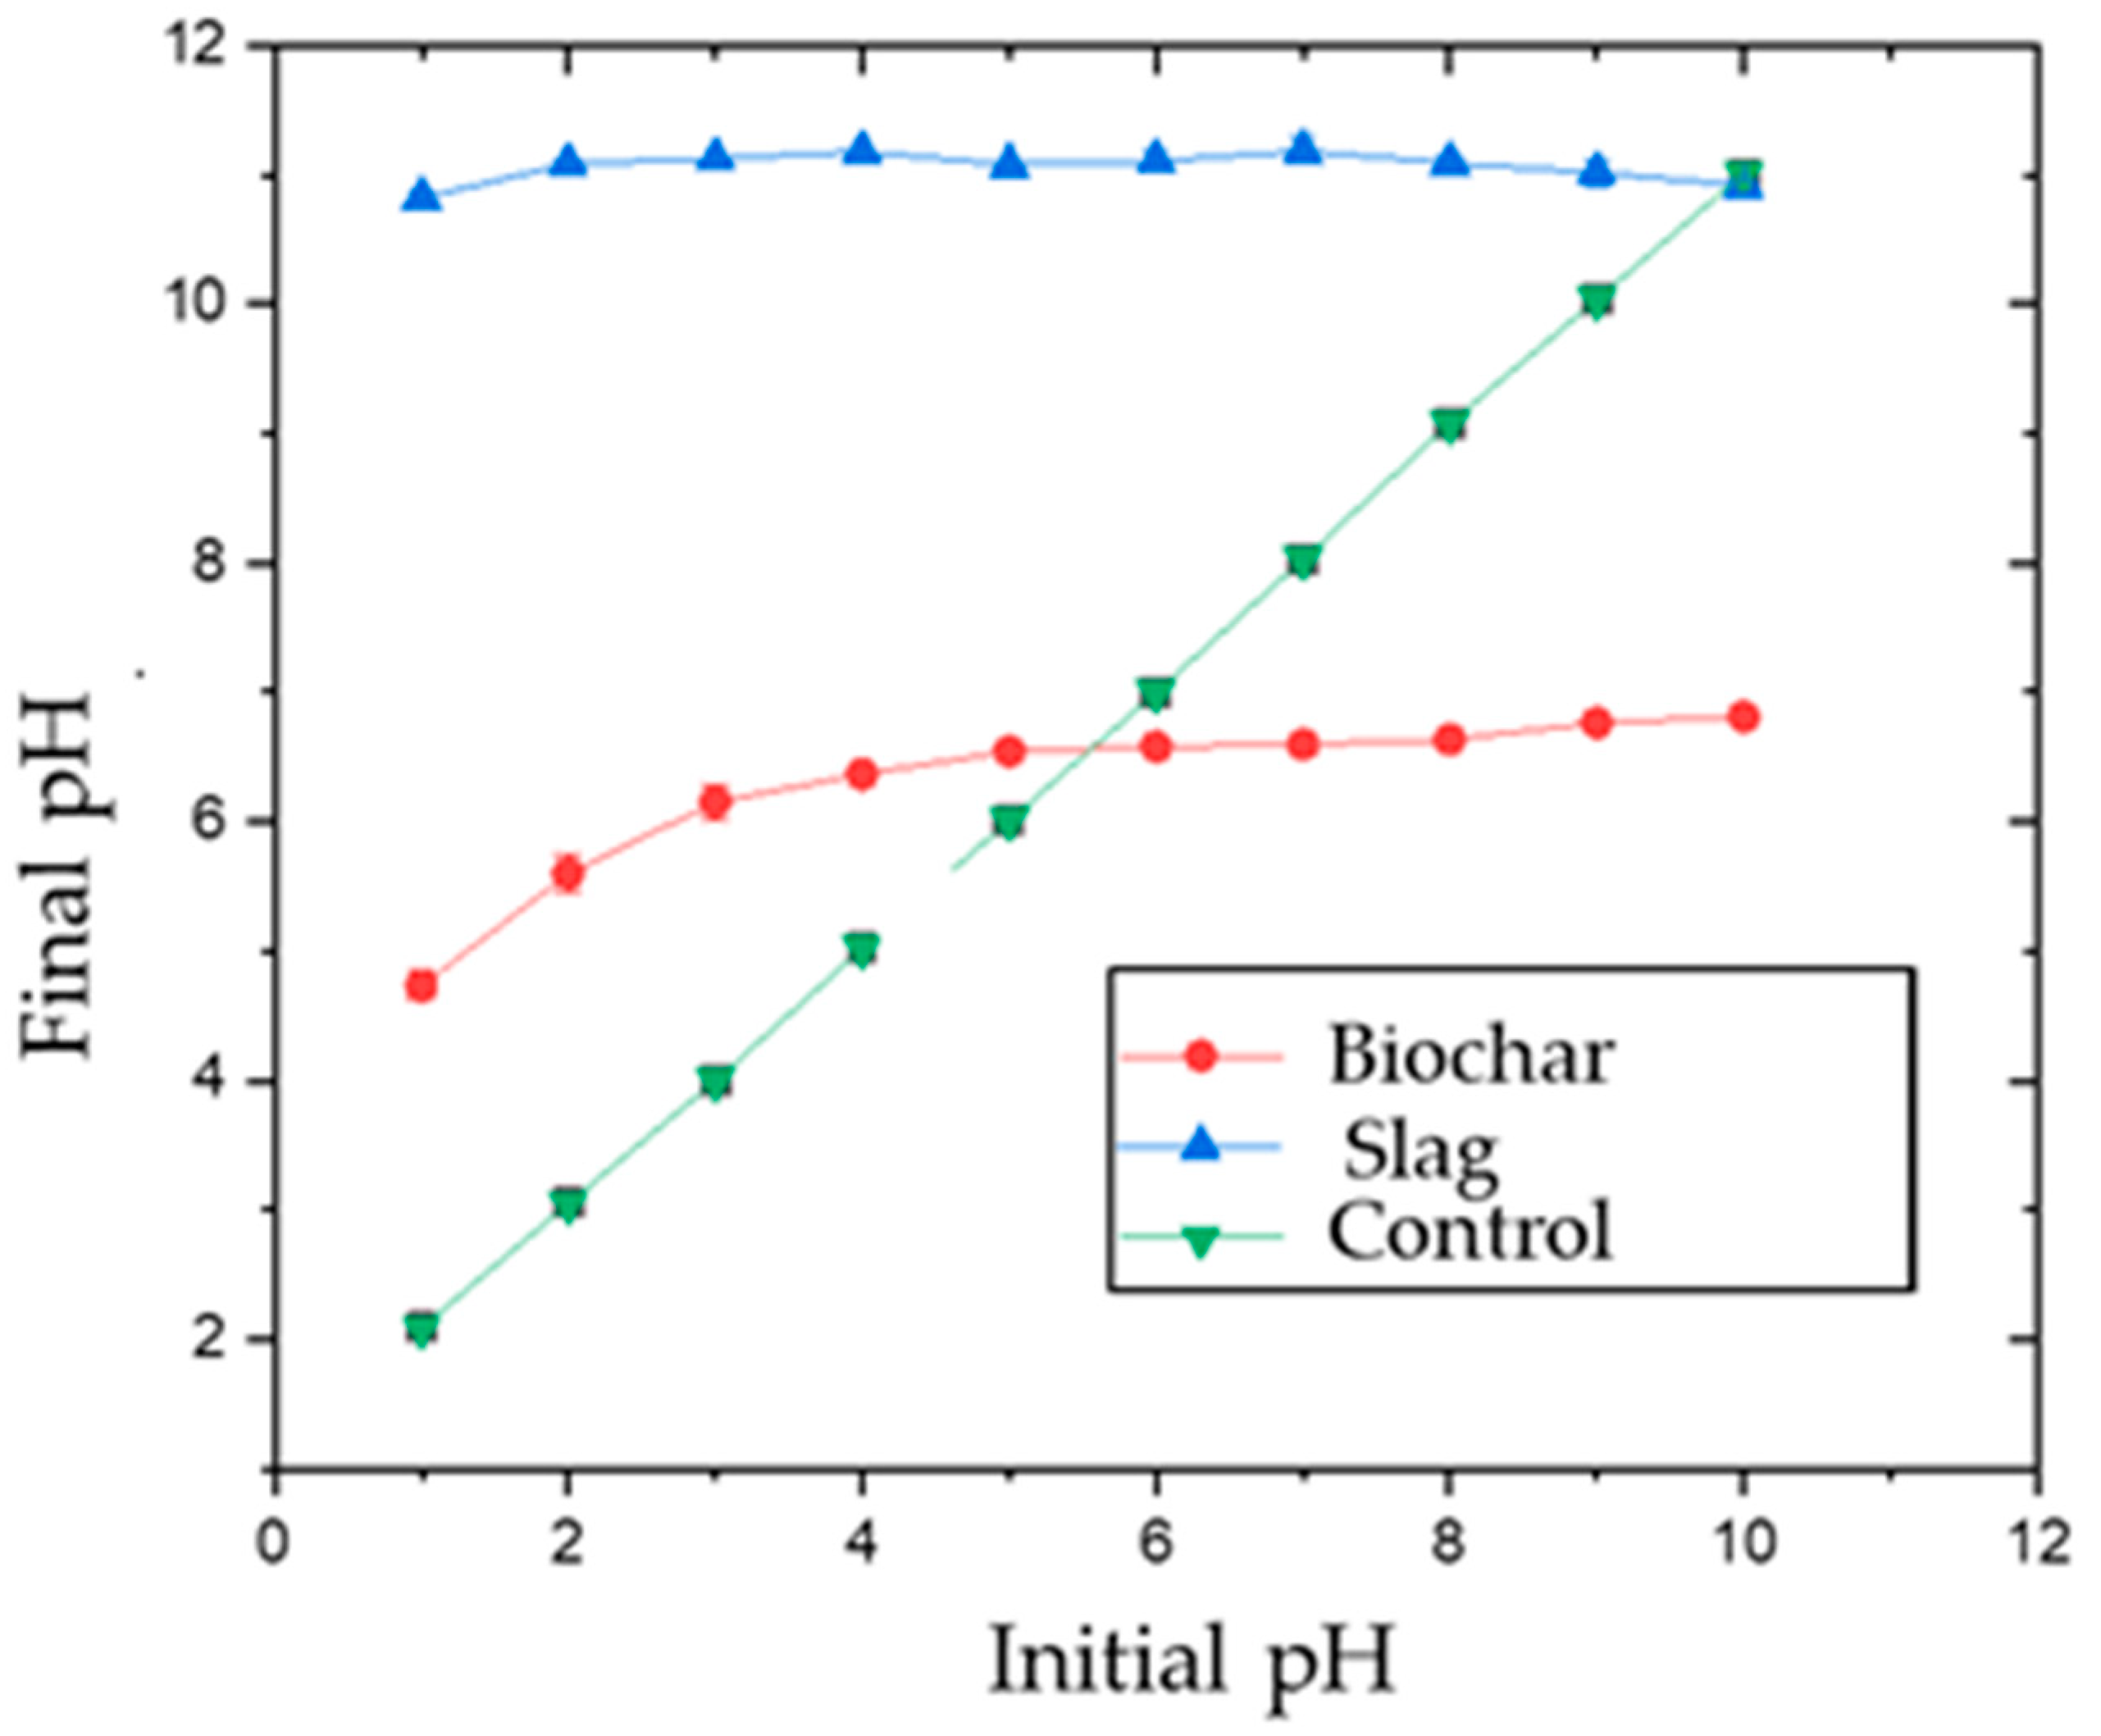
The point of zero charges (PZC) was determined using 0.01 M aqueous NaCl solution. The pH was adjusted using 0.1 M HNO3 and 0.1 M NaOH solutions to range from 2–12. Then, 0.05 g biochar or slag was added to 25 mL of the solution. The solution was placed in a shaker at 25 °C, and samples were shaken for 24 h at 150 rpm. Initial vs. final pH was plotted to determine PZC for both adsorbents. The PZC was found to be 5.6 and 10.0 for AMOB and slag, respectively (Figure 2) [25]. The organic portion of the AMOB contains carboxylic acid groups, which will lower the PZC. At the same time, the slag’s calcium carbonate and metal oxide/hydroxide components contribute to a higher point of zero charges [10].
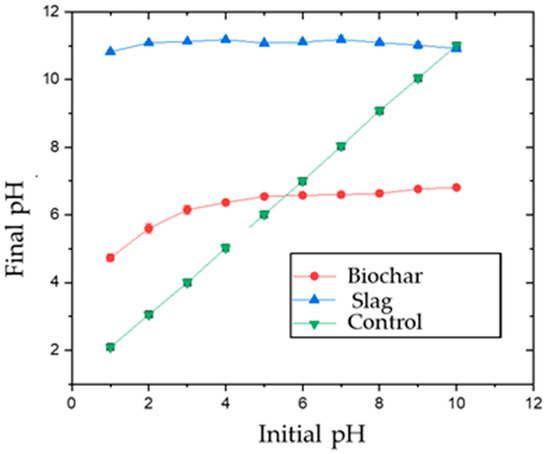
Figure 2.
Point of zero charges (PZC) for biochar and slag [adsorbent concentration = 1.0 g/L; shaking time 24 h].
3.1.4. Scanning Electron Microscopy (SEM) and Energy-Dispersive Analysis by X-ray (EDX)
Surface morphologies of the biochar and slag before and after phosphate adsorption have been analyzed via SEM (Figure 3) [26]. AMOB is much more porous and has a much higher surface area than slag. This high surface area contributes to AMOB’s fast phosphate adsorption rate and initial high capacity. SEM imaging of the slag after phosphate adsorption seems to show a rougher surface that supports surface adsorption or precipitation (Figure 3).
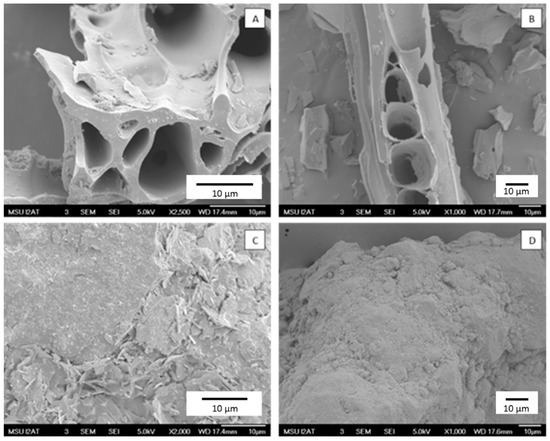
Figure 3.
Images (A,B) are SEM images of biochar A-before and B-after the adsorption of phosphate. Images (C,D) are SEM images of slag A-before and B-after the adsorption of phosphate [pH = 5.0; adsorbent concentration = 0.002 g/mL; 150 mg/L PO43− solution; shaking time 24 h].
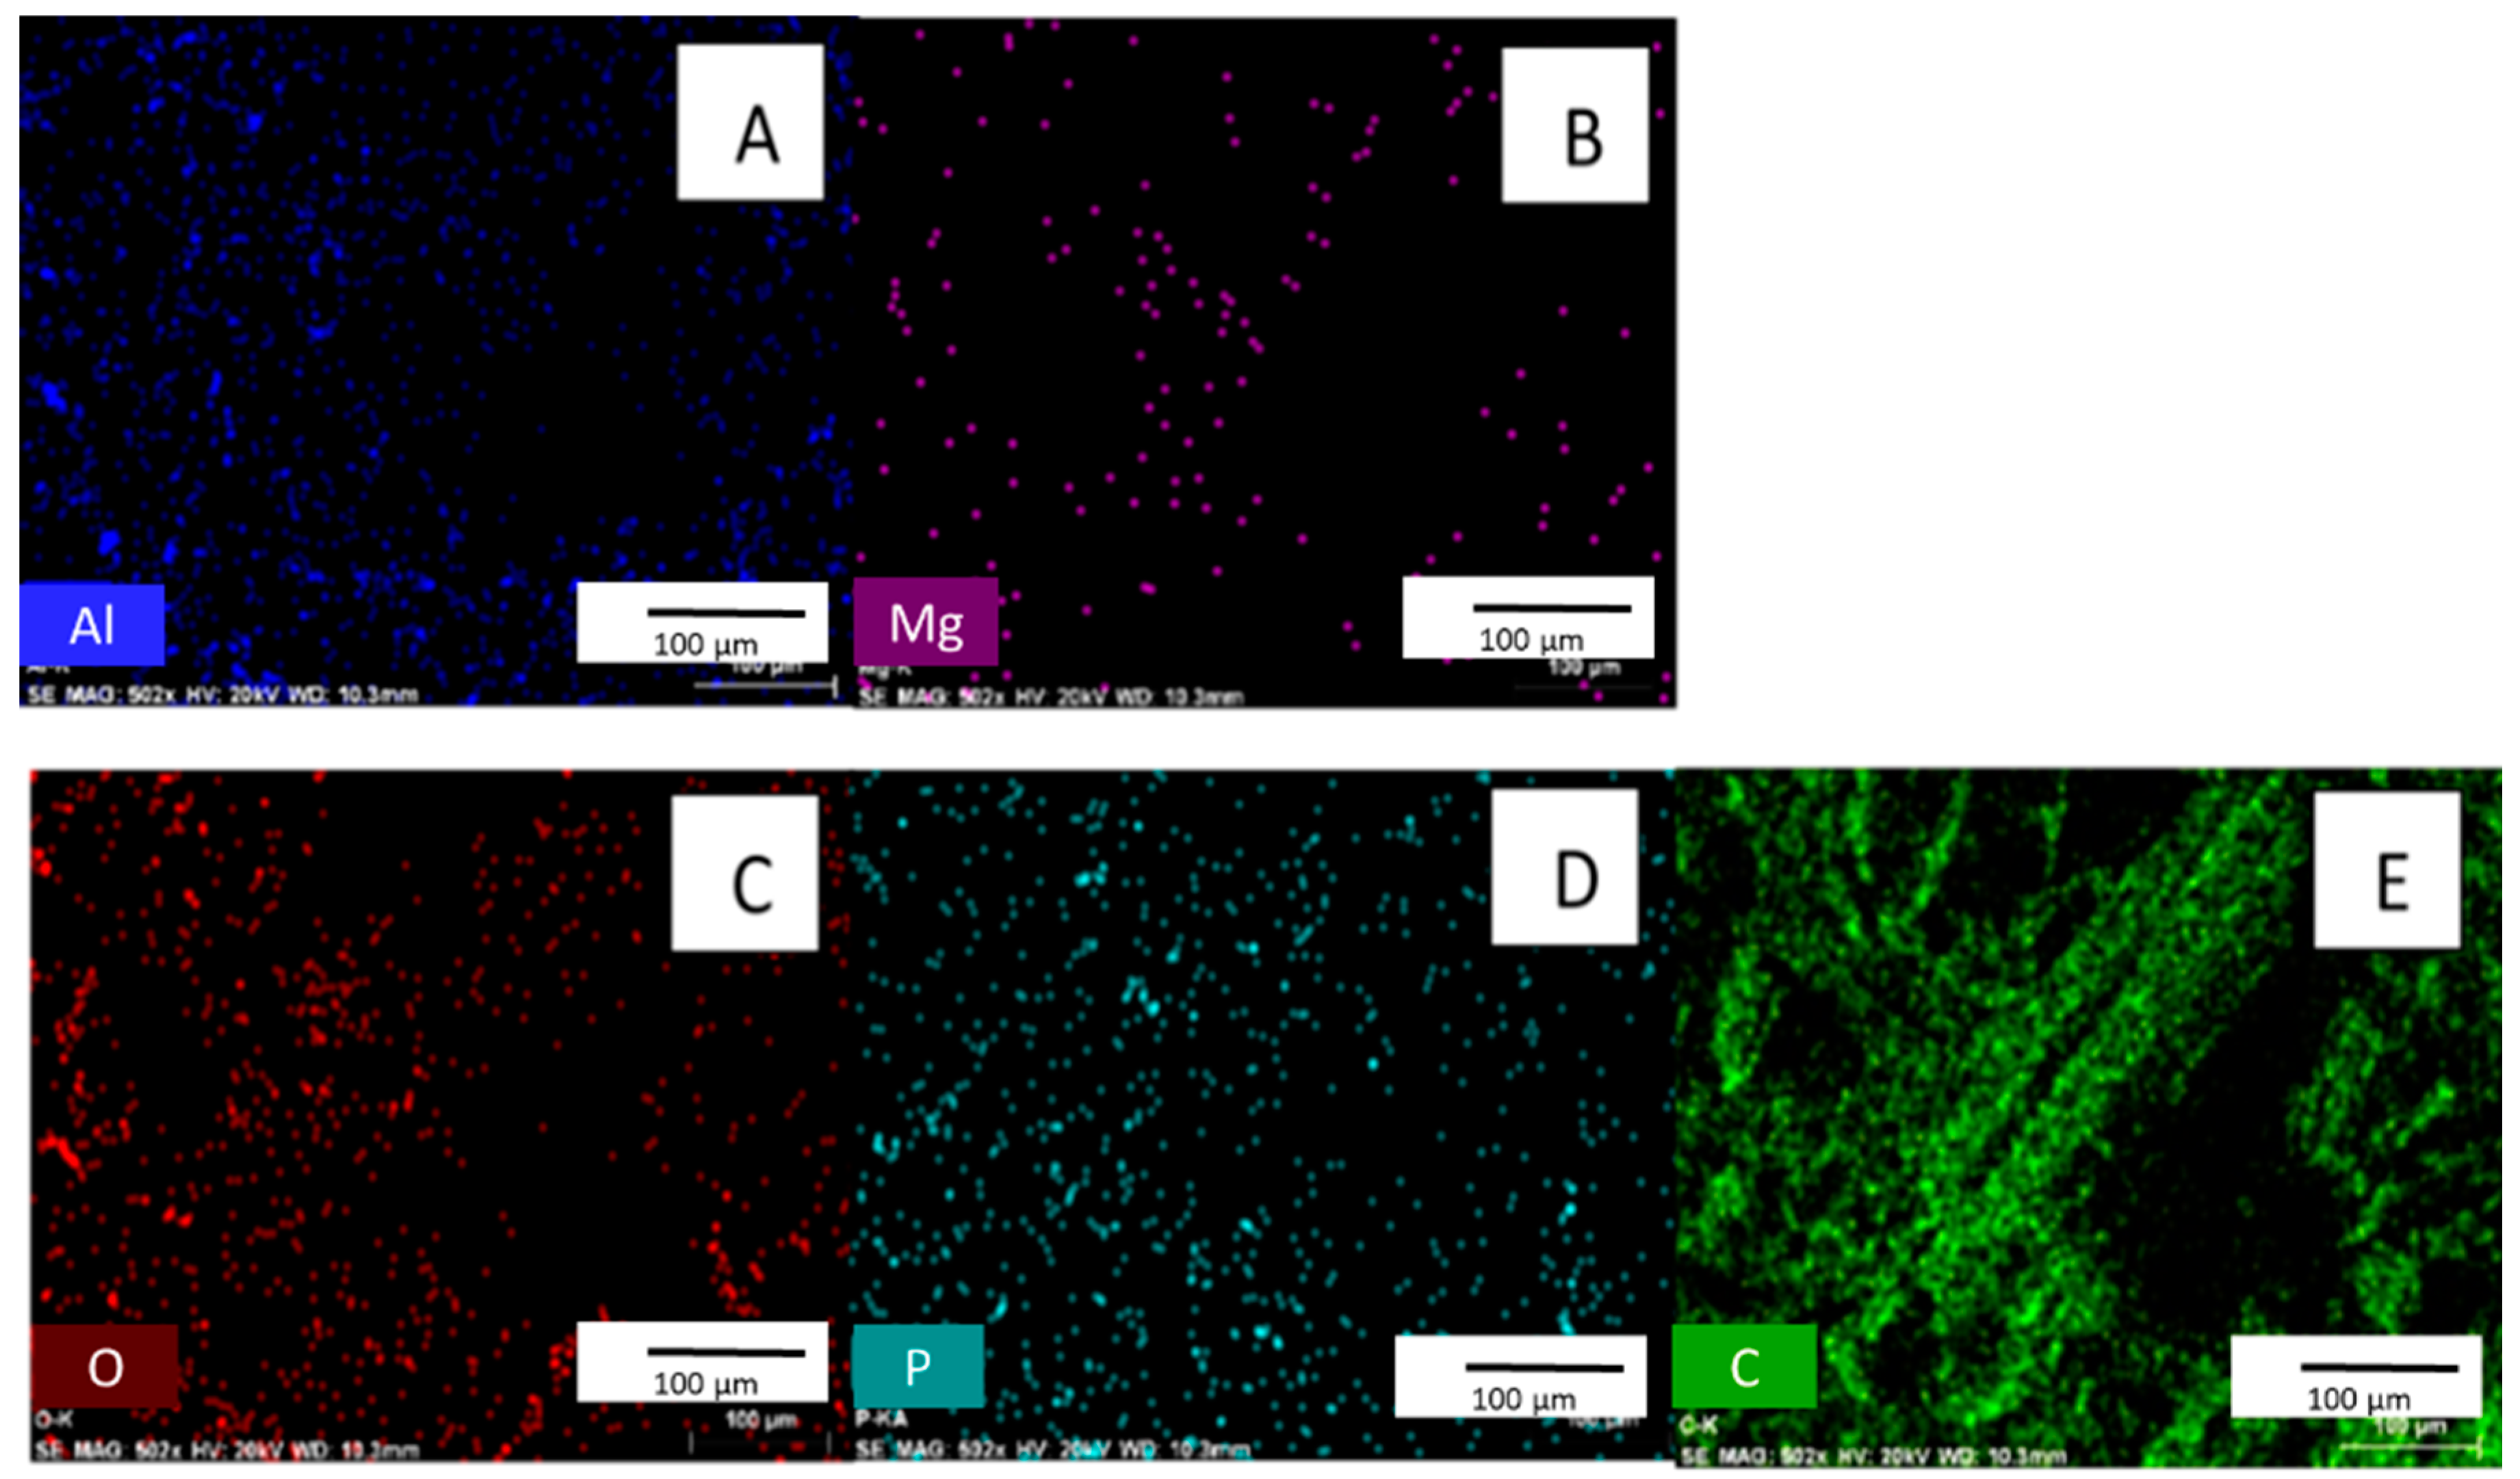
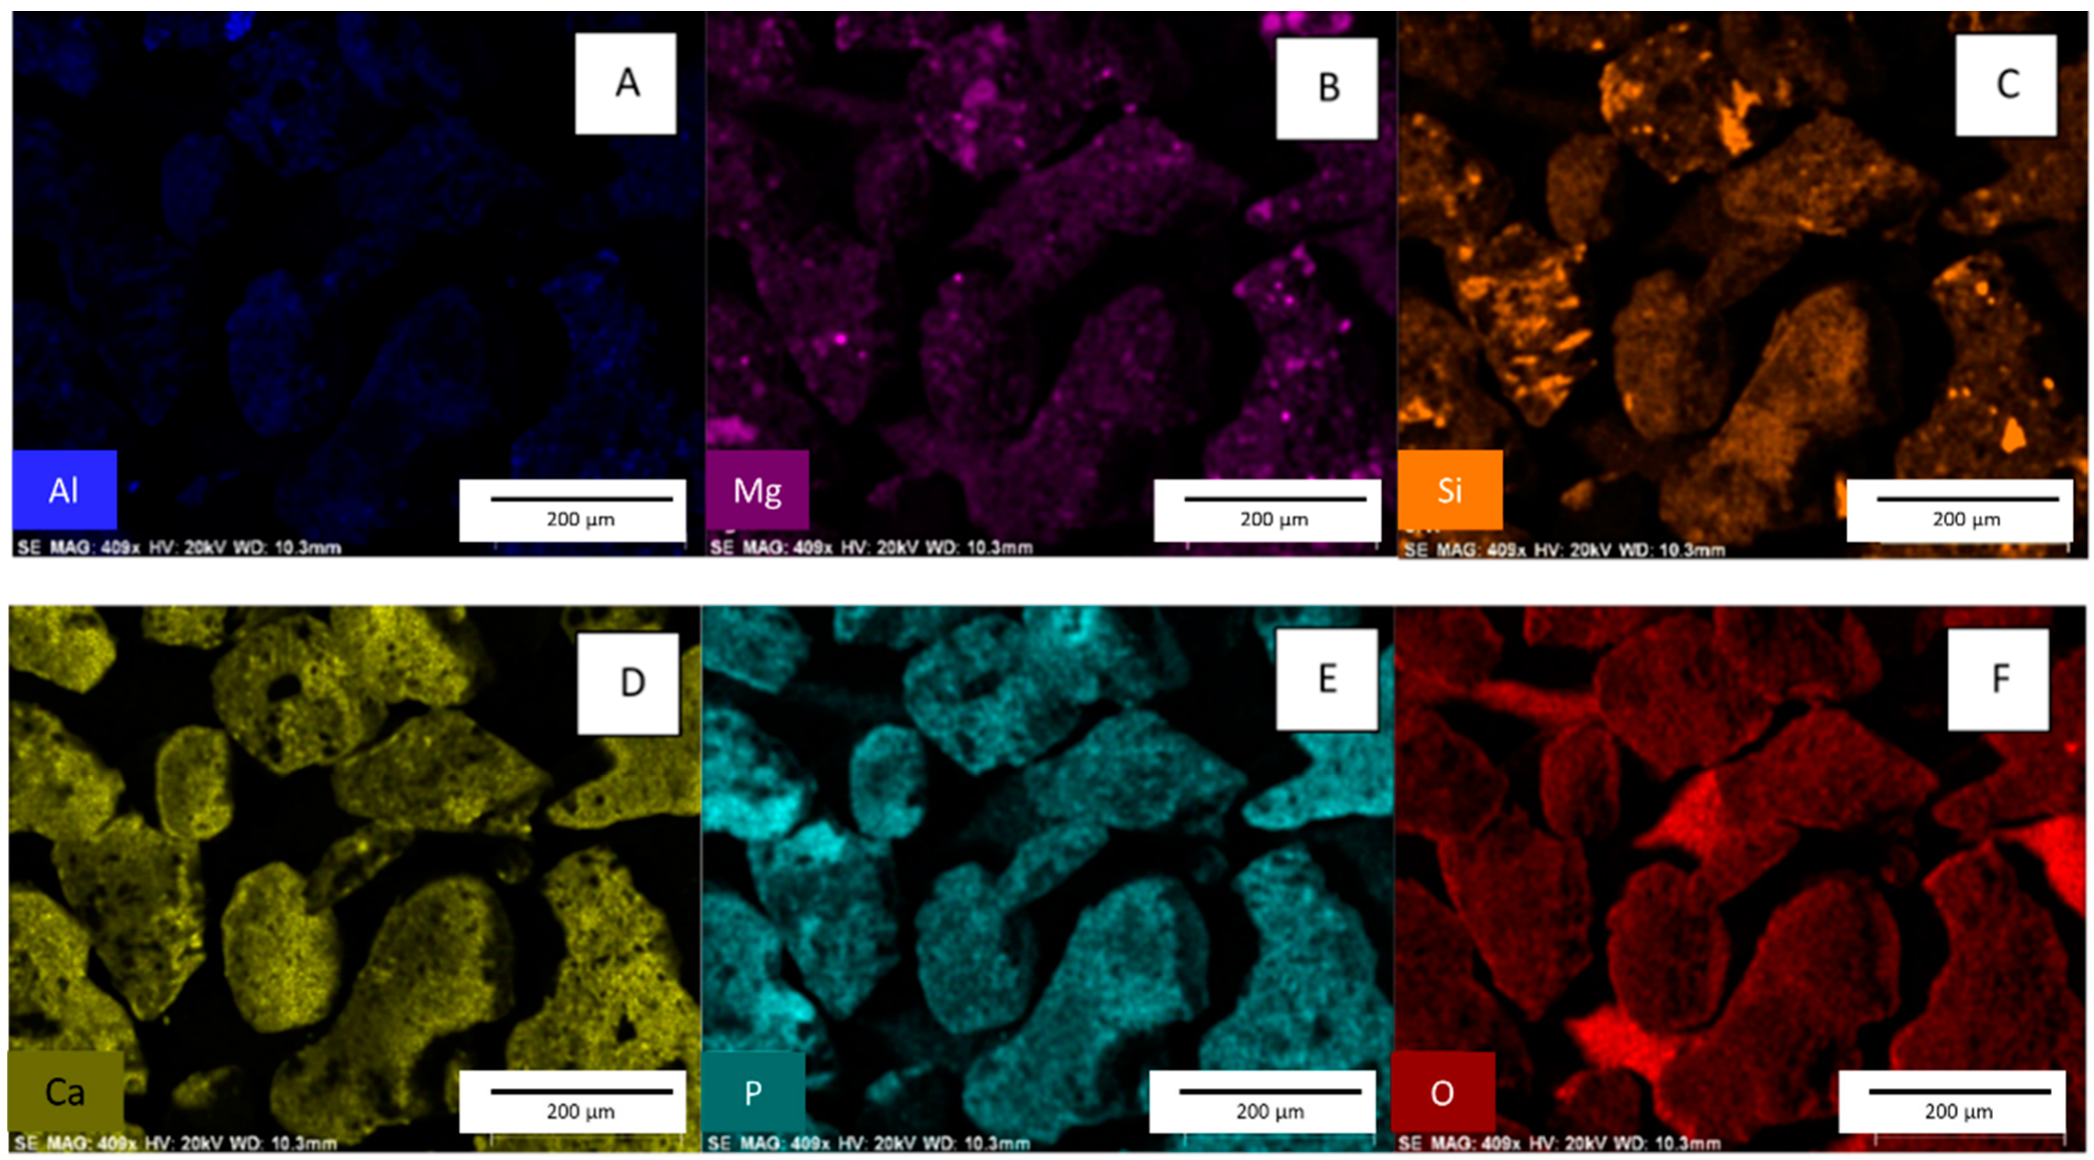
EDX confirms phosphate adsorption from an aqueous phosphate solution [27,28]. EDX is affected by selected point locations and can have high variability within a single sample. Therefore, EDX is used for qualitative purposes only [18]. Figure 4 shows that phosphorus is present in biochar after exposure to phosphate solution. No phosphate exists in the original material (See Supplemental Figure S1 for EDX spectra of biochar before phosphate adsorption).
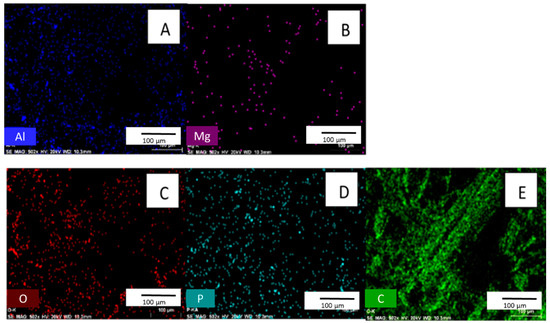
Figure 4.
Images (A–E) are EDX surface scans of biochar after the adsorption of phosphate. [pH = 5.0; adsorbent concentration = 0.002 g/mL; 500 mg/L PO43− solution; shaking time 24 h].
EDX spectra show that some phosphate removed from the solution is absorbed onto the slag surface (Figure 5) [4]. See Supplemental Figure S2 EDX spectra for slag before phosphate adsorption, which shows no phosphorus on the native material.
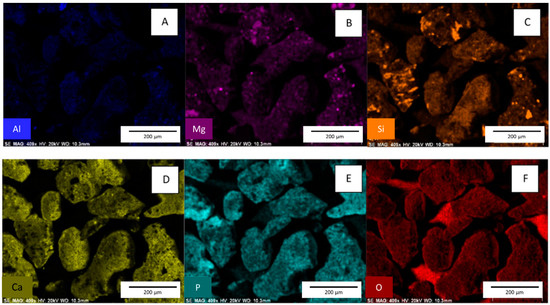
Figure 5.
Images (A–F) are EDX surface scans of slag after the adsorption of phosphate. [pH = 5.0; adsorbent concentration = 0.002 g/mL; 500 mg/L PO43− solution; shaking time 24 h].
3.2. Adsorption Properties of Biochar and Slag
Phosphate removal from an aqueous solution can occur via various mechanisms. The most prominent are adsorption onto an adsorbent surface and precipitation from the solution. Precipitation is a two-step process where metal ions first must leach out of the adsorbent and then form an insoluble complex with phosphate. Many metals form metal-phosphate complexes with low Ksp values, which effectively removes phosphate from the solution, including calcium and aluminum ions, which leach from slag. Comparing the phosphate removal characteristics of slag and biochar must consider both phenomena. Studies performed at low concentrations and shorter times allow the analysis of surface adsorption. In comparison, studies performed at high concentrations and longer times are designed to study metal leaching effects on phosphate removal from solution.
3.2.1. Temperature and pH
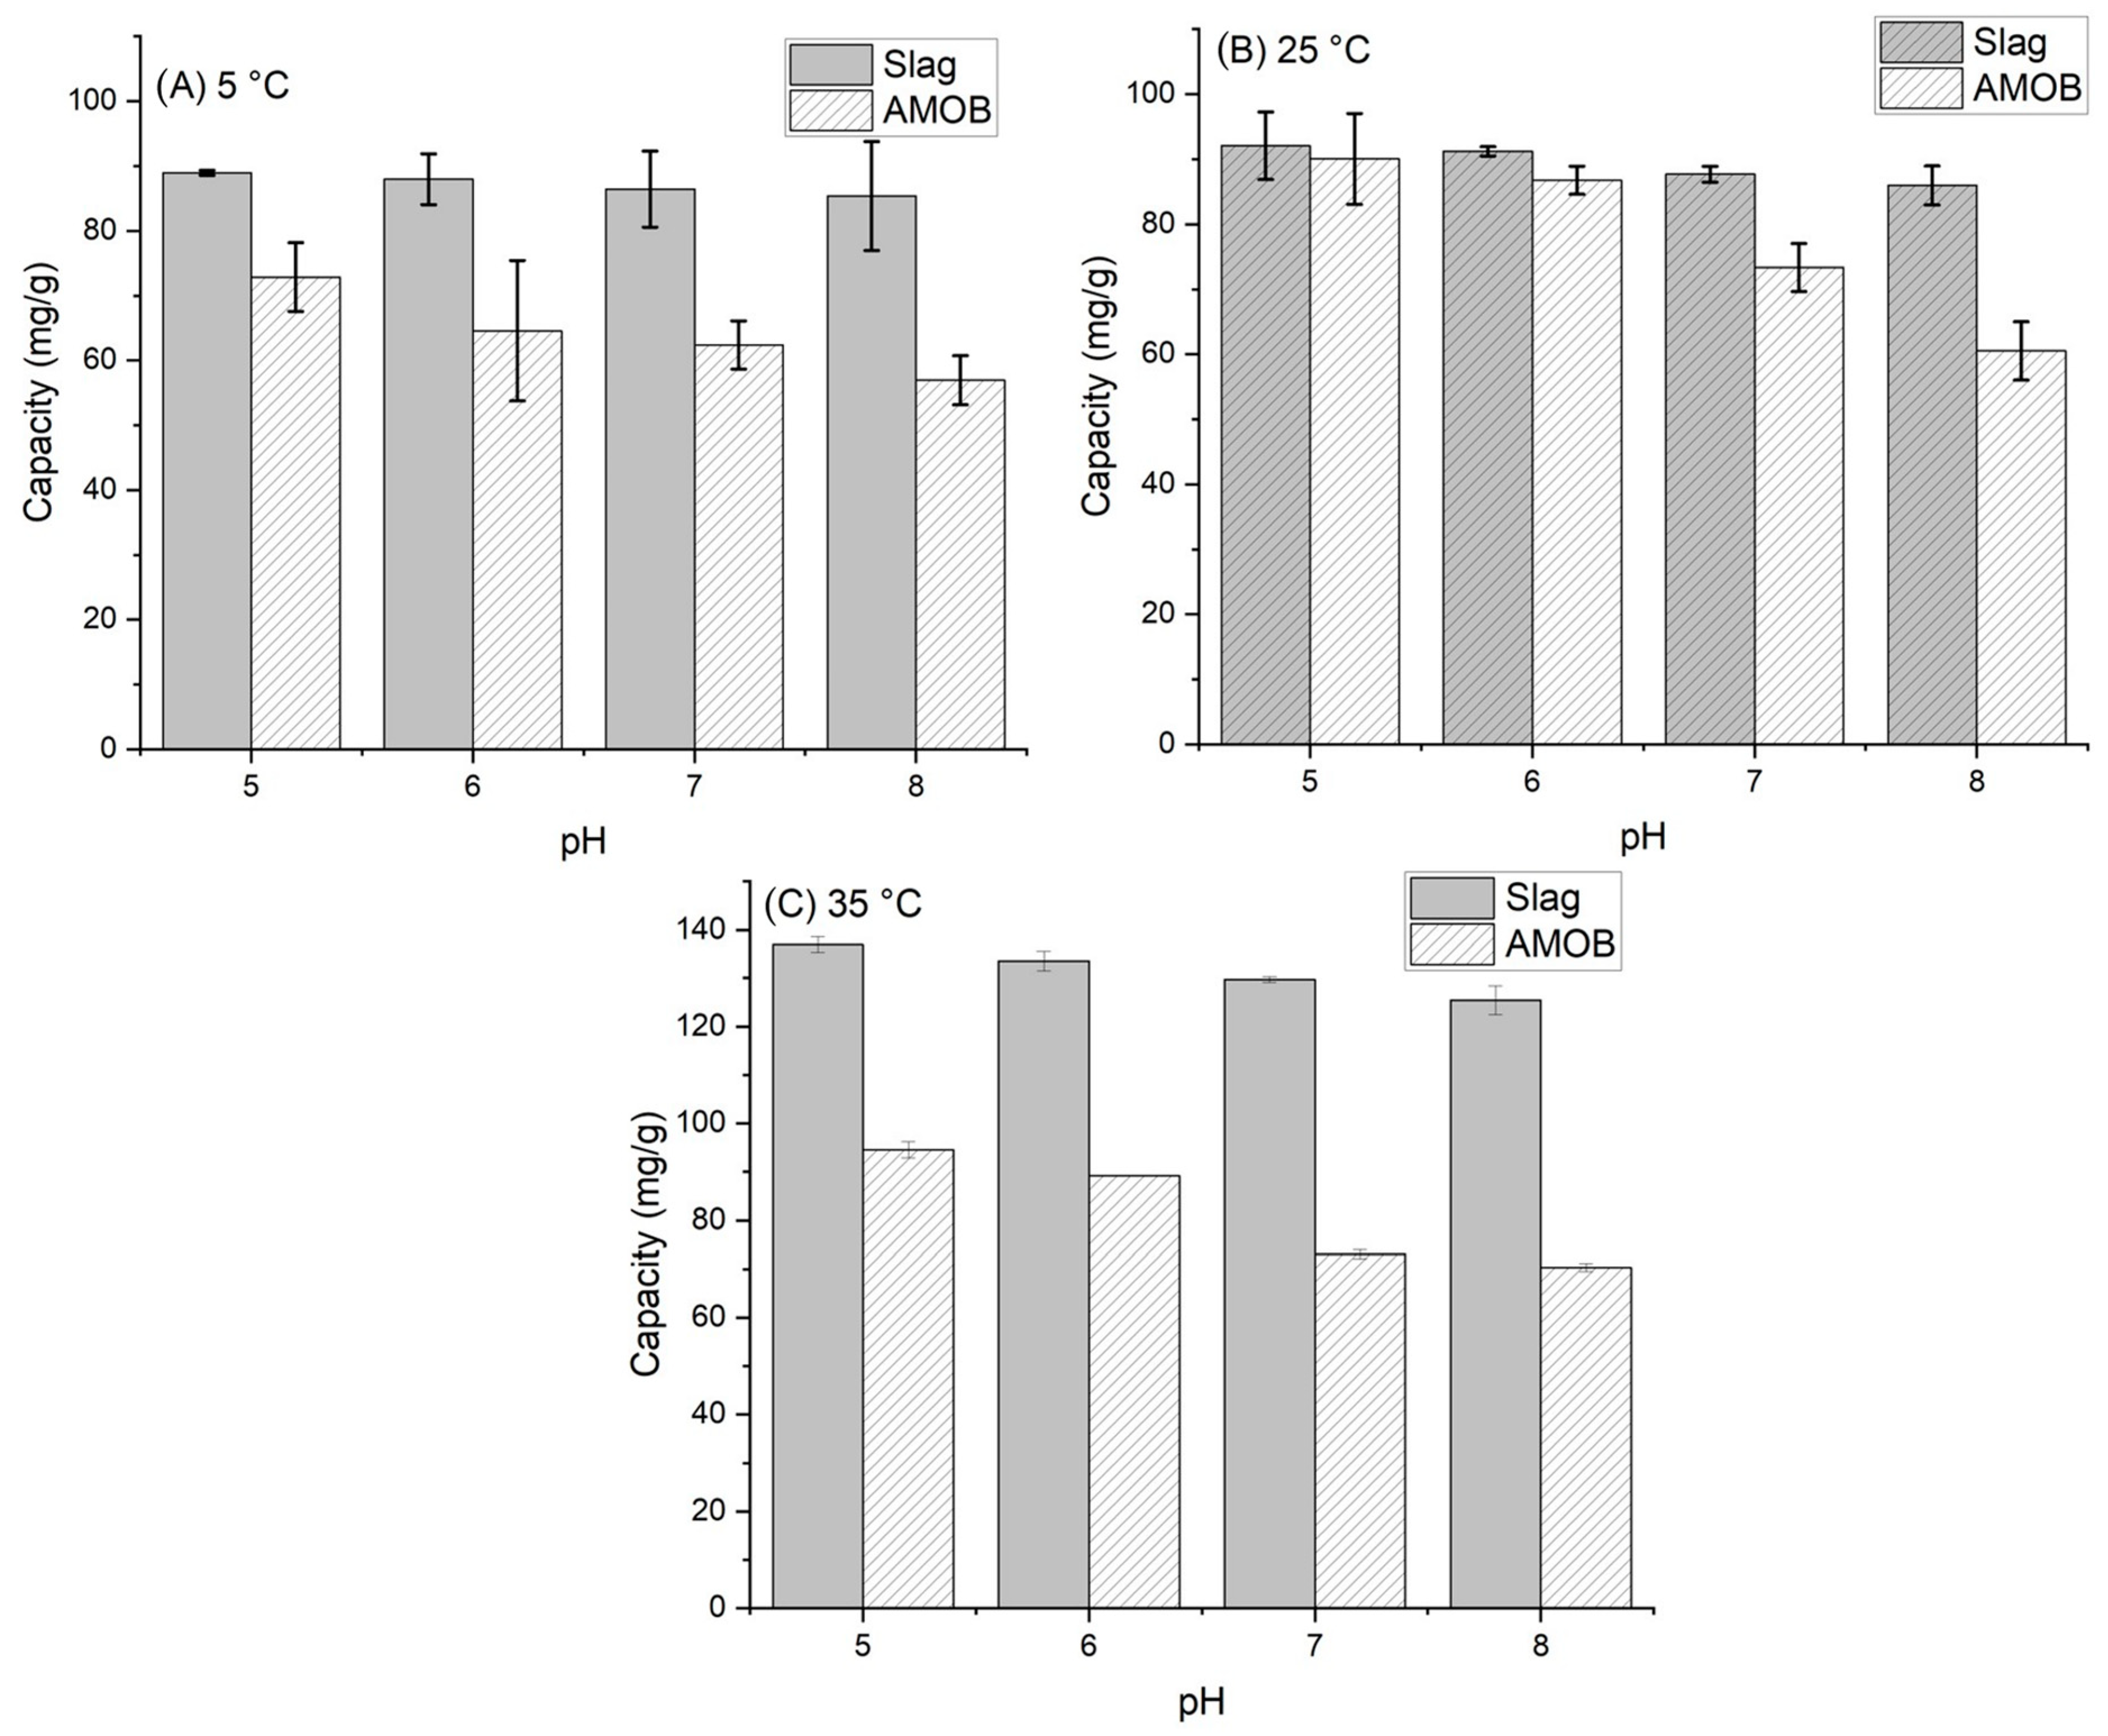
The effect of pH on phosphate adsorption was analyzed from 5 to 35 °C and over a pH range of 5.0–8.0 (Figure 6). This range was chosen based on historical agricultural runoff data collected at Mississippi State University [29,30,31]. Phosphate adsorption onto biochar depends partly on the solution pH. If the pH is low, surface functional groups (oxygen containing groups) are predominately protonated [32]. Conversely, the adsorption capacity decreases as the pH increases due to electrostatic repulsion between the negative phosphate ion and the negative charge surface functional group [14,15,33]. A similar effect can be seen in the metal oxide surface of the slag. However, adsorption increases with increasing temperature in both cases. Therefore, PO43− adsorption onto AMOB and slag is an endothermic process.

Figure 6.
Sorbent adsorption capacity vs. pH for (A) 5 °C, (B) 25 °C and (C) 35 °C temperatures [adsorbent concentration = 0.002 g/mL; 500 mg/L PO43− solution; shaking time 24 h. Samples were run in triplicate].
3.2.2. Kinetics
Pseudo first and second order kinetic models (Table 2) were used to fit the uptake of PO43− versus time. The first order model is given as:
where qt is the amount of PO43− adsorbed at the time (t), qe is the amount adsorbed at equilibrium, and k1 (h−1) is the first order adsorption rate constant. The second order model is given as:
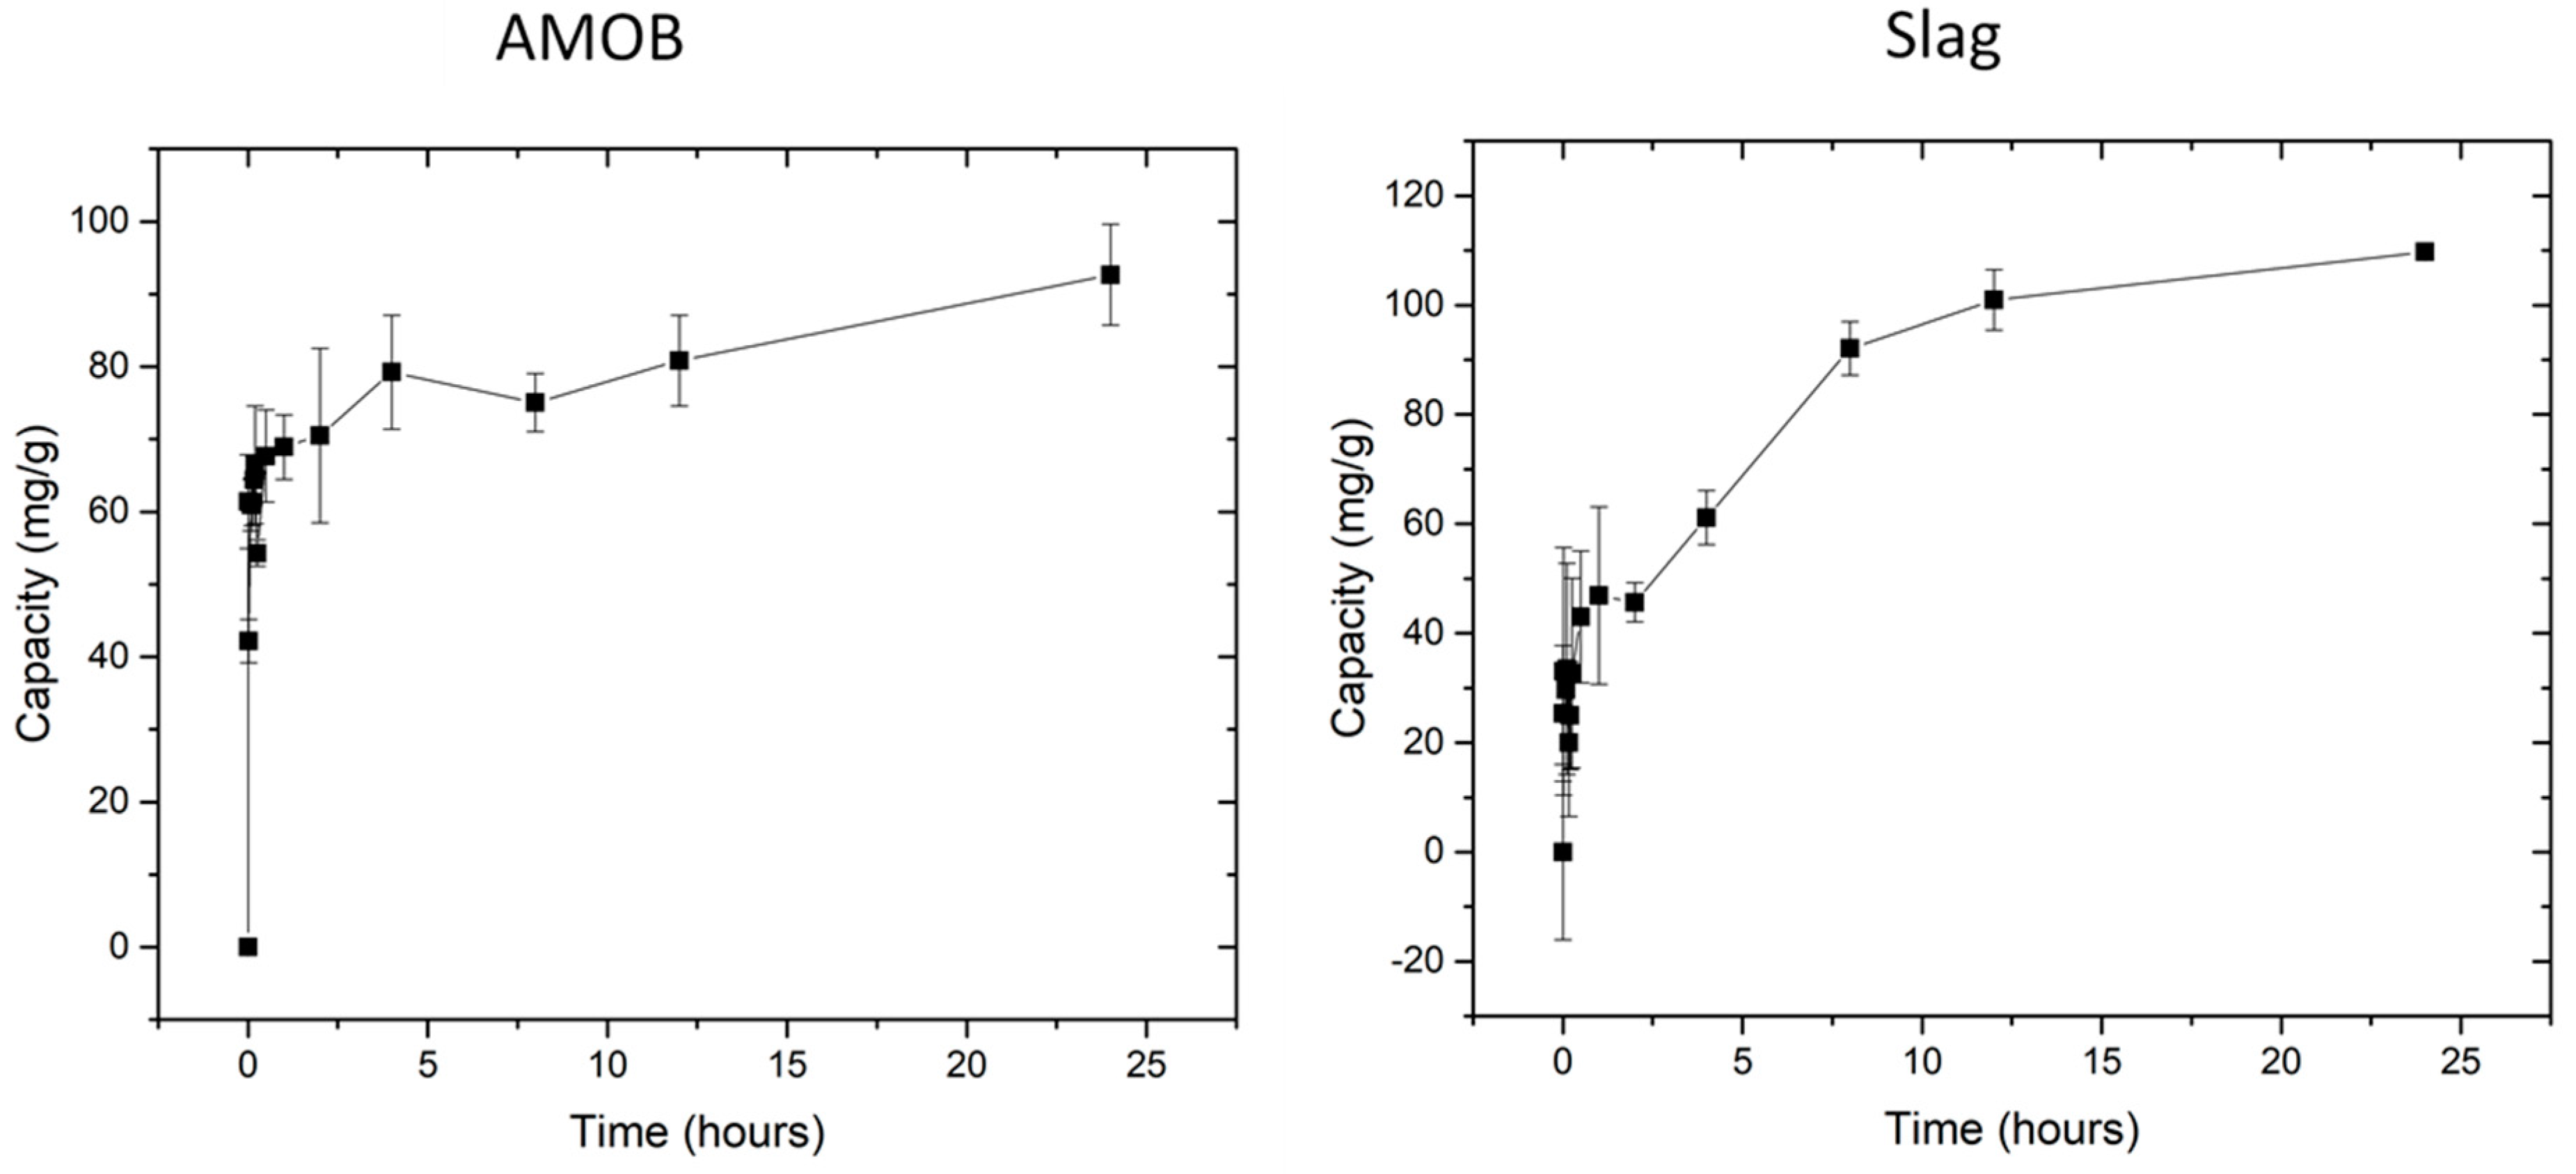
where qt is the amount of PO43− adsorbed at the time (t), qe is the amount adsorbed at equilibrium, and k2 (h−1) is the second order adsorption rate constant. Figure 7 shows the capacity of PO43− versus shaking time. Equilibrium capacity is reached in 30 min for biochar, whereas slag reaches its equilibrium adsorption capacity within 8 h.
Table 2.
Pseudo-second order parameters for phosphate adsorption [pH = 5.0; adsorbent dose = 1.0 g/L; 150 mg/L PO43−; 25 °C; 150 rpm shaking].
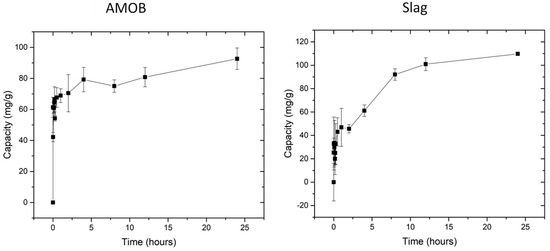
Figure 7.
Biochar reached equilibrium within 30 min. Slag reached equilibrium within 8 h. [pH = 5.0; adsorbent concentration = 0.002 g/mL; 500 mg/L PO43− solution; shaking time 24 h].
Both slag and the biochar demonstrate rapid initial adsorption. However, two phosphate removal mechanisms are occurring with the slag. First, the slag adsorption appears to equilibrate after 2 h before increasing for several more hours. Second, AMOB reaches equilibrium within 30 min before slowly rising over the next several hours. The first point of equilibrium likely occurs when the slag surface has reached its phosphate adsorption capacity. This process takes longer for slag as AMOB has both larger pores and surface area (from SEM and BET analysis), and thus faster access to adsorption sites. Slag’s smaller pores and low surface area limit the amount of phosphate that can be adsorbed.
Shortly after slag’s initial plateau, it begins removing more phosphate from the solution. This is likely due to slag’s leaching of metal ions such as calcium, aluminum, and magnesium. Slag and biochar were added to a DI water solution at 0.02 g/mL for 24 h with a shaking speed of 150 rpm at 25 °C, and the filtrate was analyzed using ICP-OES (Table 3). These metal ions form low Ksp complexes when bound to PO43− [15]. This causes precipitation of the phosphate from the solution to form insoluble salts. When comparing both materials’ speed of phosphate removal (including surface adsorption and precipitation), it is seen that biochar is faster than slag, with equilibration times of 30 min vs. 8 h. However, over time, the capacity of the slag (surface adsorption and precipitation) exceeds that of biochar (surface adsorption).
Table 3.
Amount of Ca, Al, and Mg introduced into DI water from 0.02 g/mL adsorbent shaken at 150 rpm for 24 h.
The R2 values were calculated to be 0.999, and Q experimental and Q calculated were very similar for slag and AMOB, indicating that adsorption is pseudo second order. Linearized, log(qe − qt) vs. t, 1st order kinetic plots and parameters can be found in the Supplemental information (Figure S4 and Table S1).
3.2.3. Isotherms
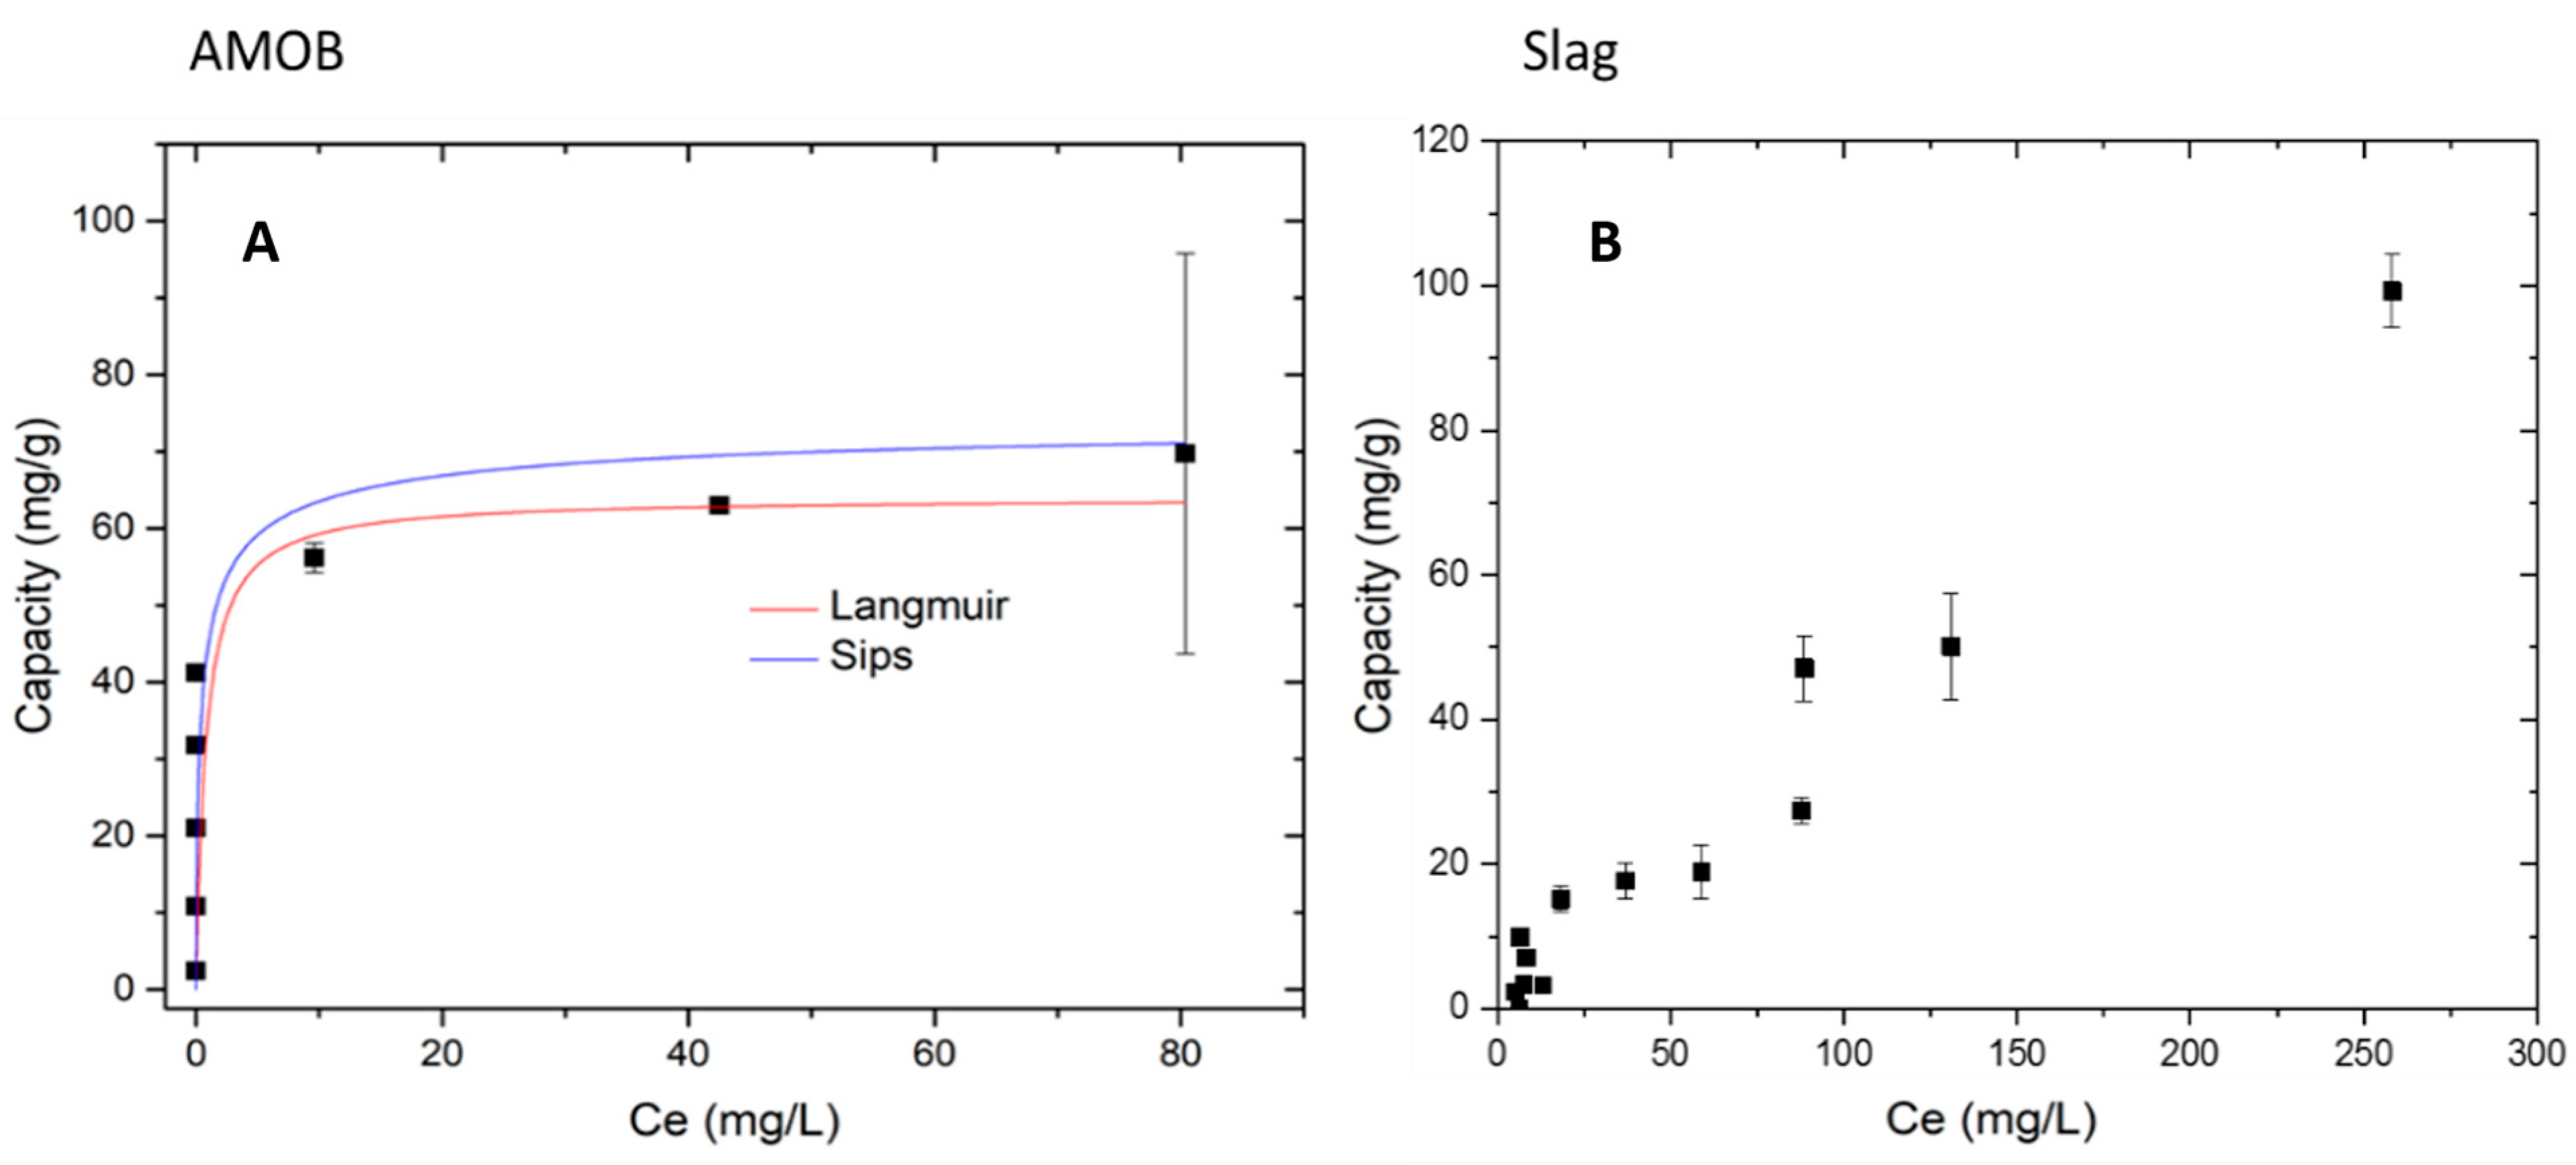
With leaching and precipitation, the authors realize that isotherms capacities are not entirely accurate for these materials. However, AMOB and slag were examined using Langmuir and Sips isotherms. Langmuir isotherm was used to determine the maximum monolayer adsorption capacity (Q). These isotherms were analyzed for a temperature of 25 °C. Langmuir and Sips isotherms [34] were evaluated and modeled using nonlinear regression software.
Figure 8 below shows the adsorption data fitted to Langmuir and Sips isotherm models for AMOB. Langmuir was a good fit, R2 values > 0.998 in the case of AMOB. For slag, however, the adsorption models chosen would not fit the observed ‘adsorption.’ The maximum capacities for AMOB at 25, 35, and 45 °C are 36.5, 35.1, and 34.3 mg/g, respectively. For slag, the maximum capacities are 58.6, 48.8, and 47.7 mg/g for 25, 35, and 45 °C similarly. This observed phosphate removal capacity includes the phosphate precipitated from the solution. The complete graph of phosphate capacity vs. equilibrium concentration (Figure S3) shows slag’s phosphate immobilization to be 55.2% greater than AMOB.
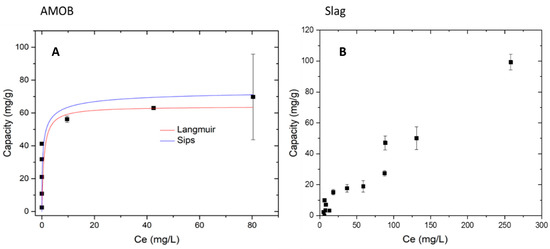
Figure 8.
Langmuir and Sips isotherms modeled for AMOB and slag adsorption processes. (A) Langmuir isotherm for AMOB capacity 69.7 mg/g, (B) Slag observed capacity 109.7 mg/g, adsorbent concentration = 0.002 g/mL; shaking time 24 h].
Table 4 shows parameters for fitting the isotherms for PO43− adsorption. The higher capacity in the AMOB compared to slag shows that at lower concentrations, AMOB adsorbs more phosphate onto its surface.
Table 4.
Parameters for fitting phosphate adsorption to isotherm models.
- Adsorption Mechanism
In addition to the electrostatic surface adsorption of phosphate, layered double hydroxides likely adsorb phosphate. Phosphate adsorption into the LDH structures can result from inner-sphere mono- and bidentate surface complexation [14]. This process is conducted by ligand exchanging surface hydroxyl groups with phosphate ions. Ion exchange into the LDH also heavily governs the mechanism by which phosphate is adsorbed. An example of this is shown in Scheme 1. An electrostatic attraction between the positively charged metal oxide/hydroxide layer surface and the negatively charged phosphate ion is shown below.
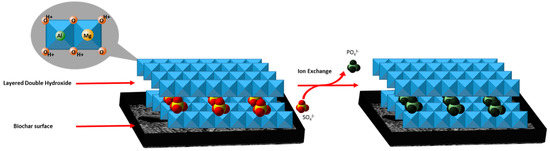
Scheme 1.
Example of intercalated sulfate anions undergoing exchange with phosphate anions in LDHs. Likewise, hydrated, hydroxide anions can exchange with phosphate anions.
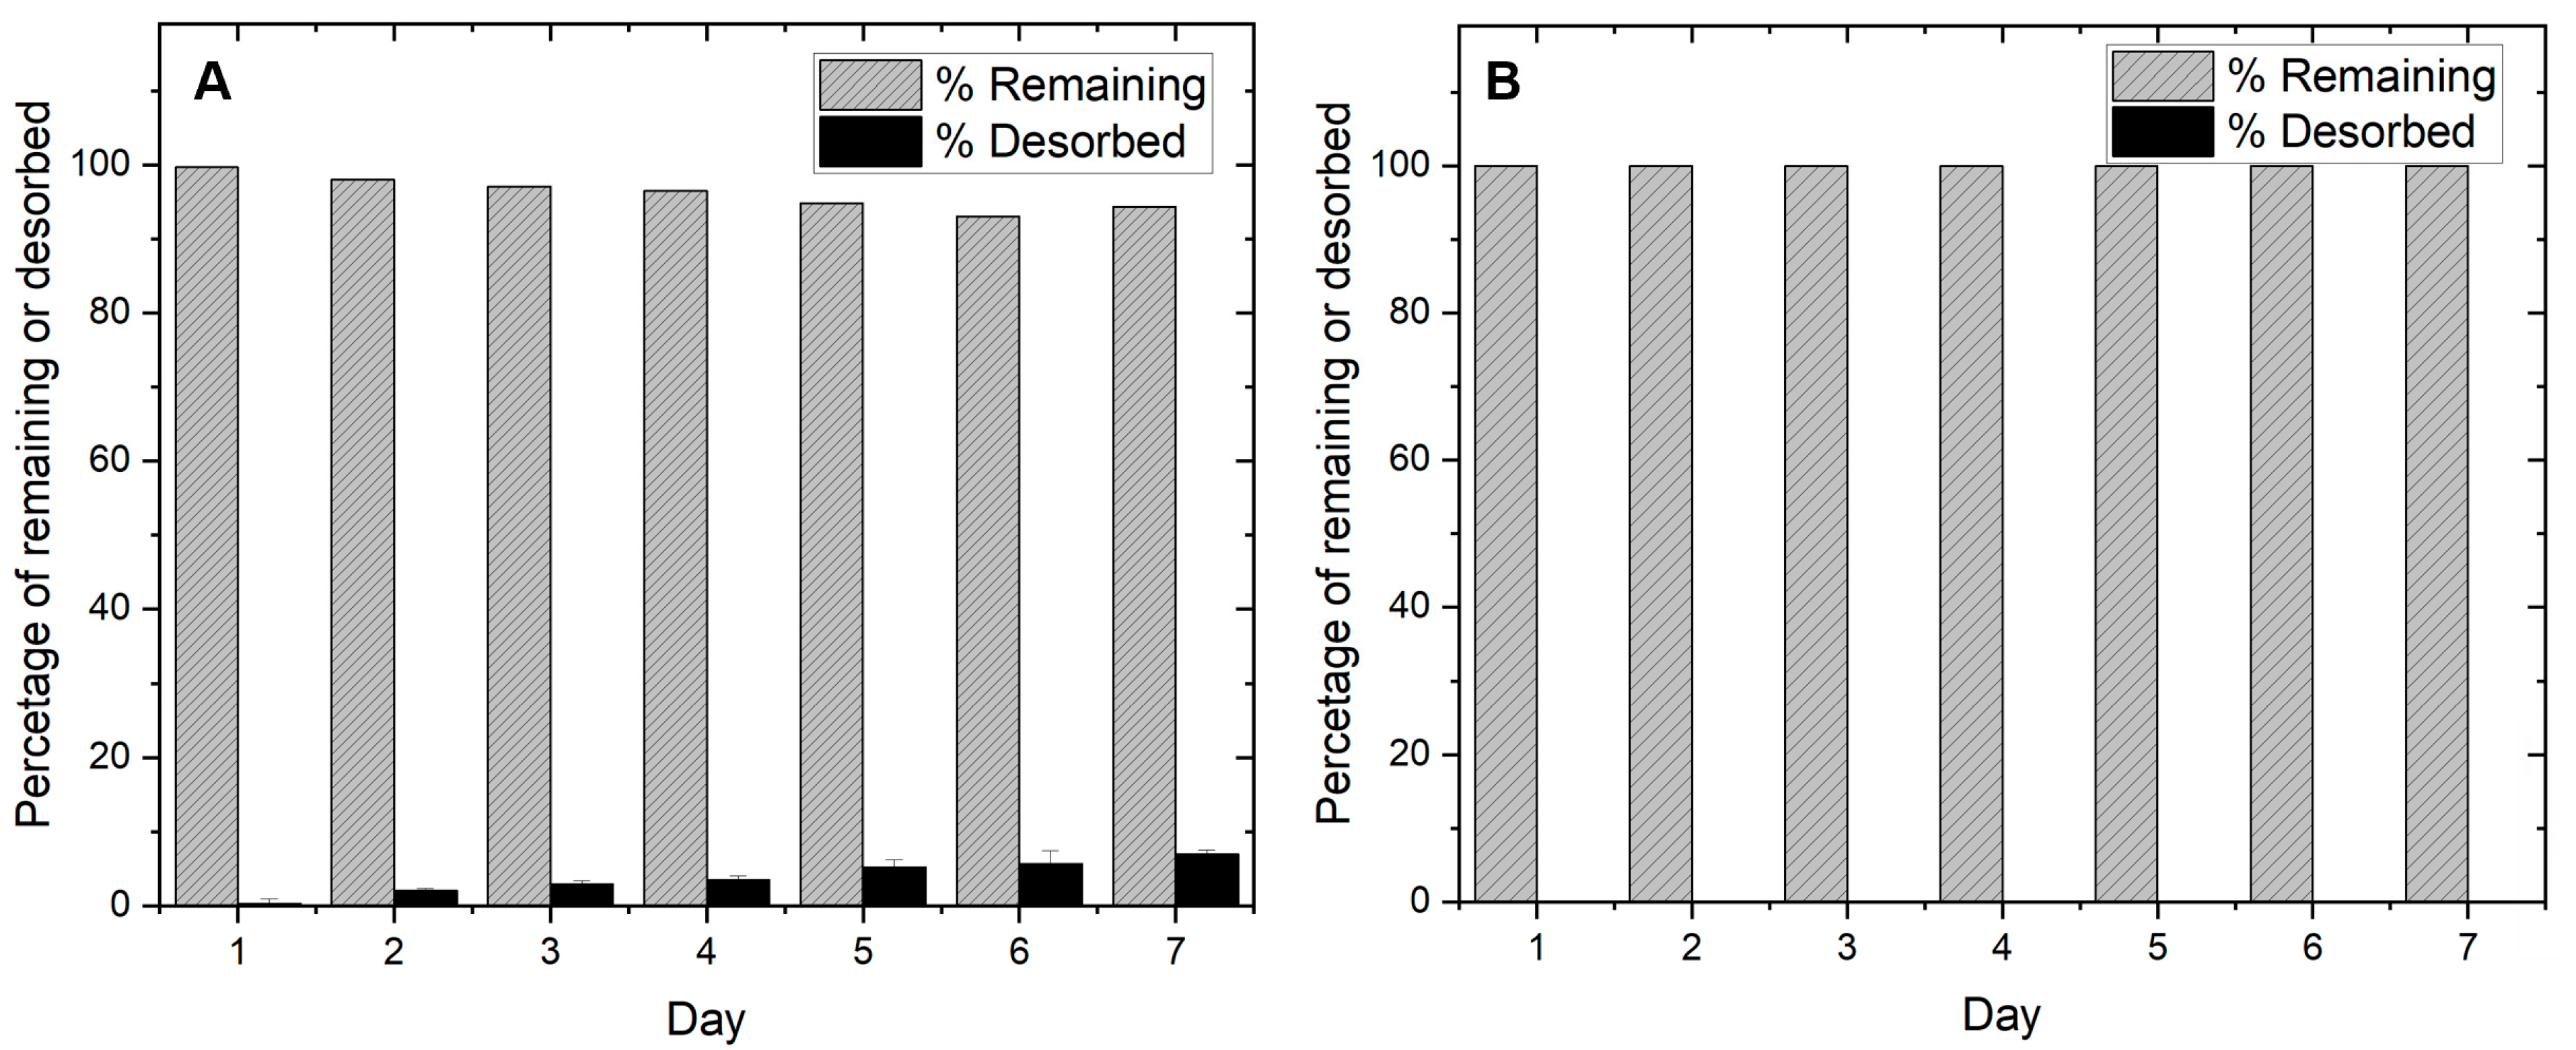
3.2.4. Desorption Study
Desorption was studied for biochar and slag at a dosage of 0.002 g/mL of deionized water and shaken at 25 °C at 150 rpm. Over seven days, the amount of phosphate desorbed was analyzed. The results are shown in Figure 9 below.
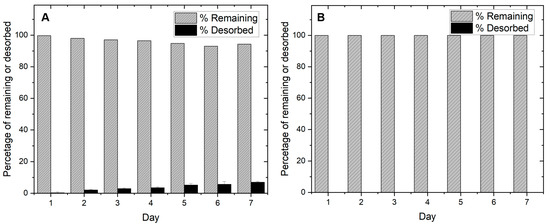
Figure 9.
Desorption of phosphate from (A) slag and (B) AMOB over a 7-day period [pH = 5.0; adsorbent concentration = 0.002 g/mL].
Figure 9 shows that both materials significantly retain their adsorbed phosphate. However, slag slowly releases a small amount of phosphate over a seven-day period (5.7%), which may limit long term field adsorption use. AMOB does not release its phosphate quickly. This may allow the biochar to be recycled after phosphate collection and reintroduced to agricultural lands. Slag removes more phosphate than AMOB, but because most of the phosphate is fixed by precipitation reactions and not sequestration on the surface, phosphate recycling becomes more of a challenge. Based on the above adsorption results, a runoff filtration system comprised of slag and biochar in tandem could be a better solution for retaining and recycling phosphate than AMOB or slag alone. For this reason, column sorption studies were performed to show how phosphate would be retained in a filtration system.
4. Column Sorption Breakthrough Studies
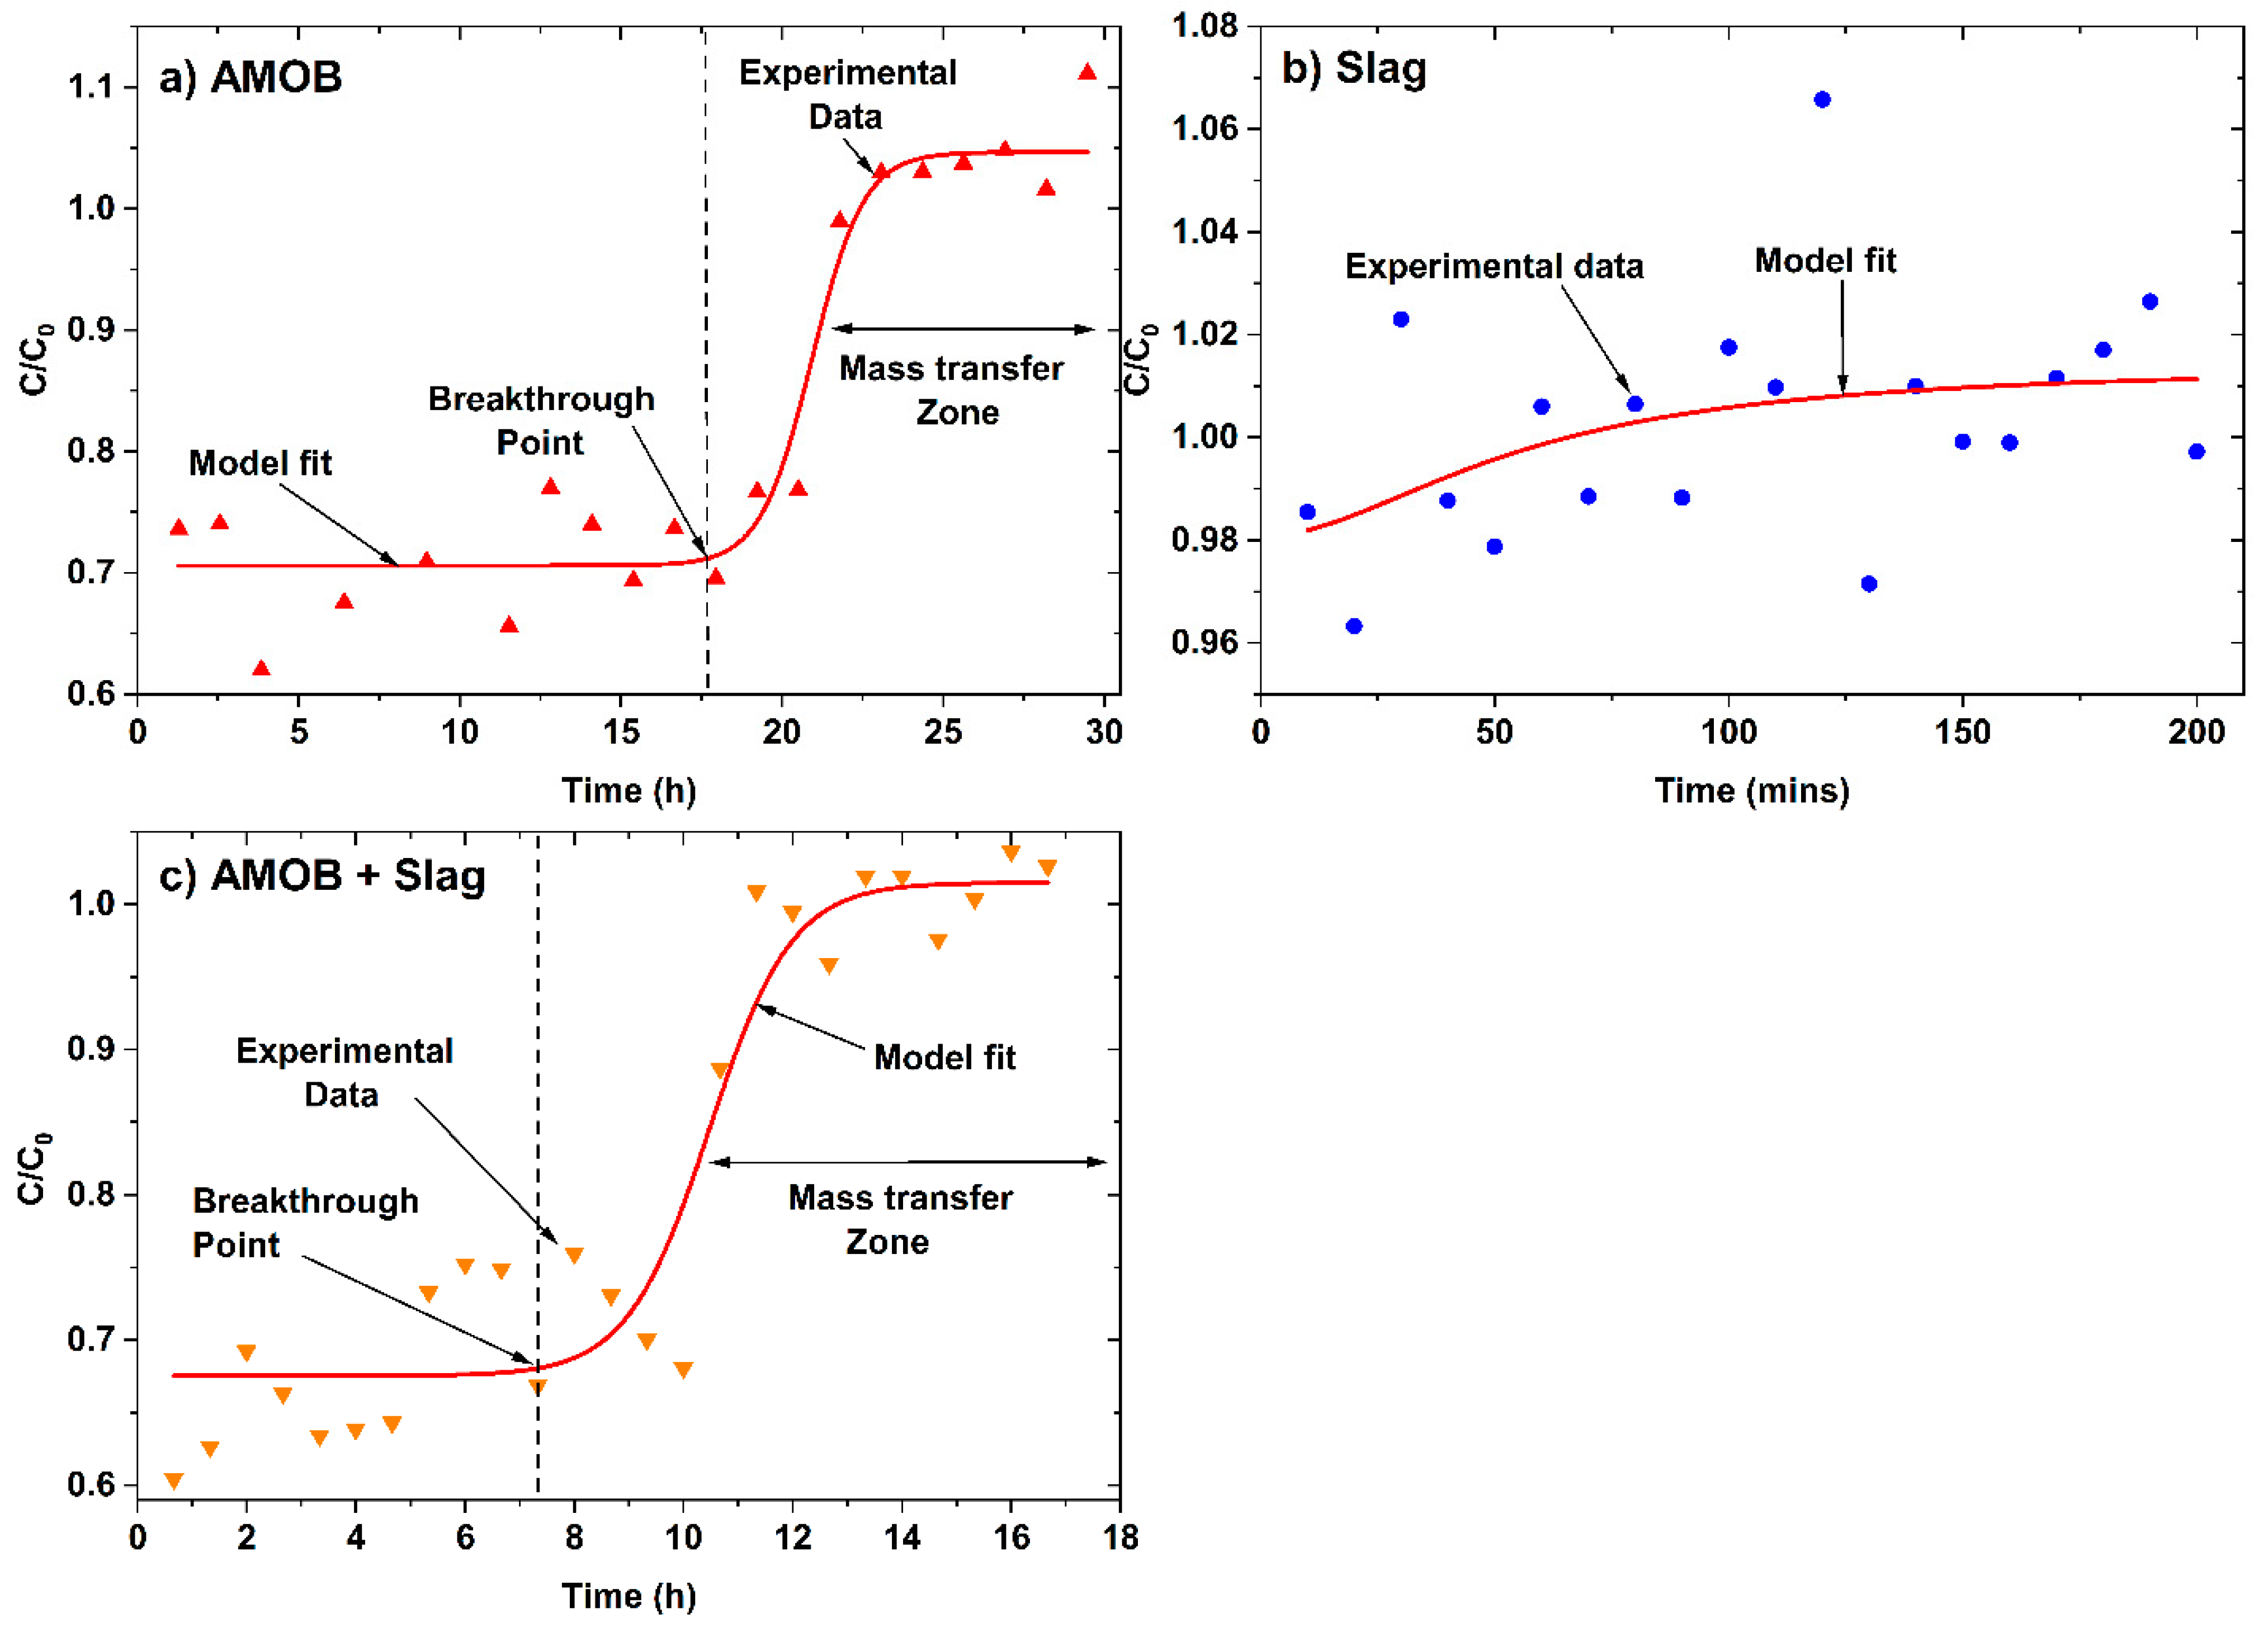
Batch adsorption isotherm data does not provide all essential information for scaled up fixed-bed flow systems. However, fixed-bed continuous flow tests can provide valuable data for obtaining design models to scale up for continuous water treatment [34]. Designing adsorption columns requires predicting how much effluent the bed can treat or how long the bed will last before regeneration is necessary. Packed-bed performance is described by its breakthrough curve (Figure 10) for a 200 mg/L phosphate solution (pH = 6.4 and 25 °C) passed through an AMOB, slag, or AMOB and slag (50% wt.) packed, glass wool-plugged fixed-bed columns (length = 3, 0.7 and 2.2 cm for AMOB, slag, and AMOB slag mixture respectively, and dia = 1.1 cm) packed with 1.0 g of adsorbent (~300 µm for AMOB and ~800 µm for slag). The column was packed using a warm mixture of ~1.0 g of adsorbents (or adsorbent mixtures) and removing any low-density particles that float due to trapped air. The mixture was slowly added to the column through a glass funnel. The packed column was tapped with a rubber horse to ensure an even packing and remove air bubbles.

Figure 10.
Continuous flow fixed-bed column breakthrough curve for phosphate adsorption.onto (a) AMOB, (b) slag, and (c) AMOB + Slag. Here, C is the effluent concentration at time t and C0 is the initial concentration (mg/L) of effluent.
Approximately 250 mL of phosphate water solution was passed through the column during each experiment. The flow rates were 0.13, 1.13, and 0.25 mL/min for AMOB, slag, and AMOB slag mixture, respectively. Lower flow rates for AMOB are possibly due to its tiny particle size and high porosity, creating more significant pressure drops in the column. In an ideal theoretical breakthrough curve (where breakthrough time is generally defined when ( ~ 0.01), but in these experiments, the initial C/C0 were ~0.70 and ~0.68 for AMOB and AMOB + slag, respectively. Hence, the breakthrough points ((C/C0)breakthrough), 0.71 (AMOB), and 0.69 (AMOB + slag) were used in the graphical determination of breakthrough capacity. The end of the breakthrough curve is when the concentration ratio () rises to 1.0, and the bed is judged to be ineffective. At this point, regeneration is required. The breakthrough curve’s mass transfer zone width and shape depend on the adsorption isotherm, flow rate, adsorbate mass-transfer rate, and diffusion in the pores. The ratio between usable time and total time (tu/tt) is the fraction of the total bed capacity or length utilized up to the breakthrough point. Hence, for a bed length of Ht, Hb is the length of bed used up to the break point. The ratio between the Hb/Ht is equal to the ratio of tu/tt (Equation (4)) [15,18].
Hb = (tu/tt) Ht
Times tu and tt were calculated by integrating the area above the breakthrough curve using Equations (5) and (6).
The usable and unusable bed lengths were 2.3 cm and 0.7 cm (Table 5) for the AMOB packed fixed bed column. The fraction of total capacity used prior to the breakthrough point was 0.88. The capacity at saturation was 8.38 mg/g (Table 5), which is ~22.5% of the Langmuir isotherm capacity for batch sorption at 25 °C. This discrimination of the fixed-bed column versus batch sorption capacity could possibly be due to mass transfer and kinetic diffusion limitations for the fixed-bed adsorption. The slag packed fixed-bed failed to show satisfactory performance under these experiment conditions and poorly fitted the break through the model. The flow rate for the slag system was approximately 10-fold that of (1.13 mg/L) AMOB fixed-bed (0.13 mg/L). Phosphate solution is retained only for a shorter time in the column. It may not have successfully equilibrated with the adsorbent. The AMOB and slag mixture packed fixed-bed showed improved performance (11.13 mg/g capacity, Table 5), consistent with the AMOB packed fixed bed. Slag with AMOB can improve the flow rates for fixed-bed sorption while still retaining satisfactory capacity. This preliminary study shows promise with a mixed AMOB/slag adsorption bed for large scale applications.
Table 5.
Fixed-bed column model predicted data for (a) AMOB, (b) slag, and (c) AMOB + slag.
5. Conclusions
AMOB was prepared by embedding aluminum and magnesium oxides in Douglas fir biochar, and slag was obtained from Levy Corp. These adsorbents were characterized using SEM, EDX, BET, PZC, and elemental analysis, and ash content. Biochar has a larger surface area and demonstrates faster adsorption as well as minimal leaching of metals. In contrast, slag has a low surface area but continues to leach metals that precipitate phosphate resulting in increased capacity. An advantage of biochar is that after collecting phosphate, the phosphate laden biochar has potential as a carbon and phosphate rich soil amendment. It would be more challenging to utilize all the phosphate from slag. It does not store all the phosphate on its surface. Over time, the majority of phosphate will be immobilized by precipitation. Because both materials are available at low costs, a practical approach may be to utilize both to remediate agricultural runoff.
BET was used to quantify the surface areas of the adsorbents. AMOB and slag are 4.05 and 364 m2/g, respectively. The high biochar surface area likely contributed to its faster than slag adsorption. The PZC for AMOB and slag are 5.6 and 10.0, respectively. This significant difference is accounted for by the vastly different composition of slag and biochar. Although both materials adsorb phosphate well, it is to be noted that desorption is slow. Over seven days, biochar does not desorb any measurable amount of phosphate, while slag only desorbs 5.7% of its loaded phosphate. In a fixed bed experiment, a bed comprised entirely of AMOB has a slow flow rate, while slag has a higher rate. A mixed bed comprised of AMOB and slag in tandem shows promise for large-scale processes and should be explored to remediate phosphate containing agricultural runoff. An optimized sorbent bed would include the ability for the spent sorbent material to be incorporated into soil systems where its adsorbed phosphate can be utilized.
Supplementary Materials
The following supporting information can be downloaded at: https://www.mdpi.com/article/10.3390/pr10081561/s1, Figure S1: EDX Spectra for Al/ Mg biochar before phosphate adsorption; Figure S2: EDX spectra of slag before phosphate adsorption Figure S3: Q vs. Ce for slag over extended initial phosphate concentrations Figure S4: Linearized log(qe − qt) vs. t, 1st order kinetic plots for AMOB and slag; Table S1: First order kinetic parameters for AMOB and slag.
Author Contributions
Conceptualization, T.M., A.B., T.S. and D.S.; methodology, G.B.C.II and C.N.; software, C.N.; formal analysis, G.B.C.II, C.N., C.G.H., A.O., J.C.J., K.W. and R.D.; investigation, T.M., A.B., T.S. and D.S.; resources, T.M., A.B. and T.S.; data curation, G.B.C.II; writing—original draft preparation, G.B.C.II and C.N.; writing—review and editing, G.B.C.II, C.N. and T.M.; visualization, G.B.C.II and C.N.; supervision, T.M., A.B., T.S. and D.S.; project administration, T.M., A.B., T.S. and D.S.; funding acquisition, T.M. All authors have read and agreed to the published version of the manuscript.
Funding
This work is funded by NSF REU grant (1659830) awarded to T. Mlsna.
Institutional Review Board Statement
Not applicable
Informed Consent Statement
Not applicable
Data Availability Statement
Not applicable
Conflicts of Interest
The authors declare no conflict of interest.
References
- Barrow, N. Modelling the effects of pH on phosphate sorption by soils. J. Soil Sci. 1984, 35, 283–297. [Google Scholar] [CrossRef]
- Van Kauwenbergh, S.J. World Phosphate Rock Reserves and Resources; IFDC Muscle Shoals: Muscle Shoals, AL, USA, 2010. [Google Scholar]
- Mandal, U.K.; Maji, B.; Mullick, S.; Nayak, D.B.; Mahanta, K.; Raut, S. Global climate change and human interferences as risk factors, and their impacts on geomorphological features as well as on farming practices in Sundarbans eco-region. In The Sundarbans: A Disaster-Prone Eco-Region; Springer: Berlin/Heidelberg, Germany, 2019; pp. 405–437. [Google Scholar]
- Oguz, E. Removal of phosphate from aqueous solution with blast furnace slag. J. Hazard. Mater. 2004, 114, 131–137. [Google Scholar] [CrossRef] [PubMed]
- Gruhn, P.; Goletti, F.; Yudelman, M. Integrated Nutrient Management, Soil Fertility, and Sustainable Agriculture: Current Issues and Future Challenges; International Food Policy Research Institute: Washington, DC, USA, 2000. [Google Scholar]
- Pitt, R. Stormwater Effects Handbook: A Toolbox for Watershed Managers, Scientists, and Engineers; CRC Press: Boca Raton, FL, USA, 2001. [Google Scholar]
- Jury, W.A.; Vaux, H.J., Jr. The emerging global water crisis: Managing scarcity and conflict between water users. Adv. Agron. 2007, 95, 1–76. [Google Scholar]
- Yao, Y.; Gao, B.; Inyang, M.; Zimmerman, A.R.; Cao, X.; Pullammanappallil, P.; Yang, L. Removal of phosphate from aqueous solution by biochar derived from anaerobically digested sugar beet tailings. J. Hazard. Mater. 2011, 190, 501–507. [Google Scholar] [CrossRef]
- Brusseau, M.; Walker, D.; Fitzsimmons, K. Physical-Chemical Characteristics of Water. In Environmental and Pollution Science; Elsevier: Amsterdam, The Netherlands, 2019; pp. 23–45. [Google Scholar]
- Yamada, H.; Kayama, M.; Saito, K.; Hara, M. A fundamental research on phosphate removal by using slag. Water Res. 1986, 20, 547–557. [Google Scholar] [CrossRef]
- Wang, G.C. The Utilization of Slag in Civil Infrastructure Construction; Woodhead Publishing: Cambridge, UK, 2016. [Google Scholar]
- Mohan, D.; Sarswat, A.; Ok, Y.S.; Pittman, C.U., Jr. Organic and inorganic contaminants removal from water with biochar, a renewable, low cost and sustainable adsorbent–a critical review. Bioresour. Technol. 2014, 160, 191–202. [Google Scholar] [CrossRef]
- Ahmad, M.; Rajapaksha, A.U.; Lim, J.E.; Zhang, M.; Bolan, N.; Mohan, D.; Vithanage, M.; Lee, S.S.; Ok, Y.S. Biochar as a sorbent for contaminant management in soil and water: A review. Chemosphere 2014, 99, 19–33. [Google Scholar] [CrossRef]
- Rahman, S.; Navarathna, C.M.; Das, N.K.; Alchouron, J.; Reneau, P.; Stokes, S.; Thirumalai, R.V.; Perez, F.; Hassan, E.B.; Mohan, D. High capacity aqueous phosphate reclamation using Fe/Mg-layered double hydroxide (LDH) dispersed on biochar. J. Colloid Interface Sci. 2021, 597, 182–195. [Google Scholar] [CrossRef]
- Karunanayake, A.G.; Navarathna, C.M.; Gunatilake, S.R.; Crowley, M.; Anderson, R.; Mohan, D.; Perez, F.; Pittman, C.U., Jr.; Mlsna, T. Fe3O4 nanoparticles dispersed on Douglas fir biochar for phosphate sorption. ACS Appl. Nano Mater. 2019, 2, 3467–3479. [Google Scholar] [CrossRef]
- Eloneva, S.; Teir, S.; Salminen, J.; Fogelholm, C.-J.; Zevenhoven, R. Steel converter slag as a raw material for precipitation of pure calcium carbonate. Ind. Eng. Chem. Res. 2008, 47, 7104–7111. [Google Scholar] [CrossRef]
- Navarathna, C.M.; Bombuwala Dewage, N.; Keeton, C.; Pennisson, J.; Henderson, R.; Lashley, B.; Zhang, X.; Hassan, E.B.; Perez, F.; Mohan, D.; et al. Biochar adsorbents with enhanced hydrophobicity for oil spill removal. ACS Appl. Mater. Interfaces 2020, 12, 9248–9260. [Google Scholar] [CrossRef] [PubMed]
- Navarathna, C.M.; Karunanayake, A.G.; Gunatilake, S.R.; Pittman, C.U., Jr.; Perez, F.; Mohan, D.; Mlsna, T. Removal of Arsenic (III) from water using magnetite precipitated onto Douglas fir biochar. J. Environ. Manag. 2019, 250, 109429. [Google Scholar] [CrossRef] [PubMed]
- Goh, K.-H.; Lim, T.-T.; Dong, Z. Application of layered double hydroxides for removal of oxyanions: A review. Water Res. 2008, 42, 1343–1368. [Google Scholar] [CrossRef] [PubMed]
- Link, D.D.; Walter, P.J.; Kingston, H. Development and validation of the new EPA microwave-assisted leach method 3051A. Environ. Sci. Technol. 1998, 32, 3628–3632. [Google Scholar] [CrossRef]
- Beshah, D.A.; Tiruye, G.A.; Mekonnen, Y.S. Characterization and recycling of textile sludge for energy-efficient brick production in Ethiopia. Environ. Sci. Pollut. Res. 2021, 28, 16272–16281. [Google Scholar] [CrossRef] [PubMed]
- Moldoveanu, S.C. Pyrolysis of Organic Molecules: Applications to Health and Environmental Issues; Elsevier: Amsterdam, The Netherlands, 2009. [Google Scholar]
- De Brito, J.; Saikia, N. Recycled Aggregate in concrete: Use of Industrial, Construction and Demolition Waste; Springer Science & Business Media: Berlin/Heidelberg, Germany, 2012. [Google Scholar]
- Wang, Y.; Cao, Y.; Ma, Y.; Xiao, S.; Hu, J.; Wang, H. Fresh and hardened properties of alkali-activated fly ash/slag binders: Effect of fly ash source, surface area, and additives. J. Sustain. Cem. Based Mater. 2021, 11, 1–24. [Google Scholar] [CrossRef]
- Menéndez, J.; Illán-Gómez, M.; y Leon, C.L.; Radovic, L. On the difference between the isoelectric point and the point of zero charge of carbons. Carbon 1995, 33, 1655–1657. [Google Scholar] [CrossRef]
- Martínez-Calvo, M.; Kotova, O.; Möbius, M.E.; Bell, A.P.; McCabe, T.; Boland, J.J.; Gunnlaugsson, T. Healable luminescent self-assembly supramolecular metallogels possessing lanthanide (Eu/Tb) dependent rheological and morphological properties. J. Am. Chem. Soc. 2015, 137, 1983–1992. [Google Scholar] [CrossRef]
- Ho, Y.-S. Review of second-order models for adsorption systems. J. Hazard. Mater. 2006, 136, 681–689. [Google Scholar] [CrossRef]
- Yao, Y.; Gao, B.; Chen, J.; Yang, L. Engineered biochar reclaiming phosphate from aqueous solutions: Mechanisms and potential application as a slow-release fertilizer. Environ. Sci. Technol. 2013, 47, 8700–8708. [Google Scholar] [CrossRef]
- Kröger, R.; Moore, M.T. Phosphorus dynamics within agricultural drainage ditches in the lower Mississippi Alluvial Valley. Ecol. Eng. 2011, 37, 1905–1909. [Google Scholar] [CrossRef]
- Bouldin, J.; Farris, J.; Moore, M.; Cooper, C. Vegetative and structural characteristics of agricultural drainages in the Mississippi Delta landscapes. Environ. Pollut. 2004, 132, 403–411. [Google Scholar] [CrossRef] [PubMed]
- Maul, J.D.; Cooper, C.M. Water quality of seasonally flooded agricultural fields in Mississippi, USA. Agric. Ecosyst. Environ. 2000, 81, 171–178. [Google Scholar] [CrossRef]
- Mukherjee, A.; Zimmerman, A.R. Organic carbon and nutrient release from a range of laboratory-produced biochars and biochar–soil mixtures. Geoderma 2013, 193, 122–130. [Google Scholar] [CrossRef]
- Crisler, G.B., II; Navarathna, C.; Hernandez, C.G.; Orr, A.; Davis, R.; Mlsna, D.; Varco, J.; Schauwecker, T.; Brown, A.; Mlsna, T. Municipal and Agricultural Wastewater Remediation Using Modified Biochars; Mississippi State University: Starkville, MS, USA, 2019; Volume 1001, p. 43. [Google Scholar]
- Mohan, D.; Chaubey, A.K.; Patel, M.; Navarathna, C.; Mlsna, T.E.; Pittman, C.U., Jr. Biochar adsorption system designs. In Sustainable Biochar for Water and Wastewater Treatment; Elsevier: Amsterdam, The Netherlands, 2022; pp. 153–203. [Google Scholar]


Publisher’s Note: MDPI stays neutral with regard to jurisdictional claims in published maps and institutional affiliations. |
© 2022 by the authors. Licensee MDPI, Basel, Switzerland. This article is an open access article distributed under the terms and conditions of the Creative Commons Attribution (CC BY) license (https://creativecommons.org/licenses/by/4.0/).