Article

Influence of Step Casings on the Cavitation Characteristics of Inducers

1
State Key Laboratory of Hydro Science and Engineering, Department of Energy and Power Engineering, Tsinghua University, Beijing 100084, China
2
Xi’an Aerospace Propulsion Institute, Xi’an 710100, China
*
Authors to whom correspondence should be addressed.
These authors contributed equally to this work.
Processes 2022, 10(8), 1598; https://doi.org/10.3390/pr10081598
Submission received: 20 July 2022 / Revised: 9 August 2022 / Accepted: 10 August 2022 / Published: 12 August 2022

Abstract

:
Rotating cavitation (RC) in inducers mainly degrades performance with unstable radial force. In this paper, the influence of step casings on cavitation performance and the instabilities of inducers were numerically investigated. Firstly, a numerical scheme was validated by means of a comparison with experimental measurements taken for an original inducer (Model O). We then performed simulations with five different step casing models (Models A–E), in which the starting locations and enlargement sizes of the step casings were altered. The interaction between tip leakage flow and main flow in the inter-blade passages was found to highly affected by cavity structure and blade loading. Considering both cavitation performance and radial force, our results suggest that Model E is an alternative improvement. In short, this study provides a standard workflow for the effective suppression of rotating cavitation in inducers by the simple adoption of the step casing configuration presented here in engineering practice.

1. Introduction

In liquid rocket engines, turbopumps are used to transport fuels/oxidizers to the combustion chambers. During transport, the required high pressure of the liquids is mostly provided by a high-performance centrifugal pump, i.e., the main pump of a turbopump. Furthermore, in order to suppress the onset and development of cavitation, an inducer in the form of an axial pump is usually installed upstream of the main pump in order to acquire a higher-pressure inlet condition for the latter. Thus, the occurrence of cavitation in the inducer is expected by its function. Unfortunately, the strong instabilities induced by cavitation in the inducer within a compact casing space (small tip clearance) may still bring about critical propulsion failure. This severe problem has attracted a great deal of interest in recent decades [1,2,3]. Among the complex cavitation instabilities, rotating cavitation (RC) is considered to make a primary contribution to the disastrous damage to inducers, leading to performance drop, severe vibrations and noise [4,5,6]. One prominent characteristic of RC is the strong interaction between the tip leakage flow and the main flow in the inter-blade flow passages, leading to imbalance in the radial force exerted on the inducer [7,8].
In order to suppress cavitation instabilities, especially those induced by RC, in the inducers, a number of studies have been conducted on geometrical improvements to blades and casings. Due to its practical convenience in terms of design and manufacture, the strategy of casing optimization has been widely adopted. It is known that a compact casing space (small tip clearance) ensures a better hydraulic performance, with lower tip leakage for the inducers. However, recent works have revealed that a relatively enlarged tip clearance could be beneficial for RC suppression in the inducers. For example, Fujii et al. [9] have effectively reduced the RC occurrence range and the accompanying pressure fluctuations by using J-shaped grooves on a three-bladed inducer. Shimiya et al. [10] and Choi et al. [11] have confirmed that J-shaped grooves on the inducer casing also largely suppressed the onset and evolution of RC. Kang et al. [12] have adopted a strategy of circumferential grooves to suppress RC. Li et al. [13] and Timushev et al. [14] have carried out studies on inducers with helical grooves and an axial vortex stage (AVS), respectively, for RC suppression by reducing the cavitation capacity. Instead of focusing on grooves, Kamijo et al. [15] have studied five casings for a liquid oxygen turbopump inducer and proposed a novel structural criterion of step casing for RC suppression. Fujii et al. [16] have experimentally investigated eight step casing geometries to reveal the mechanism of the suppression of RC. It was shown that the size and location of step casing enlargement significantly affected RC instabilities. With the support of particle imaging velocimetry (PIV) and high-speed photography, Shimagaki et al. [17,18] have made the further observation that the tip loading and cavitation areas can be reduced at larger tip clearances. In the previous work of the authors, Yu et al. [19] numerically investigated equal pitch and varying pitch inducers within straight casings and step casings, respectively. The results showed significant reductions in cavity size and fluctuation with the step casing configuration due to the suppression of RC instability. In short, these studies suggest that step casings can be considered as primary alternatives for RC suppression which have the advantages of effectiveness and simplicity.
In this study, the influence of step casings on the cavitation performance and instabilities of an inducer are assessed numerically. Cavity structure, blade loading, radial force, complicated unsteady flow behaviors and fluctuations are analyzed for an original inducer model (Model O) and five step casing models (Models A–E). Finally, our detailed analysis of the interaction between tip leakage flow and main flow in the inter-blade passages reveals the RC suppression mechanism of step casings.

2. Materials and Methodology

In this section, the experimental test rig, the step casing strategy and the numerical approaches used in this study are described in detail. Firstly, we introduce the experimental set-up and the procedure for the inducer cavitation performance tests. Secondly, we illustrate the geometric characteristics of the test inducer. Thirdly, we design step casings (Models A–E) based on the original straight casing (Model O) for the inducer. Finally, we describe the details of the mesh topology, the numerical schemes and the boundary conditions.

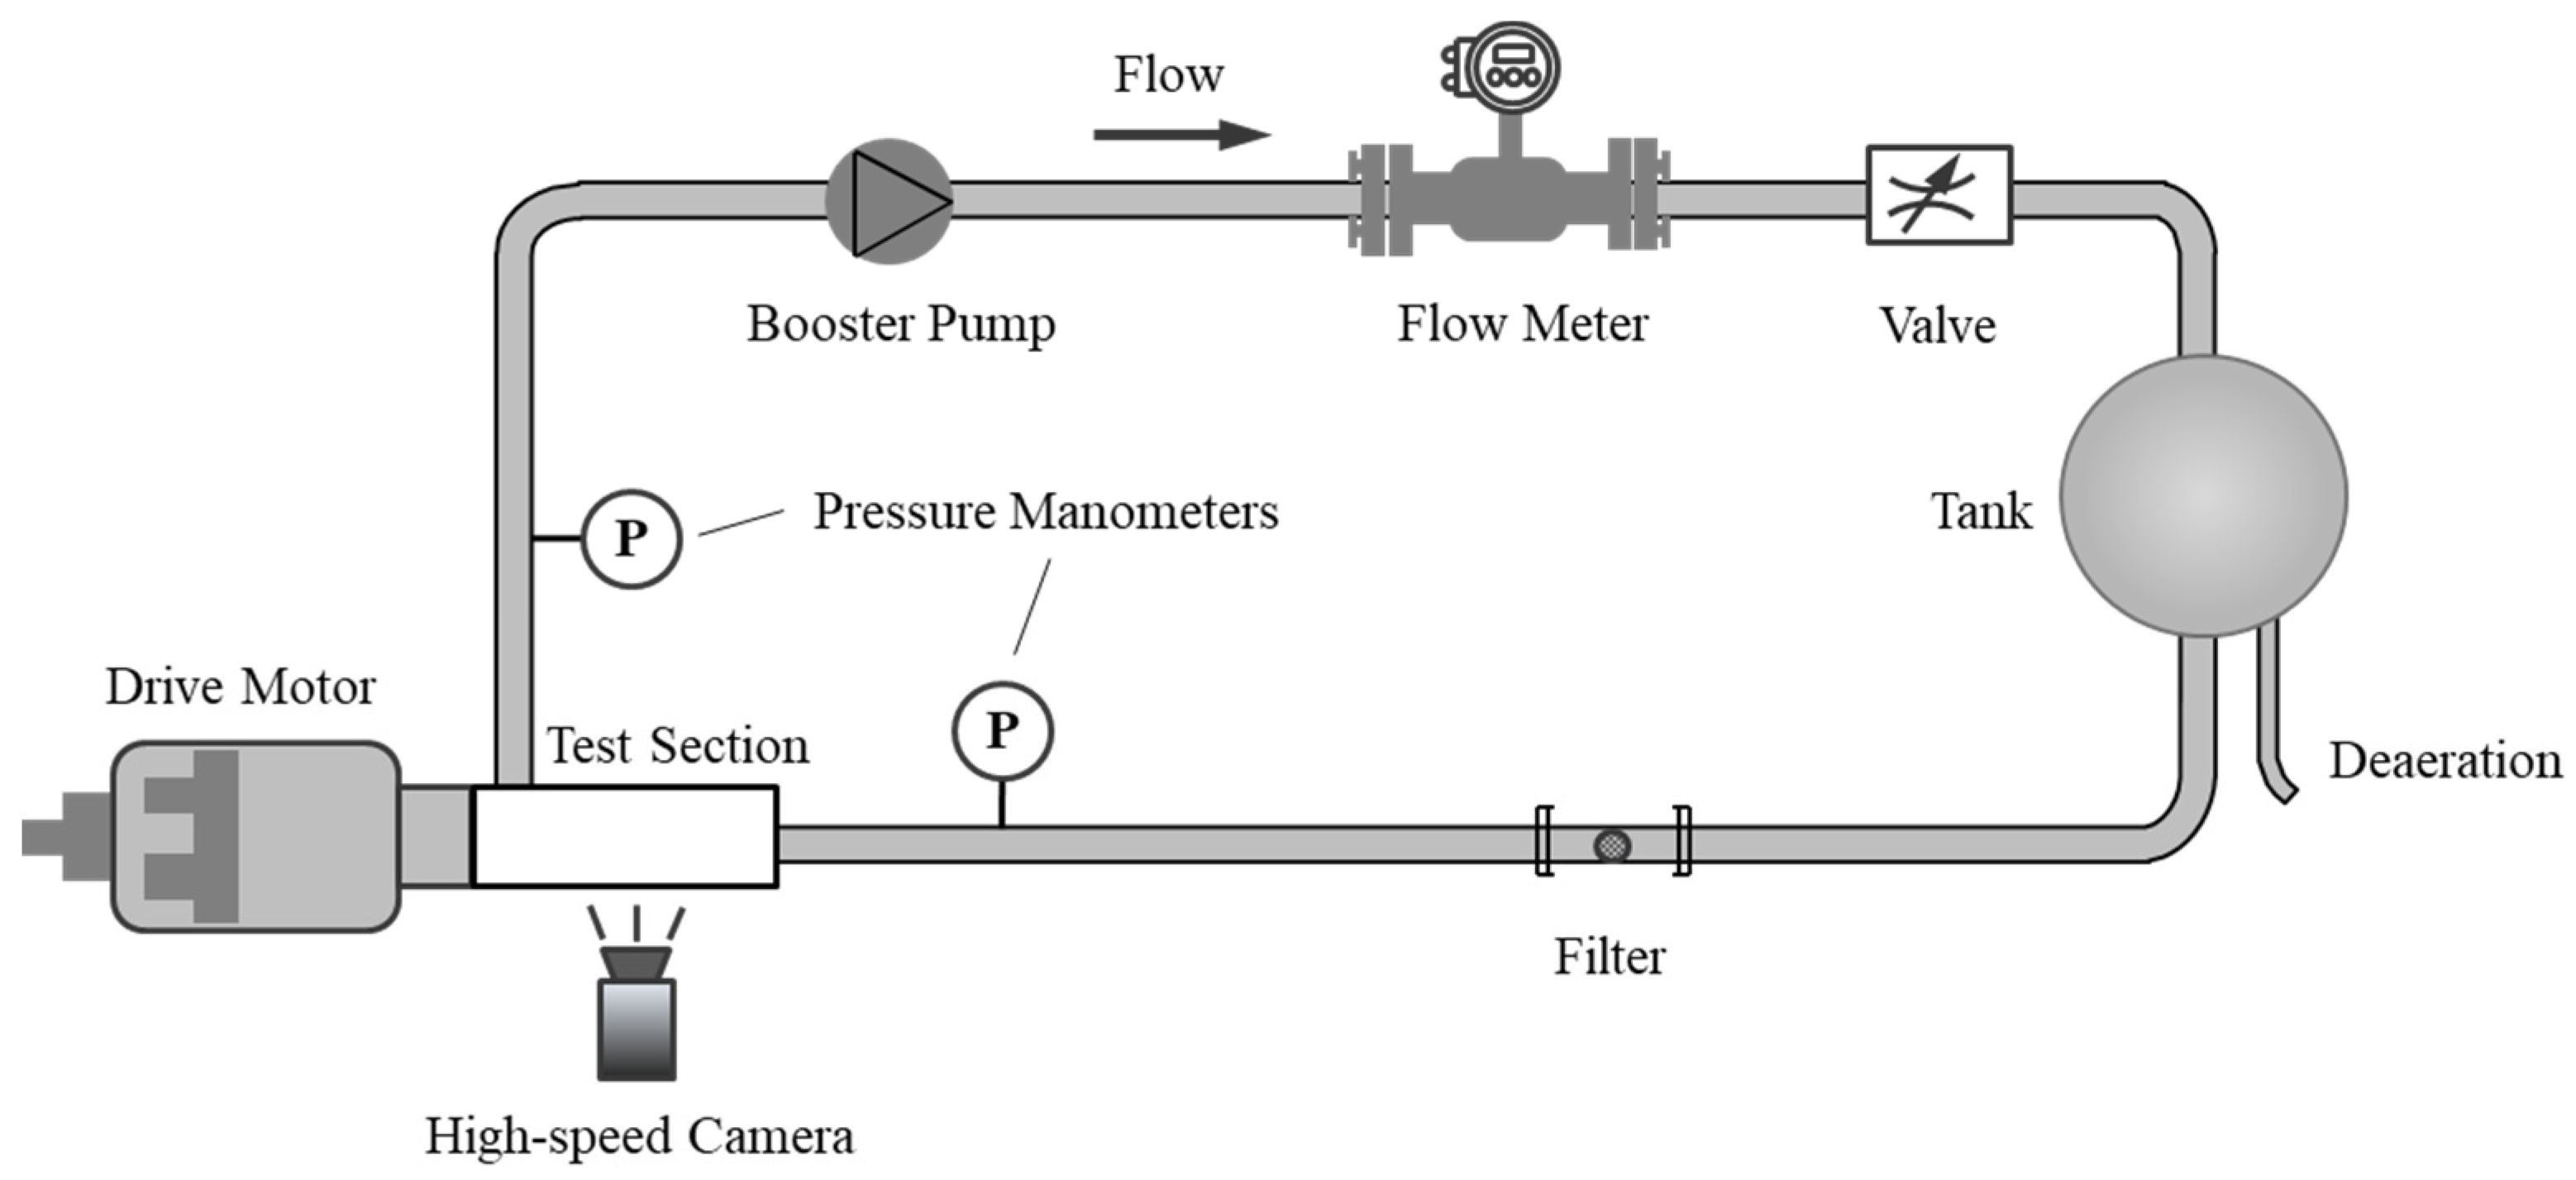
2.1. Experimental Set-Up

The experimental set-up in the Xi’an Aerospace Propulsion Institute is schematically demonstrated in Figure 1. The test rig is a closed-loop system with a drive motor, a booster pump, a water tank, a test section and conveying pipelines. The flow rate can be controlled by a booster pump and a large water tank (storage up to 1000 L) to prevent severe shock conditions. A flow control valve and a filter are installed at the test section upstream to minimize the cavitation nuclei. The pressure inside the loop is managed by a gas bladder installed inside the water tank with pressurization/depressurization functions.
The inducer involved in our study was tested under 5000 r/min by a motor controller (0–12,000 r/min) with an error less than 5 rpm, while the flow rate was controlled by a booster pump (0–40 L/s, uncertainty 1%) and monitored by an electromagnetic flow meter (0–150 L/s, uncertainty 0.5%) downstream of the test section. The quasi-steady pressure was measured with two steady transducers (0–1.6 MPa, uncertainty 0.75%) mounted 7D0 (D0 is the blade tip diameter) upstream and 5D0 downstream of the inducer inlet, respectively. The instantaneous pressure fluctuations inside the test section (310 mm long) were registered by six transient pressure transducers (0–690 kPa, uncertainty 0.75%). The water was degassed to DO (dissolved oxygen content) ~3 ppm by a vacuum pump. Additionally, the test section housing is made of acrylic with high transparency. Cavitation flows around the inducer blades were recorded through the test window by a high-speed camera at 5000 fps with a resolution of 1024 × 800 pixels. The test section, including an inducer and transient pressure transducers, can be referred to Figure 2 in reference [3].

2.2. Geometry of the Test Inducer (Model O)

As shown in Figure 2, the inducer tested in this study is an even-pitch inducer with 3 blades, and the geometrical parameters are listed in Table 1. The original casing of the inducer used in the test was configured with a uniform clearance (non-step/straight casing, Model O) of 0.5 mm from the blade tip to the casing wall.

2.3. Original Casing and Step Casing Strategy

As stated in the introduction, step casing strategies have been widely adopted to improve inducer cavitation performance and RC instabilities. On the basis of experimentally testing eight proposed casing configurations presented in Fujii et al.’s work [16], it is suggested that: (i) by increasing tip clearance, the onset of rotating cavitation can be shifted to a lower cavitation number; and (ii) the occurrence of cavitation instabilities is significantly affected by the size and location of casing enlargements.
In our study, we focus on the influence of the starting location and enlargement size of the step casing on RC instabilities for our tested inducer. As shown in Figure 3, five step casings (Models A–E) with different starting locations (Models A–C) and enlargement sizes (Models A, D and E) were designed based on the original straight casing design (Model O, τ = 0.5 mm). The step of Model A starts at the chamfer circle ending point of the first blade, with a step angle of 30° and a horizontal length of 5 mm. For Models B and C, the step starting location was horizontally shifted by 12.1 mm upstream and 12.4 mm downstream relative to Model A, respectively. Both Models D and E have the same step starting location as Model A, but with different enlargement sizes (step angles).

2.4. Numerical Methodology

The total computational domain of the test inducer with the original straight casing is shown in Figure 4. To avoid inlet and outlet effects in the simulations, the pipe lengths upstream and downstream of the inducer were extended to 8 and 10 times that of the inducer blade tip diameter, D0 (100 mm), respectively.
The computational grids were generated using a commercial mesh generator, Pointwise (Version 17.2R2, Fort Worth, TX, USA). The total computational domain was divided into 2 stationary subdomains and 2 rotating subdomains. The stationary subdomains were nominally called the inlet subdomain and the outlet subdomain. Rotating subdomains are defined as the combination of a cylinder subdomain of the same inducer tip diameter and a ring-shaped subdomain from the blade tip to the casing wall. This mesh strategy was convenient for modifying the step casing configuration for each casing model. By this means, mesh consistency and ease of configuration was achieved. Hybrid unstructured cells were implemented for rotating subdomains with a local refinement near the blade surfaces and the rigid walls. For the stationary subdomains of the inlet and outlet pipes, hexahedral grids were simply adopted. More than 20 layers of prism meshes with an initial height of 0.001 mm and a growth ratio of 1.15 from the first layer were utilized. At the tip clearance and the blade surfaces, more than 20 layers were established to capture the accurate flow characteristics and spatial–temporal instabilities. This guarantees that y+ is less than 10 for all computations in this study, which satisfies the critical requirement of the k-ω SST (shear stress transfer) for an accurate representation of the flow field. The structured meshes for the stationary domains of the inlet and outlet sections were adapted with a good resolution for transition to the unstructured parts.
As shown in Figure 5, a mesh sensitivity test was conducted with a pressure head with 7 mesh resolutions from coarse grid cells (~2 million) to fine mesh cells (~13 million). The independence is such that the calculated head of the inducer for a certain mesh resolution and all following higher mesh resolutions is almost constant (less than a 3% difference). Based on the proposed criterion, finally, around 6.5 million grid cells (solid dot in Figure 5) were adopted (at intermediate mesh resolution) for all casing models.
Statistically, we generated 0.70 million, 0.76 million, 0.63 million and 50.2 million mesh grids for the inlet, outlet, ring-shaped and cylinder subdomains of our final adopted mesh resolution for Model O. The detailed mesh topology of two rotating subdomains for Model O is illustrated in Figure 6. For the other step casings, the same mesh strategy and mesh resolution were adopted for all the computations.
The Reynolds averaged Navier–Stokes equations (RANS) were numerically solved using ANSYS CFX (Version 2021R2, Pittsburgh, PA, USA). The k-ω SST turbulence modeling [20] and Zwart–Gerber–Belamri (ZGB) cavitation modeling with the VOF method (Volume of Fraction) [21] were adopted throughout our study by considering the computational accuracy and load. Based on the measurement data for the test rig, mass flow rate and pressure boundary conditions were imposed for the inlet and outlet. In this study, the rotational speed was set the same as in the experiments (5000 r/min) for all computations. The working fluid was defined as water with a density of 1000 kg/m3 and a dynamic viscosity of 0.89 × 10⁻³ Pa·s. All the solid walls are defined as rigid and of the no-slip type.
The numerical investigations were performed in the following order. Firstly, the steady simulations were computed for Model O to estimate the cavitation performance against the experimental results. Sequentially, an unsteady simulation of the design working condition was performed to validate the cavitation flow field and RC instabilities in comparison with the experimental observations. Then, both steady and unsteady simulations were computed for step casings (Models A–E) to estimate the performance curves as well as the RC instabilities. The residuals of continuity and momentum equations were set as 1 × 10⁻⁶ for both steady and unsteady calculations. The maximum iteration number was 5000 for steady computations, while the time interval was set as 6.7 × 10⁻⁵ s (180 steps in one revolution), with 20 iterations per step for unsteady computations.

3. Results and Discussion

3.1. Numerical Validation

Numerical validation was conducted on Model O for cavitation performance (steady simulation) and instantaneous cavity structures (unsteady simulation) in a comparison with the experimental results. The cavitation performance curve was plotted in terms of the head coefficient, Ψ, against the cavitation number, σ. Here, Ψ and σ are defined as follows:
Ψ = p out p in 0.5 ρ V tip 2
σ = p in p v 0.5 ρ V tip 2
where pin, pout and pv denote the inlet pressure, outlet pressure and saturation pressure, respectively, with ρ representing the water density and Vtip the blade tip velocity.
By the comparison in Figure 7, a good agreement was observed between the numerical simulations and the experimental results at different cavitation numbers in terms of both the total trend and the cavitation breakdown points. Both curves show that the head coefficient approaches a constant when the cavitation numbers are high, but dramatically reduces when the cavitation number approaches a critical value, i.e., the breakdown cavitation number σb = 0.027 in this study.
The cavity structures on the inducer blade surfaces as determined by computation from Model O were captured in six instantaneous snapshots in one revolution and were compared with the experimental results (Figure 8). The numerical results were plotted with the isosurfaces of the vapor volume fraction up to 0.7, which closely matched the experimental results for the same instants. Regarding the straight casing (Model O), the cavity structures on each blade are similar to each other, rotating synchronously as the blade rotates. The cavitation at the designed point for this inducer behaves as the synchronous rotation cavitation. Our numerical schemes were promising, presenting the inducer cavitation characteristics with the above validations.

3.2. Effects of Step Casing Models

3.2.1. Cavitation Performance

After the numerical validation, the cavitation performance curves computed for all casing models, including Model O and the step casings (Models A–E), were plotted (Figure 9). It can be observed that all the step casing models showed the same performance trends as the original straight casing (Model O). As marked by two dashed vertical lines, the head coefficient approaches a constant when the cavitation numbers are high, but the head reduction begins at σr = 0.12 and the cavitation is completely established after the breakdown cavitation number of σb = 0.027 for all casings.
Models D and E had a similar performance to Model O due to the small step casing enlargement. Head coefficients dropped slightly for Model B compared with Model O, while head coefficients were much reduced for Models A and C. All the above observations show that cavitation performance is sensitive to both the starting location and the enlargement size of the step casing. Models A, B and C show that the step starting point should be located properly with respect to the inducer, and the comparison suggests that a better performance is achieved when the step is located upstream of the inducer inlet. Models A, D and E are related to the effect of enlargement size of the step casing. The results showed a trend of the head coefficient increasing as the enlargement size increased. Models D and E did not show much difference in terms of cavitation performance, which implies that the enlargement size should be suitable for leaked backflow suppression of the lower pressure area (indicating cavitation onset). Otherwise, much greater leakage leads to an adverse effect on the fuel supply by the inducer.
Additionally, we compared the head coefficients for all casing models at two typical cavitation numbers, i.e., one at a common high cavitation number (σ1 = 0.5) and the other at a lower number (σ2 = 0.074) close to the breakdown cavitation number σb. As listed in Table 2, at σ1 = 0.5, head coefficients were almost the same for Models O, B, D and E. Compared with Model O, the head dropped about 5.1% and 11.4% for Model A and Model C, respectively. On the contrary, at σ2 = 0.074, Model A and Model C showed smaller performance drops, with reductions of about 3.8% and 7.1%, respectively, compared with Model O.

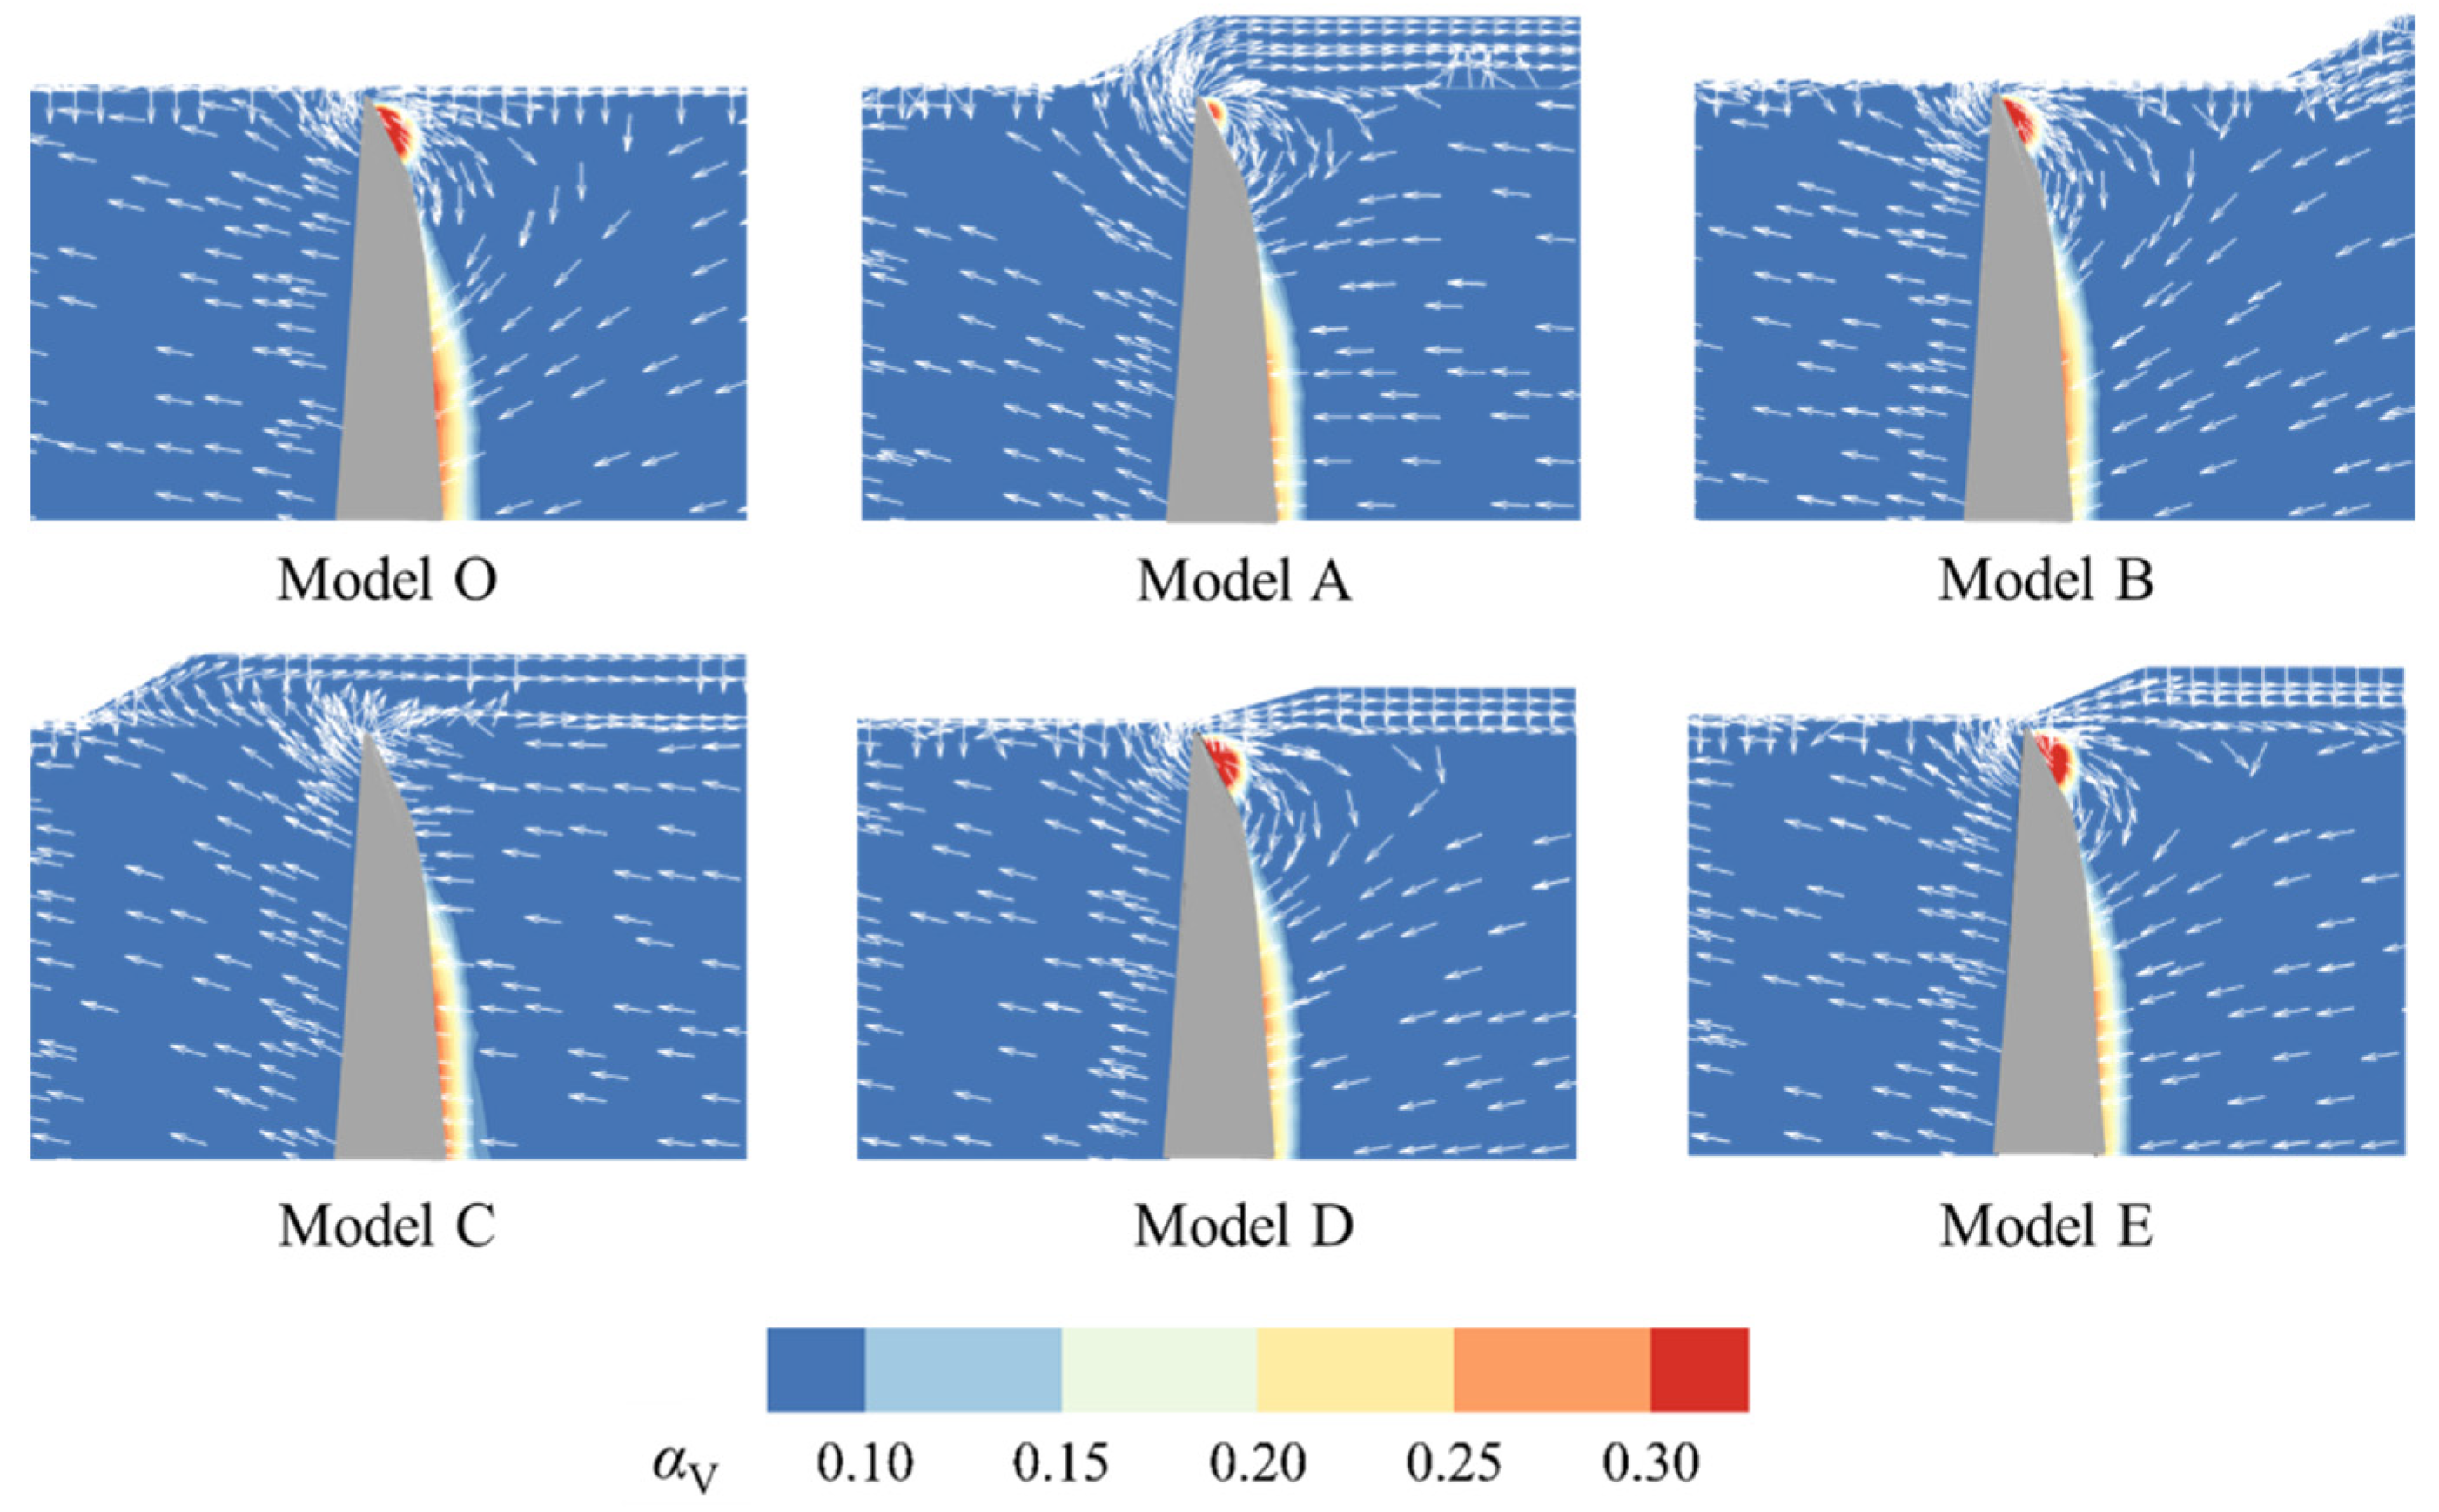
3.2.2. Cavity Structures

The temporary oscillation of the cavities on three blades was monitored for four revolutions in terms of the normalized cavity area, S’cav = Scav/Save, Save being the time-averaged cavitation area for Model O in Figure 10. Generally speaking, the asymmetry of the cavity areas on the three blades was relatively slight, given their similar sizes and synchronous phases. The fluctuation over time for each blade was much smaller than the time-averaged area Save, showing a relatively fixed cavity structure on the blade surfaces. The sinusoidal phase of the curves shows a peak frequency of 83.3 Hz, which is the same as the inducer rotating frequency, f0. The test axial inducer shows the synchronous rotation cavitation, which is the same as that which can be observed in the snapshots in Figure 8.
For Models A–E, the results showed synchronous rotation cavitation, only with different magnitudes for each model. The slight asymmetry in cavity patterns implies that the radial force exerted on each blade offset the components in each direction, resulting in a relatively small resultant force.
Therefore, one typical snapshot of the cavity structure with a vapor volume fraction of 0.3 was plotted for each case (Figure 11). The step casings of Models B, D and E showed similar cavity patterns and sizes as compared with Model O. However, the other two step casings, especially that of Model C, showed considerably shrunken cavity volumes compared with Model O. The cavity structure and head are fully related to the pressure distribution on the blade surfaces. Model C has the smallest cavity area and the lowest head coefficients among all the step casings, which implies that the pressure distributions at the suction side (SS) and at the pressure side (PS) are relatively higher and lower than those of the other casings, respectively.
To better exhibit the effect of step casings on cavity structure, the velocity streamline and axial section pressure distributions for the same time point as Figure 11 are illustrated in Figure 12. The tip leakages (backflow from pressure side to suction side) and velocity magnitudes can be clearly observed from the streamlines. The strongest tip leakage vortex closely matched the cavity length on each blade, which can be explained by the high pressure difference between the pressure side (PS) and the suction side (SS), this being tighter with the lowest pressure distribution in the SS. Some backflows without the cavity could also be observed downstream in the streamwise direction for the same blade, since the real pressure level was higher than the vapor saturation pressure, even when the pressure difference was high. For Models A and C, the pressure at the PS to the leading edge was much lower than for the other cases, while the pressure at the SS was similar. By further estimation, the cavity size (length in both the spanwise and streamwise directions) was fully determined by the low-pressure area at the SS.
The contour of the vapor volume fraction and the velocity vectors in the axial section for each case are shown in Figure 13. Flows in the vicinity of a tip clearance reflect the interaction between the tip leakage and the main flow in the inter-blade passages, and the interaction between the tip vortex and blade surface cavitation. The tip clearance of the straight casing (Model O) tended to leak the partial flow which interacts with the main flow in the inter-blade passages, leading to a more apparent axial extension of cavities. A similar phenomena could be observed for the step casing Models D and E. As for Model C, the lager tip clearance allowed more flow to be leaked out, but at a lower velocity, interacting with the main flow only in a small region close to the blade tip. Models A and B showed intermediate interactions between tip leakage and main flow in the inter-blade passages.

3.2.3. Blade Loading

To further estimate the effect of step casings on inducer cavitation performance and instability with regard to the interaction between working flow and the rotating inducer blade, blade loading is presented as pressure coefficients Cp = (p − pinlet)/0.5ρV2inlet throughout our study.
As shown in Figure 14, the pressure coefficient contours for a certain blade showed a similar pattern on the pressure side (PS) for all casings, except for Model C; the Cp increased as the spanwise height increased from the blade root to the tip, while, generally, Cp was at a higher level from the leading edge (LE) to the 5 o’clock position, clockwise, and then decreased to the trailing edge (TE). A more complicated pressure distribution could be observed on the suction side (SS). From the LE to the 11 o’clock position, clockwise, the Cp decreased as the spanwise height increased from the blade root to the tip, and the reverse distribution was observed from the from 11 o’clock position to the TE, clockwise. Model C showed more different pressure distributions on both the PS and the SS compared with the other casing models; the visible differences are marked as two dashed circles in Figure 14.
The net pressure difference between the pressure and suction sides implies work exerted on fluid from the blade; in other words, the pressure coefficients, Cp, denote the cavitation performance (head) and force loading. The radial direction of the total force loading refers to radial force on blades. Model C obviously showed a lower pressure difference among all the casing models, which could fully explain the fact that the worst cavitation performance was achieved with Model C, as discussed in the previous section.
We accordingly drew the Cp curves at three different spanwise heights (30%, 60% and 90%) for this particular blade for all models (Figure 15). As the spanwise height increased, the pressure difference between the PS and the SS increased, leading to a higher lift force. The Cp curves have similar patterns for the 30% and 60% spanwise heights, only with different magnitude levels. Since the 90% spanwise height is located around the blade tip of the cavitation initiation/onset area, the pressure distribution in this region showed different characteristics compared with the other two heights.
At the 90% spanwise height, among the five step casing models, Models D and E showed quite similar Cp curves to Model O, while Models A and C showed quite different blade loading distributions around the LE. From the LE to the TE, Model A showed a small reduction in Cp within a small, normalized length (0 to 0.15) on the PS and a significant reduction in Cp within a large, normalized length (0.1 to 0.5) on the SS. Model C showed a big reduction in Cp within 0 to 0.3 of the normalized length on the PS and a more significant reduction in Cp within 0 to 0.65 of the normalized length on the SS. Finally, Model C had the biggest net blade loading among all the step casings, followed by Model A, and the other casings showed similar blade loading distributions.
Blade loading Cp counters at 90% spanwise height for all three blades were plotted for casing models (Figure 16). As was discussed with respect to Figure 11, Figure 12, Figure 13, Figure 14 and Figure 15, the step casings of Models D and E showed similar cavitation characteristics to Model O. Model C showed the most different behaviors as compared with the other casings. The lower pressure difference between the PS and the SS, the smaller low-pressure area on the SS and the higher pressure level at the LE strongly reflected the tip leakage magnitude, cavity size and inducer suction capacity, as discussed in previous sections. Again, it is to be emphasized that the Cp distribution for all three blades implies the total force exerted on the blade, while the radial component is the radial force, representing RC instability in our study. Generally speaking, the smallest radial force could be observed for Model C.

3.2.4. Radial Forces

Based on the blade loading in the previous section, the orbits of the normalized radial forces for all blades in 10 revolutions are depicted in Figure 17a, where the radial force is normalized by the time-averaged radial force of Model O. The time series of normalized radial force is shown in Figure 17b, accordingly. All step casing models showed similar trends of radial force distributions to Model O, but with smaller magnitudes. Model O showed a more uniform distribution circumferentially out of all the step casings, while Model C showed the most non-uniform distribution, even with the smallest magnitude. Compared with the straight casing (Model O), the time-averaged radial force dropped by around 66% for Model C and by 20–30% for the other step casing models.
The frequency spectra of radial force for all the casing models are shown in Figure 17c. Obviously, all the casing models showed the same signal spectrum with the inducer rotational frequency (83.3 Hz, f0) and its harmonic frequencies. Model A had a low peak frequency at 0.27f0 (22.6 Hz). Model E had the biggest peak values at f0 and 2f0, but the smallest peak value for Model C had the highest frequency at 3f0 among all the casings. All of these temporary and frequency characteristics reflect the interaction between tip leakage and main flow in the inter-blade passages.

4. Conclusions

In summary, this article presents five new step casings to suppress the rotating cavitation instabilities of axial inducers. A numerical validation was conducted on the original Model O, with good agreement found between the experimental results and the instantaneous snapshots of cavity structures in terms of cavitation performance. Then, five step casings (Models A–E) were designed with varying the step starting locations and step enlargement sizes. The cavitation performances showed that Models B, D and E were similar to the straight casing (Model O). Moreover, the cavity structures, flow patterns and blade loading distributions together showed that the interaction between tip leakage flow and main flow in the inter-blade passages strongly affected inducer rotating cavitation. Radial forces were estimated both in time and frequency domains for a better understanding of the rotating cavitation instabilities. Models A–C focused on the effect of the starting location of the step casing. The results showed a trend of both the performance (head coefficient) and radial forces increasing as the starting location shifted from downstream to upstream of the inducer inlet. Models A, D and E were related to the effect of the enlargement size of the step casing. The results showed a trend of performance (head coefficient) and radial forces increasing as the enlargement size increased. With a lower pressure distribution along both the pressure side and the suction side, Model C showed much smaller radial forces compared with the other casing models, with a reduction of 66% compared to Model O. Other step casings showed reductions in radial force of about 20–30% compared to Model O. Finally, in terms of both cavitation performance and radial force, step casing Model E presented the best alternative for suppression of the cavitation instability of the original straight casing. In short, this study provides a standard workflow for effectively suppressing the rotating cavitation of inducers by simply adopting the step casing configuration presented herein, avoiding the more complicated procedure of geometrical improvement to inducers that is usually applied in engineering practice.

Author Contributions

Investigation, H.H.; data analysis, H.H. and D.G.; writing—original draft, H.H., Z.R. and D.G.; writing—review and editing, L.X., K.X., S.L. and Z.Z.; supervision, S.L. and Z.Z. All authors have read and agreed to the published version of the manuscript.

Funding

This research was funded by the National Natural Science Foundation of China (NSFC, no. 52079066 and no. 52076120), the State Key Laboratory of Hydroscience and Engineering (2019-KY-04, sklhse-2019-E-02 and sklhse-2020-E-03) and the Creative Seed Fund of Shanxi Research Institute for Clean Energy, Tsinghua University.

Conflicts of Interest

The authors declare no conflict of interest.

References

  1. Tsujimoto, Y.; Yoshida, Y.; Watanabe, Y.; Hashimoto, T. Observations of Oscillating Cavitation of an Inducer. J. Fluids Eng. 1997, 119, 775–781. [Google Scholar] [CrossRef]
  2. Tsujimoto, Y. Cavitation Instabilities in Inducers. In Design and Analysis of High Speed Pumps; Educational Notes RTO-EN-AVT-143, 8-2–8-26; von Karman Institute: Sint-Genesius-Rode, Belgium, 2006; Available online: https://www.sto.nato.int/publications/STO%20Educational%20Notes/RTO-EN-AVT-143/EN-AVT-143-08.pdf (accessed on 21 January 2022).
  3. Xiang, L.; Tang, Y.; Chen, H.; Xu, K.F. Experimental investigation of cavitation instabilities in inducer with different tip clearances. Chin. J. Aeronaut. 2021, 34, 168–177. [Google Scholar] [CrossRef]
  4. Chen, H.; Zhang, E.Z.; Tan, Y.H. Rotating cavitation of the high-speed rotational inducer of LRE. J. Propuls. Technol. 2009, 30, 390–395. (In Chinese) [Google Scholar]
  5. Wang, Y.; Manfredi, M.; Pasini, A.; Spakovszky, Z. Dynamic Model-Based Identification of Cavitation Compliance and Mass Flow Gain Factor in Rocket Engine Turbopump Inducers. J. Eng. Gas Turbines Power 2021, 143, 021011. [Google Scholar] [CrossRef]
  6. Zhang, H.; Zuo, Z.; Morch, K.A.; Liu, S. Thermodynamic effects on Venturi cavitation characteristics. Phys. Fluids 2019, 31, 097107. [Google Scholar]
  7. Lettieri, C.; Spakovszky, Z.S.; Jackson, D.; Schwille, J. Characterization of Cavitation Instabilities in a Four-Bladed Turbopump Inducer. J. Propul. Power 2018, 34, 510–520. [Google Scholar] [CrossRef]
  8. Yu, L.; Zhang, H.C.; Chen, H.; Li, Y.P.; Zuo, Z.G.; Liu, S.H. Geometrical optimization of an inducer with respect to rotating cavitation generated radial forces by using an orthogonal experiment. J. Appl. Fluid Mech. 2018, 11, 1591–1598. [Google Scholar] [CrossRef]
  9. Fujii, A.; Uchiumi, M.; Kurokawa, J.; Tsujimoto, Y. Suppression of Rotating Cavitation in an Inducer by J-Groove. Trans. Jpn. Soc. Mech. Eng. Ser. B 2006, 72, 2496–2504. [Google Scholar] [CrossRef]
  10. Shimiya, N.; Fujii, A.; Horiguchi, H.; Uchiumi, M.; Kurokawa, J.; Tsujimoto, Y. Suppression of Cavitation Instabilities in an Inducer by J Groove. J. Fluids Eng. 2008, 130, 021302. [Google Scholar] [CrossRef]
  11. Choi, Y.D.; Kurokawa, J.; Imamura, H. Suppression of Cavitation in Inducers by J-Grooves. J. Fluids Eng. 2007, 129, 15. [Google Scholar] [CrossRef]
  12. Kang, D.; Arimoto, Y.; Yonezawa, K.; Hironori, H.; Kawata, Y.; Hah, C.I.; Tsujimo, Y. Suppression of Cavitation Instabilities in an Inducer by Circumferential Groove and Explanation of Higher Frequency Components. Int. J. Fluid Mach. Syst. 2010, 3, 137–149. [Google Scholar] [CrossRef]
  13. Li, X.; Hu, S.C.; Zhou, Y.J.; Xiao, L.M.; Liu, C.; Wang, J. Study on Cavitation Performance of a Inducer with Helical Grooves. J. Propuls. Technol. 2020, 41, 553–558. (In Chinese) [Google Scholar] [CrossRef]
  14. Timushev, S.; Klimenko, D.; Kazennov, I.; Li, J.W. Unsteady Flow and Pressure Pulsations in a Model Axial-Vortex Stage Inducer. J. Propuls. Technol. 2019, 40, 1458–1466. [Google Scholar] [CrossRef]
  15. Kamijo, K.; Yoshida, M.; Tsujimoto, Y. Hydraulic and Mechanical Performance of LE-7 LOX Pump Inducer. J. Propuls. Power 1993, 9, 819–826. [Google Scholar] [CrossRef]
  16. Fujii, A.; Azuma, S.; Yoshida, Y.; Tsujimoto, Y.; Uchiumi, M.; Warashina, S. Effects of Inlet Casing Geometries on Unsteady Cavitation in an Inducer. Trans. Jpn. Soc. Mech. Eng. B 2004, 16, 1450–1458. [Google Scholar] [CrossRef]
  17. Shimagaki, M.; Kimura, T.; Hashimoto, T.; Watanabe, M. Investigation of Backflow Structure in a Turbopump Inducer with the PIV Method. In Proceedings of the 43rd AIAA/ASME/SAE/ASEE Joint Propulsion Conference & Exhibit, Cincinnati, OH, USA, 8–11 July 2007. [Google Scholar]
  18. Shimagaki, M.; Hashimoto, T.; Watanabe, M.; Hasegawa, S. PIV observation of Prewhirl Flow Upstream of a Turbopump Inducer. J. Flow Vis. Image Process. 2010, 17, 85–98. [Google Scholar] [CrossRef]
  19. Yu, L.; Zhang, H.; Chen, H.; Zuo, Z.; Liu, S. Numerical study on the influence of step casing on cavitating flows and instabilities in inducers with equal and varying pitches. Processes 2020, 8, 1103. [Google Scholar] [CrossRef]
  20. Menter, F.R. Two-equation eddy-viscosity turbulence models for engineering applications. AIAA J. 1994, 32, 1598–1605. [Google Scholar] [CrossRef]
  21. Zwart, P.J.; Gerber, A.G.; Belamri, T. A two-phase flow model for predicting cavitation dynamics. In Proceedings of the Fifth International Conference on Multiphase Flow (ICMF), Yokohama, Japan, 30 May–4 June 2004. [Google Scholar]
Figure 1. Inducer cavitation performance test system.
Processes 10 01598 g001
Figure 2. Test inducer (units: mm).
Processes 10 01598 g002
Figure 3. Schematics of straight casing Model O and step casings: Models A–E (units: mm).
Processes 10 01598 g003
Figure 4. Total computational domain of Model O (units: mm).
Processes 10 01598 g004
Figure 5. Mesh sensitivity test.
Processes 10 01598 g005
Figure 6. Computational meshes for rotating subdomains of Model O: (a) a ring-shaped rotating subdomain representing the space from the blade tip to the casing wall; (b) a cylinder rotating subdomain of the same the inducer tip diameter; and (c) meshes on the inducer surface.
Processes 10 01598 g006
Figure 7. Comparison of cavitation performance between computational and experimental results for Model O.
Processes 10 01598 g007
Figure 8. Comparison of six instantaneous snapshots of cavity structures in one revolution from the computational and experimental results for Model O.
Processes 10 01598 g008
Figure 9. Cavitation performance for all casing models.
Processes 10 01598 g009
Figure 10. Normalized cavity area over time for three blades of Model O.
Processes 10 01598 g010
Figure 11. Cavity structures for all casing models.
Processes 10 01598 g011
Figure 12. Streamline and pressure distribution in inducers of different casings.
Processes 10 01598 g012
Figure 13. Velocity vectors and vapor volume fraction in the axial section.
Processes 10 01598 g013
Figure 14. Blade loading at a certain blade surface for all models.
Processes 10 01598 g014
Figure 15. Blade loading for a certain blade for all models at three different spanwise heights. (a) 30% spanwise height, (b) 60% spanwise height and (c) 90% spanwise height.
Processes 10 01598 g015
Figure 16. Blade loading contours at 90% spanwise heights in inter-blade passages.
Processes 10 01598 g016
Figure 17. Normalized radial force of inducer blades for all casing models: (a) orbit distributions; (b) time series; and (c) frequency spectra.
Processes 10 01598 g017
Table 1. Main parameters of the test inducer with the original casing.
ParameterValue
Number of blades, N3
Blade tip diameter, D0 (mm)100
Hub inlet diameter, D1 (mm)15.5
Hub outlet diameter, D2 (mm)35.5
Blade root thickness, Tr (mm)5.25
Blade tip thickness, Tt (mm)2
Sweepback angle of leading edge, α (°)120
Tip clearance, τ (mm)0.5
Table 2. Comparisons of head coefficients at two typical cavitation numbers.
ModelOABCDE
Ψ1 (at σ1 = 0.5)0.1580.1500.1560.1400.1570.158
Percentagebaseline94.9%98.7%88.6%99.4%100%
Ψ2 (at σ2 = 0.074)0.1560.1500.1540.1450.1550.157
Percentagebaseline96.2%98.7%92.9%99.4%100.6%
Publisher’s Note: MDPI stays neutral with regard to jurisdictional claims in published maps and institutional affiliations.

