Article

A Metallic Fracture Estimation Method Using Digital Image Correlation

1
Engineering Research Center of Low-Voltage Apparatus Technology of Zhejiang Province, Wenzhou University, Wenzhou 325035, China
2
Zhejiang Juchuang Smartech Co., Ltd., Wenzhou 325036, China
3
People Electric Appliance Group Co., Ltd., Wenzhou 325036, China
4
Technology Institute, Wenzhou University, Yueqing, Wenzhou 325699, China
*
Author to whom correspondence should be addressed.
Processes 2022, 10(8), 1599; https://doi.org/10.3390/pr10081599
Submission received: 18 July 2022 / Revised: 6 August 2022 / Accepted: 9 August 2022 / Published: 12 August 2022
(This article belongs to the Section Automation Control Systems)

Abstract

:
This paper proposes a metallic fracture estimation method that combines digital image correlation and convolutional neural networks, based on a proven theory that the strain distribution of a component changes when a crack occurs in a structure. By using digital image correlation, the method achieves noncontact and nondestructive sensing, as well as high interference immunity. We utilize a digital image correlation system to produce strain distribution graphs that reflect occurrences and propagations of fractures during fatigue processes. A deep residual network (ResNet) regression model is trained by correlating strain distribution graphs with the corresponding fracture lengths, so that the fracture propagation condition can be estimated by data from digital image correlation. In the experiment, according to the American Society for Testing Materials (ASTM) standards, we fabricate a set of aluminum specimens and perform fatigue tests with data acquisition by digital image correlation. Finally, we obtain a crack length estimation mean absolute error of 0.0077 mm, or 0.26% of the measuring range. The results show the precision, as well as the practicality, of the proposed method.

1. Introduction

Fracture detection of metallic components is an important issue in multiple areas. Early detection of machine failures and structural condition is critical considering safety and maintenance costs [1,2,3].
Ductile fracture is the main failure type in metallic components. There is a process from the crack occurrence to an ultimate failure (or “rupture”) under repeated mechanical stress loading and unloading. Extensive plastic deformation (necking) takes place before a ductile fracture. A ductile fracture process starts with a small crack caused by fatigue, and the crack keeps propagating under the stress until the component separates, leaving a rough surface [4]. In a cyclic loading condition, the cycle count of a ductile fracture process is determined by the material and the applied load. The ASTM E399 standard [5] recommends the adjustment of the load parameters to limit the cycle count within 104 to 106. It is desired to detect a crack as soon as it occurs and to estimate the size and shape of the crack as it propagates. Ideally, fracture detection must be noncontact and nondestructive. For this purpose, researchers design systems that monitor component conditions with individual sensors [6,7] or sensor networks in conjunction with health assessment algorithms [8,9].
Before a rupture occurs, extensive plastic deformation (necking) happens and there is a slow propagation with large associated energy absorption [4]. Hence, it is proven that the strain distribution of a metallic component changes when a crack occurs under a tensile load. This paper investigates fracture estimation through identification of strain distribution differences obtained by applying digital image correlation (DIC) [10]. Thus, to map the strain distribution to the corresponding fracture condition, we apply DIC strain distribution data to a deep residual network (ResNet) [11], an evolution of convolutional neural networks (CNN) [12], to train a regression model that detects the occurrences and estimates the lengths of fractures in real time. In the experiment, we use DIC data from a set of material fatigue tests to train a ResNet model to prove the effectiveness. In practice, for a specific component, the regions of high crack risks can be monitored by DIC and their fracture condition can be analyzed by pre-built models. In addition, factors such as the material, temperature, shape, load, etc. can significantly affect the occurrence and propagation of factures. The strain distribution is the comprehensive reflection of all the fatiguing factors. The paper only discusses the experiment on specific specimens under the conditions defined by ASTM standards, to prove the feasibility of the method. For an application of component fracture monitoring, the fatigue test under practical conditions needs to be performed and the DIC data need to be collected. Then, the corresponding model can be trained for crack diagnosis of this component.
The paper is organized as follows: Section 2 introduces related work on fracture detection; Section 3 illustrates the fracture estimation method used to detect and estimate cracks; Section 4 describes the configuration of the testing system and specimens, as well as the procedure of data acquisition; the experimental setup and measurement results are described in Section 5; closing remarks are presented in Section 6.

2. Related Work

A number of methods have been developed for detecting cracks in metallic structures, including techniques based on electrical current [13] or ultrasonic wave propagation [14,15]. Jin et al. [2] proposed a method that locates small flaws or cracks in thin-walled structures by electromagnetically-induced acoustic emission. Liu et al. [16] designed a dual laser ultrasonic system for fatigue crack detection, but the noise effect cannot be ignored. Zima et al. [17] proposed a guided wave propagation-based crack detection method, but the sensor configuration needs to be appropriately designed. Kim et al. [18] applied piezoelectric wafers on both sides of a metal structure and detected the crack by capturing Lamb wave mode conversion caused by an abrupt change in structure thickness. Broberg [19] detected cracks in welds by thermography, based on the knowledge that cracks absorb more energy than free surfaces when lit by a high-power infrared source. Albishi et al. [3] utilized a complementary split-ring resonator that detects sub-millimeter-sized cracks by frequency shifting. However, the methods introduced above only provide the sensing of fractures, while the automatic fracture condition estimation is not presented. In addition, some of the approaches [3,13,18] are only suitable for large scale cracks, and cannot be applied to detect the initiation of cracks.
Digital image correlation (DIC) is a widely used method that measures local displacements and strains [10] in material research. Compared with other strain measurement methods, DIC features the ability of obtaining strain distributions within an area, rather than an average strain value. DIC is now commonly applied to validate models and simulations. Cao et al. [20] modeled the anisotropic crack growth behavior of an aluminum alloy and used DIC to validate the model. Farahani et al. [21] employed DIC to analyze the force vs. displacement relation and internal fields of a sheet bi-failure specimen. Shrestha et al. [22] employed DIC to interpret the results of an acoustic emission (AE) method that tracks fatigue crack propagation in metal components. Chen et al. [23] compared DIC results to ABAQUS finite element analysis results to demonstrate that finite element simulation is reliable for describing the deformation of specimens. Meanwhile, DIC is a prospective sensing approach for reducing installation costs associated with fixed sensor networks, and it may be the only option in some cases, if specific fixed sensors were not installed prior to construction. Mohan et al. [24] concluded that the DIC technique minimizes measurement error by 35–70% when compared to other crack measurement techniques, such as sensors and strain gauges. Stewart et al. [25] demonstrated that DIC is a useful method for tracking fracture expansion by investigating fatigue crack expansion in hot mix asphalts. However, although DIC can obtain crack information in components, currently, there is no approach that automatically detects and estimates fracture propagation with DIC images, which is the purpose of this paper.
The utilization of machine learning methods (or data-driven methods) in the industry is rapidly increasing. Fault diagnosis is one of the main application areas [26,27]. The fundamental idea is to train fault detection models with existing data and identify real-time faults according to the trained models. Machine learning for fault detection includes principal component analysis (PCA) [28], the nearest neighbor regression (NNR) [29], support vector machines (SVM) [30], and artificial neural networks (ANN) [31]. Deep learning is a series of novel machine learning methods that has been developed from ANN with significant performance improvement. Deep belief networks (DBN) [14,15,32,33] and convolutional neural networks (CNN) are the two most frequently used frameworks. CNN was initially developed for image description, such as object classification and face recognition. Recent research led to its implementation in signal analysis and fault detection. Zeng et al. [33] applied CNN to classify faults of gearboxes by analyzing the vibration signals. Wen et al. [34] reformed randomly segmented signals to 2D signal images and applied a LeNet-5 CNN to detect faults of manufacturing systems. The results showed that the CNN methods achieve both high accuracy and efficiency.
Recently, scholars proposed fracture diagnosis methods that analyzing component images by machine learning. Chen et al. [35,36] proposed vision-based crack detection methods that aggregate information obtained from multiple video frames by using local binary patterns, support vector machines and Naïve Bayes and convolutional neural networks, and achieved relatively high detection accuracies. Hu et al. [37] utilized a deep region CNN to analyze the thermal images acquired by Eddy current pulsed thermography for crack localization on metals. However, the methods above only achieve fracture detection, while the approach of precise fracture length estimation is not presented, due to the insufficiency of fracture information and multi-source interference acquired by the imaging methods. Yuan et al. [38] recently presented a study that applied CNN and image processing to estimate the crack length in video frames, which was very close to purpose. They achieved a maximum absolute error lower than 0.15 mm and a maximum relative error lower than 2%. We will make a comparison between our work and Yuan’ work.
Compared with the existing methods, there are a couple of novelties and advantages of the proposed method that combines DIC and ResNet. Firstly, DIC is a noncontact and nondestructive measurement technique, as such, it does not interfere with the fatigue process, and it is of high interference immunity against dust, blots, or scratches; secondly, unlike existing methods that only achieve crack detection, since DIC provides strain distribution information effectively impervious to surface defects, the proposed ResNet regression model not only automatically detects a crack at its initiation, but also tracks its propagation process by estimating its length. In the experiment, the training and testing process utilize crack examples propagating in different directions, which increases the adaptivity of the model. In conclusion, the proposed method achieves noncontact, nondestructive, real-time occurrence detection and length estimation for fractures that propagate in different directions, which is significantly superior to the existing approaches of fracture diagnosis.

3. Fracture Estimation

3.1. DIC-Based Fracture Estimation

With the development of digital camera and image processing technology, now, the precision of DIC reaches micro- or even nanometers. Considering that strain difference is very small at the beginning of a crack occurrence, the sensitivity of DIC helps to detect the strain variation. The DIC sensitivity relies on the camera resolution and the component scale. In our experiment, the camera resolution reaches 0.005 mm/pixel, the strain precision reaches 0.001 unit, and a crack can be identified by the strain distribution when it grows to 1 mm in a 1 × 0.96 inch2 (2.54 × 2.4384 mm2) specimen, according to the ASTM standards E399 and E647 [5,39], as shown in Figure 1a. The testing tensile is applied via a pair of pins through the holes, as shown in Figure 1b.
Our goal is to estimate the propagation of a fracture in real-time by using DIC images simultaneously with the component in operation. Considering a piece of stiff material under linear stress, according to Griffith’s model [40], the strain energy becomes non-uniform near the crack. Therefore, we investigate the relationship between the strain distribution and fracture propagation under the same load condition, and expect to develop an approach to estimate the fracture based on strain distribution.
Meanwhile, it is very common for metallic components to operate under cyclic loading conditions. Hence, we can identify whether a crack occurs by comparing strain distributions at different load cycles. Figure 2 shows the simulation in ANSYS of the Hencky equivalent strain distribution of a specimen made of Al6061-T6. A 2000 N tensile is applied vertically, as Figure 1b illustrates. By changing the displacement of the tensile, the final strain distribution graphs are obtained. The simulation images indicate that the strain distribution becomes non-uniform near the crack. The strain close to the crack is significantly larger than that far from the crack. The overall strain increases and the position of the highest strain moves with the growth of the crack. Therefore, the feasibility of the proposed strain-based crack estimation method can be proven.
For a specific fracture case, the strain distributions of the complete fracture propagation process with the load cycle increasement are recorded, and the strain distribution graphs (SDGs) of every load cycle are mapped to the corresponding crack length via a CNN regression model. There are two strategies that form the SDGs to examples used to model deep learning networks, which are as follows:
  • Strategy 1: apply SDGs with the maximum load of cycles as example features, as shown in Figure 3a.
  • Strategy 2: apply SDG sequences of load cycles as example features. Each SDG of the sequence corresponds to a pre-defined timing within the cycle, as shown in Figure 3b.
We define a load sequence {f1, f2, f3, …, fn} within a cycle (n is the sequence count). Hence, we can obtain an SDG sequence {g1, g2, g3, …, gn}, where gi (i = 1, 2, 3, …, n) represents the SDG under the corresponding load fi. By defining the AOI (area of interest, the area to be studied in an image) length and width as a and b, respectively, we add the features to a 3D ‘stack’ with the dimensions of a × b × n, as shown in Figure 1b. A feature stack contains strain distribution information in both space and time.
In practice, the frame rate of the DIC camera is higher than the cycling frequency, e.g., 10 frames for 1 cycle. Therefore, it is required to determine the SDG that reflects the load crest in every cycle. One approach is using a load sensor that simultaneously traces the load, which increases the complexity and cost of the system. Nevertheless, we propose a “maximum mean strain” method to detect the SDG of the maximum load without auxiliary sensors. The method is described as follows:
  • In an SDG sequence of a number of load cycles, define L as the number of SDGs for a cycle. Let l = 1.
  • Select L SDGs in a row: Gs = {gl, gl+1, gl+2, …, gl+L−1}, and extract the valid pixels of each SDG in Gs (some pixels in the AOI are invalid due to distortion by the crack or blocking by the fixtures), so we obtain a new sequence Gs′ = {gl, gl+1, gl+2, …, gl+L−1}.
  • Compute the mean of each SDG in Gs′: {sl, sl+1, sl+2, …, sl+L−1}.
  • Find sk that meets the following:
{ s k 1 s k s k + 1 l < k < l + L 1
5.
If sk can be found, then gk is the SDG of the cycle. Let l = l + L, and return to step 2 for the next cycle.
6.
If sk cannot be found, let l = l + 1, and return to step 2.

3.2. Fracture Estimation by Deep Learning Regression

Our case is a high-dimensional regression problem. In our case, the dimensionality of a feature stack (a × b × c) = (96 × 96 × 3). In order to perform high-efficiency computation, inspired by deep-learning-based motion recognition methods for image sequences [41,42], we apply a ResNet-18 [11], which is an evolution of convolution neural networks (CNN). The ResNet-18 architecture contains 17 convolution layers and a full connection layer, as shown in Figure 4.
Figure 4a illustrates the overview of the ResNet-18 architecture. We defined the square image side length as a, the number of example channels as b, the input example dimensions (a × a × c) equal (96 × 96 × 1) and (96 × 96 × 3) for Strategy 1 and 2, respectively. The network begins with a convolution (Conv) layer with a batch normalization (BN) layer and a ReLU activation layer. The convolution parameters (a × a × c, k, s) = (96 × 96 × 1, 7, 2), where k is the side length of the convolution kernels, and s is the convolution stride. Then, a pooling layer is applied with (kp, sp) = (3, 2), where kp is the side length of the pooling window, and sp is the pooling stride. Therefore, the features are shrunk to 24 × 24, and forwarded to residual blocks.
There are two types of residual blocks, up blocks (Figure 4b) and down blocks (Figure 4c). An up block with parameters (a × a × c) has two series Conv + BN + ReLU groups, whose parameters are (a × a × c, 3, 1). A down block has two series Conv + BN + ReLU groups of (a × a × c, 3, 2) and (a/2 × a/2 × c, 3, 1), respectively, as well as a down sampling layer of (a × a × c, 3, 2). The features are formed to be (3 × 3 × 512) and forwarded to a full connection layer, which finally converts the features to a single-valued output, e.g., the estimated fracture length. For this regression problem, the model is optimized by minimizing the mean square error (MSE) between the ground truth and the prediction. Adam is applied as the optimizer. The SDGs are acquired by a DIC system in a set of fatigue tests, and the facture lengths are measured by image processing during the tests.
Generally speaking, deeper networks can achieve higher accuracy. Nevertheless, networks such as ResNet-34 or ResNet-50 cannot be used in this case because the size of the source DIC images is limited.

4. Fatigue Test and Data Acquisition
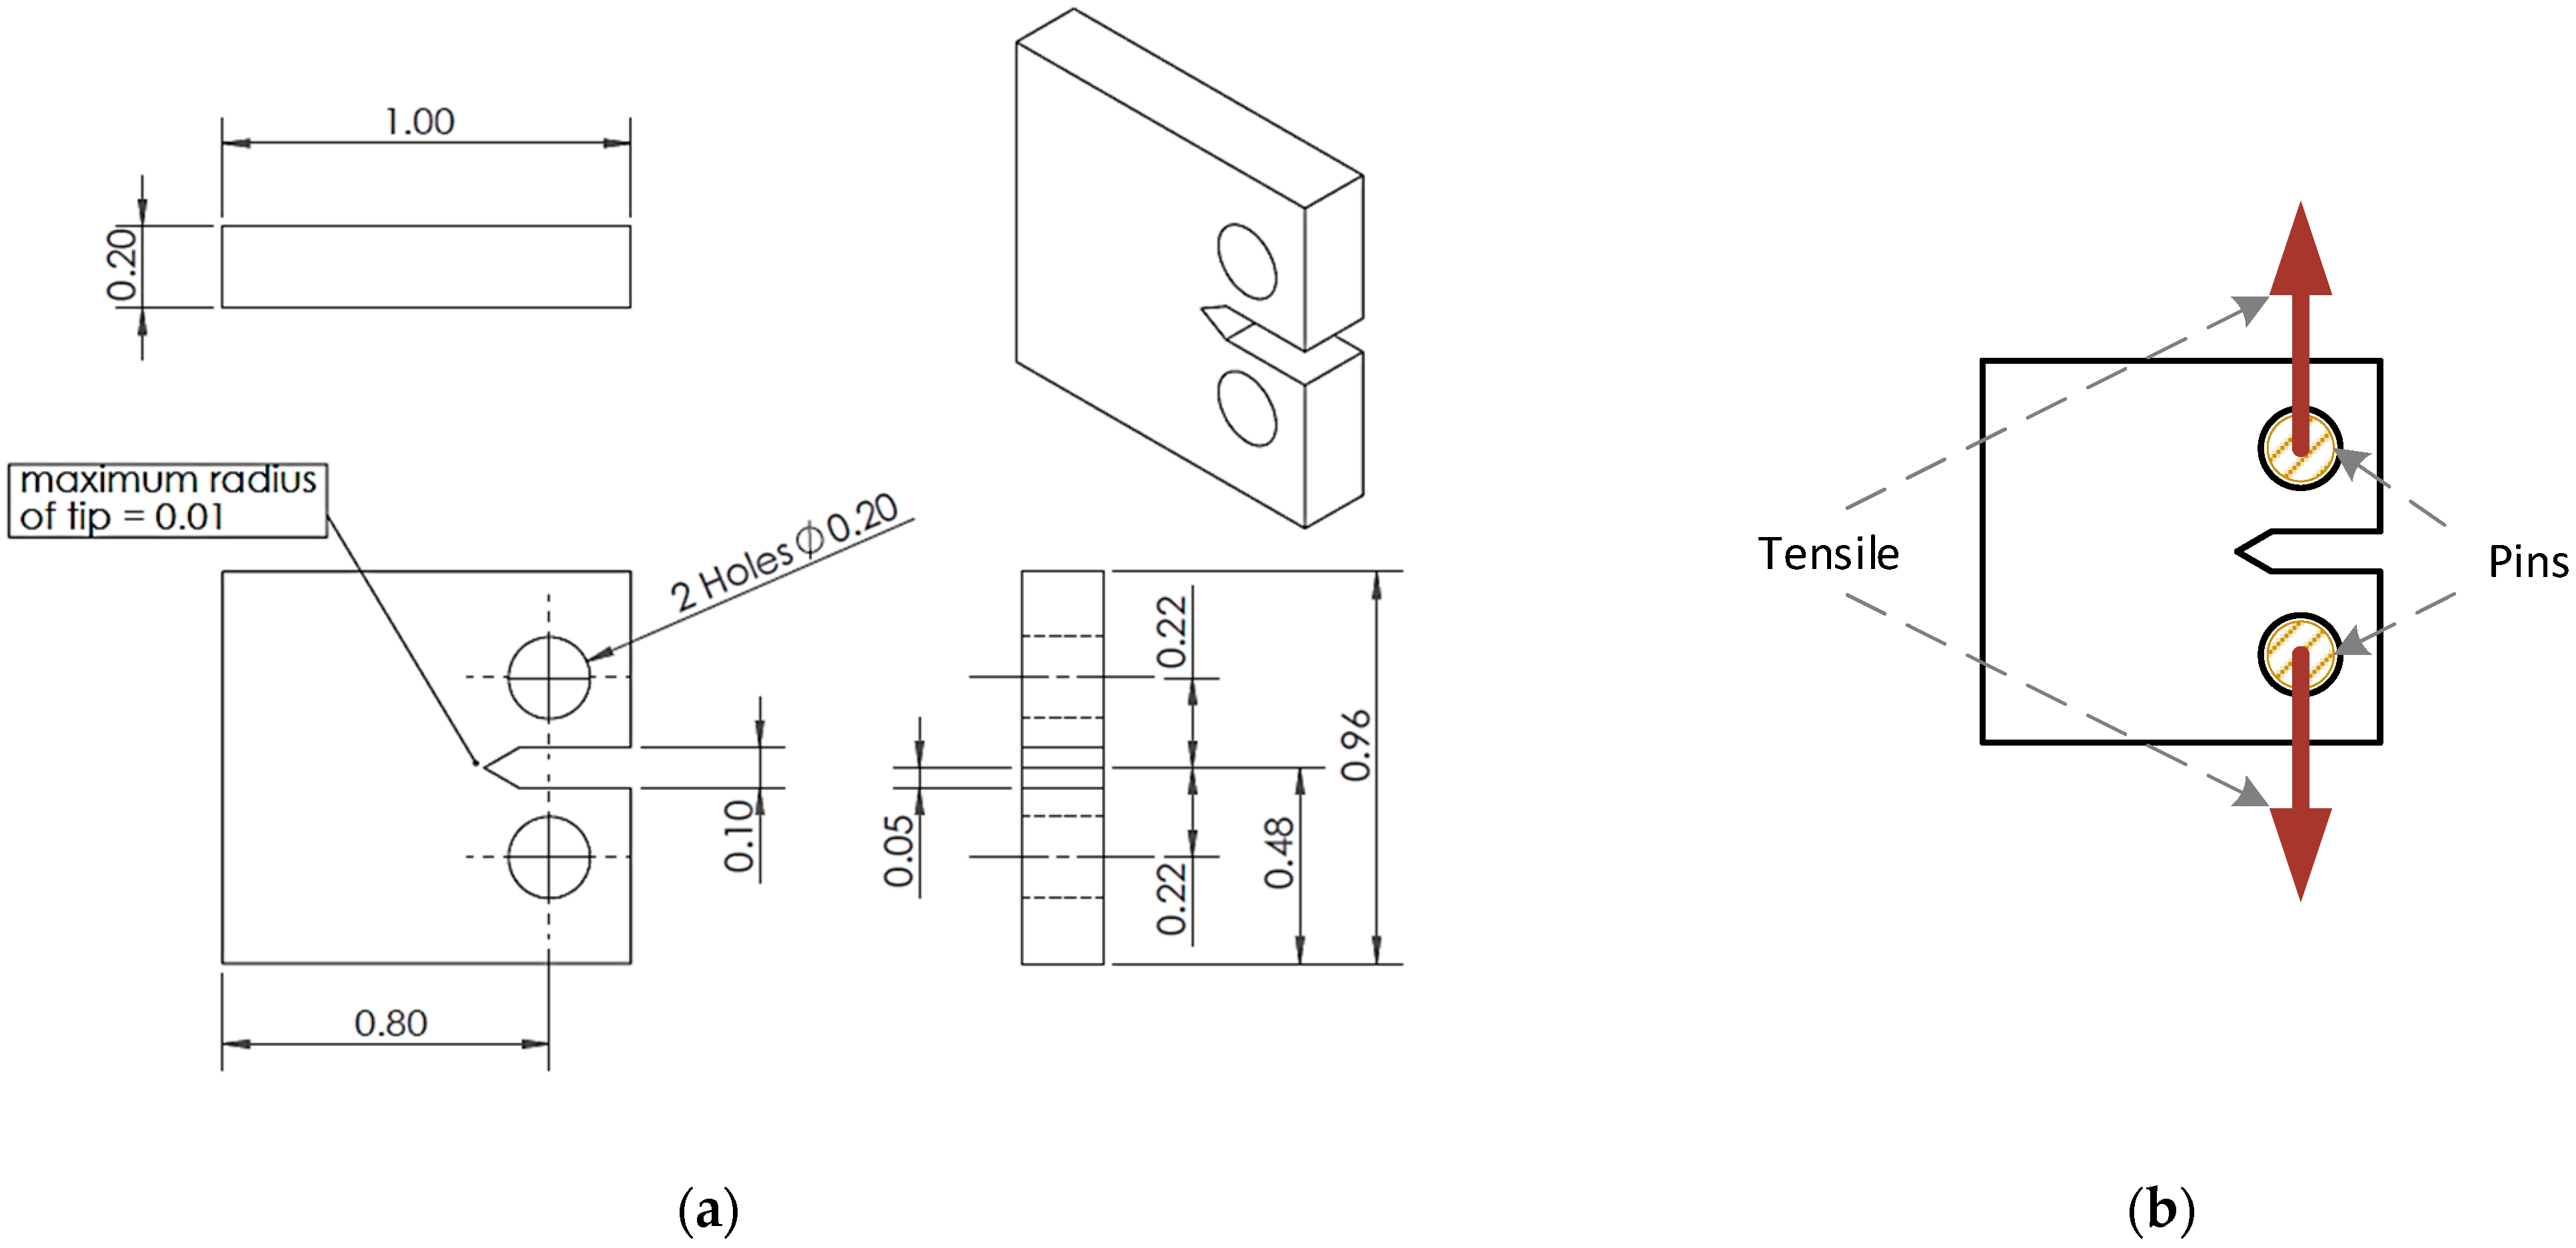
According to the ASTM E399 and E647 standards [5,24], we build a testing system that uses a load frame to perform cyclic loading. The testing system is designed to produce fractures of mode I (opening mode). A DIC system is utilized to measure strain distribution and variation in the test specimens.

4.1. Specimens

The specimens used for the test are plate coupons made of aluminum 6061, as shown in Figure 1a. A notch is cut in the middle of one side and two mounting holes are machined. In practice, the notch tip of the fabricated specimen is not very sharp due to the precision of our machining center, so we manually cut a small tip with a razor blade. Micro speckle stamps are manually painted on the specimens’ front surfaces for DIC tracking. We paint the front surface white as the base, and apply black spray paint on the surface to form random speckles. The DIC system traces the distances between speckles, and thus obtains the strain distribution by computing the deformation of the surface. The density of speckles is not strictly required, since the DIC system is designed to be compatible to a wide range of speckle densities. Meanwhile, interferences of dust, blots, and scratches can be remarkably reduced, as they can be also treated as stamps during the real-time image comparison by DIC. Specimens before and after the speckle pattern was applied are shown in Figure 5.
We apply two pins through the holes to install the specimen between a pair of clevises, so that the specimen can be firmly fixed in the load frame, as shown in Figure 6.

4.2. Testing System

The testing system consists of a load frame system and a DIC system. The load frame has two clamps that grip the clevises to fix the specimen between them (Figure 7).
The clamps can pull or compress specimens to perform tensile or compression loads. The applied force and displacement can be programmed via software. Therefore, load cycles can be achieved by varying the force and displacement with time. Since we aim to measure the strain distribution on the specimen’s surface, 2D DIC is applied in our test. The DIC system consists of a five-megapixel (2448 × 2048) digital camera, a set of lighting sources, as well as a software toolkit that captures and analyzes images. The DIC system tracks the movement of the micro speckles on the surface and then the strain graph can be calculated according to the displacements of speckles. Since we expect to relate every strain distribution to the corresponding load value, synchronization between the load frame system and the DIC system is implemented. We utilize a triggering mechanism with a constant load cycle period (Tl) to achieve synchronization, which is as follows:
  • The load frame measures the load value from its feedback sensor, and transmits the value to the DIC system;
  • Once the load drops below a specified low-level threshold, the DIC system is triggered and keeps capturing n pictures. Assuming that the DIC frame rate is fDIC, to guarantee that all pictures are within a load cycle, the parameters should satisfy the following equation:
n f D I C T l
3.
The DIC system stops to wait for the next trigger.
Therefore, the proposed triggering mechanism can achieve synchronization in every load cycle period at the trigger moment and eliminates the accumulated clock error between the load frame and DIC systems. In practice, to reduce the storage requirement, we expect to capture images for a cycle in every N cycle (e.g., N = 10). Hence, in every N cycle, we define one specific cycle that has a slightly lower trough than the others, and the triggering threshold is near the lower trough. Hence, the camera will only be triggered during the specified cycle.

4.3. Testing Procedure

The testing procedure is described as follows:
  • Prepare a specimen as illustrated in Section 4.1, and fix it in the load frame;
  • Perform a sine cyclic tensile load to precrack the specimen until a crack occurs that reaches 1 mm;
  • Perform a sine cyclic tensile load to fatigue the specimen until complete failure occurs;
  • The DIC system is triggered and n pictures are captured in every cycle, and the crack length is measured;
  • Keep the test until the specimen completely fails.
The precracking load is greater than the fatiguing load to initially produce a crack quickly. However, during precracking, we also insert a fatiguing load cycle and capture DIC images every several load cycles to obtain the strain distribution of uncracked and small-crack conditions.
Crack length measurements are achieved by counting the pixels of the crack in the DIC images of the maximum load. Since the physical width represented by a pixel can be calibrated before the test, the crack length can be, thus, determined by converting pixel count to the physical length in millimeters.
The DIC software generates strain distribution graphs from speckled specimen pictures. We select an area of interest (AOI) where strain varies the most significantly on the speckled surface and produce strain distribution graphs (SDGs) of this area. Figure 8 shows the AOI location on the fracture propagation direction.

5. Experiments and Results

5.1. Cyclic Load Test for Fatigue

We fatigued five specimens by our test procedure. The precracking load is 2700 N and the fatiguing load is 2000 N. During the process, a crack keeps growing to about 5 mm and then the specimen suddenly breaks completely. The result is indicated by Table 1. Since the specimens are fabricated from different batches of base plate, the cycle counts are not very consistent. However, we determine the fracture condition by the crack length, so the inconsistency does not influence our modeling work. Figure 9 shows a completely failed specimen and Figure 10 shows the entire crack growth process and the computed major Hencky (logarithmic) strain. In every original DIC image, the crack is marked by a red box. The dark areas in the upper right and lower right are the clevises that block out the view of the specimen, and the black area in the middle right is the notch, so that the strain of these areas cannot be achieved. We represent strain levels by different colors.
Figure 10 shows the strain distribution variation of specimen 3 whose crack grows in the test (first row: original images acquired by the DIC system, second row: major Hencky strain distribution graphs). The strain distribution significantly changes as the crack grows, which proves that crack propagation can significantly change the strain distribution. When there is no crack (Figure 10a), the overall strain is very small, and the maximum strain is near the fabricated notch. With the growth of the crack (Figure 10b–d), the overall strain increases, and the maximum strain surrounds the crack. There is a V-shape gradient strain distribution from the crack to other regions of the specimen. When the crack is very large (Figure 10e,f), the maximum strain is near the end of the crack, while that near the root decreases. According to Figure 10, it can be concluded that to the SDG variation can obviously reflect the crack length. In addition, it can also be noticed in Figure 10 that the crack grows slowly at the beginning, and the growth accelerates when the specimen reaches its failure. This phenomenon occurs with all specimens. Therefore, it is important to detect fractures early to avoid a sudden break.
In our experiment, the applied cyclic load is monitored by a load sensor, and the corresponding load value of every SDG is recorded. To verify the proposed “max. mean strain” method that determines the load-crest SDGs, we perform the method for all the SDGs and compare the result with the recorded load signal. The result shows that the determination accuracy is 97.86%. The false determinations of load-crest SDGs are inspected, and it is found that their corresponding load is very close to the load crests of the cycles. The maximum difference is 36.74 N, which is 1.84% of the error rate. It can be caused by measurement errors and delays of both the DIC system and the load sensor. However, since the load difference is very small, the false load-crest SDGs are very similar to the true ones (the MSE is within 1.6 × 10⁻⁶) and can be accepted as the load-crest SDGs.

5.2. Training and Testing of the Fracture Estimation Model

We study the SDGs of cracks from 0 to 3 mm, since in the experiment, a crack grows very quickly after it reaches 3 mm, and it is not reliable to keep on using such a component in practice. We obtain 3639 cycles of the 5 tested specimens. We select a 960 × 960 AOI for DIC processing. After the DIC processing, the size of the SDGs is 96 × 96. We linearly normalize the values of the SDG pixels into [0, 1]. Since all cracks on the SDGs propagate in the same direction, every processed SGD is rotated by 10 angles around the image center to produce 10 SGDs, with cracks propagating in different directions. Therefore, in total, we obtain 36,390 examples. Figure 11 shows three rotated images of an SDG whose crack length is 2 mm. From left to right, the rotation angles are 0°, 285° and 178°, respectively. The grayscale of pixels indicates the strain intensity. The lighter color means the higher strain. The black pixels within the light region indicate the crack region, which cannot be evaluated by the DIC system, since there is no material at those positions. All examples are randomly divided into three subsets for training, validation and testing. The training: validation: testing rate is 3:1:1.
We set the maximum number of training epochs to 2000, and the batch size of every step is 100 examples. The network is optimized minimizing the loss (MSE) and evaluated by the metric (MAE). It is configured that a validation is performed after every epoch, and once the validation error (MAE) reaches the minimal, the current model parameters will be saved. Therefore, the final optimal model will be determined regarding the lowest validation error.
The network model is trained by TensorFlow 2 [43] on a high-performance computation server, with NVIDIA TITAN V GPUs for CUDA computational acceleration [44]. Figure 12 shows the training processes of Strategy 1 and 2, respectively. The training loss is converted to the root mean square error (RMSE) to unify the unit for a clear illustration. A moving mean window of length 100 is performed to both training loss and metric, to smooth the curve for a clear representation. The validation metric error in MAE is also presented. It is illustrated that the network is trained effectively.
It is observed that both strategies achieve high precision after 2000 epochs. The training results are very close between the two strategies. However, Strategy 2 achieves a lower validation error. Then, the trained models are applied to the test data that are not involved in the training process, and finally, the test MAEs are 0.0089 mm and 0.0077 mm for Strategy 1 and Strategy 2, respectively. It is proven that using Strategy 2 means a lower estimation error. Considering that our crack measurement is within 0 to 3 mm, while the mean estimation error is 7.7 μm (0.26% of the measuring range), it can be concluded that the proposed method can precisely estimate the fracture condition by using strain distribution.
Meanwhile, we apply a LeNet-5 network [34], which is simpler and widely used, as a comparison with the ResNet-18 network. The comparison is shown in Table 2. It is observed that ResNet-18 is superior to LeNet-5 in the estimation precision, while there is no significant efficiency decrease. Meanwhile, it is proven that although Strategy 2 requires twice of the processing time of Strategy 1, the total processing time is less than 200 μs, which is normally acceptable in relatively low-frequency mechanic applications, where commonly, the load frequency is lower than 1 kHz.
We also compare our work with Yuan’s work [38]. Yuan’s test applied a camera with higher resolution (3840 × 2748) than what we used (2448 × 2048), and they only provided 13 test examples starting from the crack length of 1 mm, and utilized the absolute error and the relative error as the metrics. To perform a fair comparison, we display the absolute and relative errors obtained with Strategy 2 within the crack length range of (1, 3) mm, which contains 4306 test examples.
Figure 13 shows that the maximum absolute error is lower than 0.06 mm, which is smaller than that of Yuan’s method (1.5 mm), and the maximum relative error is lower than 2%, which is as the same as that of Yuan’s method. However, Yuan’s paper did not prove the capability of estimating very small cracks (<1 mm), while our method can estimate cracks within (0, 1) mm (absolute error < 0.02 mm and relative error < 5%). Meanwhile, as a two-stage process, Yuan’s final crack length estimation error did not include the detection error in the earlier crack detection stage, while our result reflects the accumulated error of the complete process. In addition, we prove the capability of estimating cracks that propagate in all directions, which is not presented in Yuan’s work. Therefore, it can be concluded that our method is relatively superior to Yuan’s method.

6. Conclusions and Further Discussion

The paper proposes a noncontact, nondestructive fracture detection and estimation method that uses DIC strain image data from fatigue processes to model a ResNet-18 regression network. The data are acquired from fatigue tests of five specimens under the conditions of the ASTM E399 and E647 standards. The experimental results show that the regression network achieves an MAE of 0.26% within 200 μs per example, proving that the method can achieve high precision and efficiency for fracture condition estimation. In conclusion, the proposed method is a novel and efficient metallic approach with a high value of practical application. Nevertheless, to apply the method in practice, there are several issues that need to be carefully considered.
The scale of the specimen in our experiment is very small, so small cracks can be detected. For a larger component in practice, the crack detection capability depends on the AOI size, the resolution of the DIC camera, etc. In our experiment, the approximate crack location is known because the specimens are designed according to ASTM standards. In practice, we can set a number of regions of high crack risk on a component, and analyze these regions by pre-built network models. The proposed models are applicable to cracks of different morphologies, since they are trained and verified by SDGs, with cracks propagating in all directions.
Another issue is about the computational resource. The GPUs used in our experiments are powerful and expensive, since efficiently training optimal models requires sufficient computational resources. However, applying a trained model in a practical application does not require a high-spec GPU, i.e., a CUDA-supported GPU of a relatively low cost can fully meet the computational requirement.
Considering the issues discussed above, in our future work, different fatiguing factors, such as the material, temperature, shape, load, etc., are expected to be investigated and applied in the experiment. The proposed method will be optimized and implemented for practical applications to inspect the practicality. Meanwhile, the network architecture will be improved to raise the precision and efficiency.

Author Contributions

Conceptualization, Z.W. and G.W.; methodology, Z.W. and B.L.; software, Z.W.; validation, Y.H. and W.Q.; formal analysis, G.W.; investigation, Z.W. and Y.H.; resources, Z.B.; data curation, Y.H. and B.L.; writing—original draft preparation, Z.W. and Y.H.; writing—review and editing, Z.W.; visualization, Z.W. and Y.H.; supervision, Z.W.; project administration, G.W.; funding acquisition, G.W. and Z.B. All authors have read and agreed to the published version of the manuscript.

Funding

This research was funded in part by the National Natural Science Foundation of China, grant number 51975418, in part by the Science Technology Department of Zhejiang Province, grant number 2021C01046, and in part by the Wenzhou Science and Technology Bureau, grant numbers ZG2020049 and G20210020.

Data Availability Statement

Not applicable.

Acknowledgments

We would like to thank the National Natural Science Foundation of China, the Zhejiang Provincial Natural Science Foundation, the Science Technology Department of Zhejiang Province, and the Wenzhou Science and Technology Bureau.

Conflicts of Interest

The authors declare no conflict of interest.

References

  1. Ji, B.; Qu, W. The Research of Acoustic Emission Techniques for Non Destructive Testing and Health Monitoring on Civil Engineering Structures. In Proceedings of the 2008 International Conference on Condition Monitoring and Diagnosis (CMD), Beijing, China, 21–24 April 2008. [Google Scholar]
  2. Jin, L.; Yang, Q.; Liu, S.; Zhang, C.; Li, P. Electromagnetic Stimulation of the Acoustic Emission for Fatigue Crack Detection of the Sheet Metal. IEEE Trans. Appl. Supercond. 2010, 20, 1848–1851. [Google Scholar] [CrossRef]
  3. Albishi, A.M.; Boybay, M.S.; Ramahi, O.M. Complementary Split-Ring Resonator for Crack Detection in Metallic Surfaces. IEEE Microw. Wirel. Compon. Lett. 2012, 22, 330–332. [Google Scholar] [CrossRef]
  4. Perez, N. Fracture Mechanics, 2nd ed.; Springer: Berlin/Heidelberg, Germany, 2016; ISBN 3319249975. [Google Scholar]
  5. ASTM E399; Standard Test Method for Linear-Elastic Plane-Strain Fracture Toughness K1C of Metallic Material. ASTM International: West Conshohocken, PA, USA, 2013.
  6. Albishi, A.M.; Ramahi, O.M. Microwaves-Based High Sensitivity Sensors for Crack Detection in Metallic Materials. IEEE Trans. Microw. Theory Tech. 2017, 65, 1864–1872. [Google Scholar] [CrossRef]
  7. Wang, Q.; Bi, K.; Hao, Y.; Guo, L.; Dong, G.; Wu, H.; Lei, M. High-Sensitivity Dielectric Resonator-Based Waveguide Sensor for Crack Detection on Metallic Surfaces. IEEE Sens. J. 2019, 19, 5470–5474. [Google Scholar] [CrossRef]
  8. Kralovec, C.; Schagerl, M. Review of Structural Health Monitoring Methods Regarding a Multi-Sensor Approach for Damage Assessment of Metal and Composite Structures. Sensors 2020, 20, 826. [Google Scholar] [CrossRef]
  9. Zhang, J.; Tian, G.Y.; Zhao, A.B. Passive RFID Sensor Systems for Crack Detection & Characterization. NDT E Int. 2017, 86, 89–99. [Google Scholar] [CrossRef]
  10. Sutton, M.A.; Orteu, J.J.; Schreier, H.W. Image Correlation for Shape, Motion and Deformation Measurements: Basic Concepts, Theory and Applications; Springer: Berlin/Heidelberg, Germany, 2009; ISBN 9788578110796. [Google Scholar]
  11. He, K.; Zhang, X.; Ren, S.; Sun, J. Deep Residual Learning for Image Recognition. In Proceedings of the 2016 IEEE Conference on Computer Vision and Pattern Recognition (CVPR), Las Vegas, NV, USA, 27–30 June 2016; pp. 770–778. [Google Scholar]
  12. LeCun, Y.; Bottou, L.; Bengio, Y.; Haffner, P. Gradient-Based Learning Applied to Document Recognition. Proc. IEEE 1998, 86, 2278–2323. [Google Scholar] [CrossRef]
  13. Chady, T.; Enokizono, M.; Sikora, R. Crack Detection and Recognition Using an Eddy Current Differential Probe. IEEE Trans. Magn. 1999, 35, 1849–1852. [Google Scholar] [CrossRef]
  14. Shan, Q.; Dewhurst, R.J. Surface-Breaking Fatigue Crack Detection Using Laser Ultrasound. Appl. Phys. Lett. 1993, 62, 2649–2651. [Google Scholar] [CrossRef]
  15. Reber, K.; Beller, M.; Willems, H.; Barbian, O.A. A New Generation of Ultrasonic In-Line Inspection Tools for Detecting, Sizing and Locating Metal Loss and Cracks in Transmission Pipelines. In Proceedings of the 2002 IEEE Ultrasonics Symposium, Munich, Germany, 8–11 October 2002; Volume 1, pp. 665–671. [Google Scholar]
  16. Liu, P.; Jang, J.; Yang, S.; Sohn, H. Fatigue Crack Detection Using Dual Laser Induced Nonlinear Ultrasonic Modulation. Opt. Lasers Eng. 2018, 110, 420–430. [Google Scholar] [CrossRef]
  17. Zima, B.; Kędra, R. Detection and Size Estimation of Crack in Plate Based on Guided Wave Propagation. Mech. Syst. Signal Process. 2020, 142, 106788. [Google Scholar] [CrossRef]
  18. Kim, S.B.; Sohn, H. Instantaneous Reference-Free Crack Detection Based on Polarization Characteristics of Piezoelectric Materials. Smart Mater. Struct. 2007, 16, 2375–2387. [Google Scholar] [CrossRef]
  19. Broberg, P. Surface Crack Detection in Welds Using Thermography. NDT E Int. 2013, 57, 69–73. [Google Scholar] [CrossRef]
  20. Cao, J.; Li, F.; Ma, X.; Sun, Z. Study of Anisotropic Crack Growth Behavior for Aluminum Alloy 7050-T7451. Eng. Fract. Mech. 2018, 196, 98–112. [Google Scholar] [CrossRef]
  21. Farahani, B.; Belinha, J.; Amaral, R.; Tavares, P.J.; Moreira, P. A Digital Image Correlation Analysis on a Sheet AA6061-T6 Bi-Failure Specimen to Predict Static Failure. Eng. Fail. Anal. 2018, 90, 179–196. [Google Scholar] [CrossRef]
  22. Shrestha, S.; Kannan, M.; Morscher, G.N.; Presby, M.J.; Mostafa Razavi, S. In-Situ Fatigue Life Analysis by Modal Acoustic Emission, Direct Current Potential Drop and Digital Image Correlation for Steel. Int. J. Fatigue 2021, 142, 105924. [Google Scholar] [CrossRef]
  23. Chen, Y.; Ji, C.; Zhang, C.; Wang, F.; Song, X. Analysis for Post-Impact Tensile-Tensile Fatigue Damage of 2024-T3 Sheets Based on Tests, Digital Image Correlation (DIC) Technique and Finite Element Simulation. Int. J. Fatigue 2019, 122, 125–140. [Google Scholar] [CrossRef]
  24. Mohan, A.; Poobal, S. Crack Detection Using Image Processing: A Critical Review and Analysis. Alex. Eng. J. 2018, 57, 787–798. [Google Scholar] [CrossRef]
  25. Stewart, C.M.; Garcia, E. Fatigue Crack Growth of a Hot Mix Asphalt Using Digital Image Correlation. Int. J. Fatigue 2019, 120, 254–266. [Google Scholar] [CrossRef]
  26. Gao, Z.; Cecati, C.; Ding, S.X. A Survey of Fault Diagnosis and Fault-Tolerant Techniques-Part II: Fault Diagnosis with Knowledge-Based and Hybrid/Active Approaches. IEEE Trans. Ind. Electron. 2015, 62, 3768–3774. [Google Scholar] [CrossRef]
  27. Gao, Z.; Cecati, C.; Ding, S.X. A Survey of Fault Diagnosis and Fault-Tolerant Techniques-Part I: Fault Diagnosis with Model-Based and Signal-Based Approaches. IEEE Trans. Ind. Electron. 2015, 62, 3757–3767. [Google Scholar] [CrossRef]
  28. Zhang, Y.; Bingham, C.M.; Gallimore, M. Fault Detection and Diagnosis Based on Extensions of PCA. Adv. Mil. Technol. 2013, 8, 27–41. [Google Scholar]
  29. Kamble, R.G.; Raykar, N.R.; Jadhav, D.N. Machine Learning Approach to Predict Fatigue Crack Growth. Mater. Today Proc. 2021, 38, 2506–2511. [Google Scholar] [CrossRef]
  30. Ye, F.; Zhang, Z.; Chakrabarty, K.; Gu, X. Board-Level Functional Fault Diagnosis Using Multikernel Support Vector Machines and Incremental Learning. IEEE Trans. Comput. Aided Des. Integr. Circuits Syst. 2014, 33, 279–290. [Google Scholar] [CrossRef]
  31. Wu, Z.; Wu, G.; Chen, C.; Fang, Y.; Pan, L.; Huang, H. A Novel Breaking Strategy for Electrical Endurance Extension of Electromagnetic Alternating Current Contactors. IEEE Trans. Compon. Packag. Manuf. Technol. 2016, 6, 749–756. [Google Scholar] [CrossRef]
  32. Wang, X.; Zhang, Y. The Detection and Recognition of Bridges’ Cracks Based on Deep Belief Network. In Proceedings of the 2017 IEEE International Conference on Computational Science and Engineering (CSE) and IEEE International Conference on Embedded and Ubiquitous Computing (EUC), Guangzhou, China, 21–24 July 2017; pp. 768–771. [Google Scholar] [CrossRef]
  33. Zeng, X.; Liao, Y.; Li, W. Gearbox Fault Classification Using S-Transform and Convolutional Neural Network. In Proceedings of the International Conference on Sensing Technology (ICST), Nanjing, China, 11–13 November 2016; pp. 615–619. [Google Scholar]
  34. Wen, L.; Li, X.; Gao, L.; Zhang, Y. A New Convolutional Neural Network Based Data-Driven Fault Diagnosis Method. IEEE Trans. Ind. Electron. 2017, 65, 5990–5998. [Google Scholar] [CrossRef]
  35. Chen, F.-C.; Jahanshahi, M.R.; Wu, R.-T.; Joffe, C. A Texture-Based Video Processing Methodology Using Bayesian Data Fusion for Autonomous Crack Detection on Metallic Surfaces. Comput. Aided Civ. Infrastruct. Eng. 2017, 32, 271–287. [Google Scholar] [CrossRef]
  36. Chen, F.-C.; Jahanshahi, M.R. NB-CNN: Deep Learning-Based Crack Detection Using Convolutional Neural Network and Naïve Bayes Data Fusion. IEEE Trans. Ind. Electron. 2018, 65, 4392–4400. [Google Scholar] [CrossRef]
  37. Hu, J.; Xu, W.; Gao, B.; Tian, G.Y.; Wang, Y.; Wu, Y.; Yin, Y.; Chen, J. Pattern Deep Region Learning for Crack Detection in Thermography Diagnosis System. Metals 2018, 8, 612. [Google Scholar] [CrossRef]
  38. Yuan, Y.; Ge, Z.; Su, X.; Guo, X.; Suo, T.; Liu, Y.; Yu, Q. Crack Length Measurement Using Convolutional Neural Networks and Image Processing. Sensors 2021, 21, 5894. [Google Scholar] [CrossRef]
  39. ASTM E647-15e1; Standard Test Method for Measurement of Fatigue Crack Growth Rates. ASTM International: West Conshohocken, PA, USA, 2015.
  40. Griffith, A.A. The Phenomena of Rupture and Flow in Solids. Philos. Trans. R. Soc. Math. Phys. Eng. Sci. 1921, 221, 163–198. [Google Scholar] [CrossRef]
  41. Shou, Z.; Wang, D.; Chang, S.-F. Temporal Action Localization in Untrimmed Videos via Multi-Stage CNNs. In Proceedings of the IEEE Conference on Computer Vision and Pattern Recognition, Las Vegas, NV, USA, 27–30 June 2016. [Google Scholar]
  42. Ji, S.; Xu, W.; Yang, M.; Yu, K. 3D Convolutional Neural Networks for Human Action Recognition. IEEE Trans. Pattern Anal. Mach. Intell. 2013, 35, 221–231. [Google Scholar] [CrossRef] [PubMed]
  43. Abadi, M.; Agarwal, A.; Barham, P.; Brevdo, E.; Chen, Z.; Citro, C.; Corrado, G.S.; Davis, A.; Dean, J.; Devin, M.; et al. TensorFlow: Large-Scale Machine Learning on Heterogeneous Systems. arXiv 2015, arXiv:1603.04467. [Google Scholar]
  44. Vingelmann, P.; Fitzek, F.H.P. CUDA, Release: 10.2.89; NVIDIA: Santa Clara, CA, USA, 2020; Available online: https://developer.nvidia.com/cuda-toolkit (accessed on 17 July 2022).
Figure 1. Tested specimen: (a) design (unit: in); (b) applying tensile.
Processes 10 01599 g001
Figure 2. The equivalent elastic strain of a specimen under different tensile displacements: (a) 500 mm; (b) 700 mm; (c) 1500 mm; (d) 2000 mm; (e) strain scale.
Processes 10 01599 g002
Figure 3. Strategies that form the SDGs to example features: (a) SDGs with the maximum load of cycles; (b) SDG sequences of load cycles.
Processes 10 01599 g003
Figure 4. ResNet-18 architecture: (a) overview; (b) “up block”; (c) “down block”.
Processes 10 01599 g004
Figure 5. Original specimen (left) and speckled specimen (right).
Processes 10 01599 g005
Figure 6. Clevises (left) and pins (right).
Processes 10 01599 g006
Figure 7. Testing system.
Processes 10 01599 g007
Figure 8. Strain distribution AOI.
Processes 10 01599 g008
Figure 9. Failed specimen.
Processes 10 01599 g009
Figure 10. Strain distribution with crack growth of specimen 3; first row: original images acquired by the DIC system, second row: major Hencky strain distribution graphs. (a) No crack; (b) 1 mm, after precracking; (c) 1.5 mm, 4000 cycles; (d) 2 mm, 5000 cycles; (e) 3 mm, 6000 cycles; (f) 5.7 mm, 6740 cycles; (g) strain scale.
Processes 10 01599 g010
Figure 11. Rotated SDGs.
Processes 10 01599 g011
Figure 12. Training processes: (a) Strategy 1; (b) Strategy 2.
Processes 10 01599 g012
Figure 13. Errors of test examples of our result: (a) absolute errors; (b) relative errors.
Processes 10 01599 g013
Table 1. Results of fatigue test.
SpecimenPrecracking Cycle CountFatiguing Cycle CountCrack Length before Failure
1193011,8216.7
2175075806.4
3182075676.5
4194064976.2
5141055206.0
Table 2. Comparison between LeNet-5 and ResNet-18.
NetworkTest MAE (mm)Estimation Time per Example (μs)
Strategy 1Strategy 2Strategy 1Strategy 2
ResNet-180.00890.007793187
LeNet-50.01540.019570178
Publisher’s Note: MDPI stays neutral with regard to jurisdictional claims in published maps and institutional affiliations.

