
Effects of S and Mineral Elements (Ca, Al, Si and Fe) on Thermochemical Behaviors of Zn during Co-Pyrolysis of Coal and Waste Tire: A Combined Experimental and Thermodynamic Simulation Study

Abstract
:1. Introduction
2. Materials and Methods
2.1. Materials
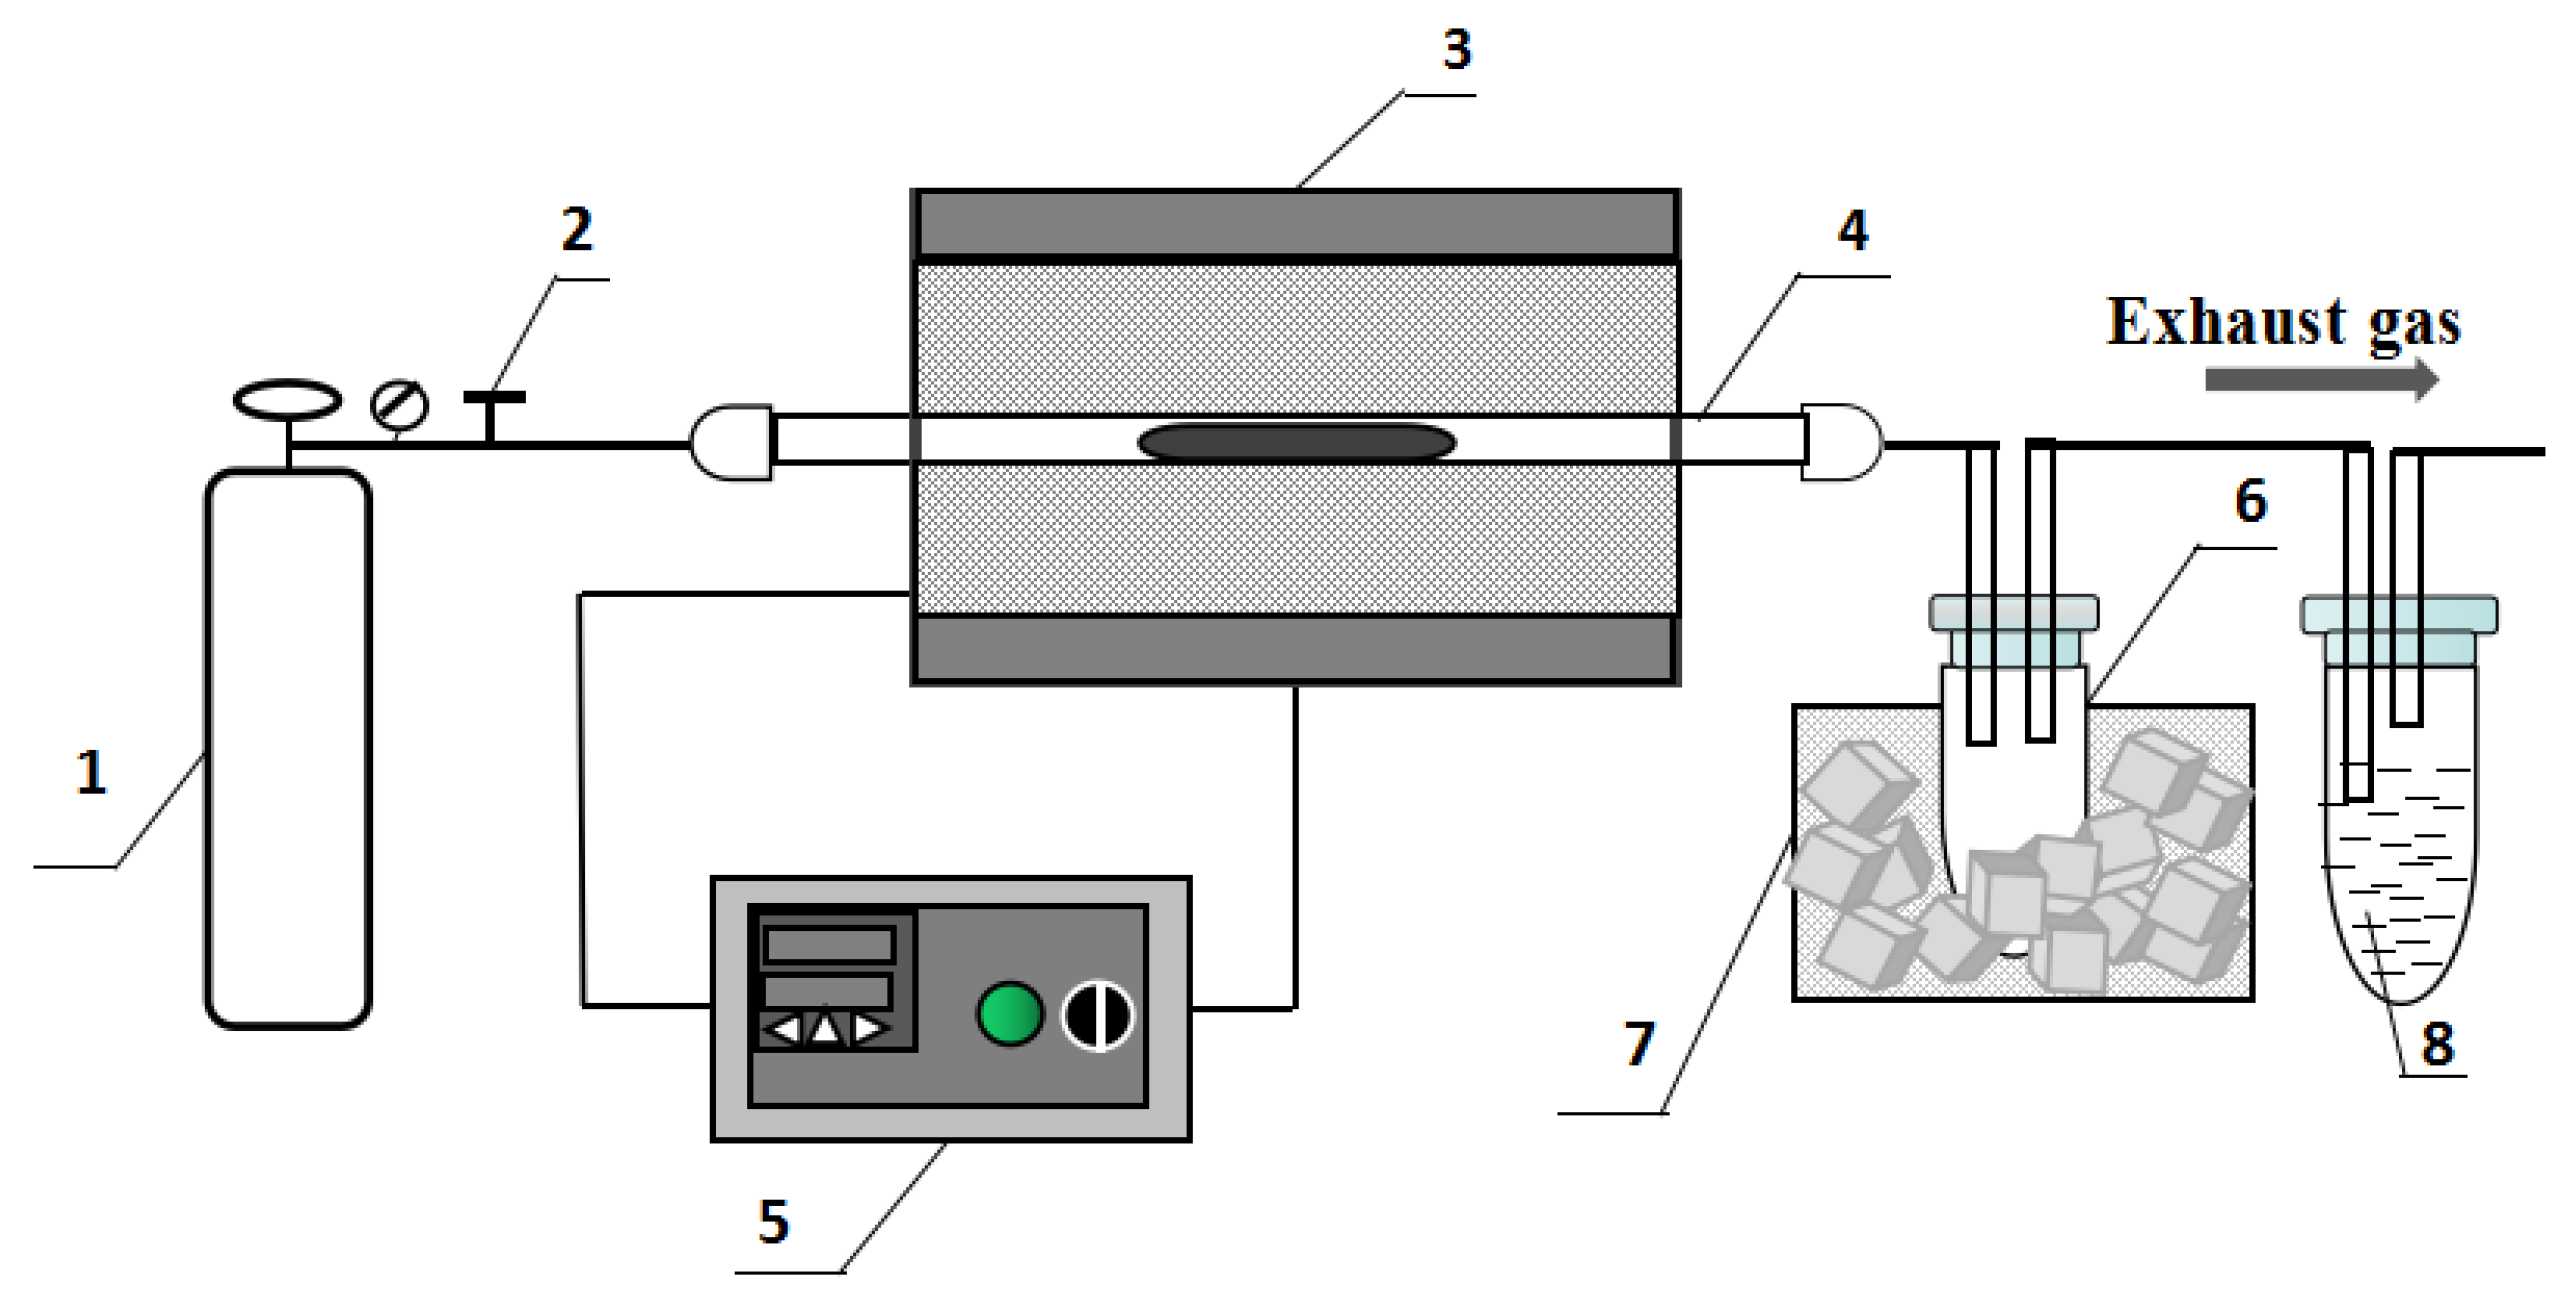
2.2. Experimental
2.3. Materials Characterization
2.4. Thermodynamic Equilibrium Simulation
3. Results and Discussion
3.1. Phase Compositions of Coal and Tire Wastes
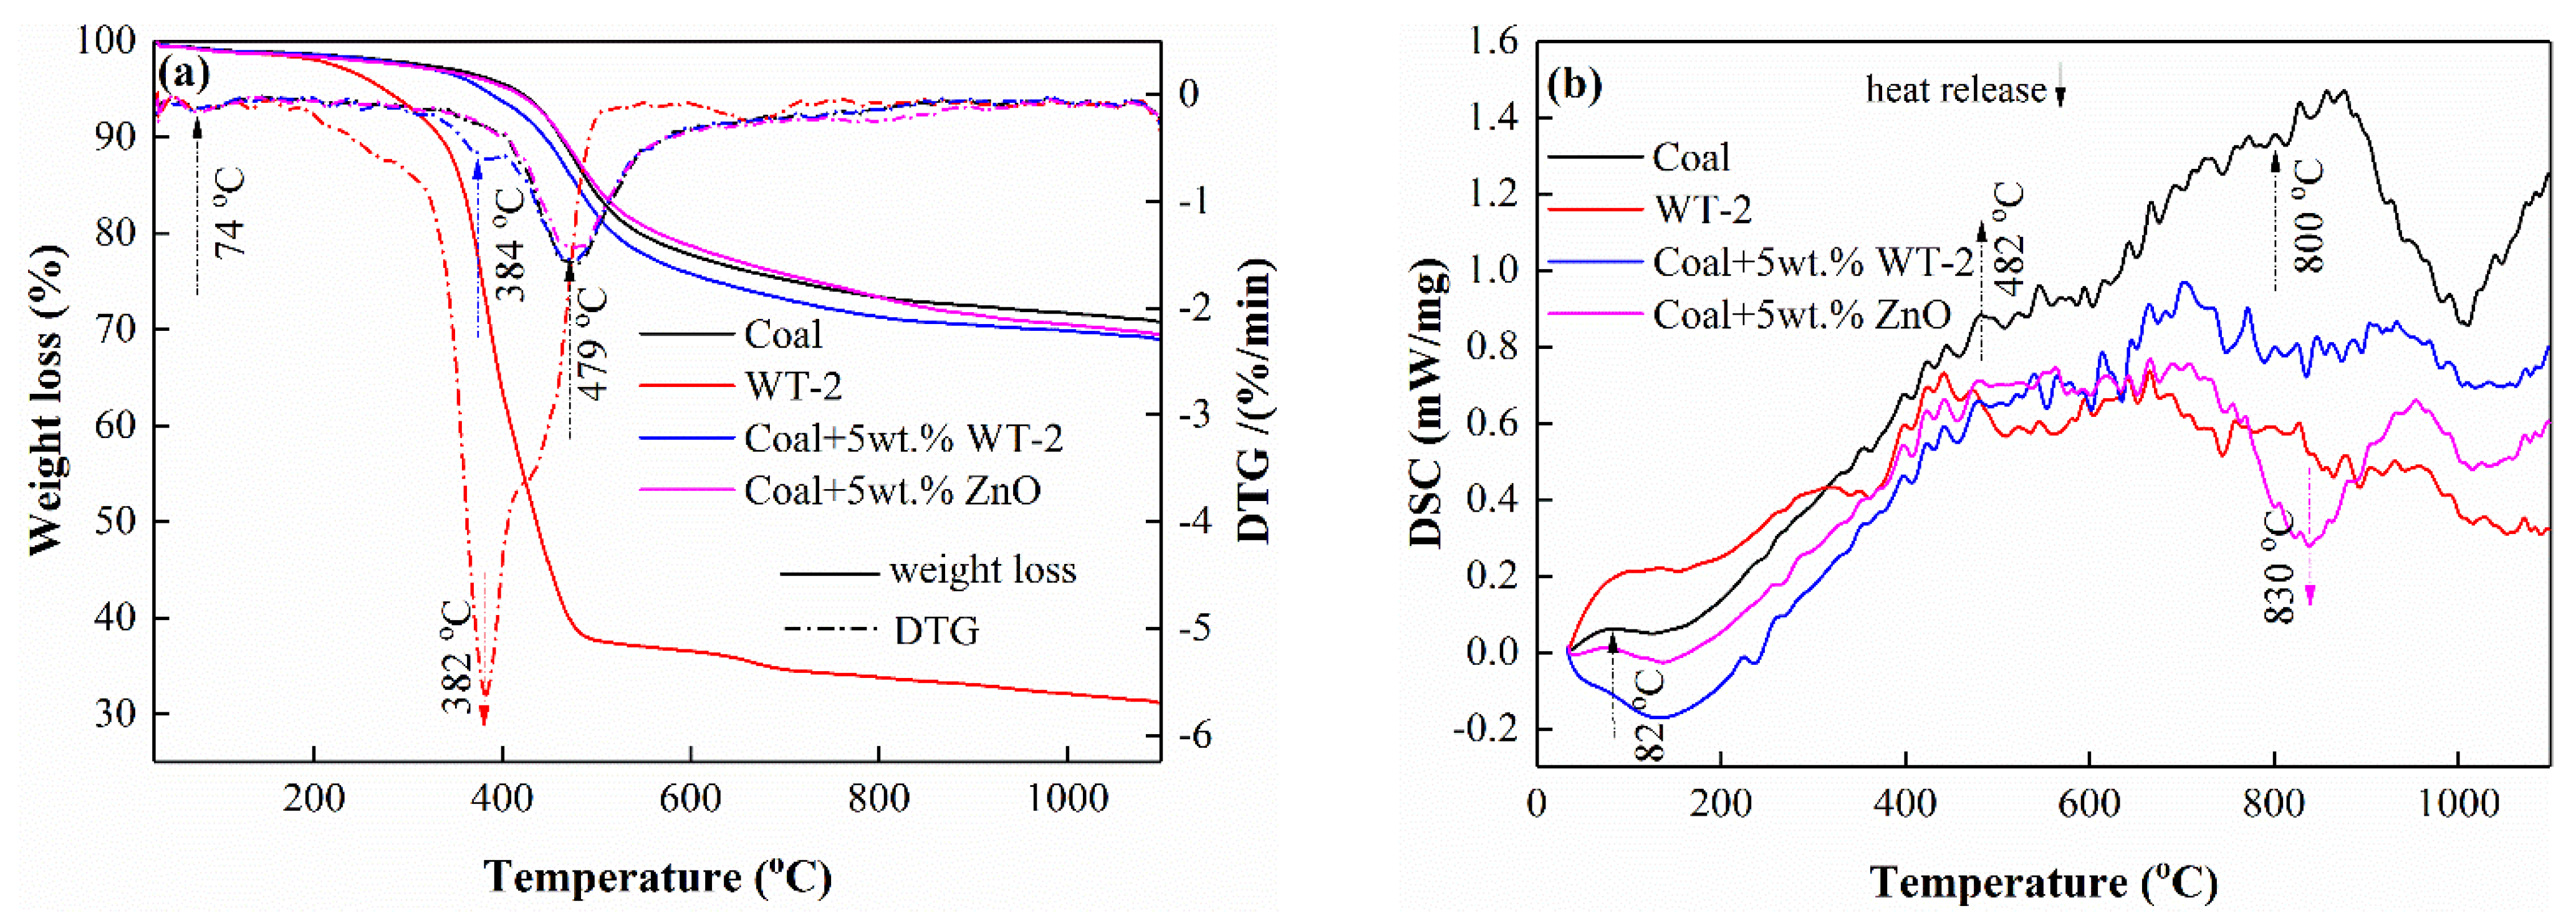
3.2. TG-DSC Analysis
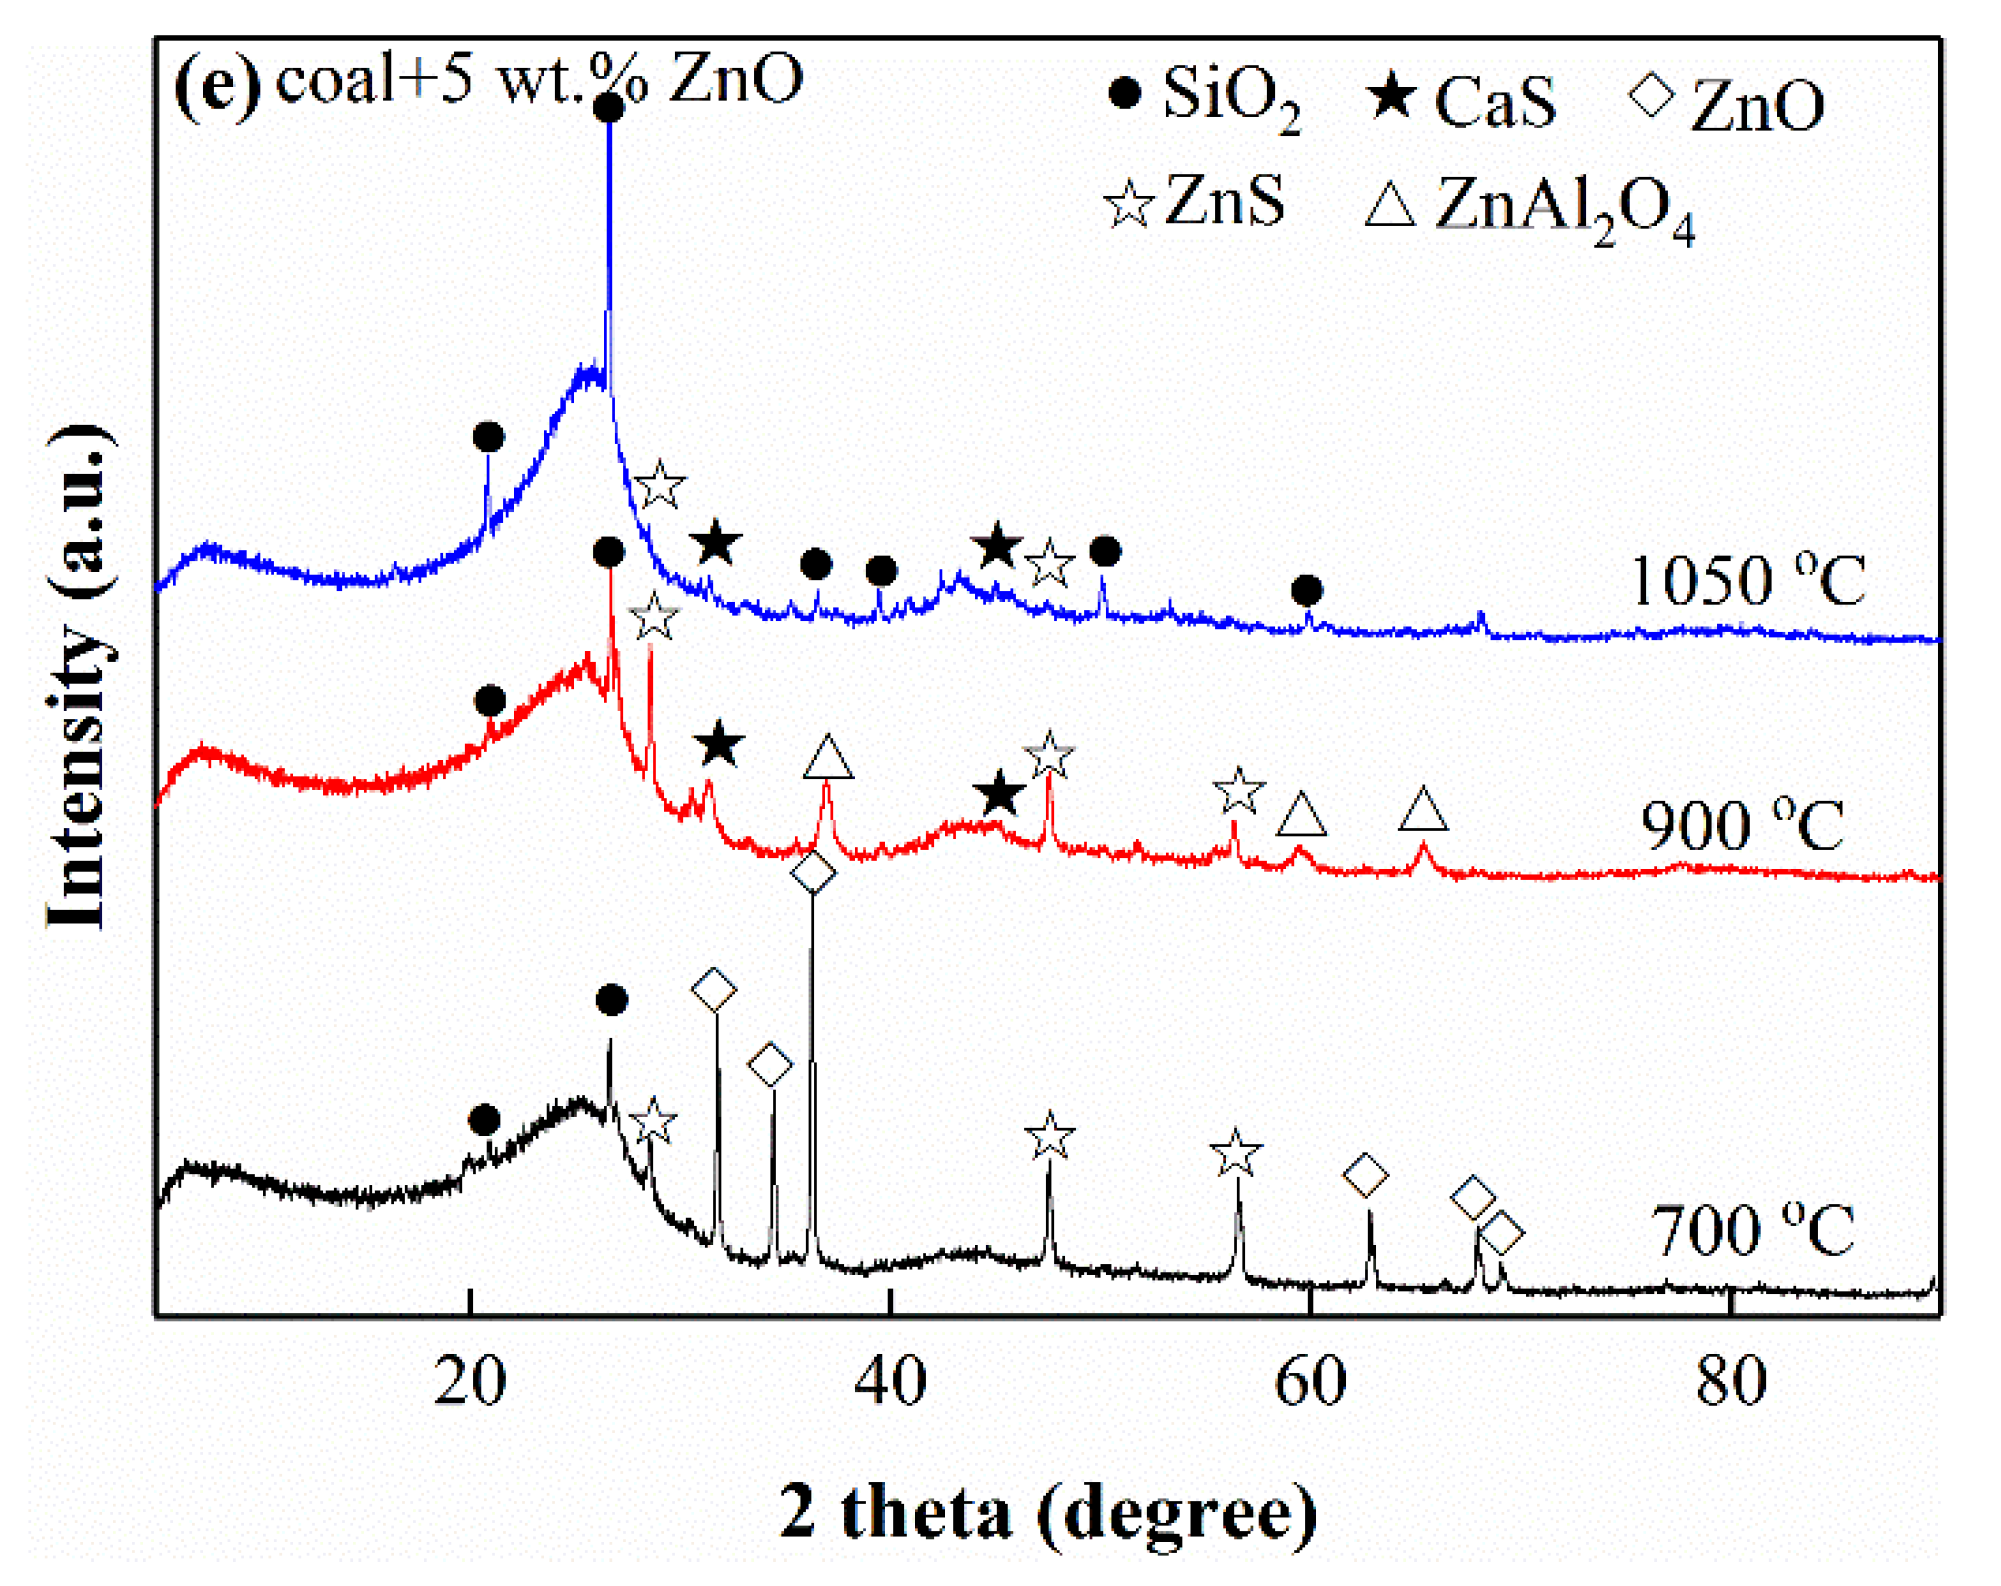
3.3. Phase Compositions of Cokes
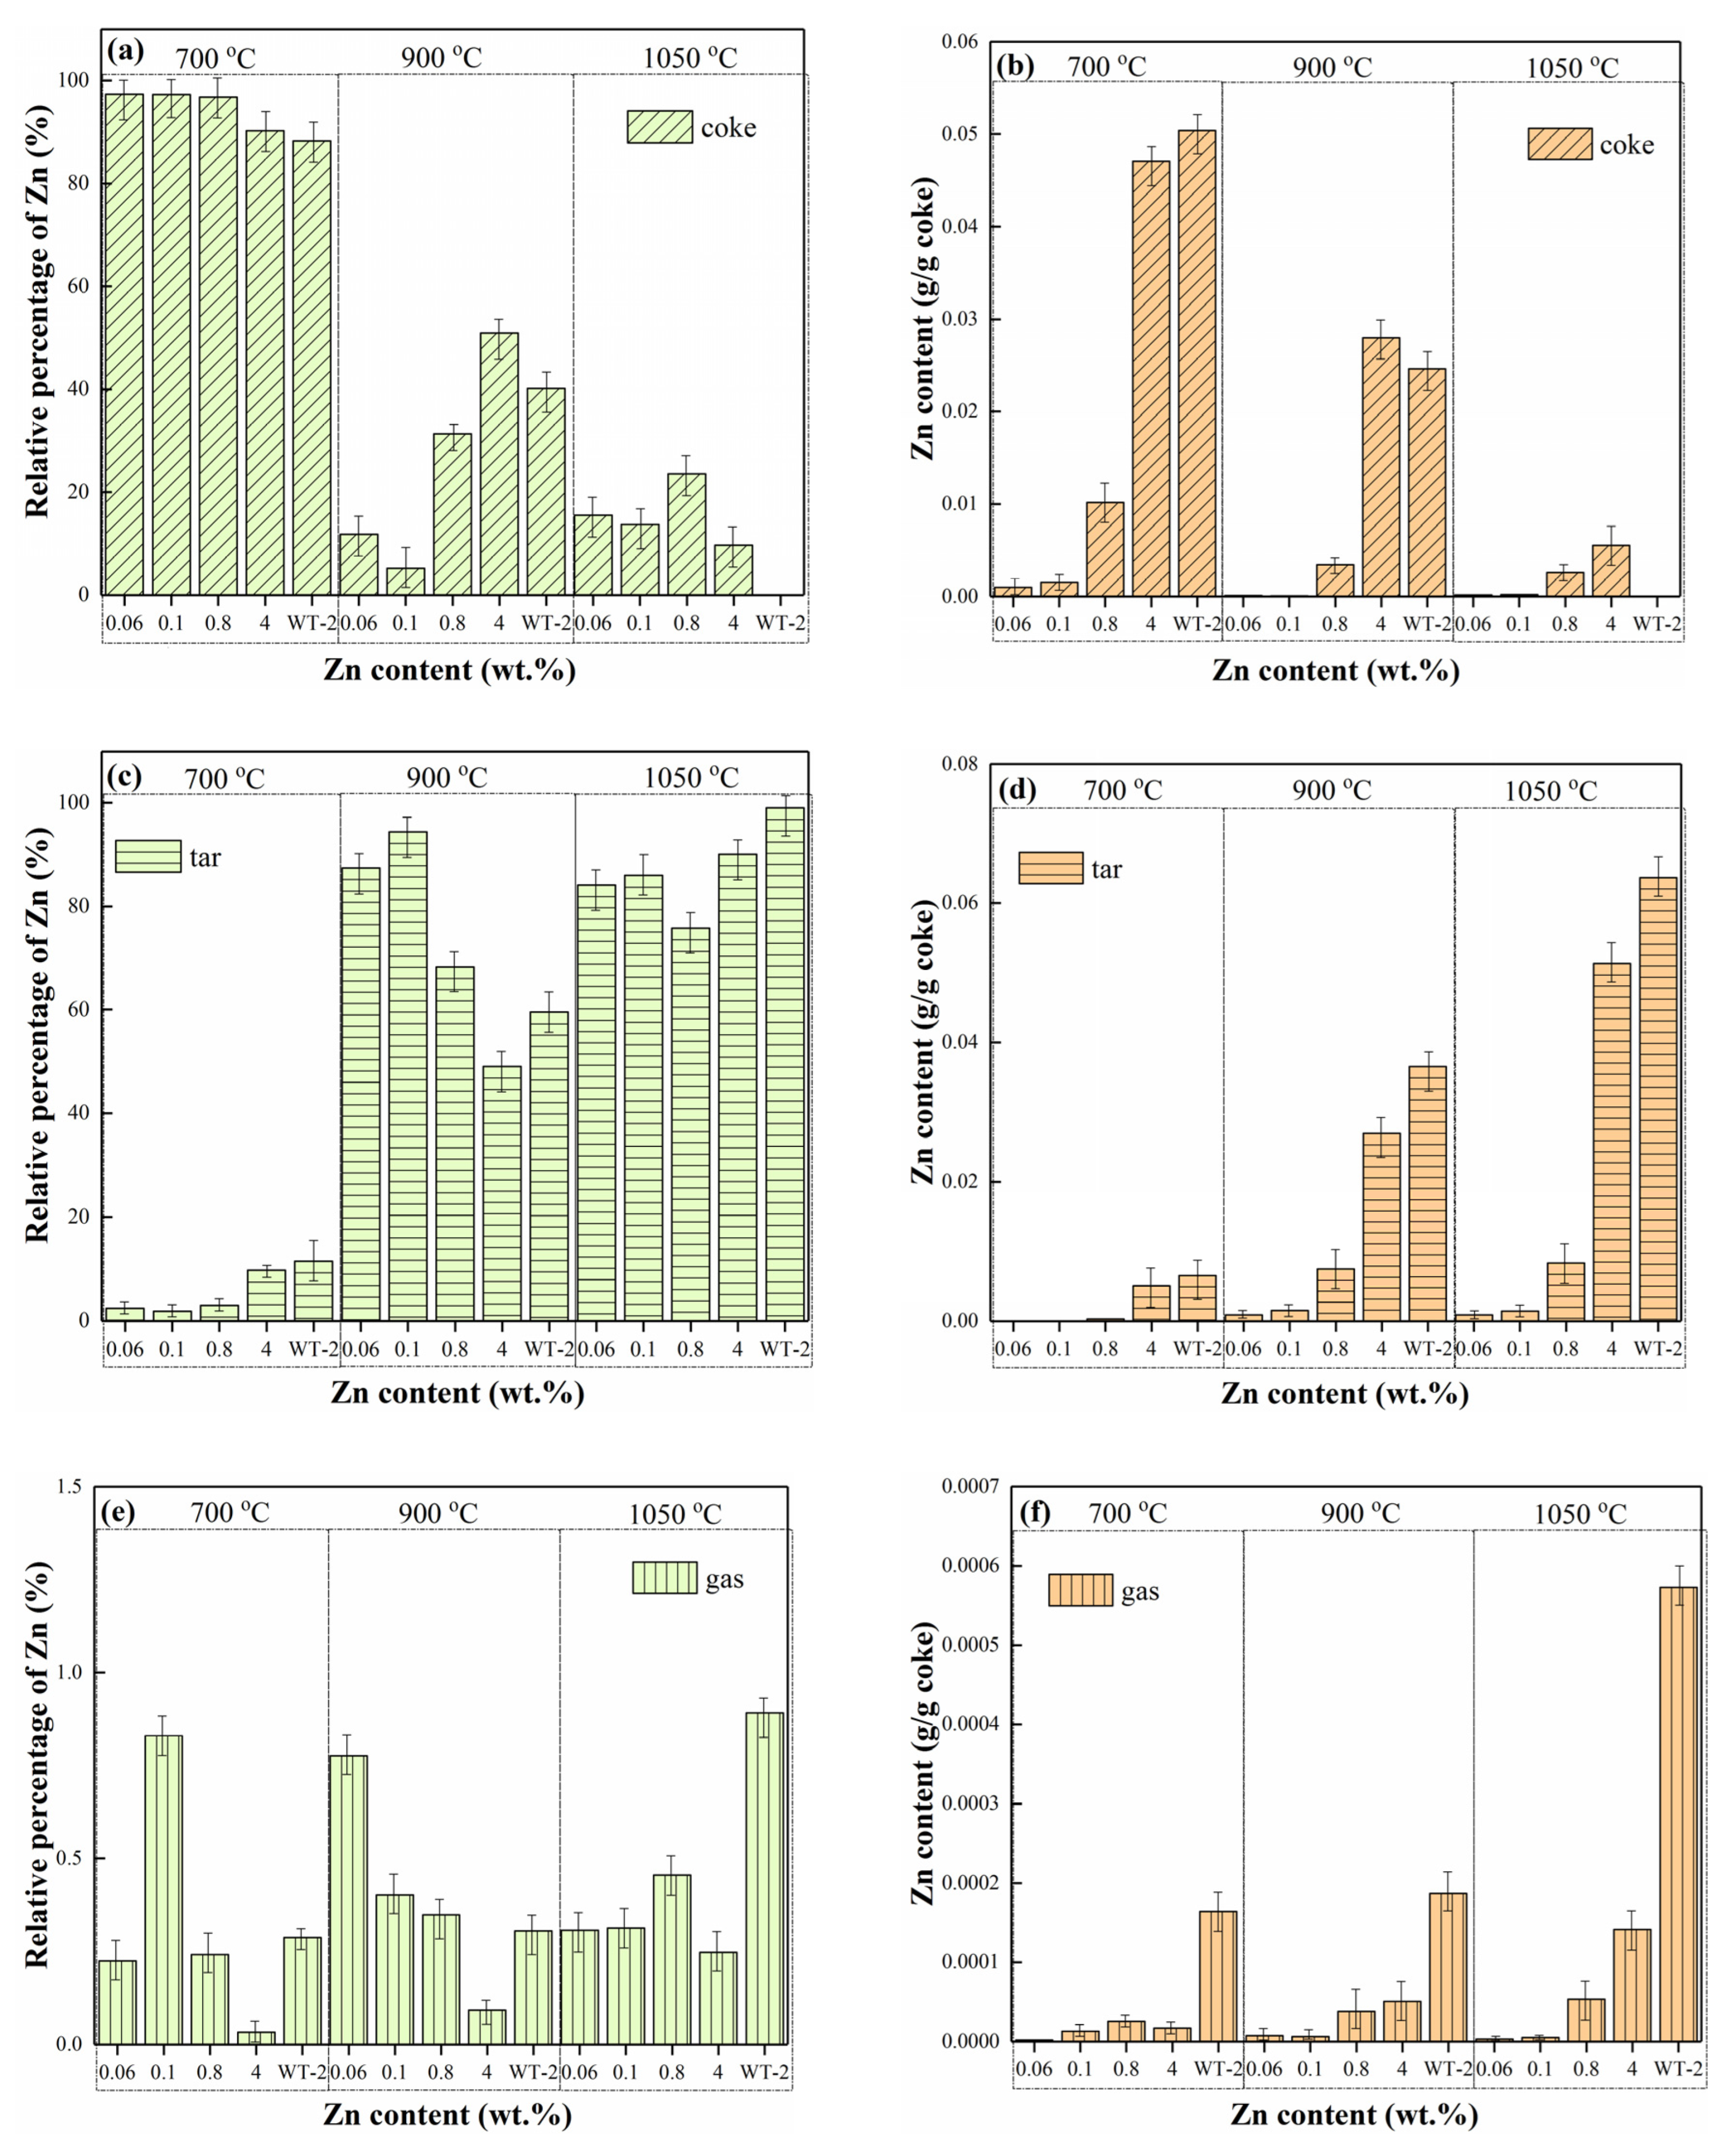
3.4. Migration of Zn during Pyrolysis
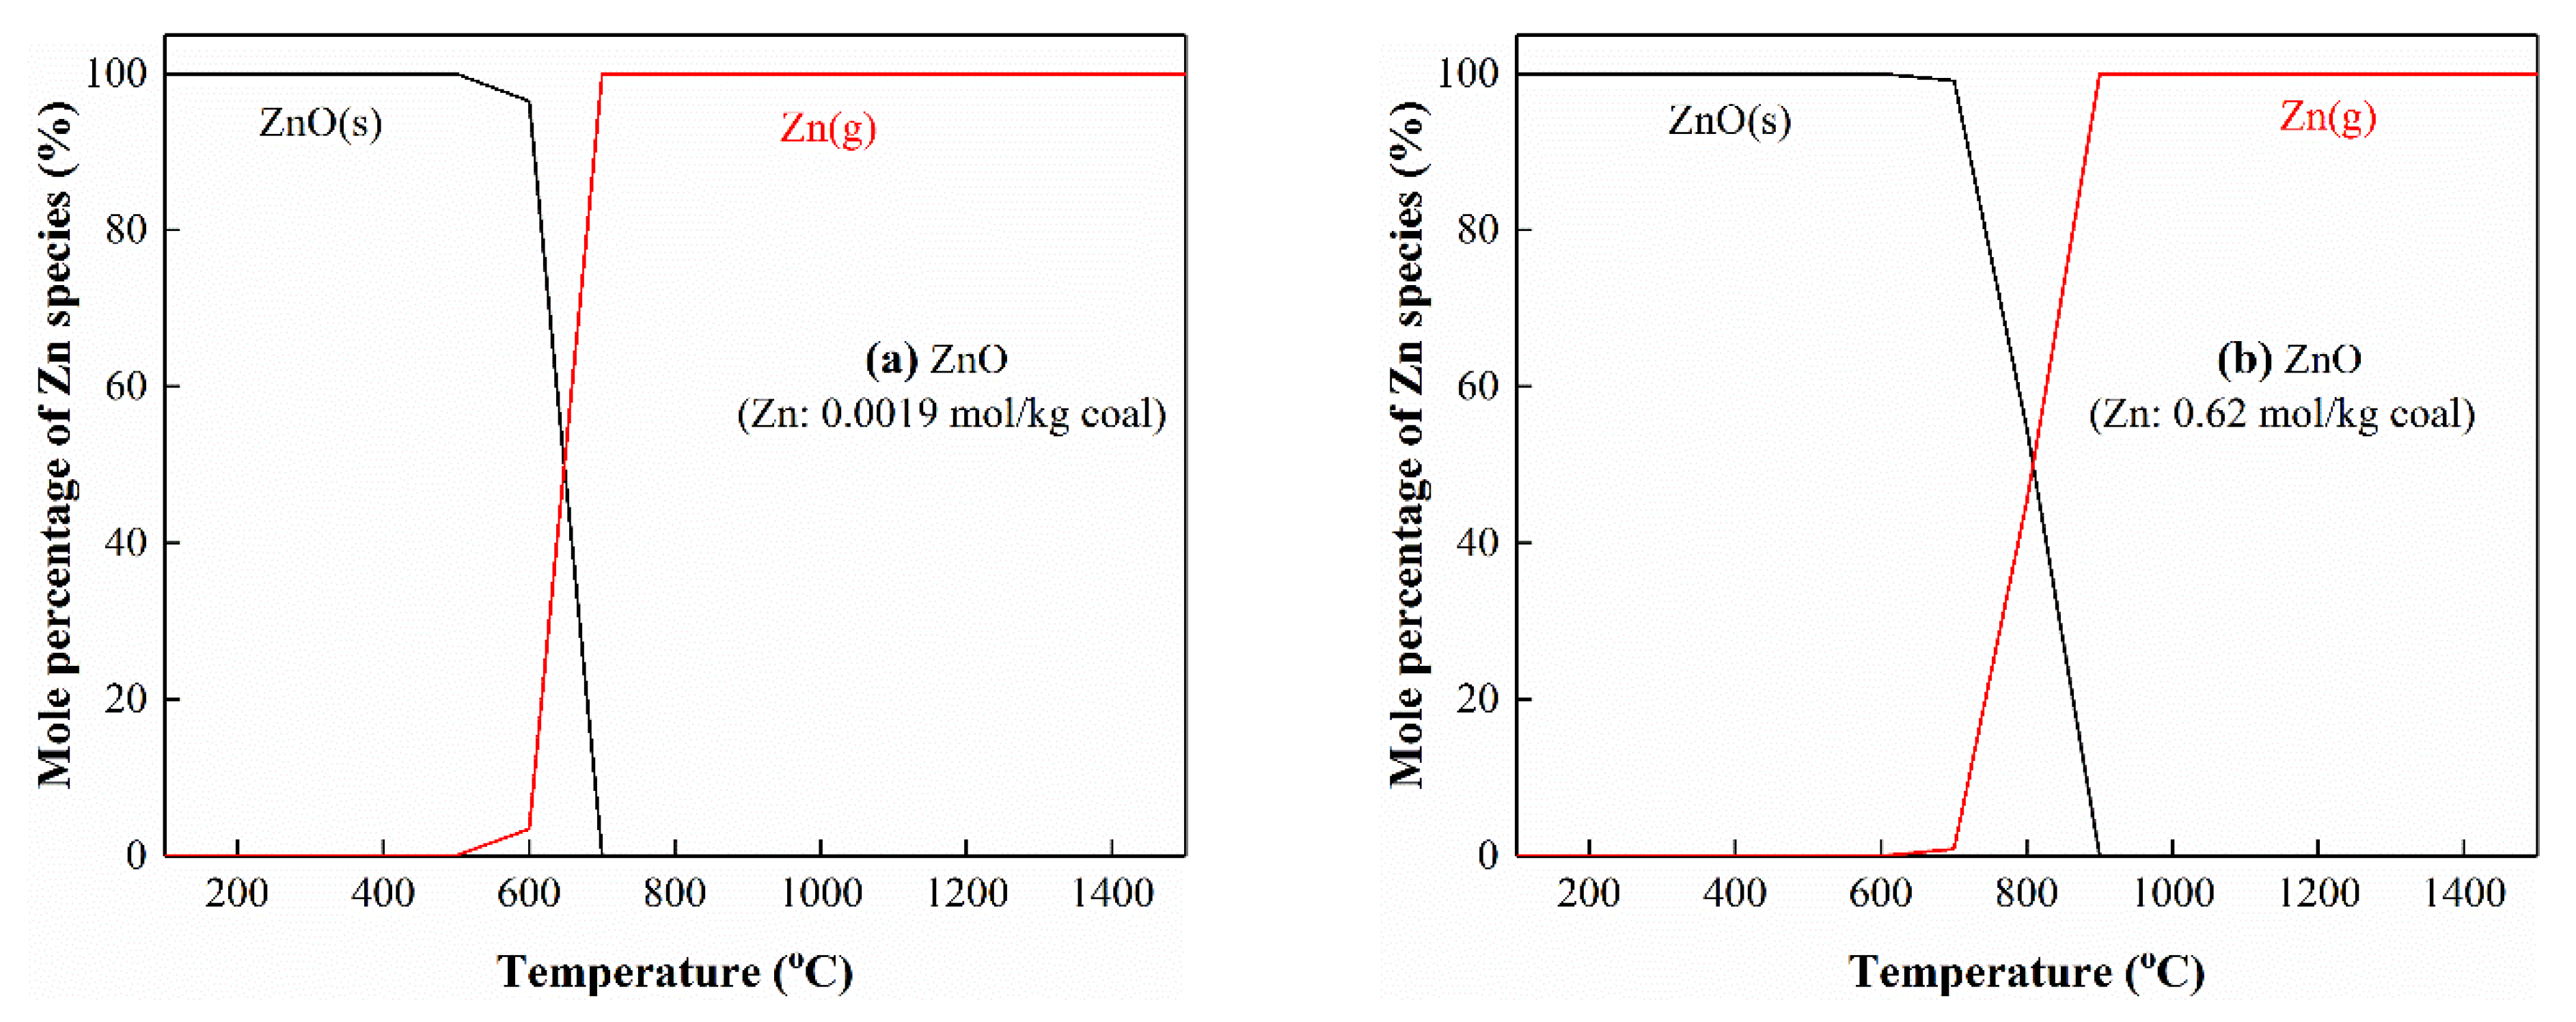
3.5. Thermodynamic Equilibrium Analysis
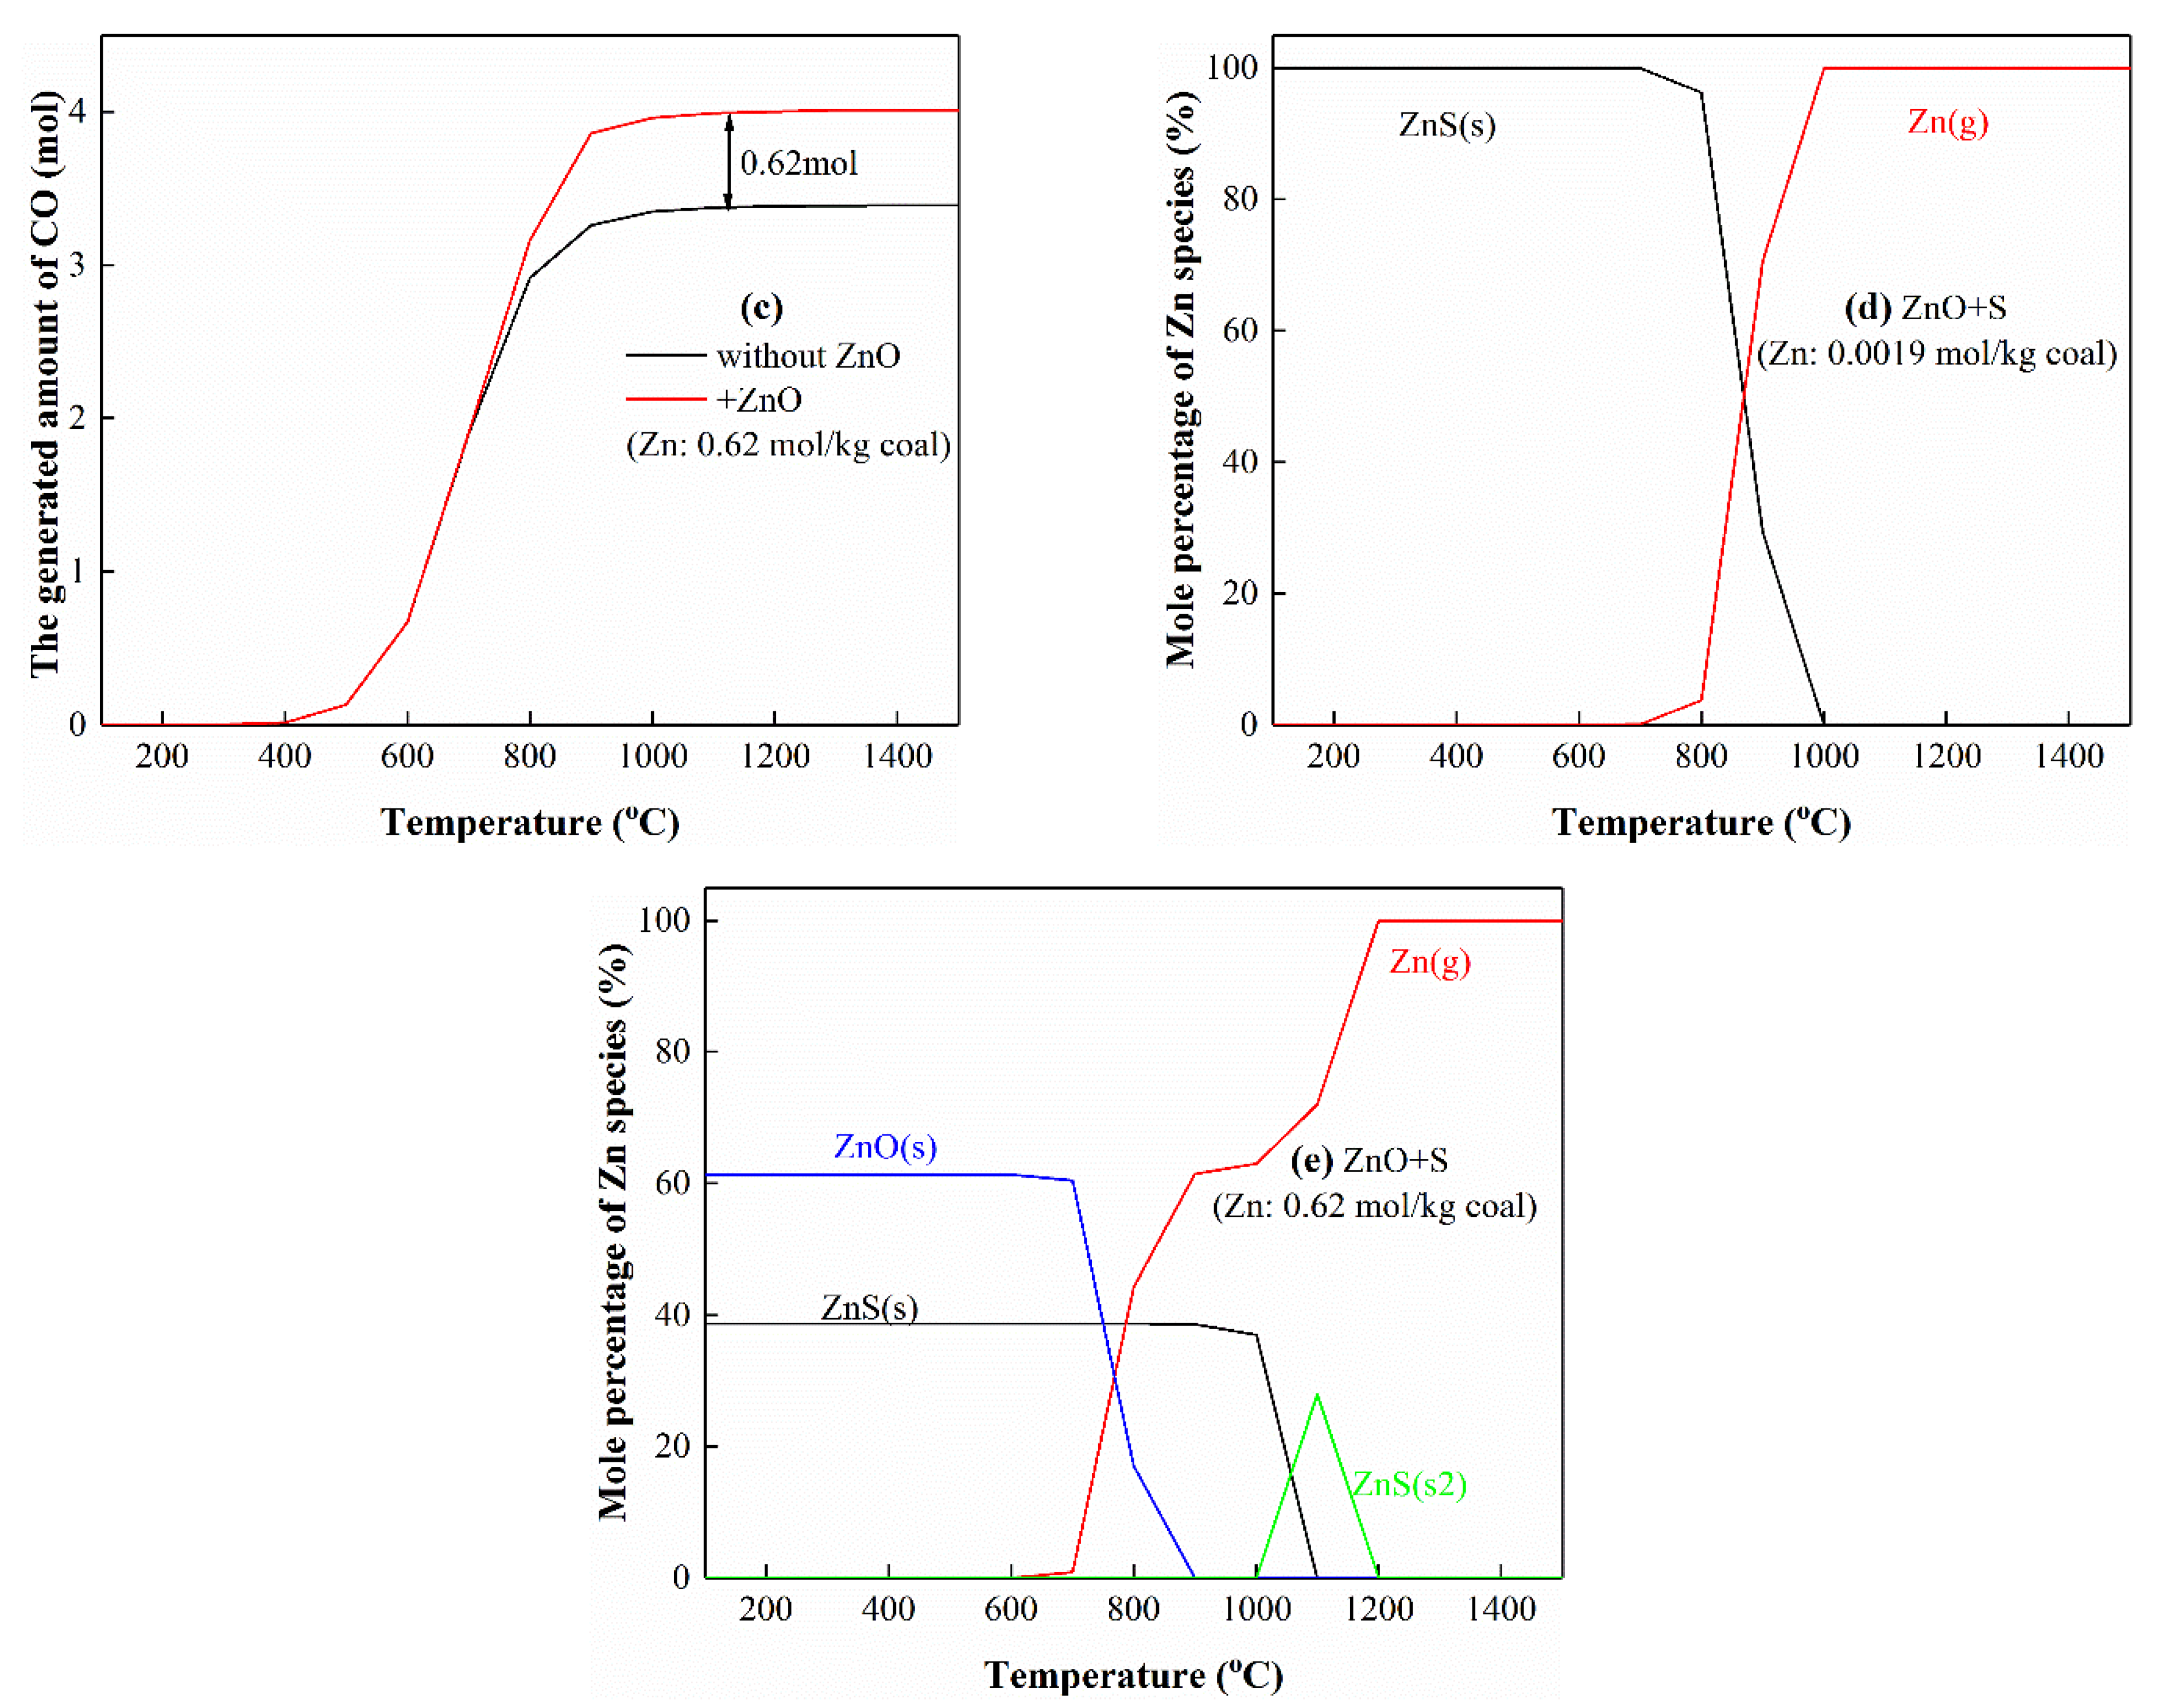
3.5.1. The Interactions of Zn with S
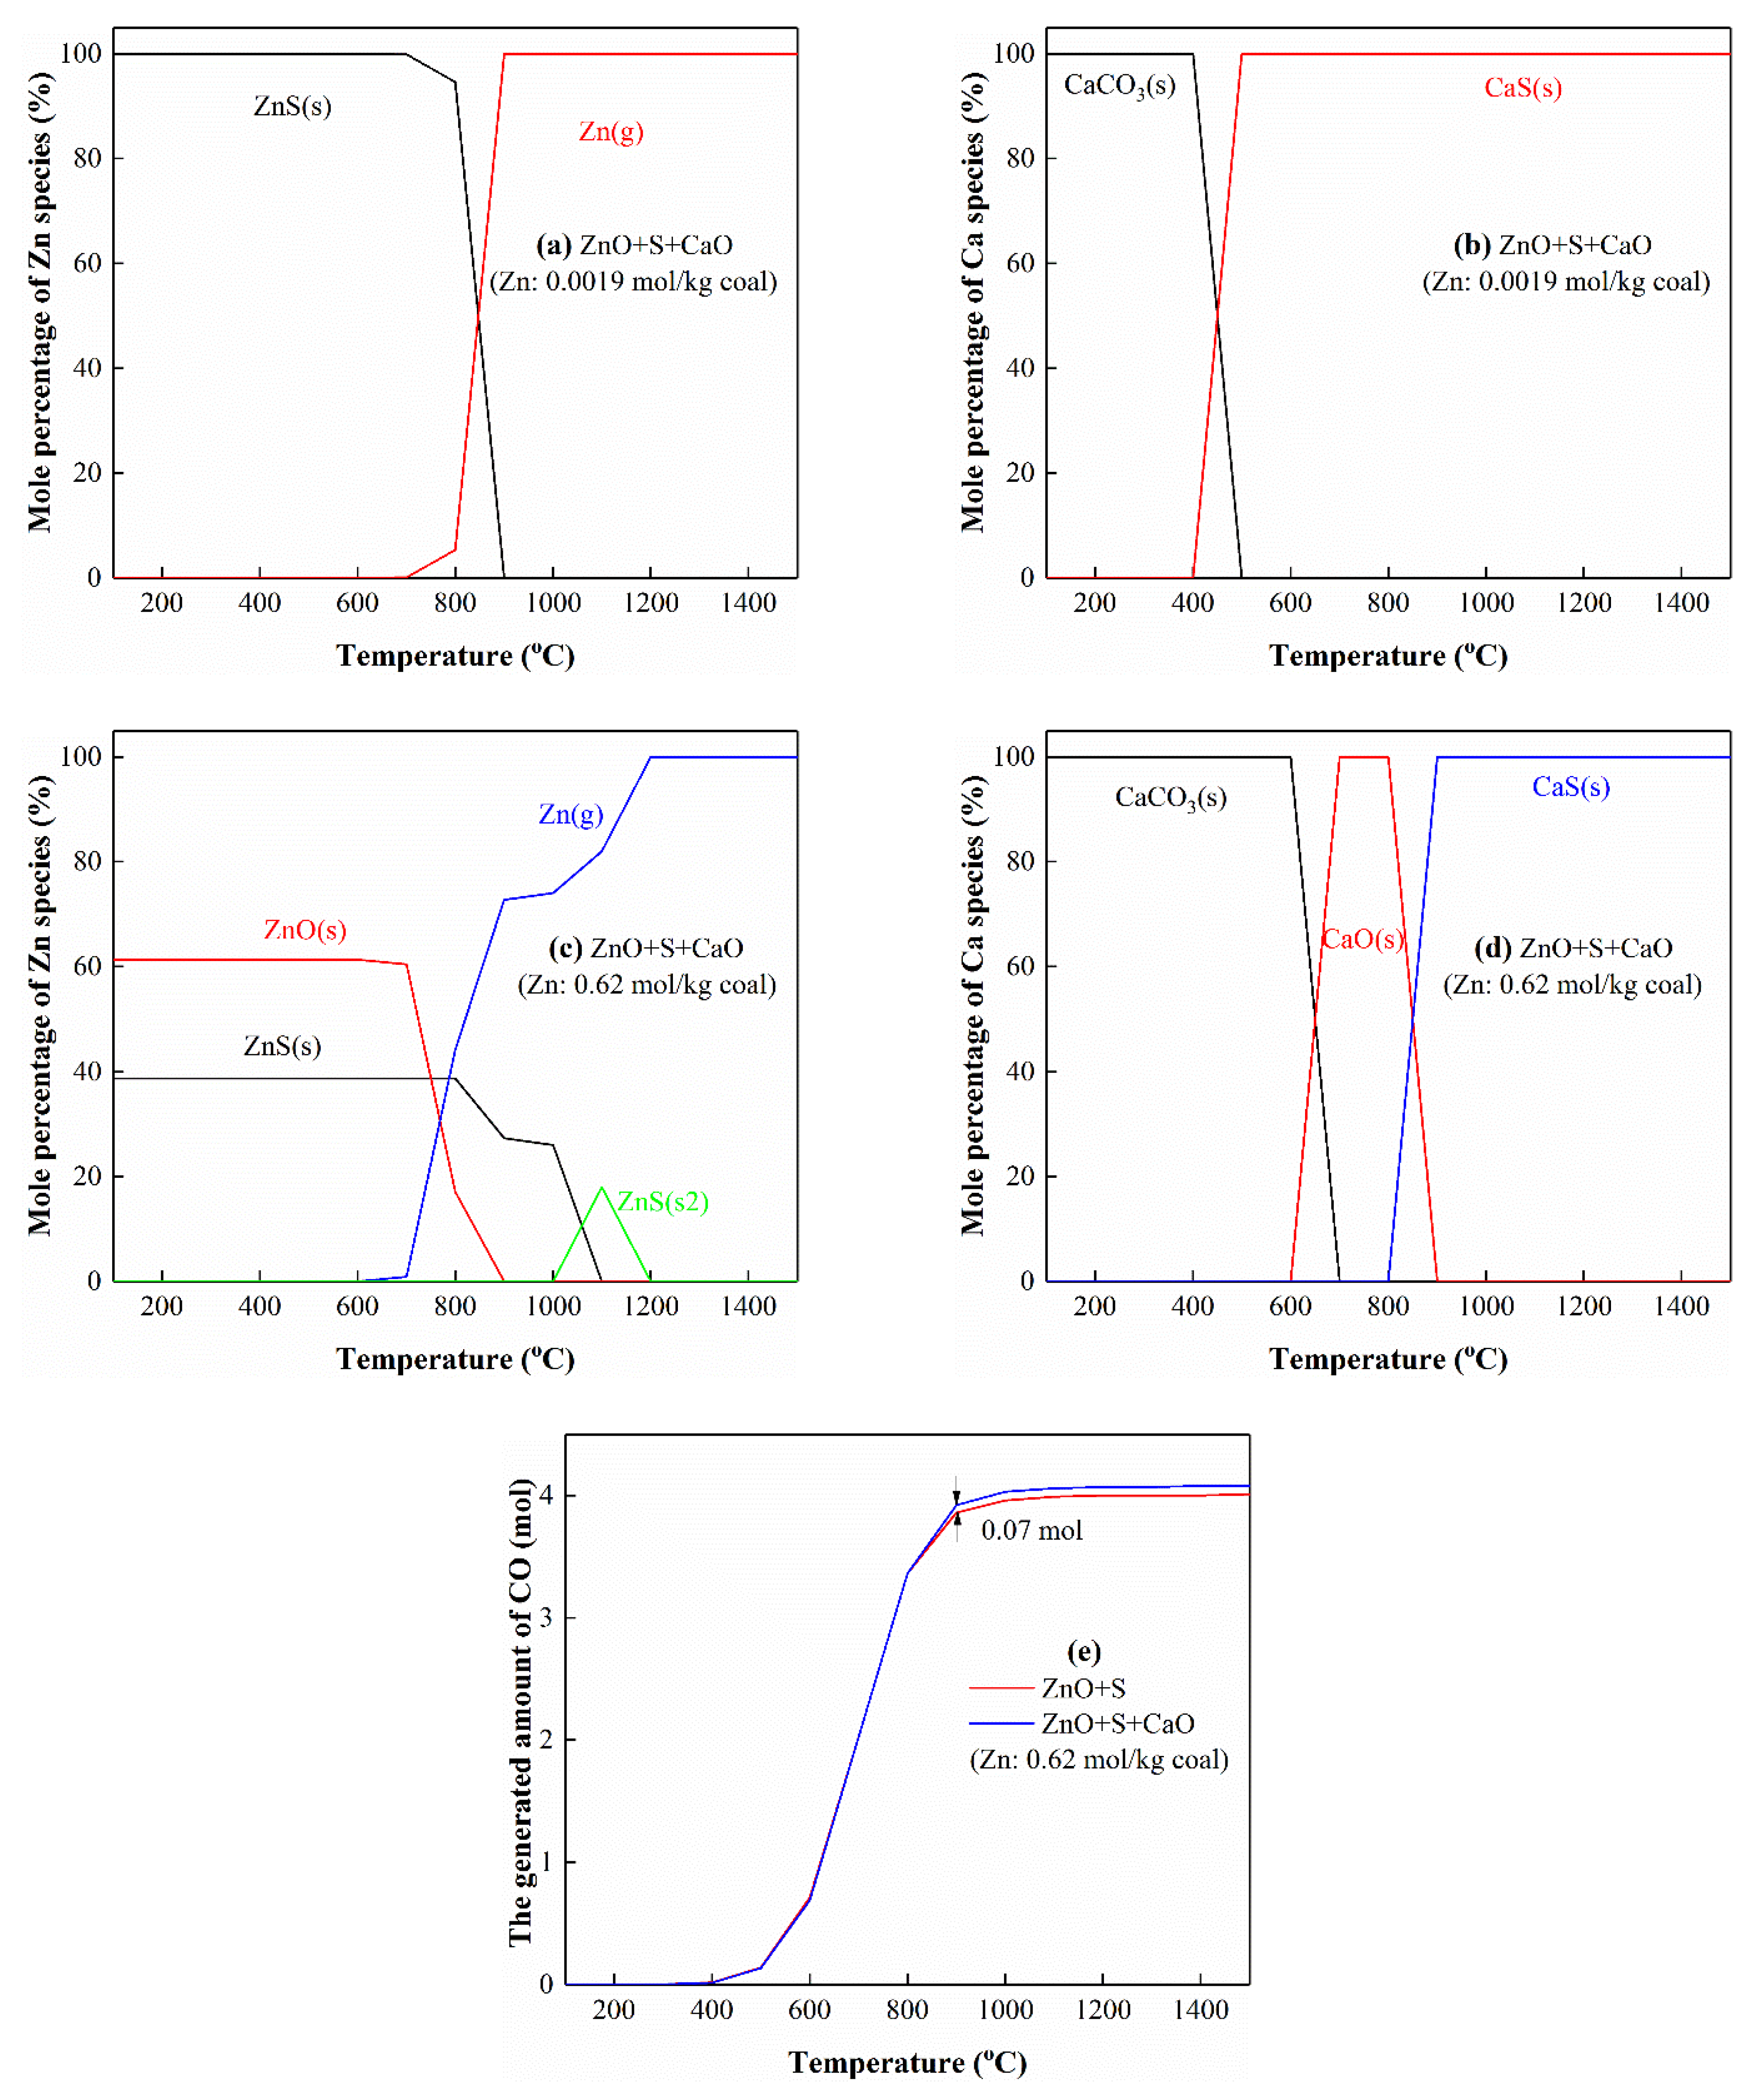
3.5.2. The Interactions of Zn with S and Ca
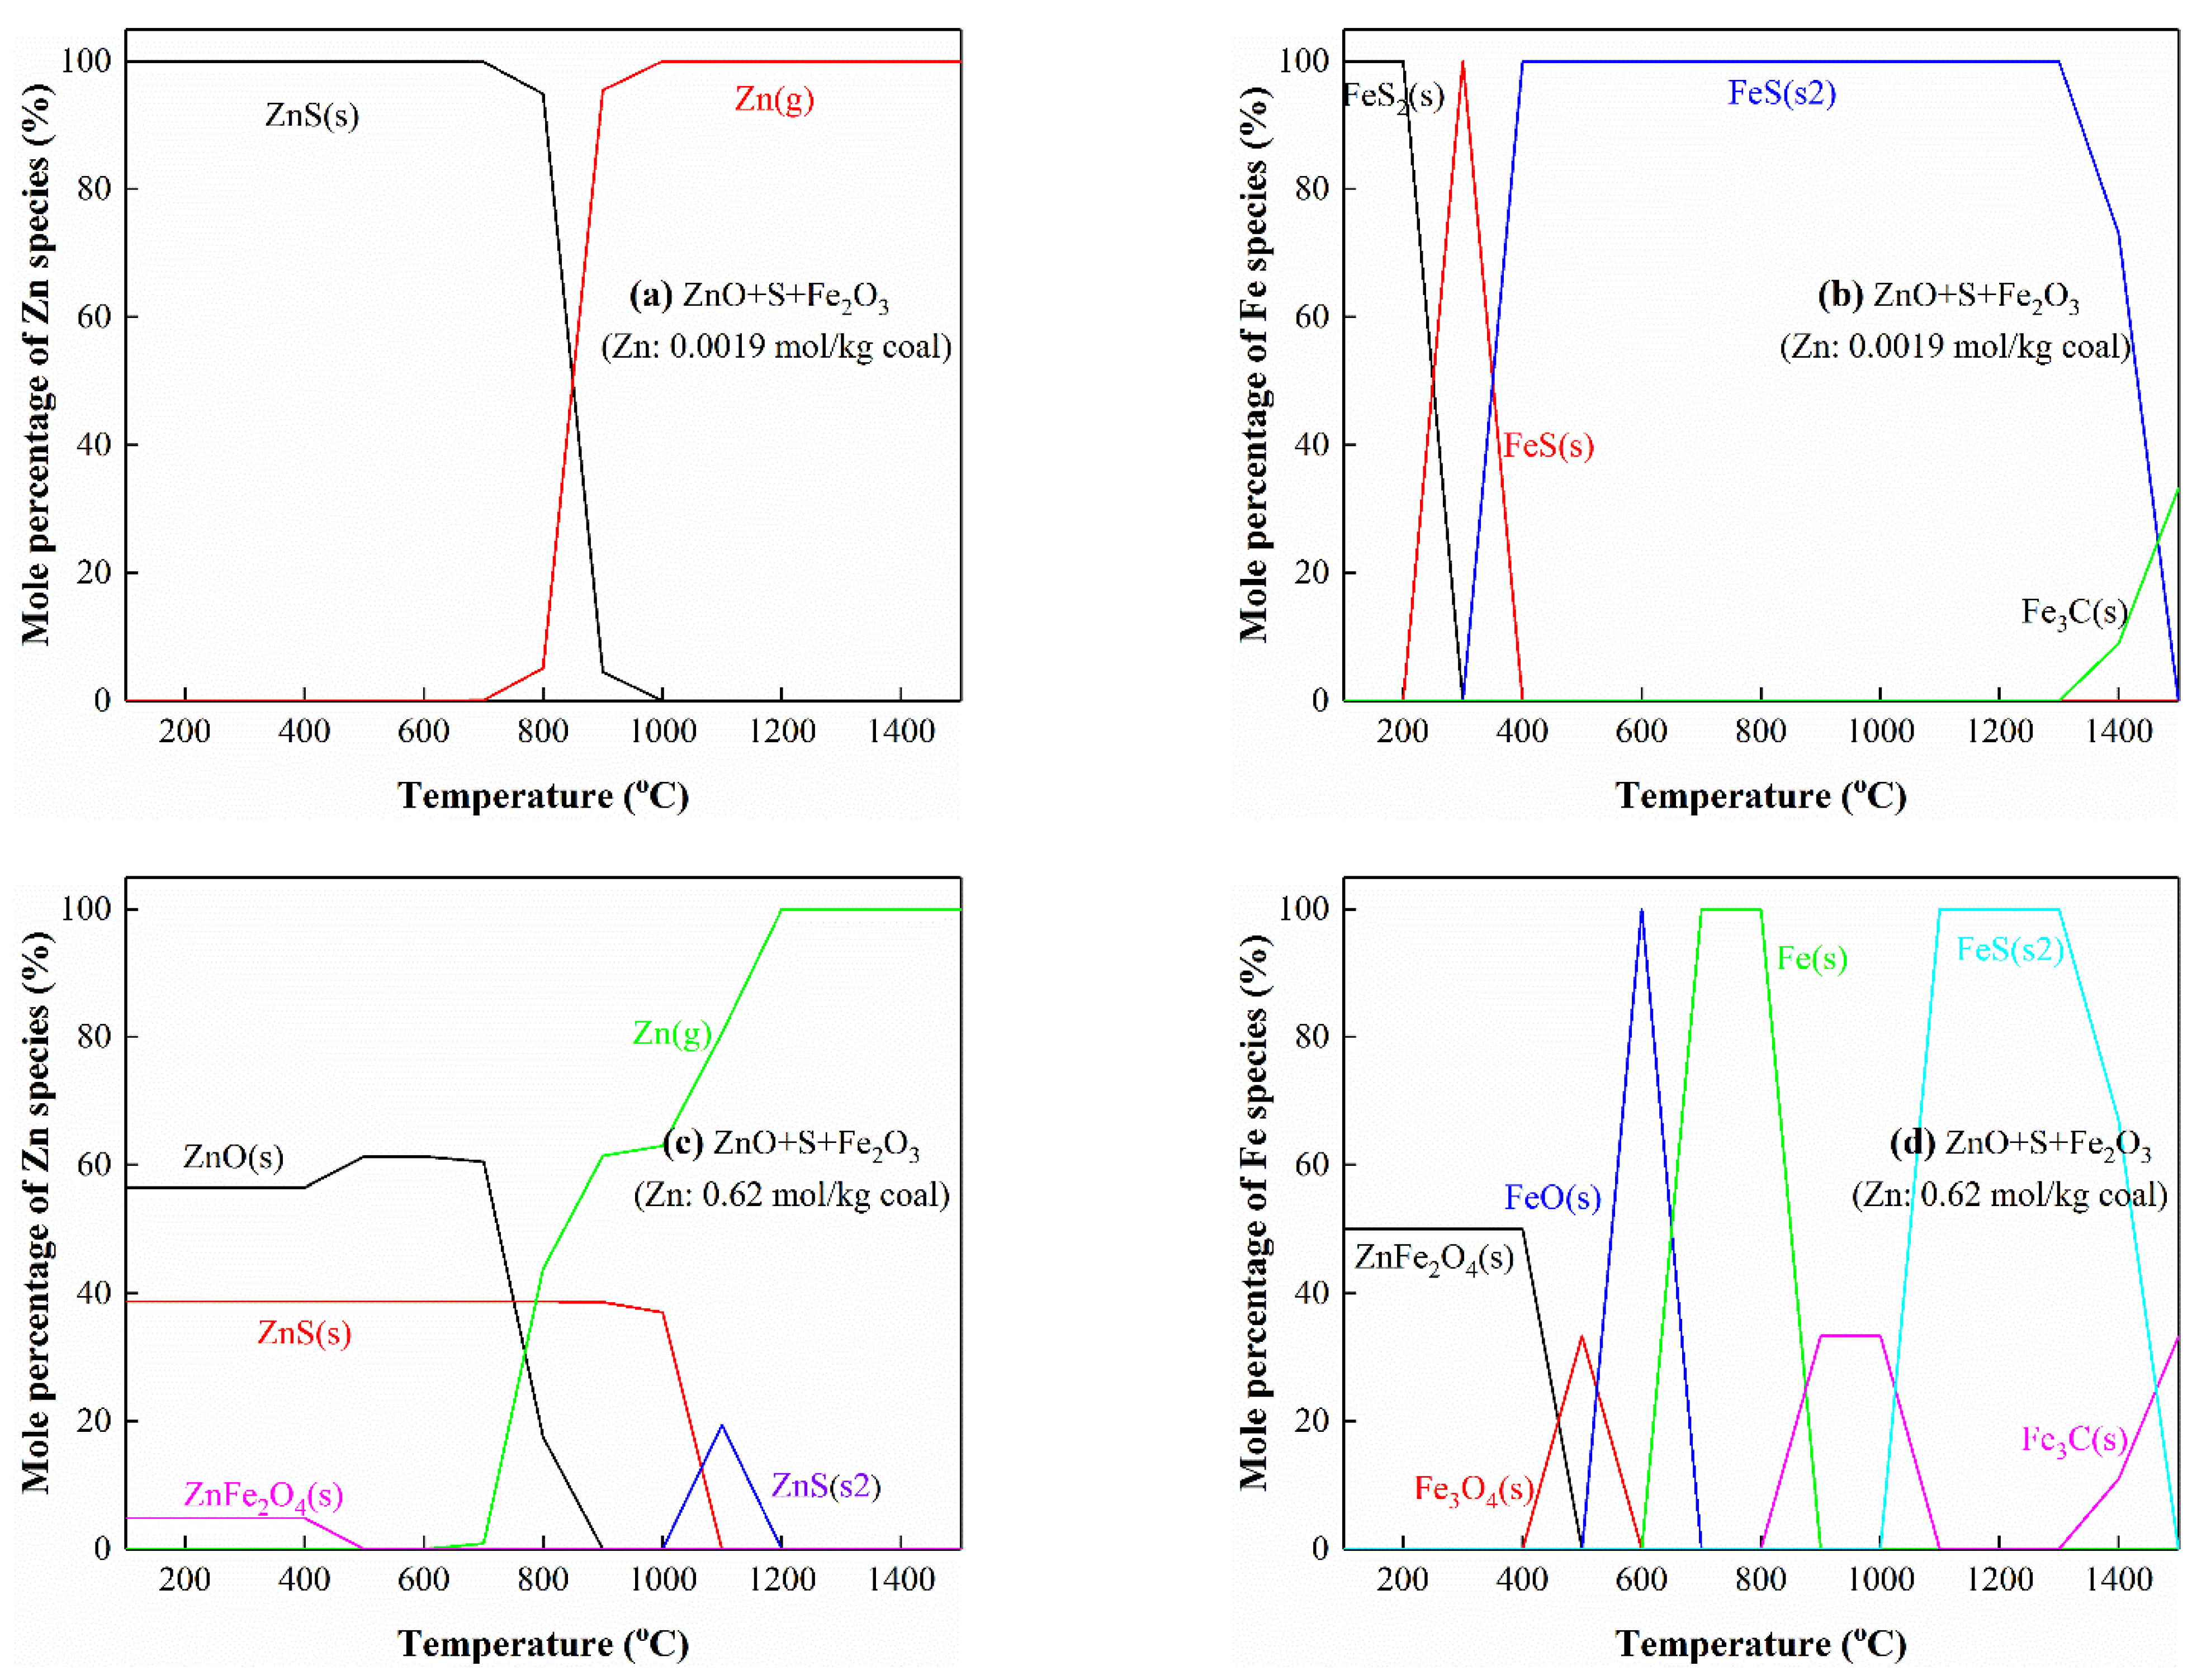
3.5.3. The Interactions of Zn with S and Fe
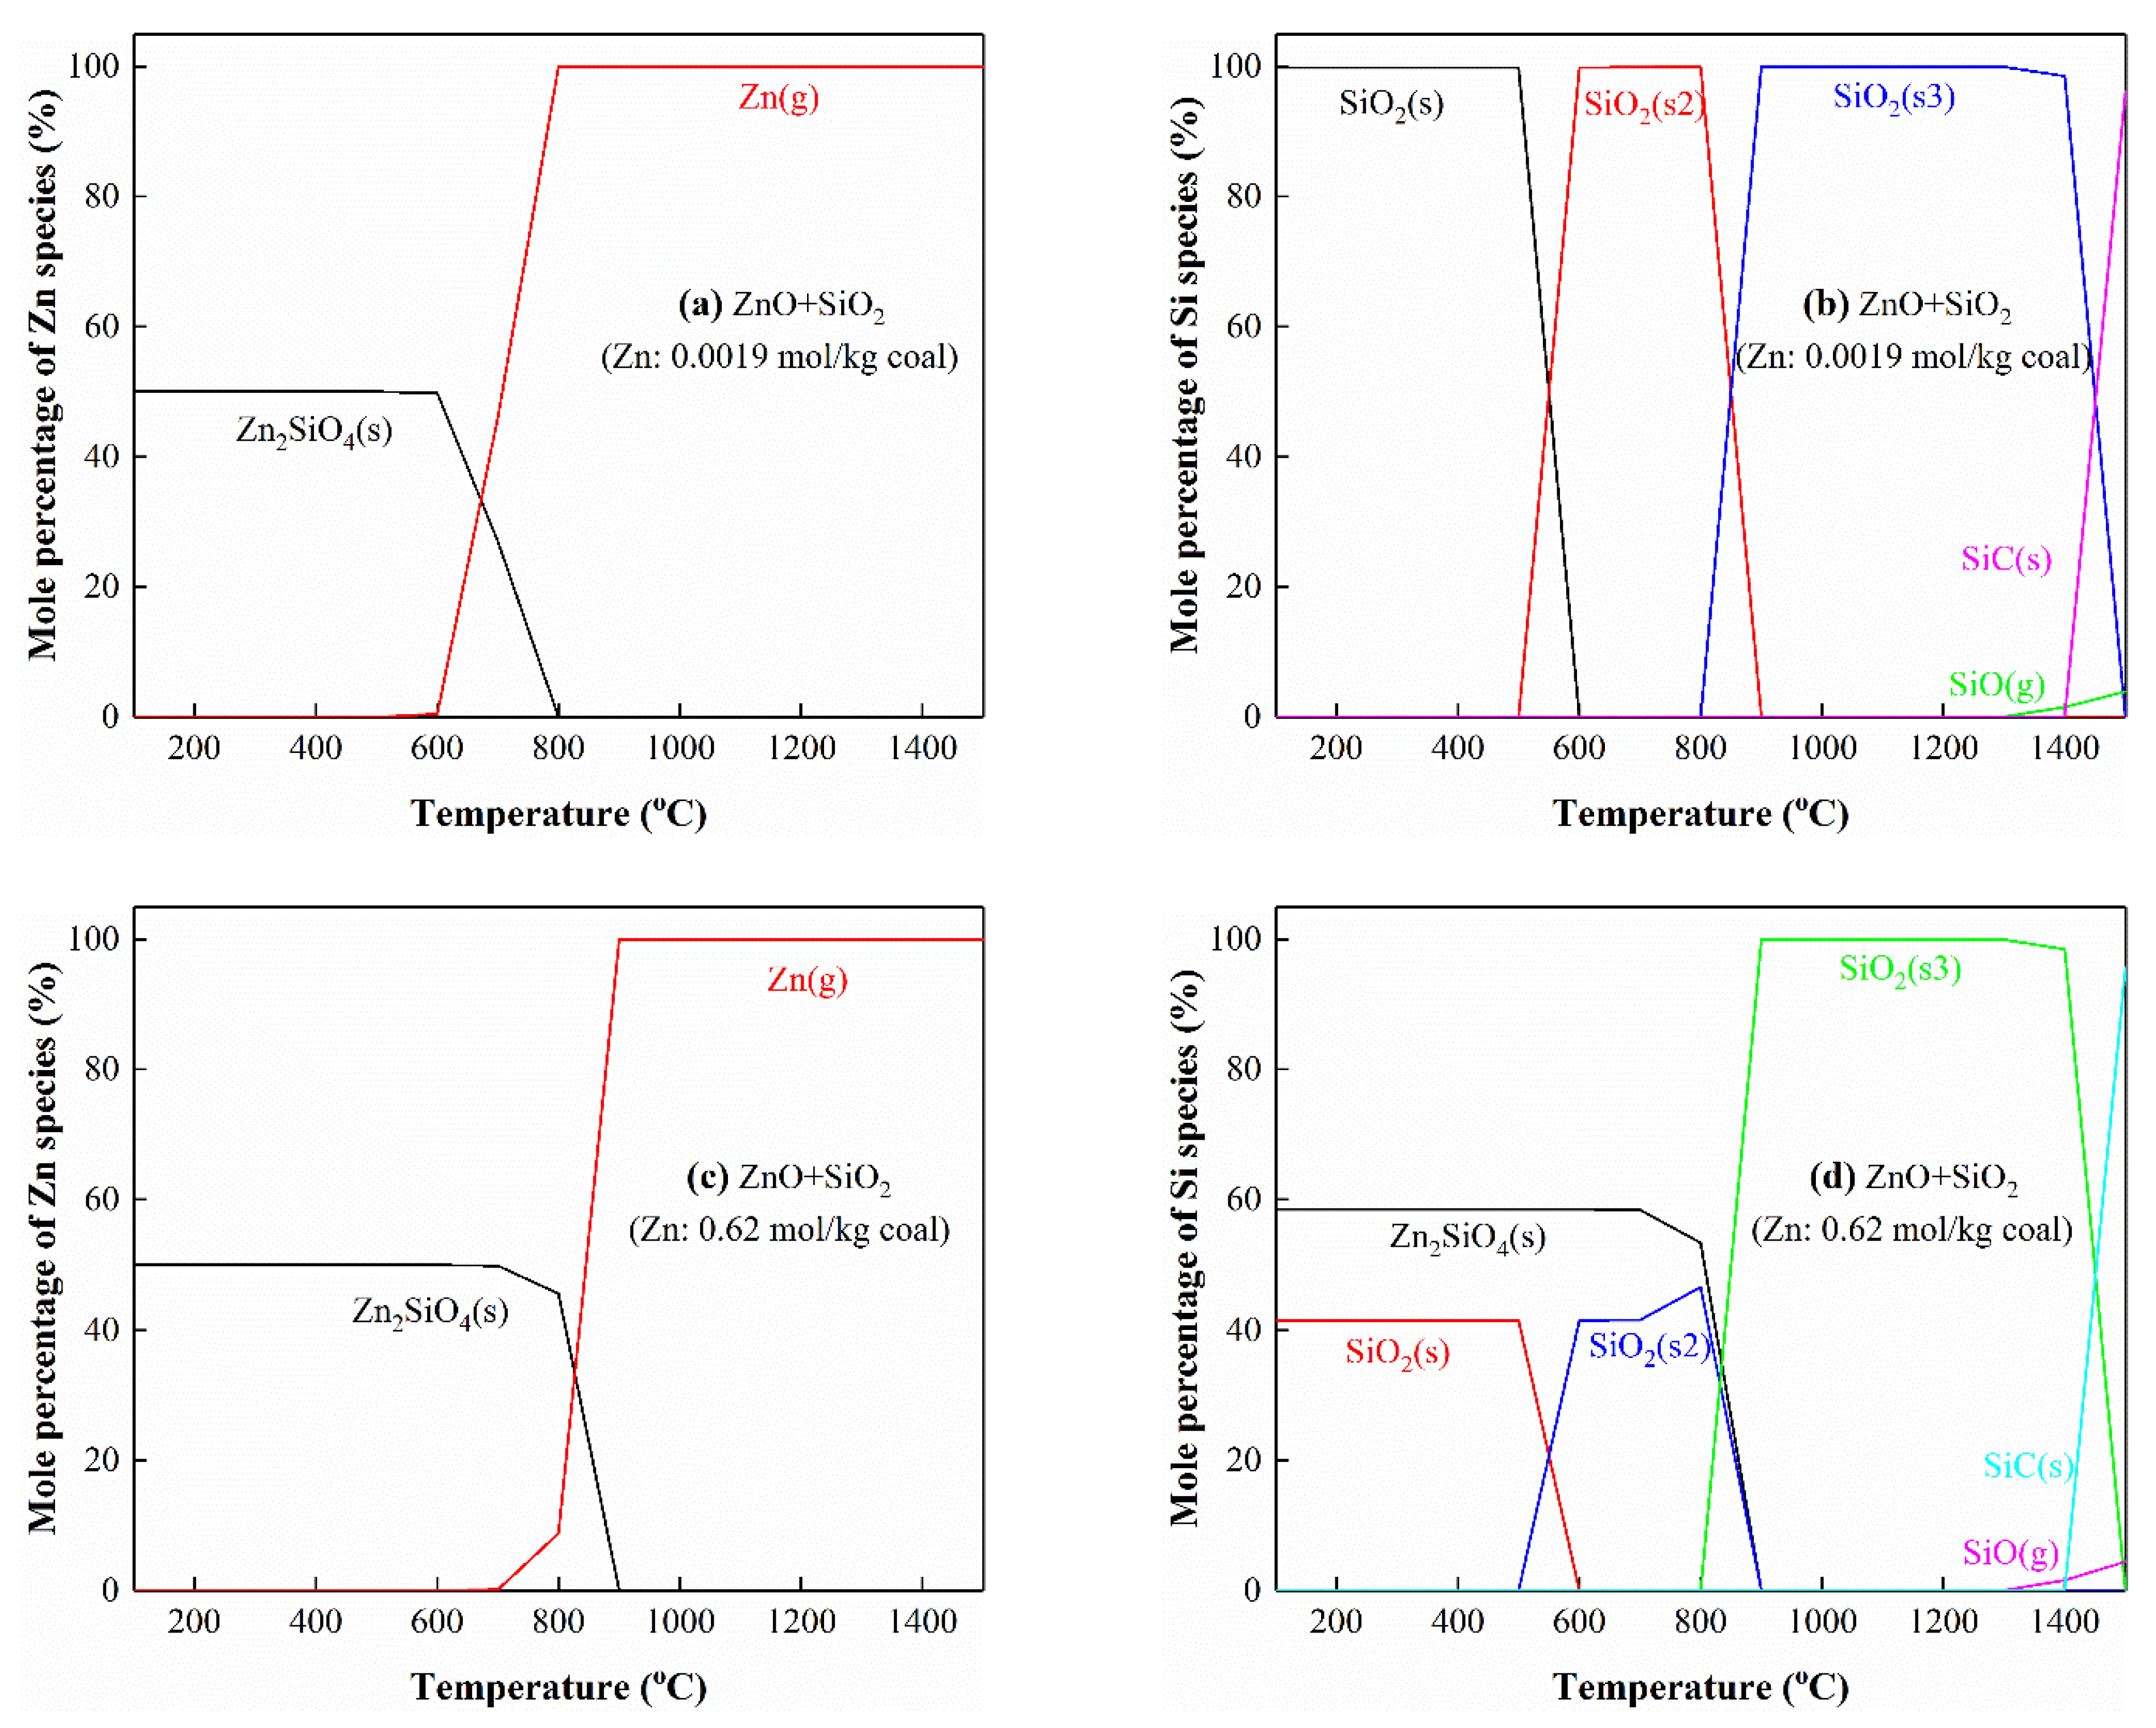
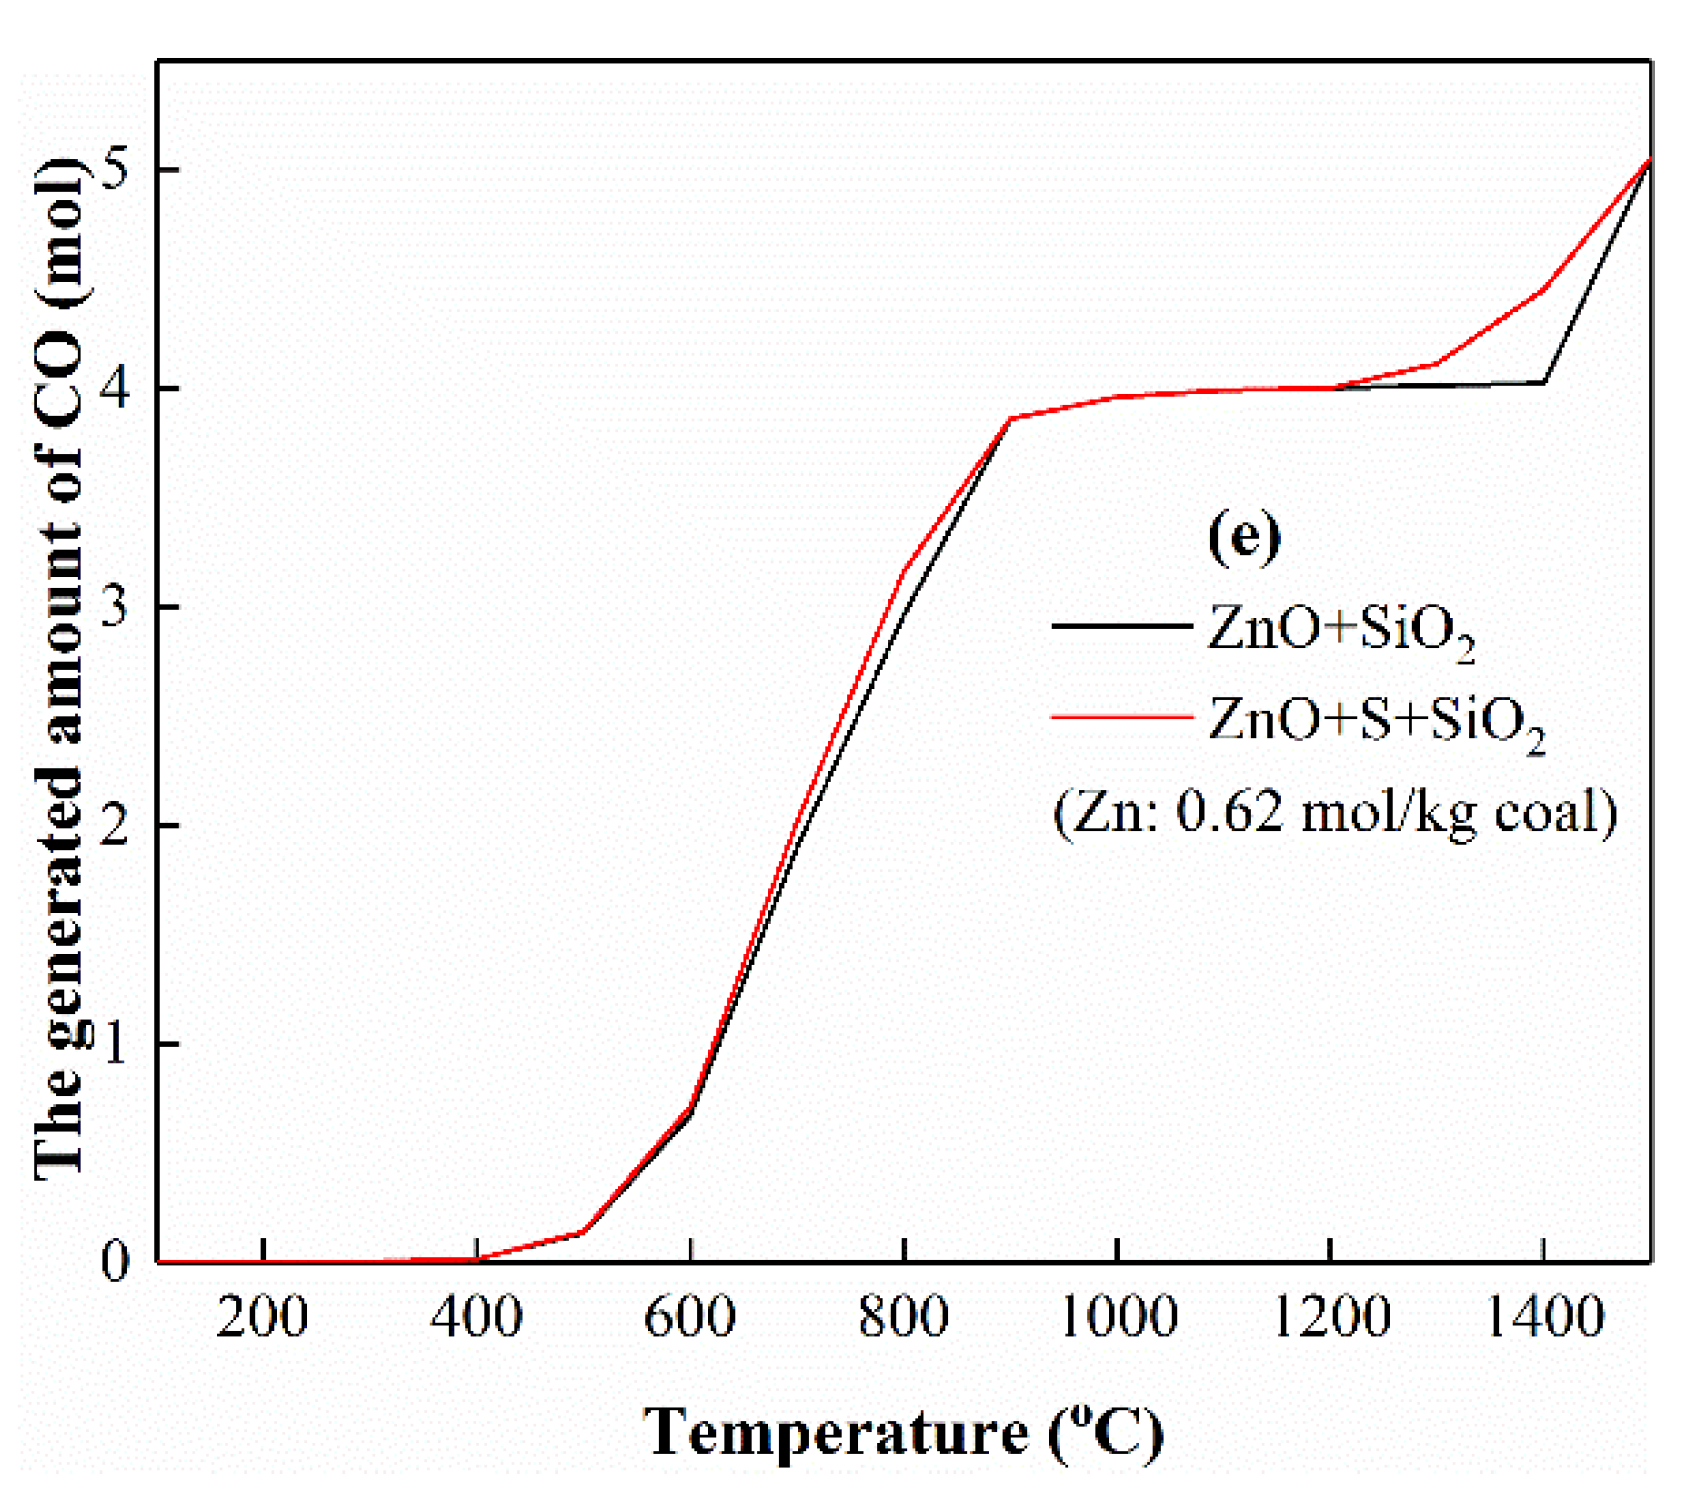
3.5.4. The Interactions of Zn with Si
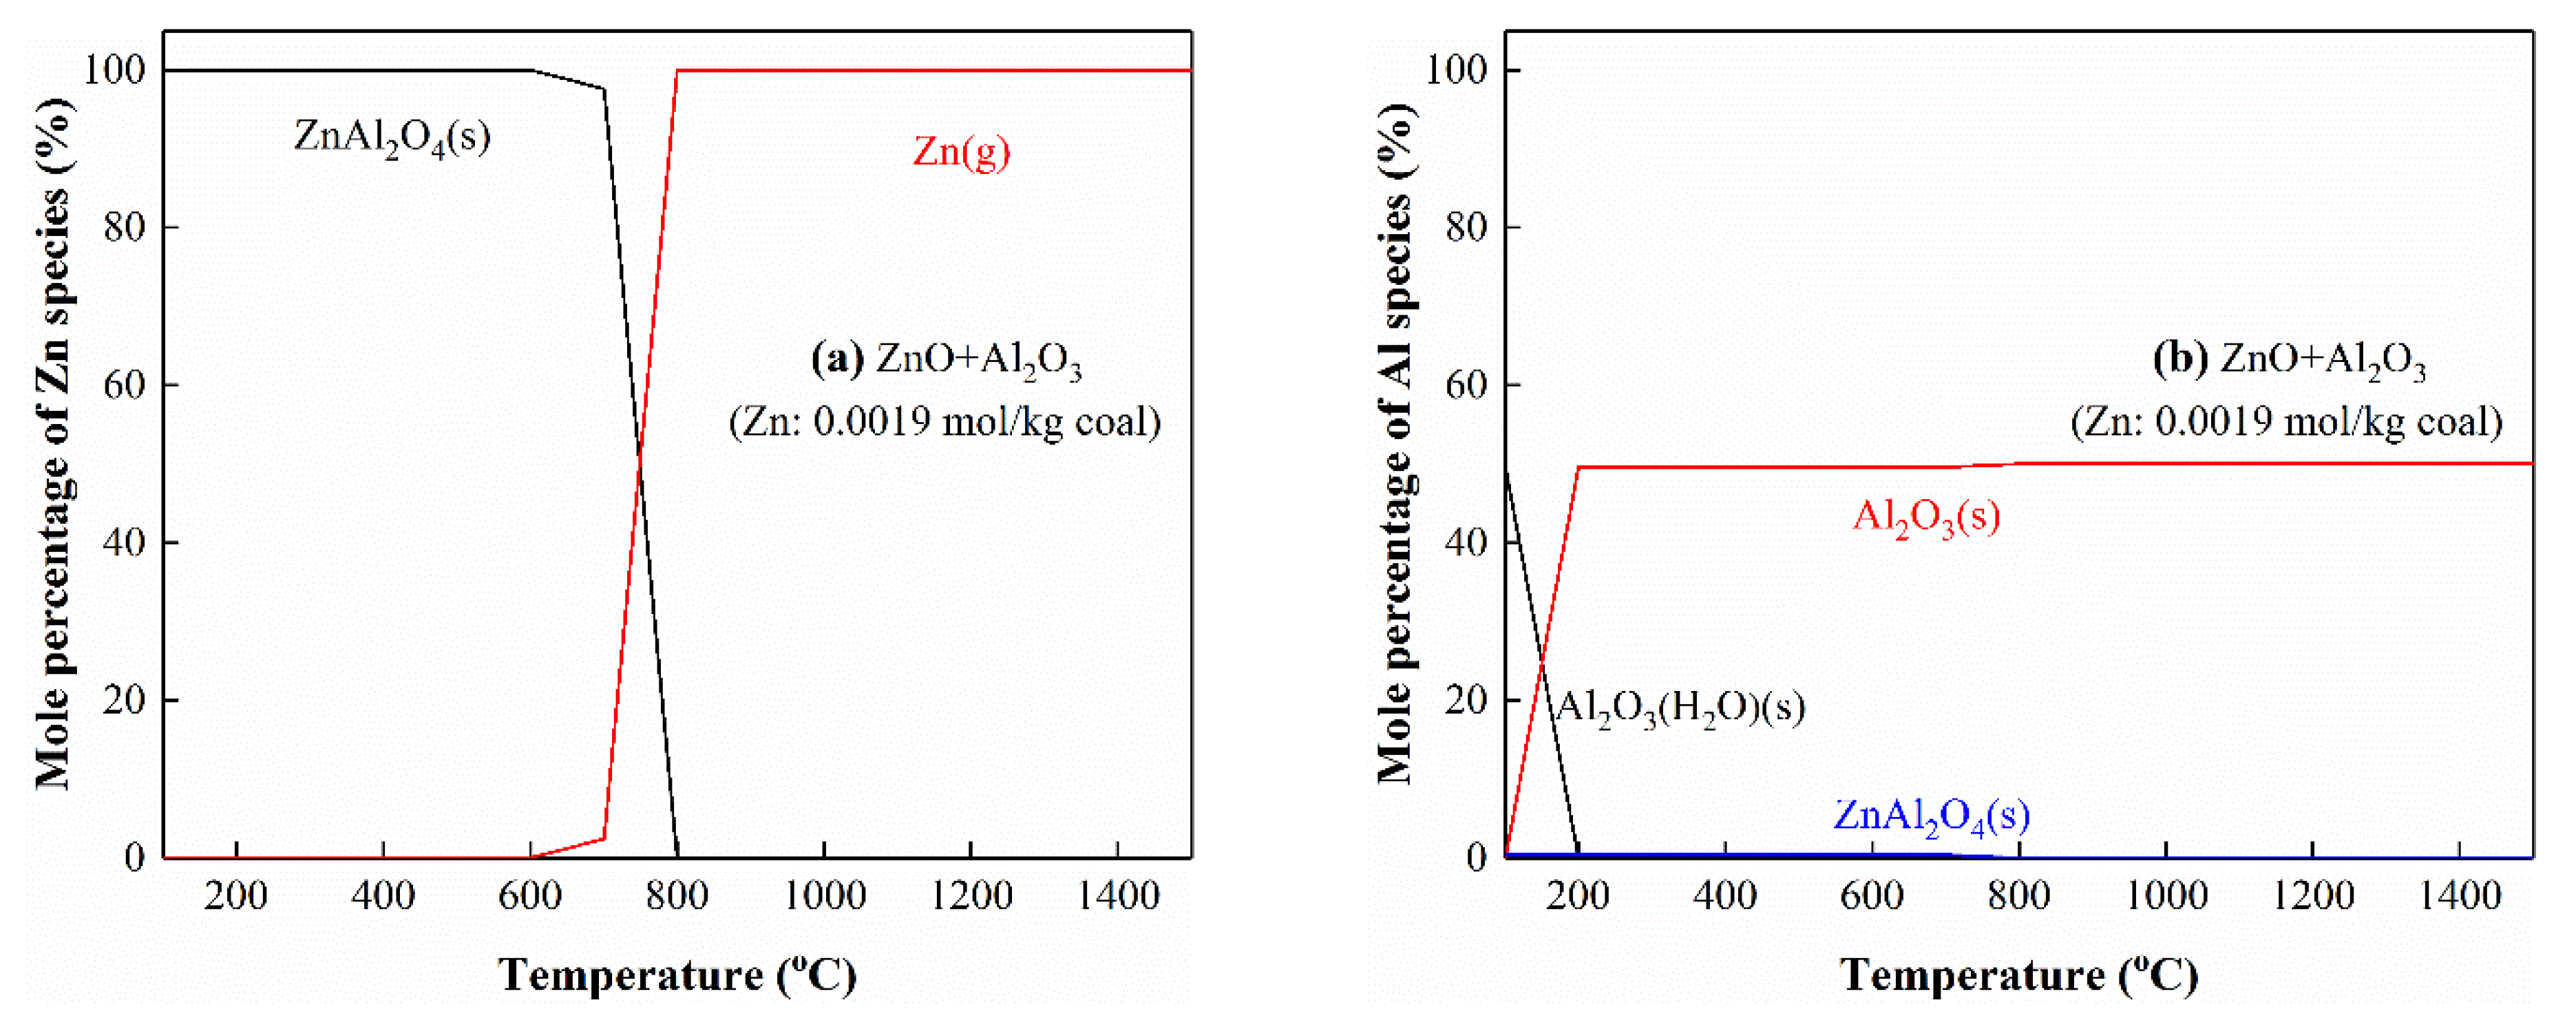
3.5.5. The Interactions of Zn with Al
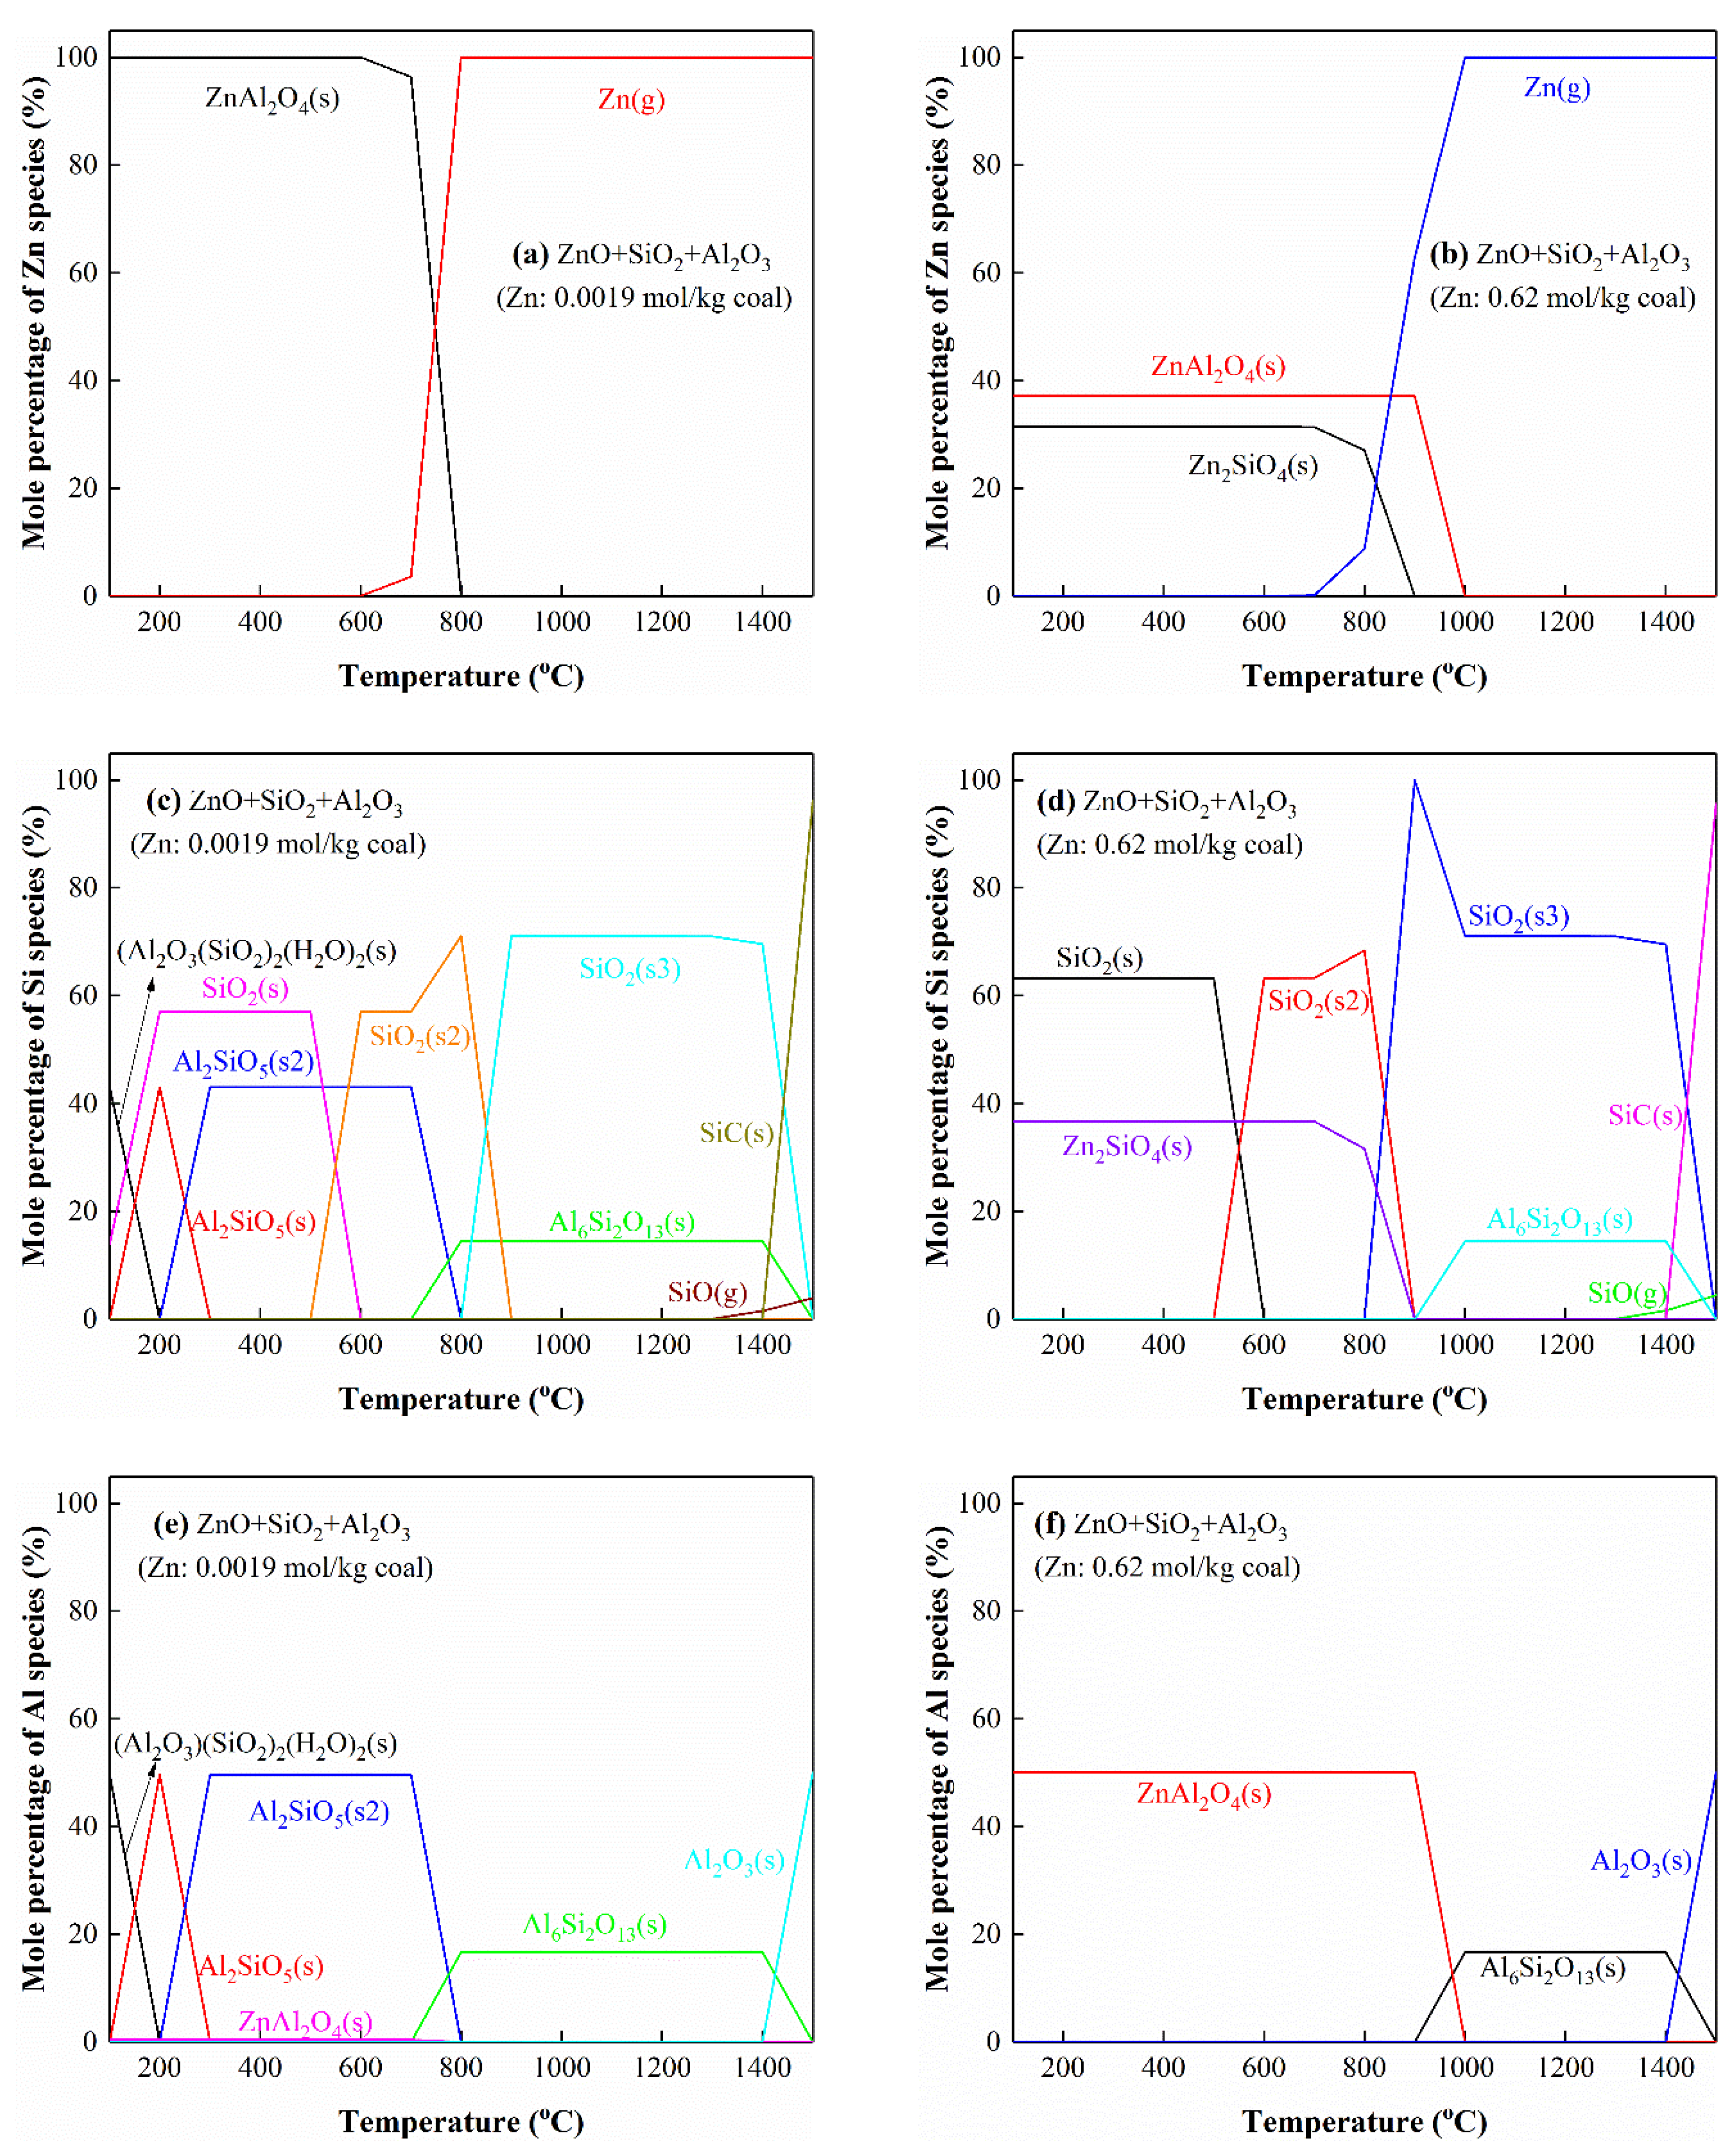
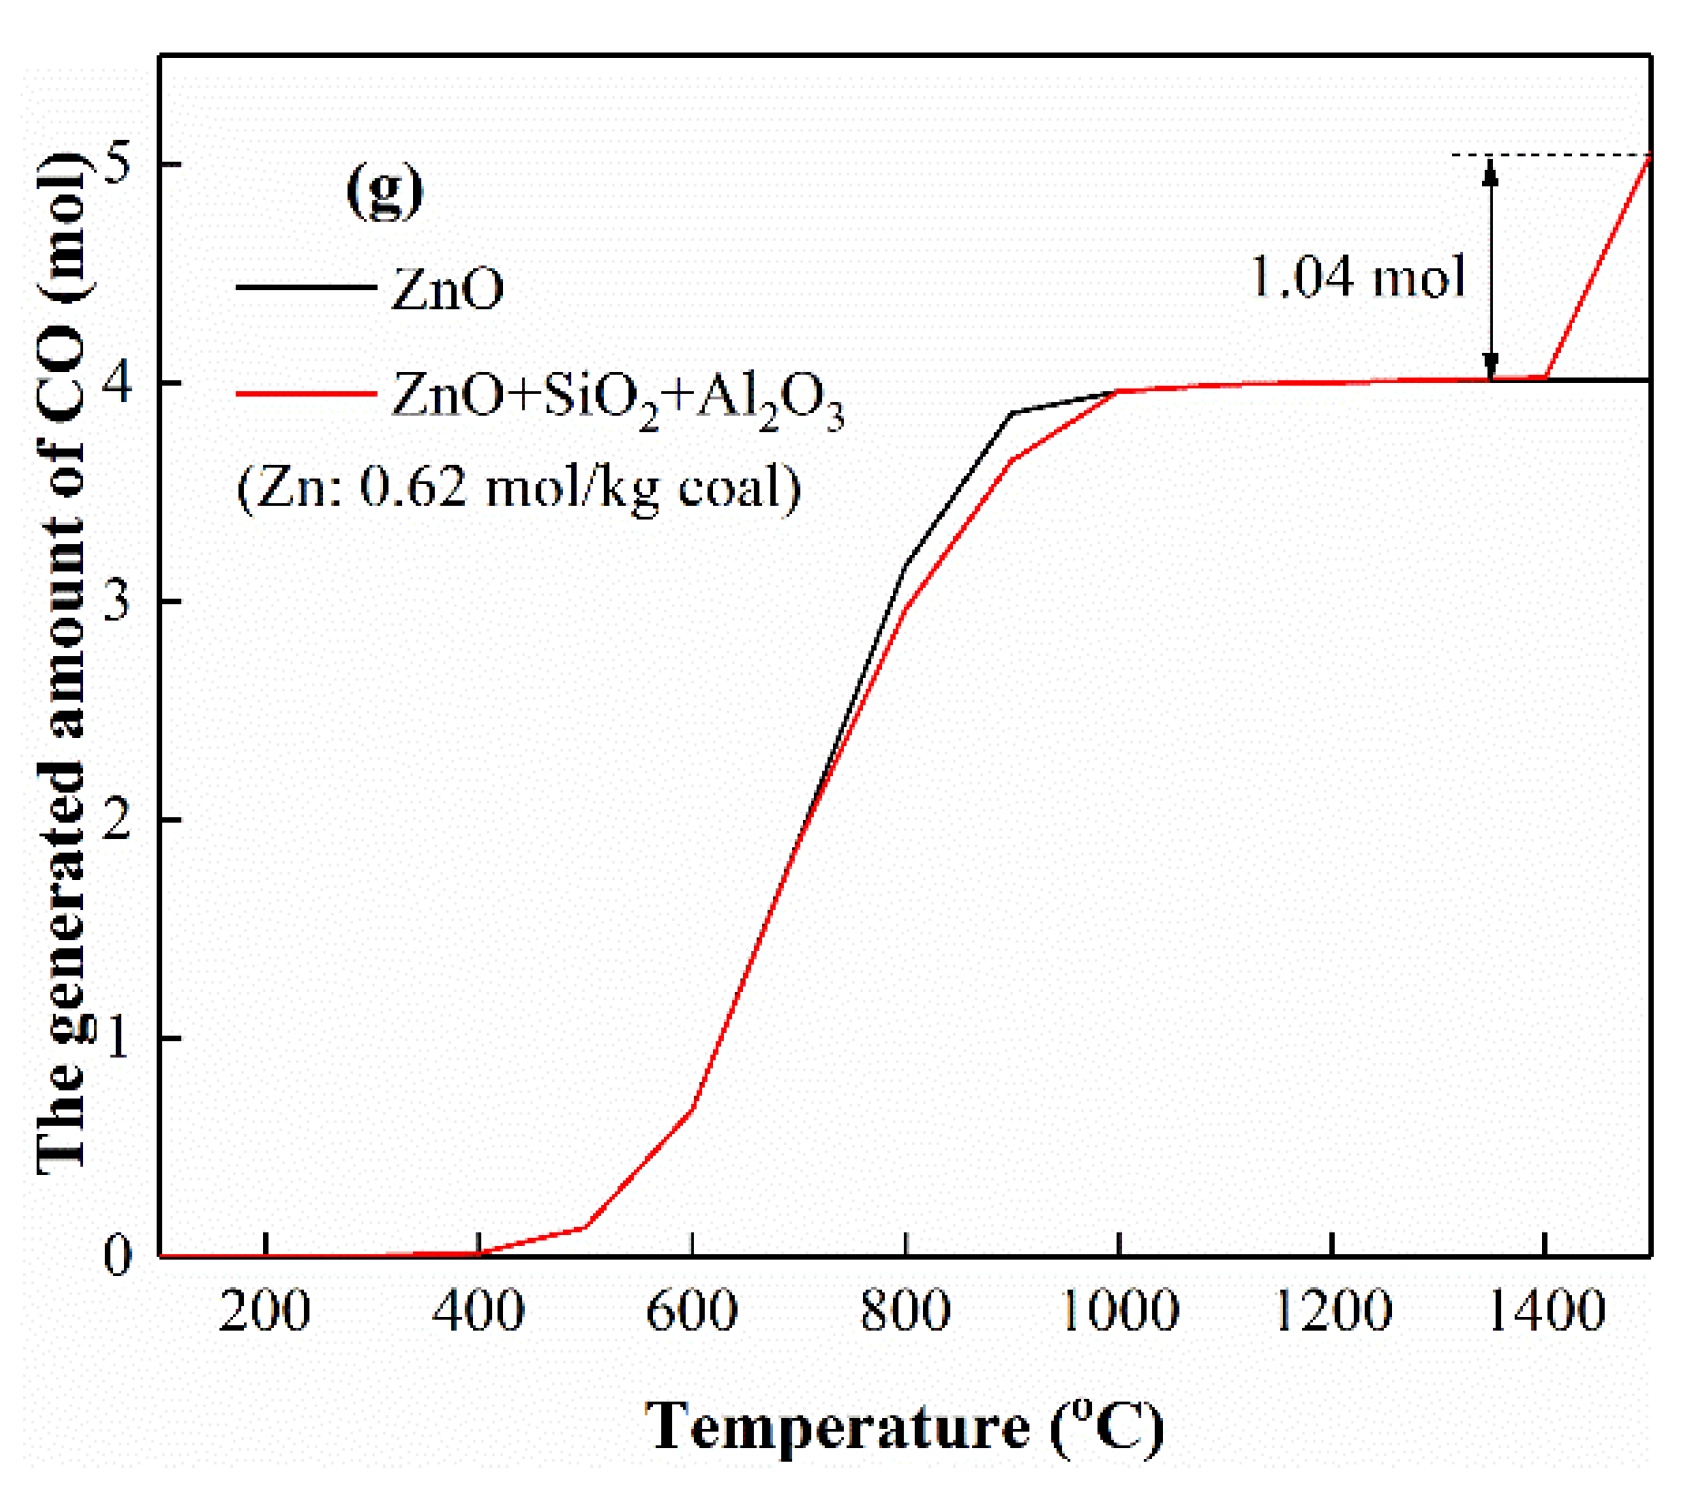
3.5.6. The Interactions of Zn with Si and Al
3.5.7. The Interactions of Zn with Ca and Al
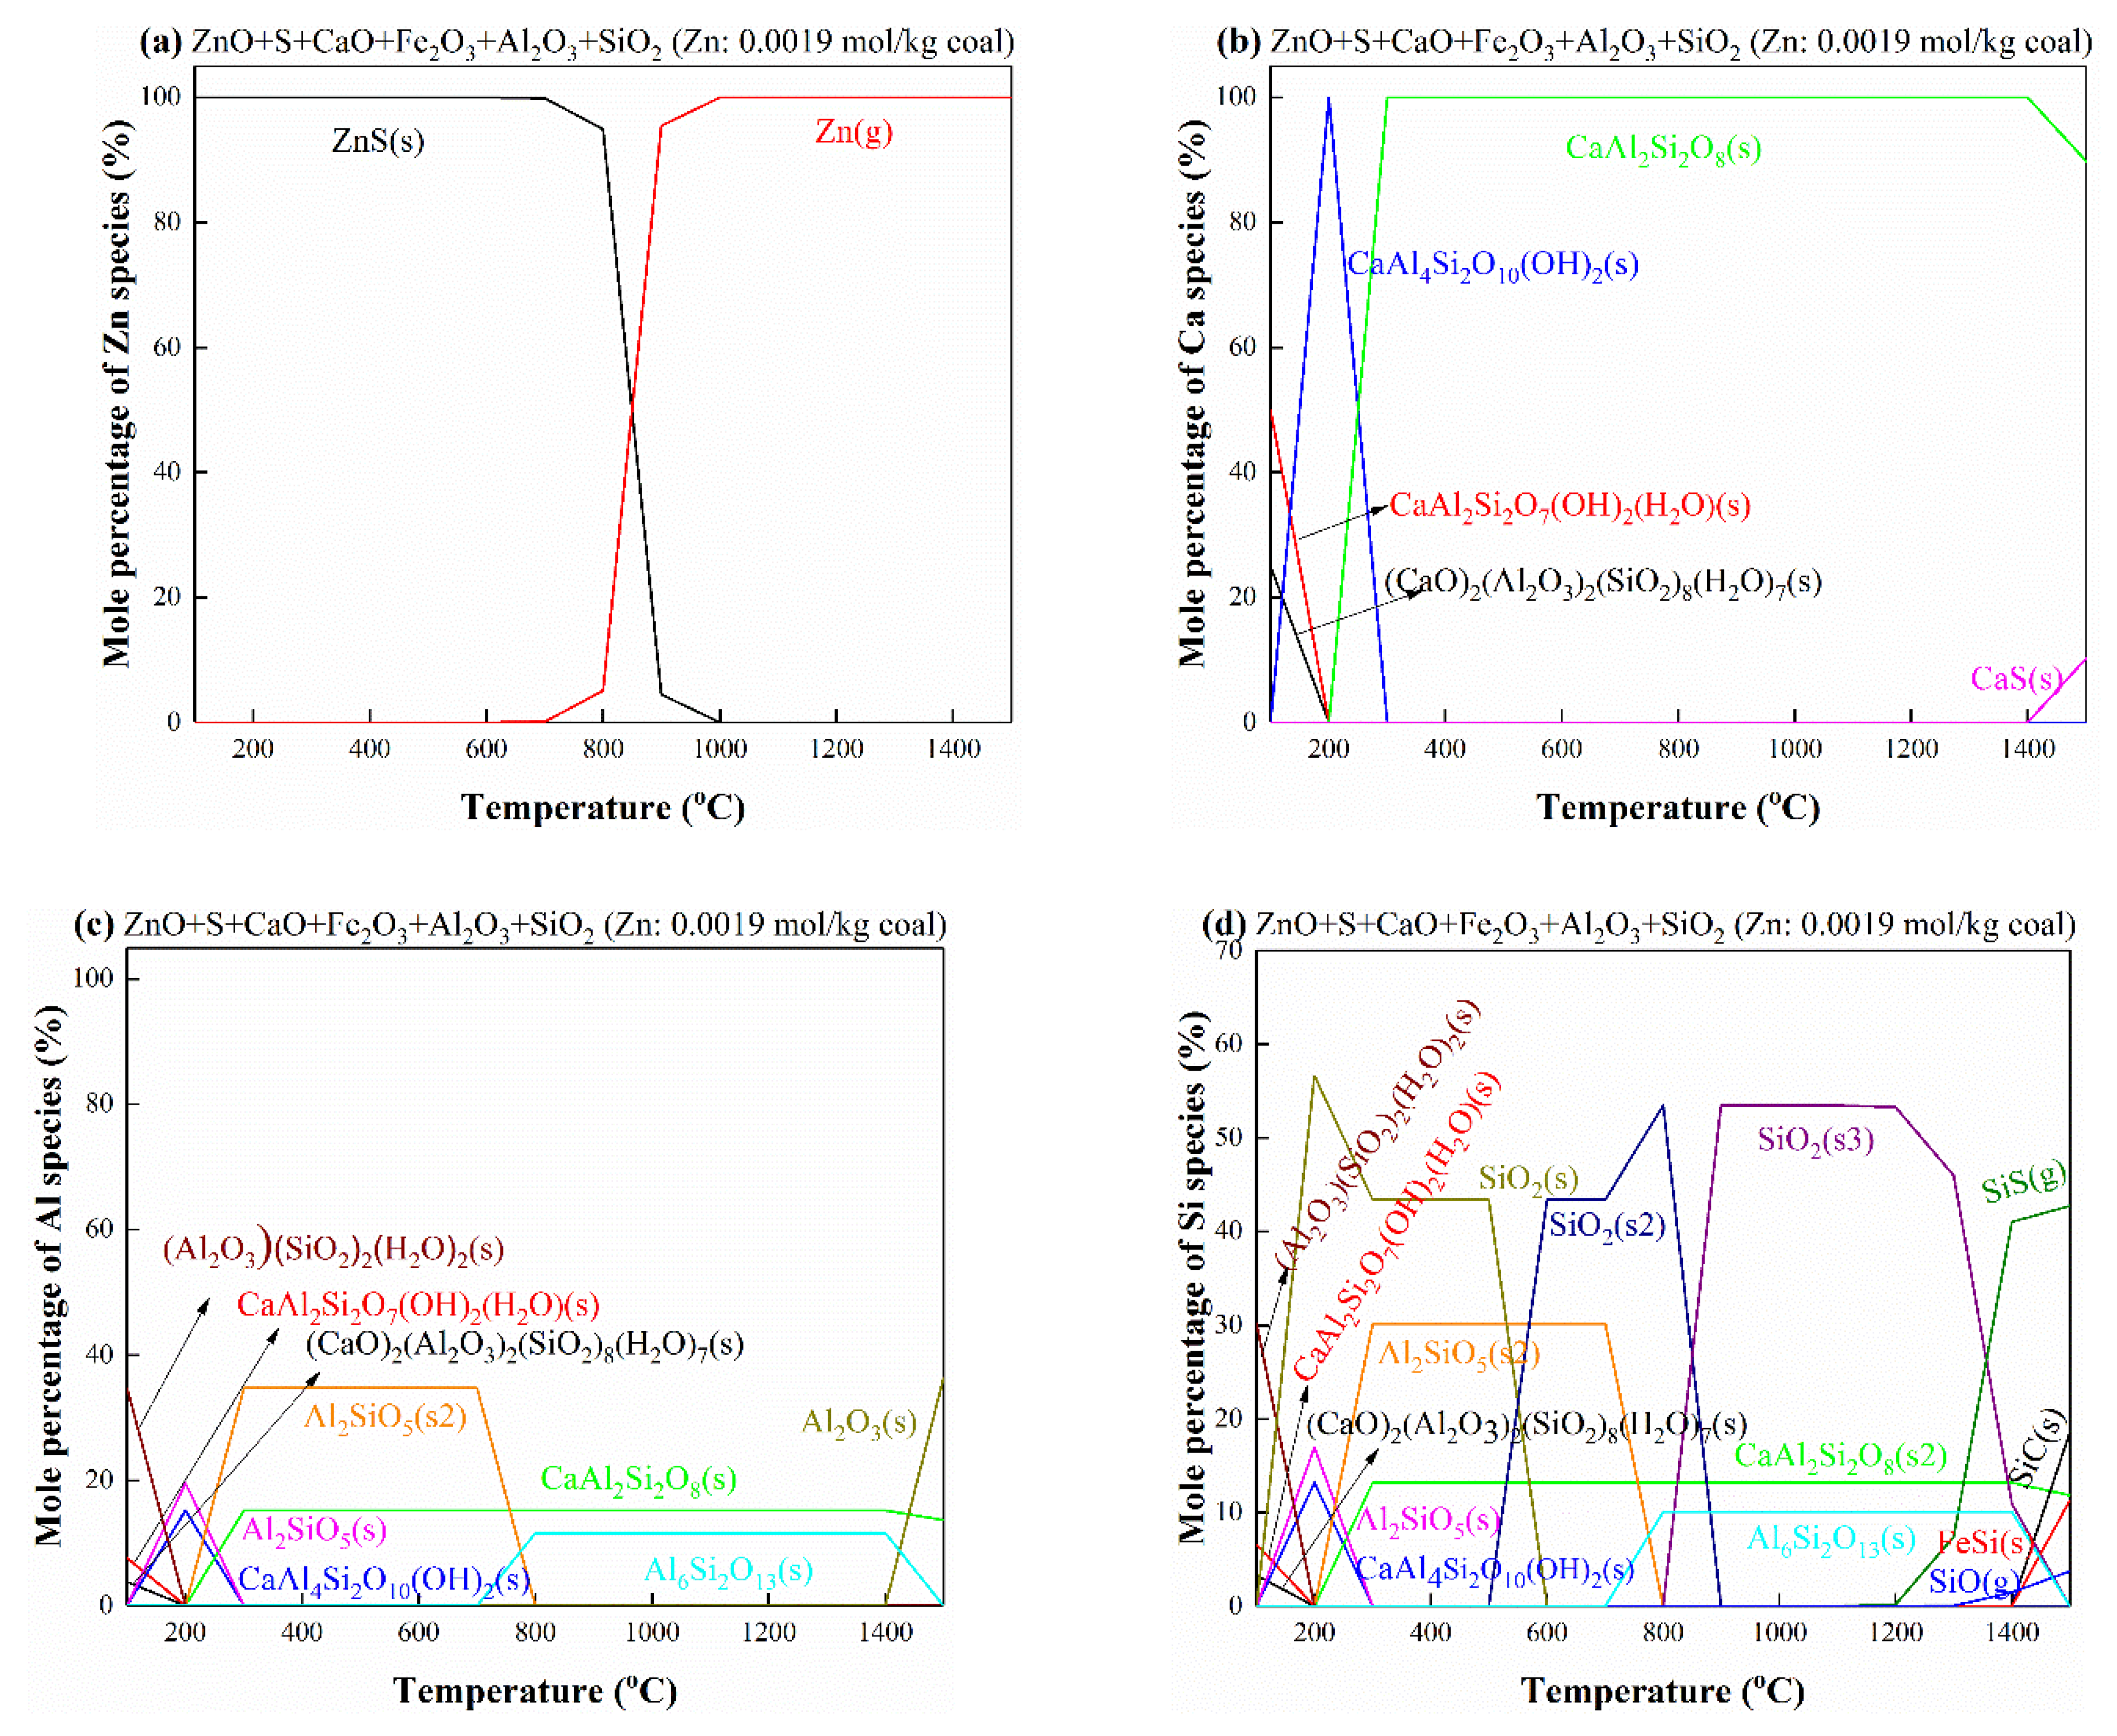
3.5.8. The Interactions of Zn with S, Ca, Al, Si and Fe
4. Conclusions
Supplementary Materials
Author Contributions
Funding
Institutional Review Board Statement
Informed Consent Statement
Data Availability Statement
Acknowledgments
Conflicts of Interest
References
- Elbaba, I.F.; Wu, C.; Williams, P.T. Catalytic pyrolysis-gasification of waste tire and tire elastomers for hydrogen production. Energy Fuels 2010, 24, 3928–3935. [Google Scholar] [CrossRef]
- Lehmann, C.M.B.; Rostam-Abadi, M.; Rood, M.J.; Sun, J. Reprocessing and reuse of waste tire rubber to solve air-quality related problems. Energy Fuels 1998, 12, 1095–1099. [Google Scholar] [CrossRef]
- Pan, D.L.; Jiang, W.T.; Guo, R.T.; Huang, Y.; Pan, W.G. Thermogravimetric and kinetic analysis of Co-combustion of waste tires and coal blends. ACS Omega 2021, 6, 5479–5484. [Google Scholar] [CrossRef] [PubMed]
- RMurillo; Navarro, M.V.; López, J.M.; Aylón, E.; Callén, M.S.; García, T.; Mastral, A.M. Kinetic model comparison for waste tire char reaction with CO2. Ind. Eng. Chem. Res. 2004, 43, 7768–7773. [Google Scholar] [CrossRef]
- Levendis, Y.A.; Atal, A.; Carlson, J.B. On the correlation of CO and PAH emissions from the combustion of pulverized coal and waste tires. Environ. Sci. Technol. 1998, 32, 3767–3777. [Google Scholar] [CrossRef]
- Zhang, Y.S.; Wu, C.; Nahil, M.A.; Williams, P. Pyrolysis-catalytic steam reforming/gasification of waste tires for production of carbon nanotubes and hydrogen. Energy Fuels 2015, 29, 3328–3334. [Google Scholar] [CrossRef]
- Levendis, Y.; Atal, A.; Carlson, J.; Dunayevskiy, Y.; Vouros, P. Comparative study on the combustion and emissions of waste tire crumb and pulverized coal. Environ. Sci. Technol. 1996, 30, 2742–2754. [Google Scholar] [CrossRef]
- Zaharia, M.; Sahajwalla, V.; Kim, B.C.; Khanna, R.; Saha-Chaudhury, N.; O’Kane, P.; Dicker, J.; Skidmore, C.; Knights, D. Recycling of rubber tires in electric arc furnace steelmaking: Simultaneous combustion of metallurgical coke and rubber tyres blends. Energy Fuels 2009, 23, 2467–2474. [Google Scholar] [CrossRef]
- Díaz-Bautista, M.A.; Alvarez-Rodríguez, R.; Clemente-Jul, C.; Mastral, A.M. AFBC of coal with tyre rubber. Influence of the co-combustion variables on the mineral matter of solid by-products and on Zn lixiviation. Fuel 2013, 106, 10–20. [Google Scholar] [CrossRef]
- Kříž, V.; Brožová, Z.; Přibyl, O.; Sýkorová, I. Possibility of obtaining hydrogen from coal/waste-tyre mixture. Fuel Processing Technol. 2008, 89, 1069–1075. [Google Scholar] [CrossRef]
- Straka, P.; Bučko, Z. Co-gasification of lignite/waste-tyre mixture in a moving bed. Fuel Processing Technol. 2009, 90, 1202–1206. [Google Scholar] [CrossRef]
- Oni, B.A.; Sanni, S.E.; Olabode, O.S. Production of fuel-blends from waste tyre and plastic by catalytic and integrated pyrolysis for use in compression ignition (CI) engines. Fuel 2021, 297, 120801. [Google Scholar] [CrossRef]
- Murugan, S.; Ramaswamy, M.C.; Nagarajan, G. A comparative study on the performance, emission and combustion studies of a DI diesel engine using distilled tyre pyrolysis oil-diesel blends. Fuel 2008, 87, 2111–2121. [Google Scholar] [CrossRef]
- Frigo, S.; Seggiani, M.; Puccini, M.; Vitolo, S. Liquid fuel production from waste tyre pyrolysis and its utilisation in a diesel engine. Fuel 2014, 116, 399–408. [Google Scholar] [CrossRef]
- Bičáková, O.; Straka, P. Co-pyrolysis of waste tire/coal mixtures for smokeless fuel, maltenes and hydrogen-rich gas production. Energy Convers. Manag. 2016, 116, 203–213. [Google Scholar] [CrossRef]
- Mastral, A.M.; Murillo, R.; Callén, M.S.; García, T. Evidence of coal and tire interactions in coal-tire coprocessing for short residence times. Fuel Processing Technol. 2001, 69, 127–140. [Google Scholar] [CrossRef]
- Aydın, H.; İlkılıç, C. Optimization of fuel production from waste vehicle tires by pyrolysis and resembling to diesel fuel by various desulfurization methods. Fuel 2012, 102, 605–612. [Google Scholar] [CrossRef]
- Song, Z.L.; Yan, Y.C.; Xie, M.M.; Lv, X.; Yang, Y.Q.; Liu, L.; Zhao, X.Q. Effect of steel wires on the microwave pyrolysis of tire powders. ACS Sustain. Chem. Eng. 2018, 6, 13443–13453. [Google Scholar] [CrossRef]
- Leung, D.Y.C.; Yin, X.L.; Zhao, Z.L.; Xu, B.Y.; Chen, Y. Pyrolysis of tire powder: Influence of operation variables on the composition and yields of gaseous product. Fuel Processing Technol. 2002, 79, 141–155. [Google Scholar] [CrossRef]
- Lopez, G.; Olazar, M.; Aguado, R.; Elordi, G.; Amutio, M.; Artetxe, M.; Bilbao, J. Vacuum pyrolysis of waste tires by continuously feeding into a conical spouted bed reactor. Ind. Eng. Chem. Res. 2010, 49, 8990–8997. [Google Scholar] [CrossRef]
- Osorio-Vargas, P.; Shanmugaraj, K.; Herrera, C.; Campos, C.H.; Torres, C.C.; Castillo-Puchi, F.; Arteaga-Pérez, L.E. Valorization of waste tires via catalytic fast pyrolysis using palladium supported on natural halloysite. Ind. Eng. Chem. Res. 2021, 60, 18806–18816. [Google Scholar] [CrossRef]
- Campuzano, F.; Cardona-Uribe, N.; Agudelo, A.F.; Sarathy, S.M.; Martínez, J.D. Pyrolysis of waste tires in a twin-auger reactor using CaO: Assessing the physicochemical properties of the derived products. Energy Fuels 2021, 35, 8819–8833. [Google Scholar] [CrossRef]
- Onay, O.; Koca, H. Determination of synergetic effect in co-pyrolysis of lignite and waste tyre. Fuel 2015, 150, 169–174. [Google Scholar] [CrossRef]
- Ren, Q.Q.; Wu, Z.Y.; Hu, S.; He, L.M.; Su, S.; Wang, Y.; Jiang, L.; Xiang, J. Sulfur self-doped char with high specific capacitance derived from waste tire: Effects of pyrolysis temperature. Sci. Total Environ. 2020, 741, 140193. [Google Scholar] [CrossRef] [PubMed]
- Xu, J.Q.; Yu, J.X.; He, W.Z.; Huang, J.W.; Xu, J.S.; Li, G.M. Replacing commercial carbon black by pyrolytic residue from waste tire for tire processing: Technically feasible and economically reasonable. Sci. Total Environ. 2021, 793, 148597. [Google Scholar] [CrossRef] [PubMed]
- Xu, J.Q.; Yu, J.X.; He, W.Z.; Huang, J.W.; Xu, J.S.; Li, G.M. Recovery of carbon black from waste tire in continuous commercial rotary kiln pyrolysis reactor. Sci. Total Environ. 2021, 772, 145507. [Google Scholar] [CrossRef]
- Xu, J.Q.; Yu, J.X.; Xu, J.L.; Sun, C.L.; He, W.Z.; Huang, J.W.; Li, G.M. High-value utilization of waste tires: A review with focus on modified carbon black from pyrolysis. Sci. Total Environ. 2020, 742, 140235. [Google Scholar] [CrossRef]
- Leeder, W.R. Additions of discarded automobile tyres to coke-oven blends. Fuel 1974, 53, 283–284. [Google Scholar] [CrossRef]
- Chaala, A.; Roy, C. Production of coke from scrap tire vacuum pyrolysis oil. Fuel Processing Technol. 1996, 46, 227–239. [Google Scholar] [CrossRef]
- Acevedo, B.; Barriocanal, C.; Alvarez, R. Pyrolysis of blends of coal and tyre wastes in a fixed bed reactor and a rotary oven. Fuel 2013, 113, 817–825. [Google Scholar] [CrossRef]
- Han, M.C.; He, H.W.; Kong, W.K.; Dong, K.; Wang, B.Y.; Yan, X.; Wang, L.M.; Ning, X. High-performance electret and antibacterial polypropylene meltblown nonwoven materials doped with boehmite and ZnO nanoparticles for air filtration. Fibers Polym. 2022, 23, 1947–1955. [Google Scholar] [CrossRef]
- Cheng, Z.L.; Guo, Z.G.; Fu, P.; Yang, J.; Wang, Q.W. New insights into the effects of methane and oxygen on heat/mass transfer in reactive porous media. Int. Commun. Heat Mass Transf. 2021, 129, 105652. [Google Scholar] [CrossRef]
- Liu, Y.; Zhang, Z.L.; Liu, X.; Wang, L.; Xia, X.H. Ore image classification based on small deep learning model: Evaluation and optimization of model depth, model structure and data size. Miner. Eng. 2021, 172, 107020. [Google Scholar] [CrossRef]
- Fernandez, A.M.; Barriocanal, C.; Gupta, S.; French, D. Effect of blending carbon-bearing waste with coal on mineralogy and reactivity of cokes. Energy Fuels 2014, 28, 291–298. [Google Scholar] [CrossRef]
- Fernández, A.M.; Barriocanal, C.; Díaz-Faes, E. Recycling tyre wastes as additives in industrial coal blends for cokemaking. Fuel Processing Technol. 2015, 132, 173–179. [Google Scholar] [CrossRef]
- Qin, X.; Xu, H.S.; Zhang, G.G.; Wang, J.D.; Wang, Z.; Zhao, Y.Q.; Wang, Z.Y.; Tan, T.W.; Bockstaller, M.R.; Zhang, L.Q.; et al. Enhancing the performance of rubber with nano ZnO as activators. ACS Appl. Mater. Interfaces 2020, 12, 48007–48015. [Google Scholar] [CrossRef]
- Rhodes, E.P.; Ren, Z.Y.; Mays, D.C. Zinc leaching from tire crumb rubber. Environ. Sci. Technol. 2012, 46, 12856–12863. [Google Scholar] [CrossRef]
- Esezobor, D.E.; Balogun, S.A. Zinc accumulation during recycling of iron oxide wastes in the blast furnace. Ironmak. Steelmak. 2006, 33, 419–425. [Google Scholar] [CrossRef]
- Zhang, F.; An, S.L.; Luo, G.P.; Zhang, S.Z. Behaviours of zinc and lead in blast furnace of Baotou iron and steel group Co. Adv. Mater. Res. 2011, 194, 306–309. [Google Scholar] [CrossRef]
- Stepin, G.M.; Mkrtchan, L.S.; Dovlyadov, I.V.; Borshchevskii, I.K. Problems related to the presence of Zinc in Russian blast-furnace smelting and ways of solving them. Metallurgist 2001, 45, 382–390. [Google Scholar] [CrossRef]
- Trinkel, V.; Mallow, O.; Thaler, C.; Schenk, J.; Rechberger, H.; Fellner, J. Behavior of chromium, nickel, lead, zinc, cadmium, and mercury in the blast furnace-a critical review of literature data and plant investigations. Ind. Eng. Chem. Res. 2015, 54, 11759–11771. [Google Scholar] [CrossRef]
- Yang, X.F.; Chu, M.S.; Shen, F.M.; Zhang, Z.M. Mechanism of zinc damaging to blast furnace tuyere refractory. Acta Metall. Sin.-Engl. 2009, 22, 454–460. [Google Scholar] [CrossRef]
- Li, K.J.; Zhang, J.L.; Liu, Z.J.; Wang, T.Q.; Ning, X.J.; Zhong, J.B.; Xu, R.S.; Wang, G.W.; Ren, S.; Yang, T.J. Zinc accumulation and behavior in tuyere coke. Metall. Mater. Trans. B 2014, 45, 1581–1588. [Google Scholar] [CrossRef]
- Zeng, X.W.; Zheng, S.; Zhou, H.C. The phenomena of secondary weight loss in high-temperature coal pyrolysis. Energy Fuels 2017, 31, 10178–10185. [Google Scholar] [CrossRef]
- Jones, I.; Preciado-Hernandez, J.; Zhu, M.M.; Zhang, J.; Zhang, Z.Z.; Zhang, D.K. Utilisation of spent tyre pyrolysis char as activated carbon feedstock: The role, transformation and fate of Zn from the perspective of production. Waste Manag. 2021, 126, 549–558. [Google Scholar] [CrossRef]
- Darmstadt, H.; Roy, C.; Kaliaguine, S. Characterization of pyrolytic carbon blacks from commercial tire pyrolysis plants. Carbon 1995, 33, 1449–1455. [Google Scholar] [CrossRef]
- Mis-Fernandez, R.; Azamar-Barrios, J.A.; Rios-Soberanis, C.R. Characterization of the powder obtained from wasted tires reduced by pyrolysis and thermal shock process. J. Appl. Res. Technol. 2008, 6, 95–104. [Google Scholar] [CrossRef]
- Ilnicka, A.; Okonski, J.; Cyganiuk, A.W.; Patyk, J.; Lukaszewicz, J.P. Zinc regarding the utilization of waste tires by pyrolysis. Pol. J. Environ. Stud. 2016, 25, 2683–2687. [Google Scholar] [CrossRef]
- Cataldo, F. On the characterisation of carbon black from tire pyrolysis. Fuller. Nanotub. Carbon Nanostructures 2020, 28, 368–376. [Google Scholar] [CrossRef]
- Zhou, Q.Q.; Yang, S.S.; Wang, H.T.; Liu, Z.Y.; Zhang, L. Selective deoxygenation of biomass volatiles into light oxygenates catalysed by S-doped, nanosized zinc-rich scrap tyre char with in-situ formed multiple acidic sites. Appl. Catal. B Environ. 2021, 282, 119603. [Google Scholar] [CrossRef]
- Wang, B.; Li, W.; Ma, C.; Yang, W.; Pudasainee, D.; Gupta, R.; Sun, L. Synergistic effect on the co-gasification of petroleum coke and carbon-based feedstocks: A state-of-the-art review. J. Energy Inst. 2022, 102, 1–13. [Google Scholar] [CrossRef]
- Liu, Y.; Zhang, Z.L.; Liu, X.; Wang, L.; Xia, X.H. Efficient image segmentation based on deep learning for mineral image classification. Adv. Powder Technol. 2021, 32, 3885–3903. [Google Scholar] [CrossRef]
- Zhang, X.Y.; Ma, F.N.; Dai, Z.X.; Wang, J.; Chen, L.; Ling, H.; Soltanian, M.R. Radionuclide transport in multi-scale fractured rocks: A review. J. Hazard. Mater. 2022, 424, 127550. [Google Scholar] [CrossRef]
- Banerjee, S.S.; Hait, S.; Natarajan, T.S.; Wießner, S.; Stöckelhuber, K.W.; Jehnichen, D.; Janke, A.; Fischer, D.; Heinrich, G.; Busfield, J.J.; et al. Water-responsive and mechanically adaptive natural rubber composites by in situ modification of mineral filler structures. J. Phys. Chem. B 2019, 123, 5168–5175. [Google Scholar] [CrossRef] [PubMed]
- Wang, X.D.; Summers, C.J.; Wang, Z.L. Mesoporous single-crystal ZnO nanowires epitaxially sheathed with Zn2SiO4. Adv. Mater. 2004, 16, 1215–1218. [Google Scholar] [CrossRef]
- Yang, H.P.; Chen, H.P.; Ju, F.D.; Yan, R.; Zhang, S.H. Influence of pressure on coal pyrolysis and char gasification. Energy Fuels 2007, 21, 3165–3170. [Google Scholar] [CrossRef]
- Chen, H.P.; Luo, Z.W.; Yang, H.P.; Ju, F.D.; Zhang, S.H. Pressurized pyrolysis and gasification of Chinese typical coal samples. Energy Fuels 2008, 22, 1136–1141. [Google Scholar] [CrossRef]
- Cheng, J.; Zhang, Y.S.; Wang, T.; Norris, P.; Chen, W.Y.; Pan, W.P. Thermogravimetric-Fourier transform infrared spectroscopy-gas chromatography/mass spectrometry study of volatile organic compounds from coal pyrolysis. Energy Fuels 2017, 31, 7042–7051. [Google Scholar] [CrossRef]
- Seidelt, S.; Müller-Hagedorn, M.; Bockhorn, H. Description of tire pyrolysis by thermal degradation behavior of main components. J. Anal. Appl. Pyrolysis 2006, 75, 11–18. [Google Scholar] [CrossRef]
- Yu, D.; Ma, Z.; Wang, R. Efficient smart grid load balancing via fog and cloud computing. Math. Probl. Eng. 2022, 3151249. [Google Scholar] [CrossRef]
- Osipov, A.A.; Ul’yanov, V.V.; Gulevskii, V.A.; Mel’nikov, V.P.; Kharchuk, S.E. Thermodynamics of processes in the liquid-metal pyrolysis of waste car tires. Theor. Found. Chem. Eng. 2019, 53, 1035–1047. [Google Scholar] [CrossRef]
- Selbes, M.; Yilmaz, O.; Khan, A.A.; Karanfil, T. Leaching of DOC, DN, and inorganic constituents from scrap tires. Chemosphere 2015, 139, 617–623. [Google Scholar] [CrossRef] [PubMed]
- Larionov, K.B.; Slyusarskiy, K.V.; Ivanov, A.A.; Mishakov, I.V.; Pak, A.Y.; Jankovsky, S.A.; Stoyanovskii, V.O.; Vedyagin, A.A.; Gubin, V.E. Comparative analysis of the characteristics of carbonaceous material obtained via single-staged steam pyrolysis of waste tires. J. Air Waste Manag. 2022, 72, 161–175. [Google Scholar] [CrossRef] [PubMed]


| Amples | Proximate Analysis | Elemental Analysis | Zn (wt.% a) | ||||||
|---|---|---|---|---|---|---|---|---|---|
| Moisture (wt.%) | Ash (wt.% a) | VM b (wt.% a) | C (wt.% c) | N (wt.% c) | H (wt.% c) | S (wt.% c) | O (wt.% c) | ||
| Coal | 1.85 | 7.36 | 26.24 | 89.14 | 1.60 | 1.78 | 0.92 | 6.56 | 0.01 |
| WT-1 | 1.35 | 7.00 | 62.02 | 87.93 | 0.62 | 3.81 | 1.67 | 5.97 | 2.17 |
| WT-2 | 1.40 | 9.24 | 60.36 | 85.82 | 0.60 | 4.31 | 1.88 | 7.39 | 2.13 |
| WT-3 | 1.50 | 9.79 | 67.68 | 83.94 | 0.60 | 4.28 | 2.07 | 9.11 | 2.24 |
| Samples | Al (wt.%) | Ca (wt.%) | Fe (wt.%) | Mg (wt.%) | Si (wt.%) | Ti (wt.%) |
|---|---|---|---|---|---|---|
| Coal | 1.23 | 0.27 | 0.33 | 0.025 | 1.51 | 0.053 |
| WT-2 | 0.038 | 0.29 | 0.13 | 0.042 | 1.01 | 0.006 |
Publisher’s Note: MDPI stays neutral with regard to jurisdictional claims in published maps and institutional affiliations. |
© 2022 by the authors. Licensee MDPI, Basel, Switzerland. This article is an open access article distributed under the terms and conditions of the Creative Commons Attribution (CC BY) license (https://creativecommons.org/licenses/by/4.0/).
Share and Cite
Lan, Y.; Jin, S.; Wang, J.; Wang, X.; Zhang, R.; Ling, L.; Jin, M. Effects of S and Mineral Elements (Ca, Al, Si and Fe) on Thermochemical Behaviors of Zn during Co-Pyrolysis of Coal and Waste Tire: A Combined Experimental and Thermodynamic Simulation Study. Processes 2022, 10, 1635. https://doi.org/10.3390/pr10081635
Lan Y, Jin S, Wang J, Wang X, Zhang R, Ling L, Jin M. Effects of S and Mineral Elements (Ca, Al, Si and Fe) on Thermochemical Behaviors of Zn during Co-Pyrolysis of Coal and Waste Tire: A Combined Experimental and Thermodynamic Simulation Study. Processes. 2022; 10(8):1635. https://doi.org/10.3390/pr10081635
Chicago/Turabian StyleLan, Yaxin, Shuangling Jin, Jitong Wang, Xiaorui Wang, Rui Zhang, Licheng Ling, and Minglin Jin. 2022. "Effects of S and Mineral Elements (Ca, Al, Si and Fe) on Thermochemical Behaviors of Zn during Co-Pyrolysis of Coal and Waste Tire: A Combined Experimental and Thermodynamic Simulation Study" Processes 10, no. 8: 1635. https://doi.org/10.3390/pr10081635