Article

Effects of S and Mineral Elements (Ca, Al, Si and Fe) on Thermochemical Behaviors of Zn during Co-Pyrolysis of Coal and Waste Tire: A Combined Experimental and Thermodynamic Simulation Study

1
School of Materials Science and Engineering, Shanghai Institute of Technology, Shanghai 201418, China
2
State Key Laboratory of Chemical Engineering, East China University of Science and Technology, Shanghai 200237, China
*
Authors to whom correspondence should be addressed.
Processes 2022, 10(8), 1635; https://doi.org/10.3390/pr10081635
Submission received: 26 July 2022 / Revised: 12 August 2022 / Accepted: 15 August 2022 / Published: 18 August 2022

Abstract

:
The transformation behaviors of Zn during co-pyrolysis of waste tires and coal were studied in a fixed-bed reaction system. The effects of pyrolysis temperature and the Zn content of coal mixture on the Zn distributions in the pyrolytic products (coke, tar and gas) were investigated in detail. It is found that the relative percentages of Zn in the pyrolytic products are closely related to the contents of S and mineral elements (Ca, Al, Si and Fe) in the coal. The thermodynamic equilibrium simulations conducted using FactSage 8.0 show that S, Al and Si can interact with Zn to inhibit the volatilization of Zn from coke. The reaction sequence with Zn is S > Al > Si, and the thermal stability of products is in the order of ZnS > ZnAl2O4 > Zn2SiO4. These results provide insights into the migration characteristics of Zn during co-pyrolysis of coal and waste tires, which is vital to the prevention and control of Zn emissions to reduce the environmental burden.

1. Introduction

With the rapid development of the automobile industry, the disposal of increasing non-biodegradable waste tires has brought a great burden on the natural environment. After the removal of steel, carcass and textiles, the tire material generally consists of synthetic and natural rubber, carbon black, and inorganic components such as ZnO and SiO2 [1,2,3,4]. The carbon content of waste tires exceeds 80% and the ash content is comparable to that of coal [4,5]. The moisture content of waste tires is relatively low in comparison with other alternative energy sources such as municipal solid waste (MSW) or biomass [4,5]. In addition, the waste tires possess a high calorific value of 30–40 MJ/kg, which is larger than those of coal and other solid fuels [1,2,3,4,5,6]. Considering these characteristics, combustion, gasification and pyrolysis are proposed as the potential approaches to utilizing waste tires [7,8,9,10,11,12,13,14,15,16,17,18,19,20,21,22,23,24,25,26,27]. The pyrolysis of waste wires in an inert atmosphere can produce 10–30% of gas, 38–55% of pyrolytic oil and 33–38% of char, all of which are valuable products [17,18,19,20,21]. The pyrolysis gas is composed of methane, ethane, butadiene, hydrogen and other hydrocarbons with a high calorific value (37–42 MJ/kg), which can be used as a source of energy for the pyrolysis process itself and other required processes [19,20,21,22,23]. The tire pyrolysis oil (TPO) is a complex of C5-C20 hydrocarbons containing paraffins, olefins and aromatic compounds with a high calorific value of 41–44 MJ/kg, which can be employed as a substitute for diesel fuel to reduce fossil fuel consumption and as a high value-added chemical source for producing benzene, toluene, xylenes, isoprene and limonene [20,21,22,23]. The produced char has a calorific value of 30–40 MJ/kg and can be used as a fuel [23]. Additionally, the char can be reused as a low-quality carbon black in the tire industry because it contains high contents of ash (12–16%), S (1.8–4%) and Zn (3–5%) and as high-quality activated carbon via activation using steam or carbon dioxide as activation agents for adsorption, catalysis and electrochemical applications [24,25,26,27].
Apart from classic pyrolysis, the co-pyrolysis of waste tires with coal for metallurgical coke production is considered an economical route for recycling waste products in the cokemaking process, decreasing coal consumption and reducing the cost of waste disposal without causing an apparent deterioration in coke quality under suitable conditions [28,29,30,31,32]. W.R. Leeder studied the effect of particle size of waste tires on the quality of coke and found that 5 wt.% of finely pulverized tires can be incorporated into coal blends without weakening the coke quality, but the coke yield is reduced because of the higher volatile matter of tires [28]. C. Barriocanal et al. compared the yields and characteristics of pyrolysis products from blends of coal and tire wastes in a fixed bed (FB) and a rotary oven (RO) [30]. It was found that the char yields obtained in the two configurations were similar and the RO promoted the production of gas while the FB produced a higher amount of oil. The pore characteristics of chars obtained from the two ovens were similar and the chars generated from the waste tires are mainly mesoporous whereas that from the coal contained a larger amount of macro- and micropores [31,32,33]. The oil produced in the RO was more aromatic and contained a smaller number of oxygen functional groups due to their higher residence time in the hot zone of the reactor. A.M. Fernández et al. found that the decrease in the fluidity of industrial coal blends after the addition of tire wastes and the ash composition of tires contributed to the deterioration in coke quality [34,35]. They found that the presence of Zn-bearing phases in the tire wastes increased the coke reactivity and proposed that a small number of waste tires (2 wt.%) should be incorporated into the industrial coal blends to guarantee coke quality and good blast furnace performance.
ZnO, as an activator for sulfur vulcanization, is widely used in tire rubber manufacturing with a weight content of 1–2% [36,37]. Zn is also known as a deleterious element for the production and life of the blast furnace [35,36,37,38,39,40], which is present in the blast furnace as a component of sinter charge or the coke in the form of an oxide (ZnO) and a sulphide (ZnS) and can be reduced by CO or carbon to metallic Zn [38,39]. The melting and boiling points of metallic Zn are 420 °C and 910 °C, respectively. Therefore, the metallic Zn is easily vaporized in the high-temperature regions and then condenses in the low-temperature zones or is re-oxidized to ZnO by CO2 and water vapor [40]. Consequently, reduction, vaporization, condensation, oxidation and circulation of Zn could occur in the blast furnace [38,41]. The harmful effects of Zn on blast furnaces have been investigated by several studies [42,43]. The Zn vapor can flow into the air holes of the refractory lining, then the deposition and/or the oxidation of Zn can give rise to internal stress, volume expansion and material damage [42]. The coke acts as a fuel, a reductant, structural support and a carburizer in the blast furnace [43]. The penetration and deposition of Zn in the coke pores can weaken the coke strength and accelerate the pulverization of coke. The Zn vapor can also react with the primary minerals near the coke pores to form new Zn-bearing compounds, resulting in the accumulation of Zn in the coke [43]. Meanwhile, Zn can catalyze the gasification reaction of coke, thus the high content of Zn will increase the coke reactivity index (CRI) and decrease the coke strength after reaction (CSR) [43].
As mentioned above, the presence of Zn in the coke is detrimental to the quality of coke and the production of a blast furnace. Actually, the volatilization and condensation of Zn vapor may also be harmful to the refractory materials of the coke oven during the co-pyrolysis of coal with waste tires. Therefore, it is essential to study the transformation behaviors of Zn during co-pyrolysis of waste tire and coal. The main mineral components in coal are SiO2, Al2O3, Fe2O3 and CaO [44]. Although the reactions between ZnO, carbon and S have been studied during the pyrolysis of waste tires alone [45,46,47,48,49,50], the impacts of inorganic components (Ca, Al, Si, Fe) originating from the coal on the Zn conversion and Zn distribution in the pyrolytic products during co-pyrolysis remain poorly understood. Considering these problems, the co-pyrolysis of coal and waste tires was carried out in a fixed bed reactor, and the Zn contents in the pyrolytic products (coke, tar and gas) with the different addition ratios of waste tires (or ZnO) at typical temperatures were studied. The mineral compositions of cokes were analyzed by XRD measurement. Meanwhile, the thermodynamic equilibrium calculations were conducted using FactSage 8.0 to simulate the thermochemical conversion behaviors and phase distributions of Zn and other mineral elements (Ca, Al, Si and Fe) under different co-pyrolysis conditions. Additionally, the consistency between the experimental results and the thermodynamic equilibrium analysis was verified [51,52,53].

2. Materials and Methods

2.1. Materials

An industrial coal blend provided by an iron-making plant in China was used as the base coal, and three kinds of waste rubber powders (WT-1, WT-2 and WT-3) gained from the tire recycling industry were employed as additives, which were obtained by the grinding of tread rubbers from truck (WT-1) and car (WT-2) tires and sidewall rubber (WT-3), respectively. Table 1 provides the proximate and elemental analyses of base coal and tire wastes. The moisture content of sample was obtained by drying at 105 °C to constant mass. The ash content of the sample was obtained by calcining in air at 800 °C to constant mass. The sample was heated at 900 °C for 7 min in air to measure the volatile matter content. The contents of C, H, O, N and S elements were determined on an elemental analyzer (Elementar-vario EL cube). The contents of Zn, Al, Ca, Fe, Mg, Si and Ti elements in coal and WT-2 were measured using inductively coupled plasma atomic emission spectrometry (ICP-AES) on Agilent 720 spectrometer, as listed in Table 2. It is shown that the chemical compositions of three tire wastes are similar, and their H, O, S and Zn contents are higher than the base coal. WT-2 was selected as the additive to study the Zn distributions in the pyrolytic products by fixed-bed pyrolysis experiments and the transformation behaviors of Zn via thermodynamic simulations using FactSage 8.0.

2.2. Experimental

The co-pyrolysis experiments were carried out on a temperature-controlled fixed-bed reactor system, which includes a heating, cooling and gas adsorption section, as illustrated in Figure 1. The coal was mixed with 1, 3 and 5 wt.% of WT-2 powders by ball milling, corresponding to 0.02, 0.06 and 0.1 wt.% of Zn in the hybrid, respectively. To further expand the scope of the study, the 1 and 5 wt.% of ZnO powders were also blended with the coal, related to 0.8 and 4 wt.% of Zn in the mixture, respectively. Then the blends were put into the quartz tube of fixed-bed reactor and heated to 700, 900 and 1050 °C and kept for 2 h with a heating rate of 5 °C/min in nitrogen, respectively. For comparison, the separate pyrolysis of coal or WT-2 was also conducted under the same condition. The produced tar was found to be condensed on the wall of the quartz tube and in the tar collector. To analyze the Zn content in tar, the quartz tube and tar collector were calcined in muffle furnace at 800 °C for 2 h and the obtained ash was dissolved in HCl aqueous solution (37.5 wt.%), which was subjected to inductively coupled plasma atomic emission spectrometry (ICP-AES) measurement. Additionally, the HCl aqueous solution in the gas absorber was also analyzed by ICP-AES to determine the amount of Zn vaporized into gas. Zn content in coke was determined by subtraction method.

2.3. Materials Characterization

The phase compositions of samples were analyzed by X-ray diffraction (XRD) on a Rigaku Smartlab 9 kw diffractometer with a Cu Kα radiation (λ = 0.15406 nm) in the 2θ range of 5–90° with a scanning rate of 10°/min. The thermal decomposition behaviors of samples were analyzed with thermogravimetric and differential scanning calorimetry (TG-DSC) on a Chi 449F3 thermogravimeter from room temperature to 1100 °C at a heating rate of 10 °C/min under a nitrogen flow.

2.4. Thermodynamic Equilibrium Simulation

In order to better understand the conversion behaviors of Zn during co-pyrolysis process, the thermodynamic equilibrium simulations were carried out using FactSage 8.0 based on the principle of Gibbs free energy minimization. The contents of C, H, O, N, S and mineral elements (Ca, Al, Si and Fe) of coal were used as the inputs. The amounts of S, Ca, Al, Si and Fe are 0.24, 0.07, 0.46, 0.53 and 0.06 mol per kg of coal, respectively. Additionally, the amount of Zn is 0.0019, 0.0052, 0.0117, 0.0182, 0.12 and 0.62 mol in per kg of coal when the Zn content is 0.01, 0.02, 0.06, 0.1, 0.8 and 4 wt.%, respectively. Equilibrium calculations were performed at the temperature range of 100–1500 °C with an interval of 100 °C in the nitrogen atmosphere under a pressure of 1 atm.

3. Results and Discussion

3.1. Phase Compositions of Coal and Tire Wastes

The phase compositions of coal and three tire wastes were analyzed by XRD, as shown in Figure 2a. The main compounds in coal are kaolinite Al2Si2O5(OH)4 (JCPDS 29-1488), quartz SiO2 (JCPDS 99-0088), goethite FeO(OH) (JCPDS 99-0055) and gypsum CaSO4(H2O)2 (JCPDS 06-0047). Calcite containing magnesium (Ca, Mg)CO3 (JCPDS 43-0697) is found in WT-2 and limestone CaCO3 (JCPDS 86-0174) exists in WT-3. CaSO4 (JCPDS 74-2421) and ZnO (JCPDS 99-0111) are detected in all three tire wastes. CaSO4 is commonly used in rubber modification, which can effectively improve the mechanical performance and thermal stability of rubber [54]. The XRD patterns of ashes obtained by the calcination of coal and tire wastes at 800 °C for 1 h are displayed in Figure 2b. SiO2, CaSO4 and Fe2O3 (JCPDS 85-0599) are detected in the ash of coal. The ashes of three tire wastes are composed of SiO2, CaSO4, ZnO and Zn2SiO4 (JCPDS 37-1485). Zn2SiO4 is formed by the reaction of ZnO and SiO2 at high temperatures [55].

3.2. TG-DSC Analysis

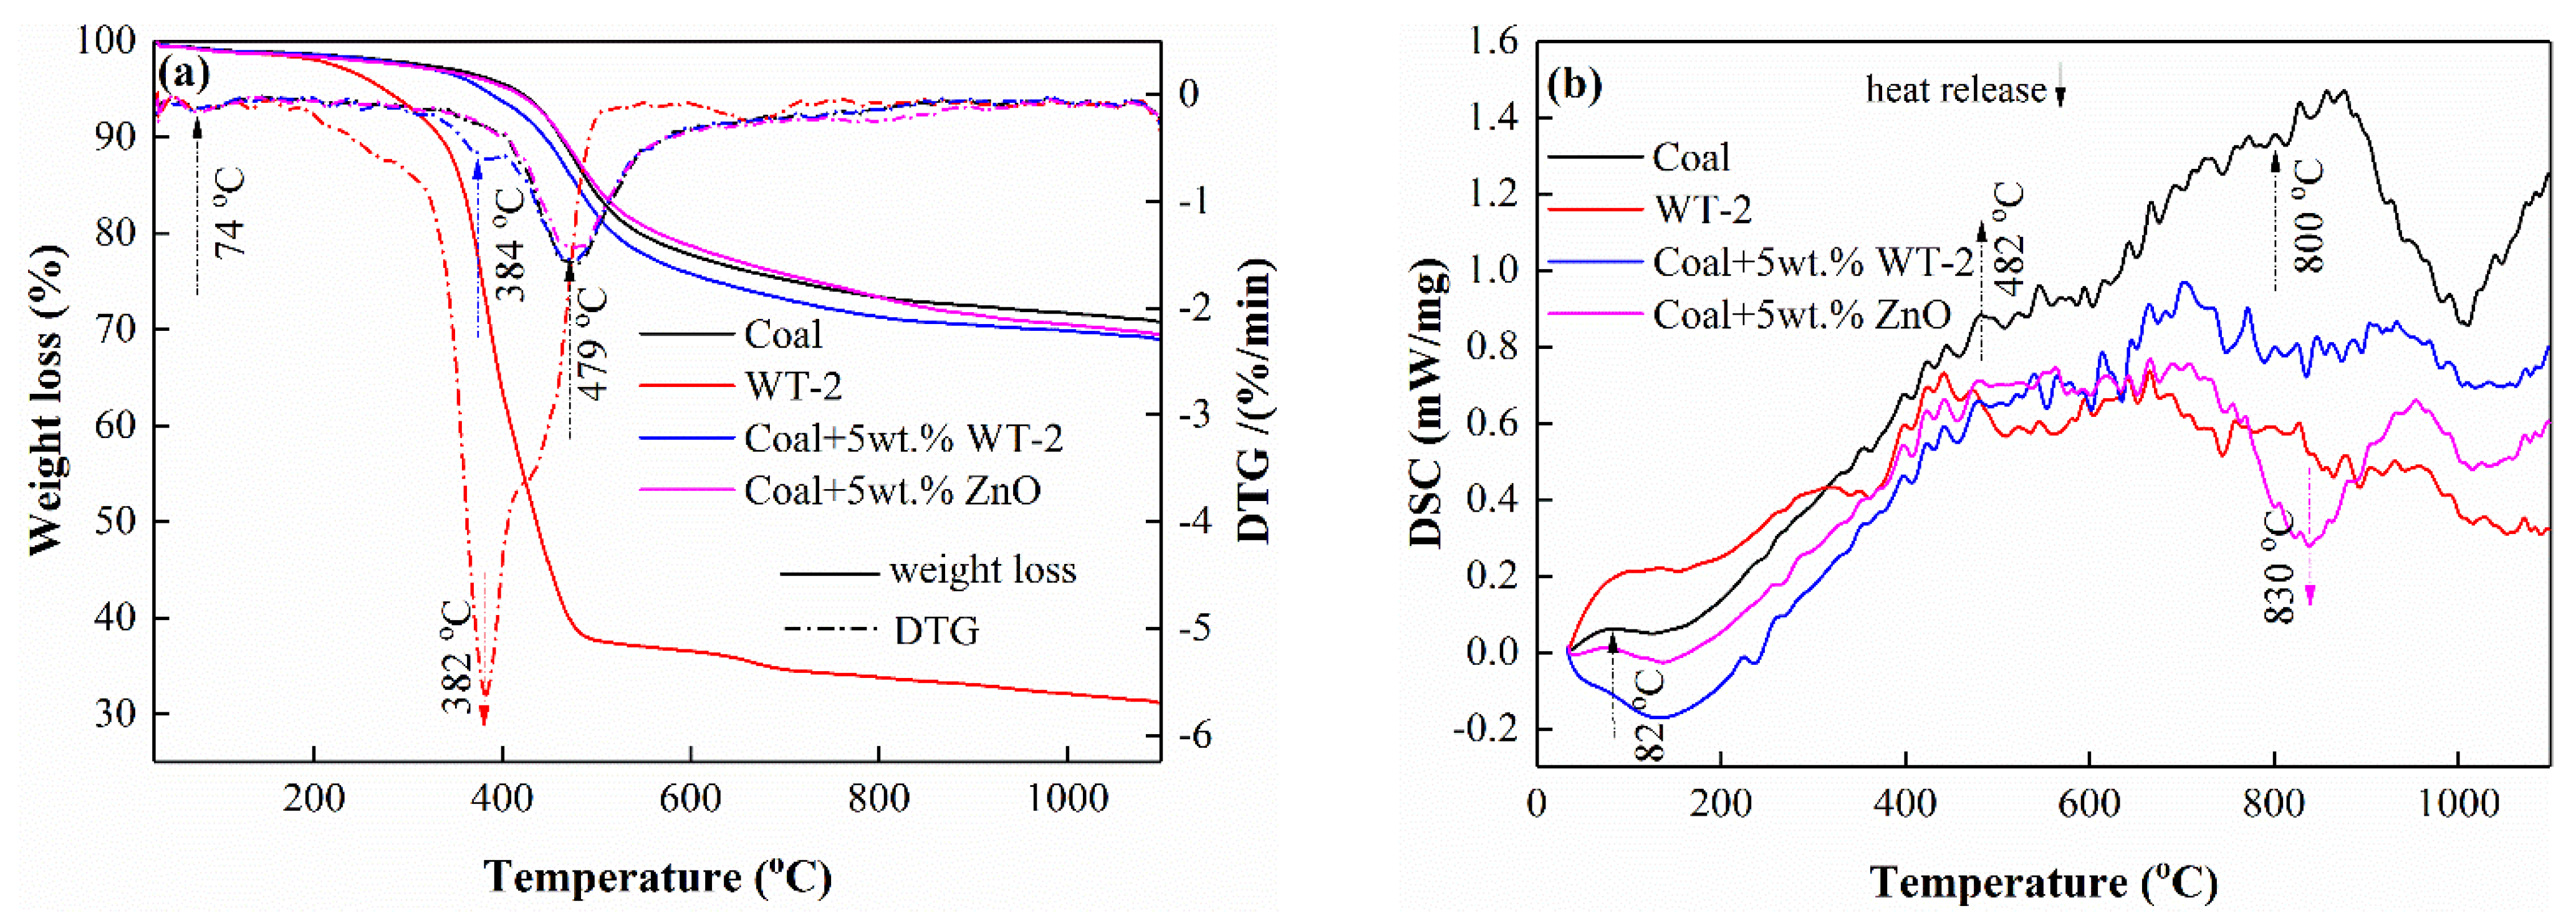
The influences of waste tires and ZnO additives on the thermal stability of coal were examined by TG-DSC measurements. The TG-DTG and DSC curves of coal, WT-2 and coal containing 5 wt.% of WT-2 or 5 wt.% of ZnO were displayed in Figure 3. The TG curve of coal can be divided into three stages, including dehydration, primary pyrolysis and secondary pyrolysis processes, giving rise to a total weight loss of 29.2% from room temperature to 1100 °C. The first stage from room temperature to 200 °C is attributed to the removal of physically adsorbed water, corresponding to a peak at 74 °C in the DTG curve and a small endothermic peak at around 82 °C in the DSC curve. The second weight loss takes place at 400–600 °C; meanwhile, a peak at 479 °C in the DTG curve and a broad endothermic peak at 482 °C in the DSC curve are observed, which is related to the primary pyrolysis of coal with the breaking and recombining of organic functional groups accompanied by the evolution of gas products such as CO2, CO, light aliphatics, CH4, H2O and so on [56,57,58]. The third stage occurs above 700 °C, which is assigned to the secondary pyrolysis of condensed carbon matrix with the release of CO and H2, corresponding to a broad endothermic peak at 600–1000 °C. The decomposition of waste tire WT-2 starts at 200 °C and a sharp DTG peak at 382 °C is observed to exhibit a weight loss of 68.9% up to 1100 °C. The low thermal stability of WT-2 should be due to the high volatile content and easily breakable molecular bonds of rubber [35,59]. The co-pyrolysis of coal with 5 wt.% of WT-2 displays an additional peak at 384 °C in the DTG curve and the weight loss increases by 1.7% up to 1100 °C compared with that of coal, indicating that more volatile matter is released after the addition of waste tire [60]. In comparison with coal, the DTG curve for a mixture of coal and 5 wt.% of ZnO shows an extra broad peak around 800 °C, and an exothermic peak at 830 °C in the DSC curve is detected, which is attributed to the carbothermal reduction of ZnO.

3.3. Phase Compositions of Cokes

The XRD patterns of cokes generated by the separate pyrolysis of coal and WT-2 are displayed in Figure 4. As shown in Figure 4a, SiO2 is detected in the coke obtained by the pyrolysis of coal at 700, 900 and 1050 °C. Additionally, CaS (JCPDS 08-0464) is found in the coke generated at 900 and 1050 °C. When the WT-2 pyrolyzes alone at 700 °C, the sphalerite ZnS (JCPDS 77-2100), ZnO, CaS and SiO2 are detected in the resultant coke. With the temperature rising, the diffraction peaks of ZnO disappear in the coke obtained at 900 °C and those of ZnS cannot be detected in the coke formed at 1050 °C, indicating that the ZnS is more stable than ZnO in the coke, but ZnS can also be reduced by carbon to metallic Zn vapor at high temperature.
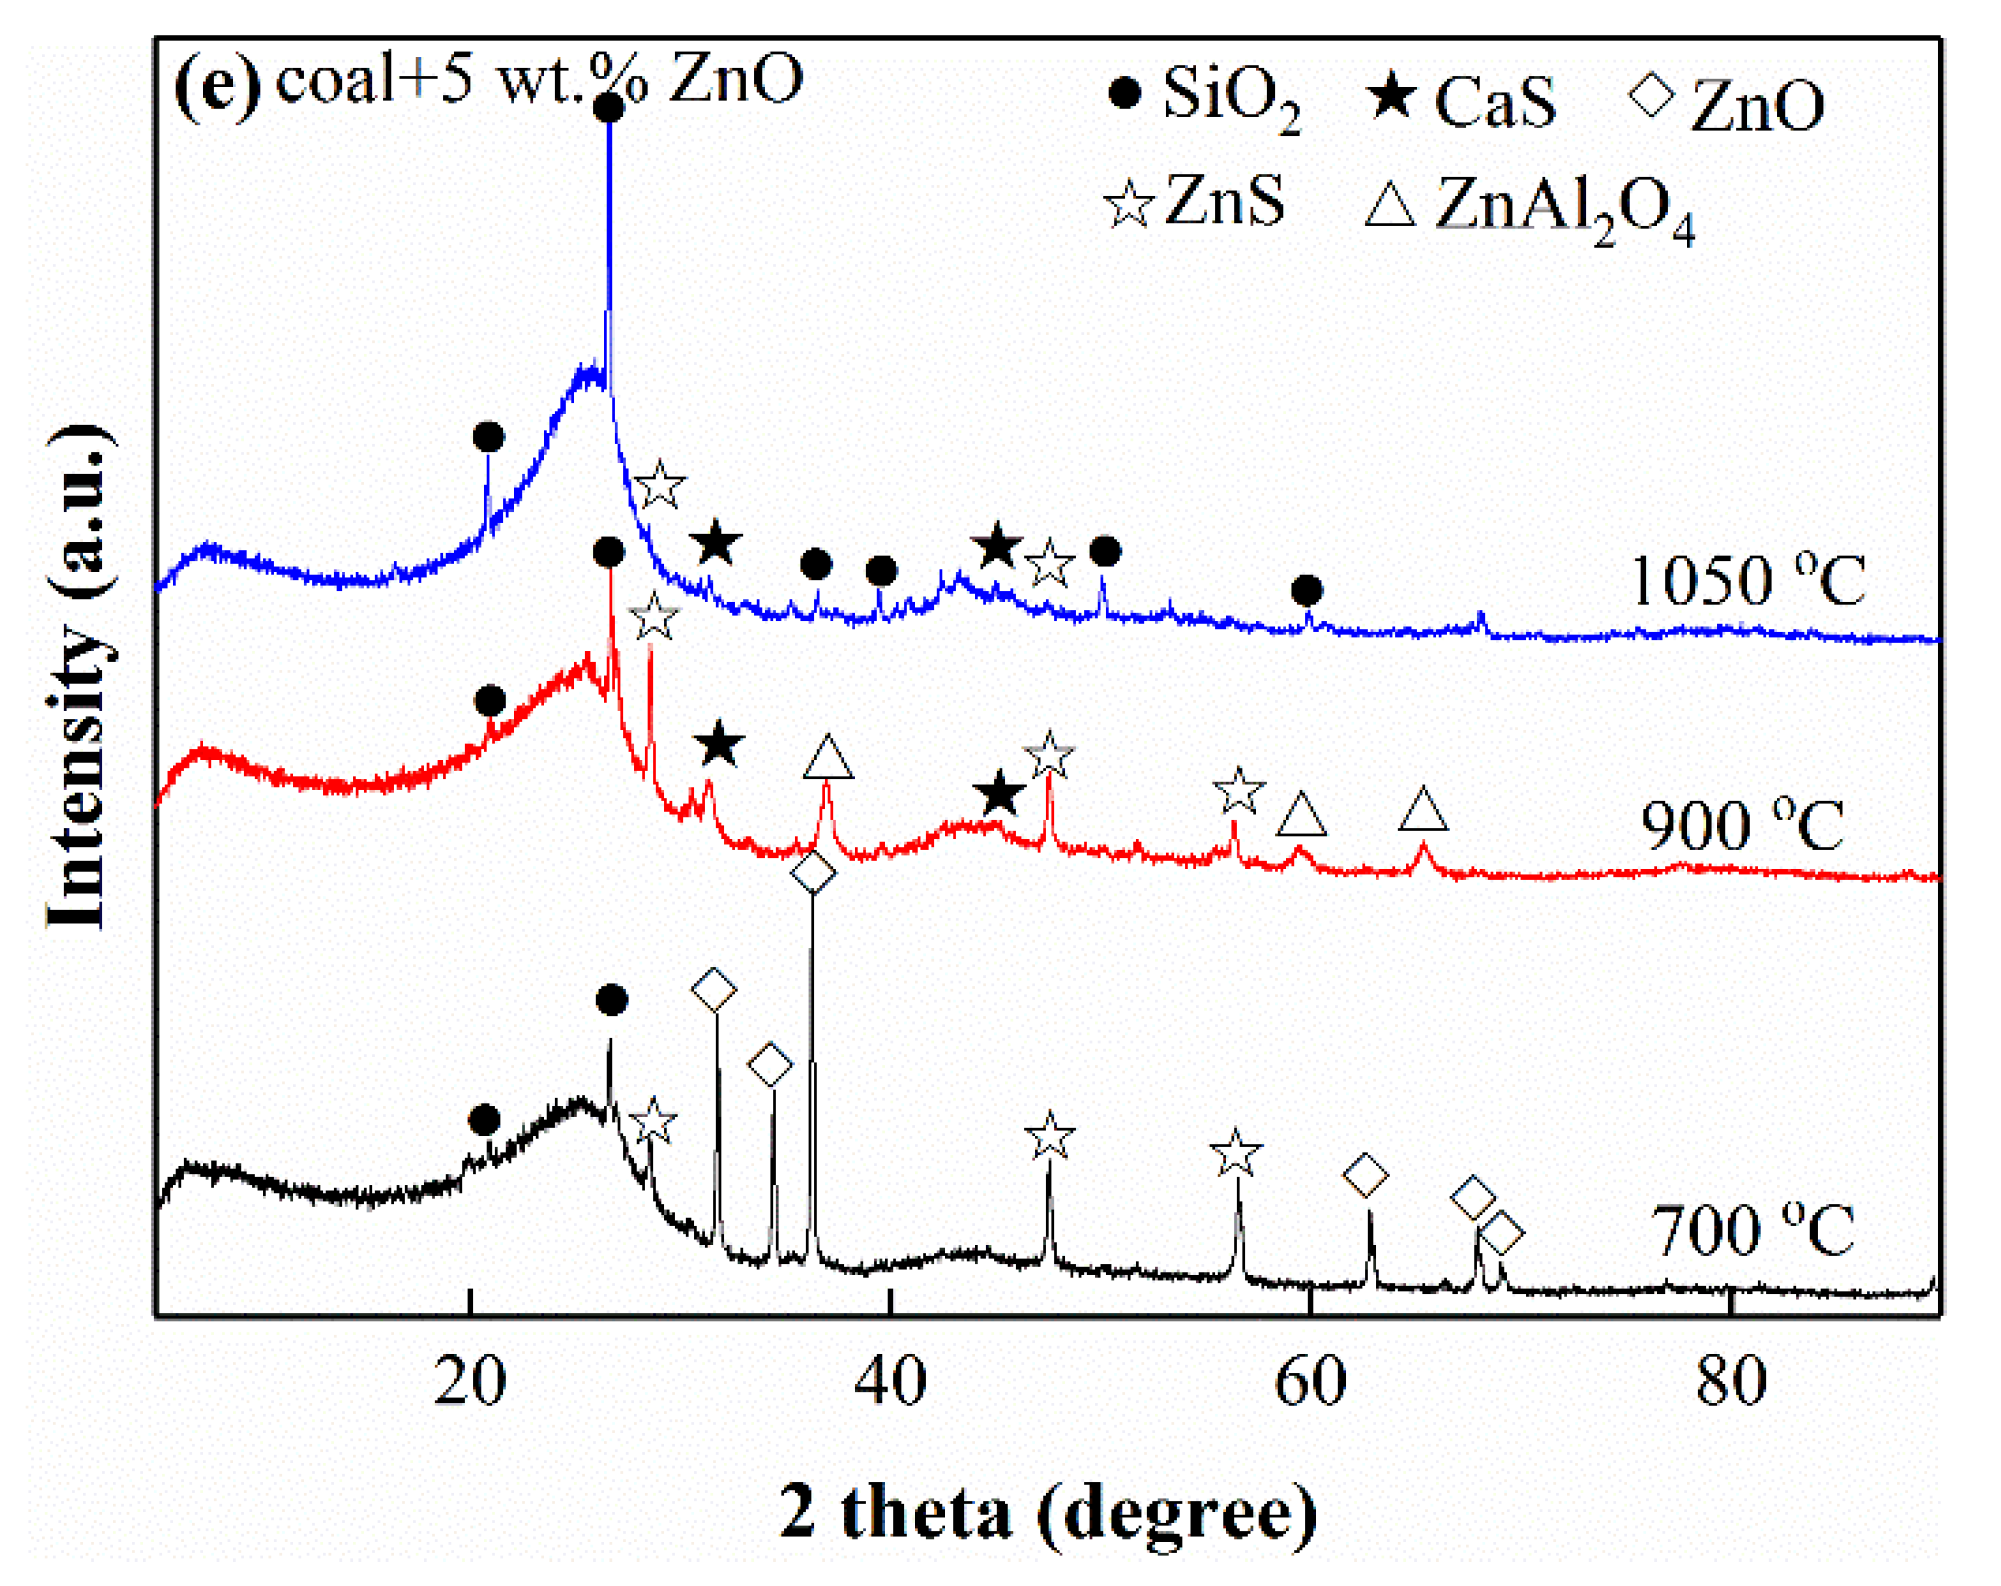
Figure 5 shows the XRD patterns of coke produced by pyrolysis of coal containing 1, 3 and 5 wt.% of WT-2, 1 and 5 wt.% of ZnO, corresponding to 0.02, 0.06, 0.1, 0.8 and 4 wt.% of Zn content in the blends, respectively. When the Zn content is low (0.06 and 0.1 wt.%), ZnS is only detected in the cokes obtained at 700 °C, and as the Zn content increases to 0.8 and 4 wt.%, ZnS exists in the cokes formed at 700–1050 °C. ZnS cannot be detected in the coke obtained by the pyrolysis of coal containing 0.02 wt.% of Zn, which should be due to the ultra-low content of Zn and the resultant ultra-fine crystallite size of ZnS. As the Zn content increases to 4 wt.%, ZnO and ZnS coexist in the coke produced at 700 °C. The diffraction peaks of ZnO vanish and those of ZnAl2O4 (JCPDS 73-1961) appear at 900 °C, whereas the ZnAl2O4 phase disappears and the diffraction peaks of ZnS become weak at 1050 °C. The above results show that Zn preferentially combines with S to generate ZnS, and when the Zn content exceeds the molar of S (4 wt.% of Zn), excess ZnO can react with Al2O3 to form ZnAl2O4, which is also not stable at 1050 °C and can be further reduced to metallic Zn vapor by carbon. Moreover, the CaS phase can be detected in the cokes formed at 700, 900 and 1050 °C when the Zn content is low (0.02, 0.06 and 0.1 wt.%), which can only be observed in the cokes obtained at 900 and 1050 °C as the Zn content increases to 0.8 and 4 wt.%. This suggests that the S preferentially binds with Zn rather than Ca because CaS can only be formed once some ZnS decomposes.

3.4. Migration of Zn during Pyrolysis

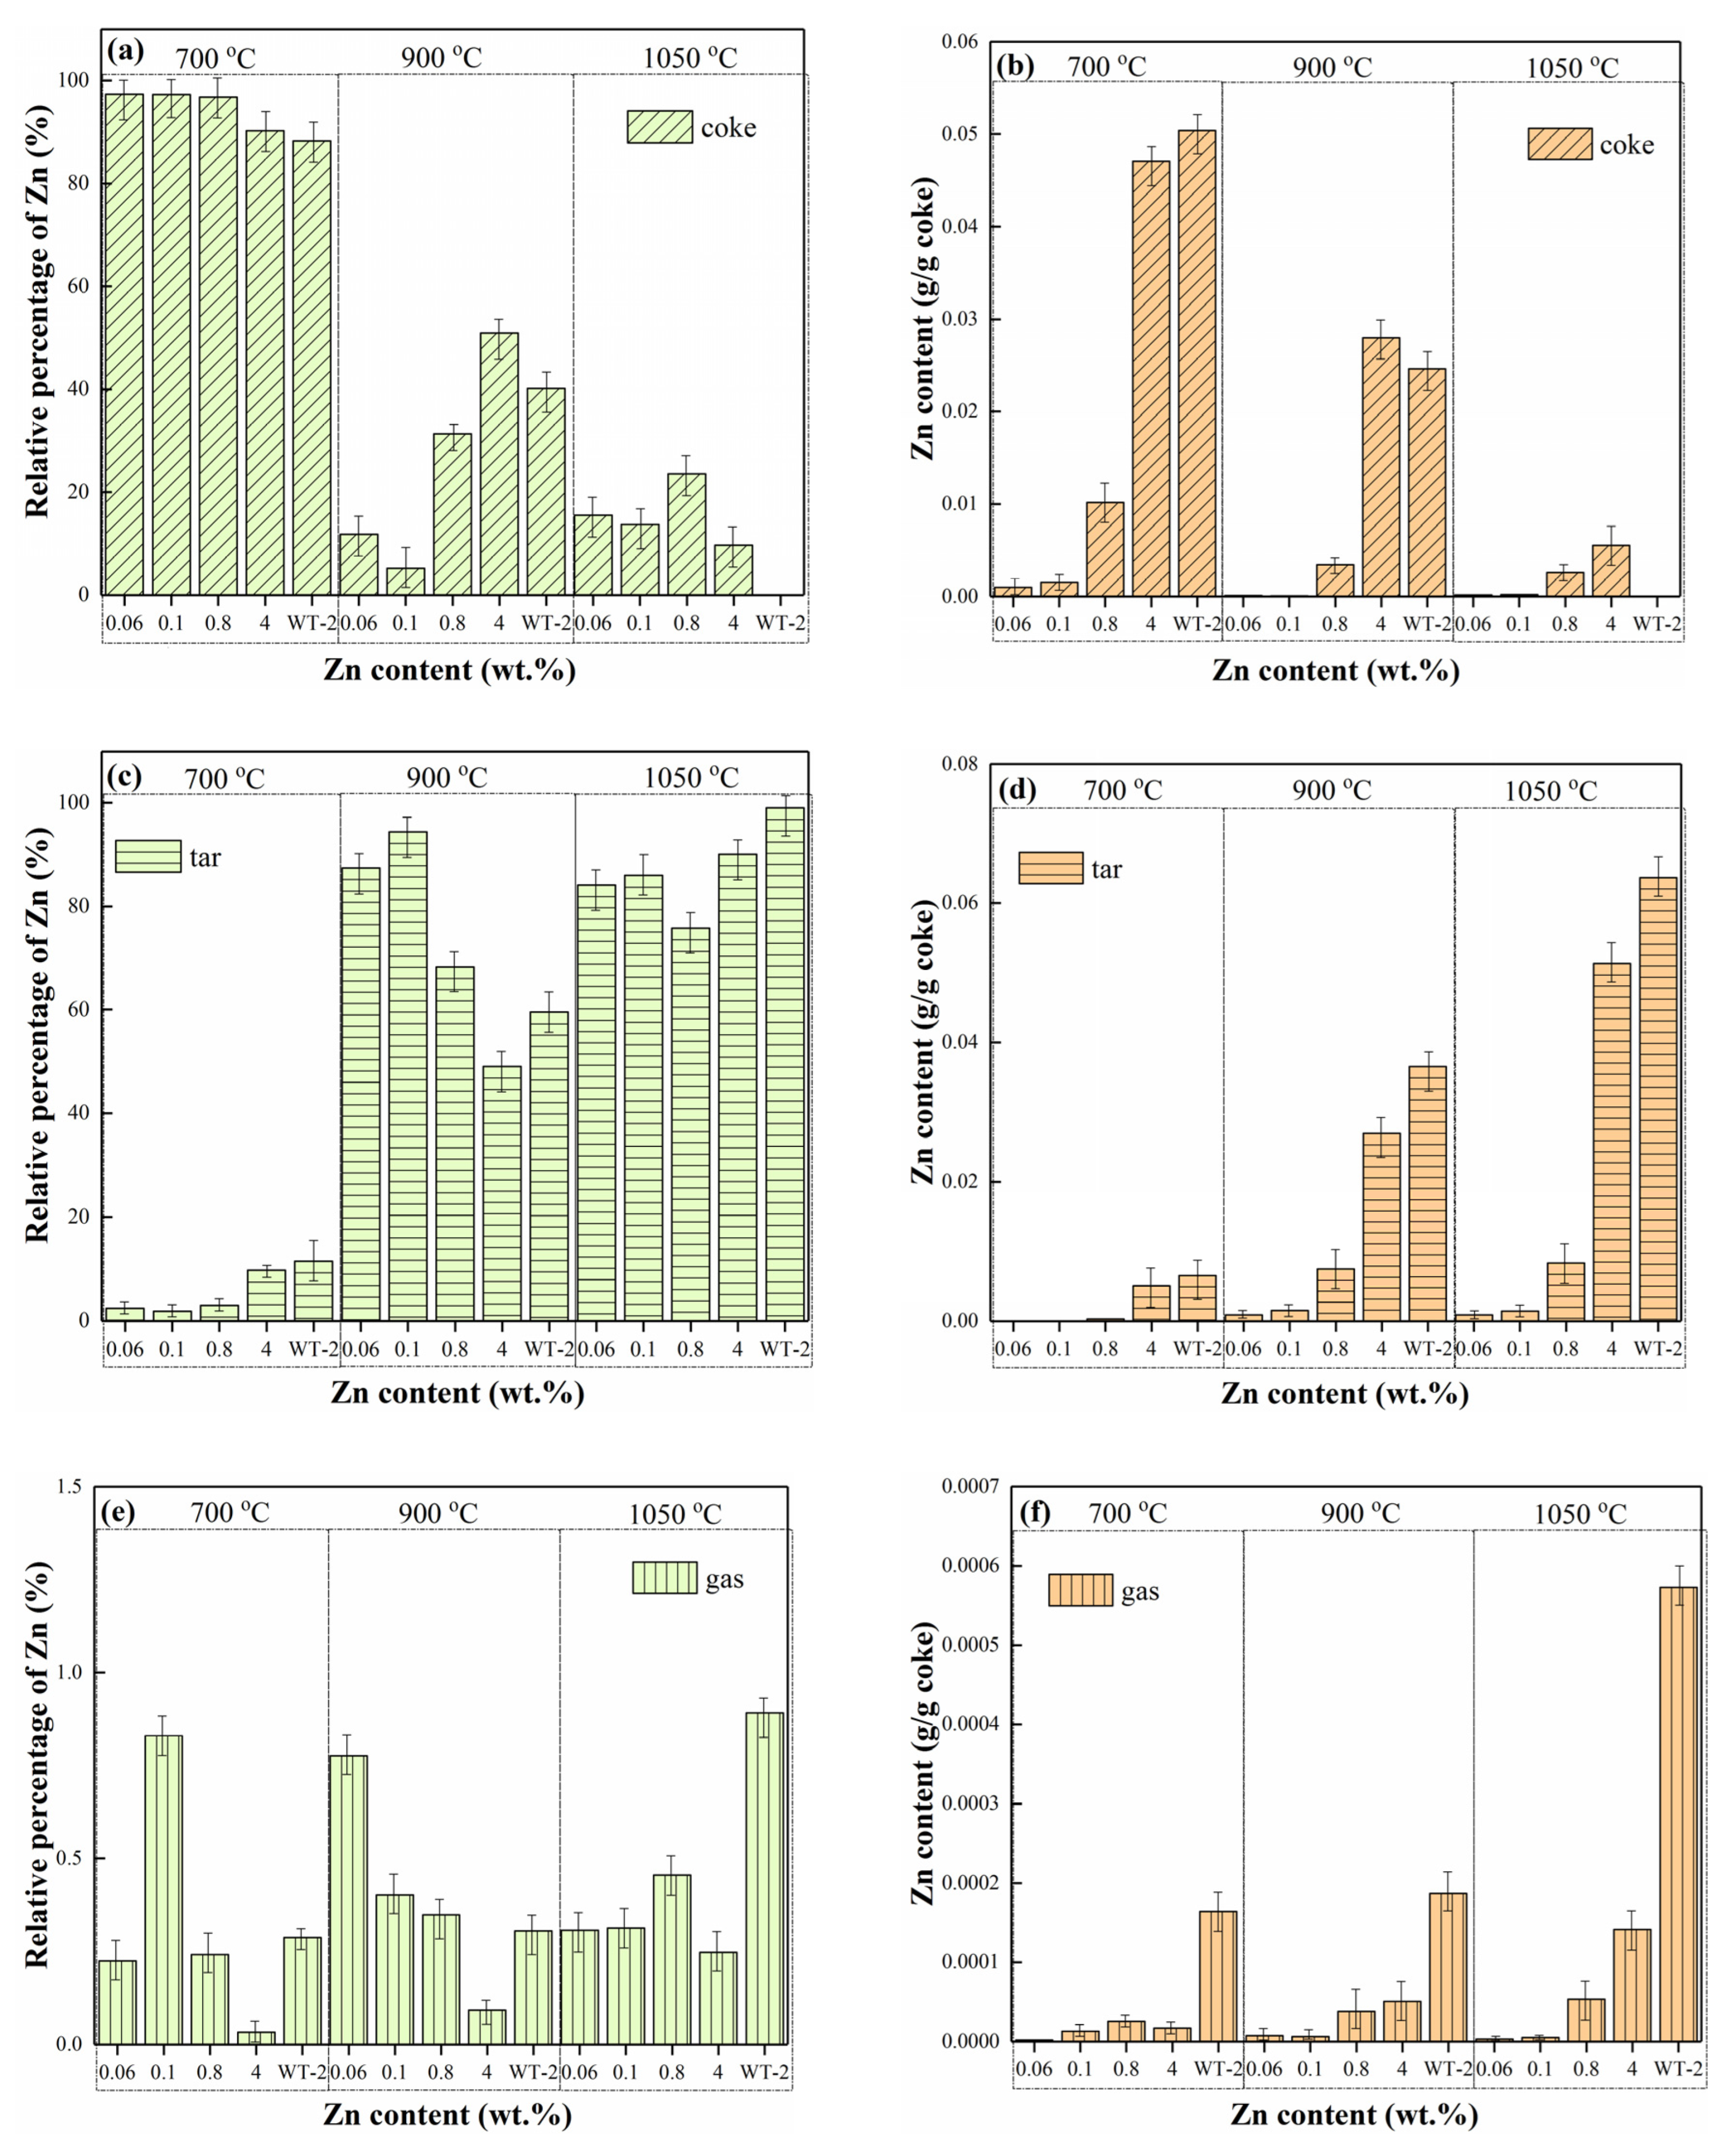
The mass distributions of Zn in the pyrolytic products (coke, tar and gas) under different pyrolysis conditions are listed in Table S1, and the corresponding relative percentages (%) and contents (g/g coke) of Zn are displayed in Figure 6. It should be emphasized that the results for separate pyrolysis of coal and co-pyrolysis of coal with 1 wt.% of WT-2 are not included due to the extremely low content of Zn in the pyrolytic products and the resultant large detection error. As shown in Figure 6a, c and e, the relative percentages of Zn in the coke decrease with the temperature increasing. The Zn residual rate in the coke produced at 700 °C is 97.4%, 97.3% and 96.8% as the Zn content is 0.06, 0.1 and 0.8 wt.% in the coal mixture, which declines to 90.3% when the Zn content is 4 wt.%. When the co-pyrolysis temperature rises to 900 and 1050 °C, most of the Zn escapes from the coke and enters into the tar. Moreover, the residual rate of Zn in the coke obtained at 900 °C when the Zn content is 0.8 and 4 wt.% is higher than that of coke produced from the coal containing 0.06 and 0.1 wt.% of Zn. Additionally, the residual rate of Zn in the coke obtained at 1050 °C from the coal owning 4 wt.% of Zn is slightly lower than that of coke produced from the coal containing 0.06, 0.1 and 0.8 wt.% of Zn. The Zn contents in the pyrolytic products were also calculated based on the per gram coke, as shown in Figure 6b,d,f. It is shown that the Zn content of obtained coke increases with the increase of Zn content in the coal at the same pyrolysis temperature and decreases with the increase of pyrolysis temperature under the same Zn content of coal. The Zn content of coke formed at 700 °C is highest as the coal containing 4 wt.% of Zn, reaching 0.047 g/g coke and the largest amount of Zn (0.051 g/g coke) migrates into the tar produced at 1050 °C from the coal owning 4 wt.% of Zn. When the WT-2 pyrolyzes alone, the Zn residual rate in the coke obtained at 700 °C is 88.3% and then decreases to 40.2% and 0.05% at 900 and 1050 °C, respectively (Figure 6a). Compared with the co-pyrolysis of coal and WT-2, the coke yield by separate pyrolysis of WT-2 is almost reduced by half (Table S1), which results in the enhancement of Zn content calculated based on the per gram coke in the pyrolytic products (Figure 6b,d,f).
To sum up, when the coal containing 0.06, 0.1 and 0.8 wt.% of Zn (the molar ratio of Zn to S < 1) pyrolyzes at 700 °C, Zn is fixed in coke in the form of ZnS, resulting in a 97% Zn residual rate in coke. When the molar of Zn exceeds that of S (4 wt.% of Zn), ZnO and ZnS coexist in the coke produced at 700 °C and partial ZnO is reduced to gaseous Zn by carbon, causing a slight decrease in Zn residual rate in the coke (90.3%). It is noted that the Zn residual rate in the coke obtained by separate pyrolysis of WT-2 at 700 °C is 88.3%, which is lower than that of co-pyrolysis of coal with WT-2, although the molar ratio of Zn to S in the WT-2 is 0.64. This should be attributed to the large crystallite size of ZnO in the WT-2, which cannot be completely transformed into ZnS at 700 °C, as shown in Figure 4b, resulting in the coexistence of ZnO and ZnS in the coke obtained at 700 °C. As the pyrolysis temperature increases, ZnS is reduced to metallic Zn vapor by carbon, so the residual rate of Zn in coke decreases and the percentage of Zn in tar increases. In addition, the residual rate of Zn in coke is related to the Zn content of coal. As the Zn content of coal is 0.8 wt.%, a large amount of ZnO is reduced slowly by carbon with the temperature rising and leads to a higher Zn residual rate in the cokes obtained at 900 and 1050 °C. When the Zn content of coal is 4 wt.%, excess ZnO reacts with Al2O3 to generate ZnAl2O4 at 900 °C to enhance the Zn residual rate in coke to 50%. Additionally, ZnAl2O4 can also be reduced by carbon to generate gaseous Zn at 1050 °C, giving rise to a reduction of Zn residual rate in coke of 10%. Based on the above experimental results, the relative percentage distribution of Zn in the pyrolytic products is closely related to the content of S and mineral elements in the coal. FactSage 8.0 is further used to calculate the thermochemical conversion behaviors and phase distributions of Zn at different temperatures in detail.

3.5. Thermodynamic Equilibrium Analysis

3.5.1. The Interactions of Zn with S

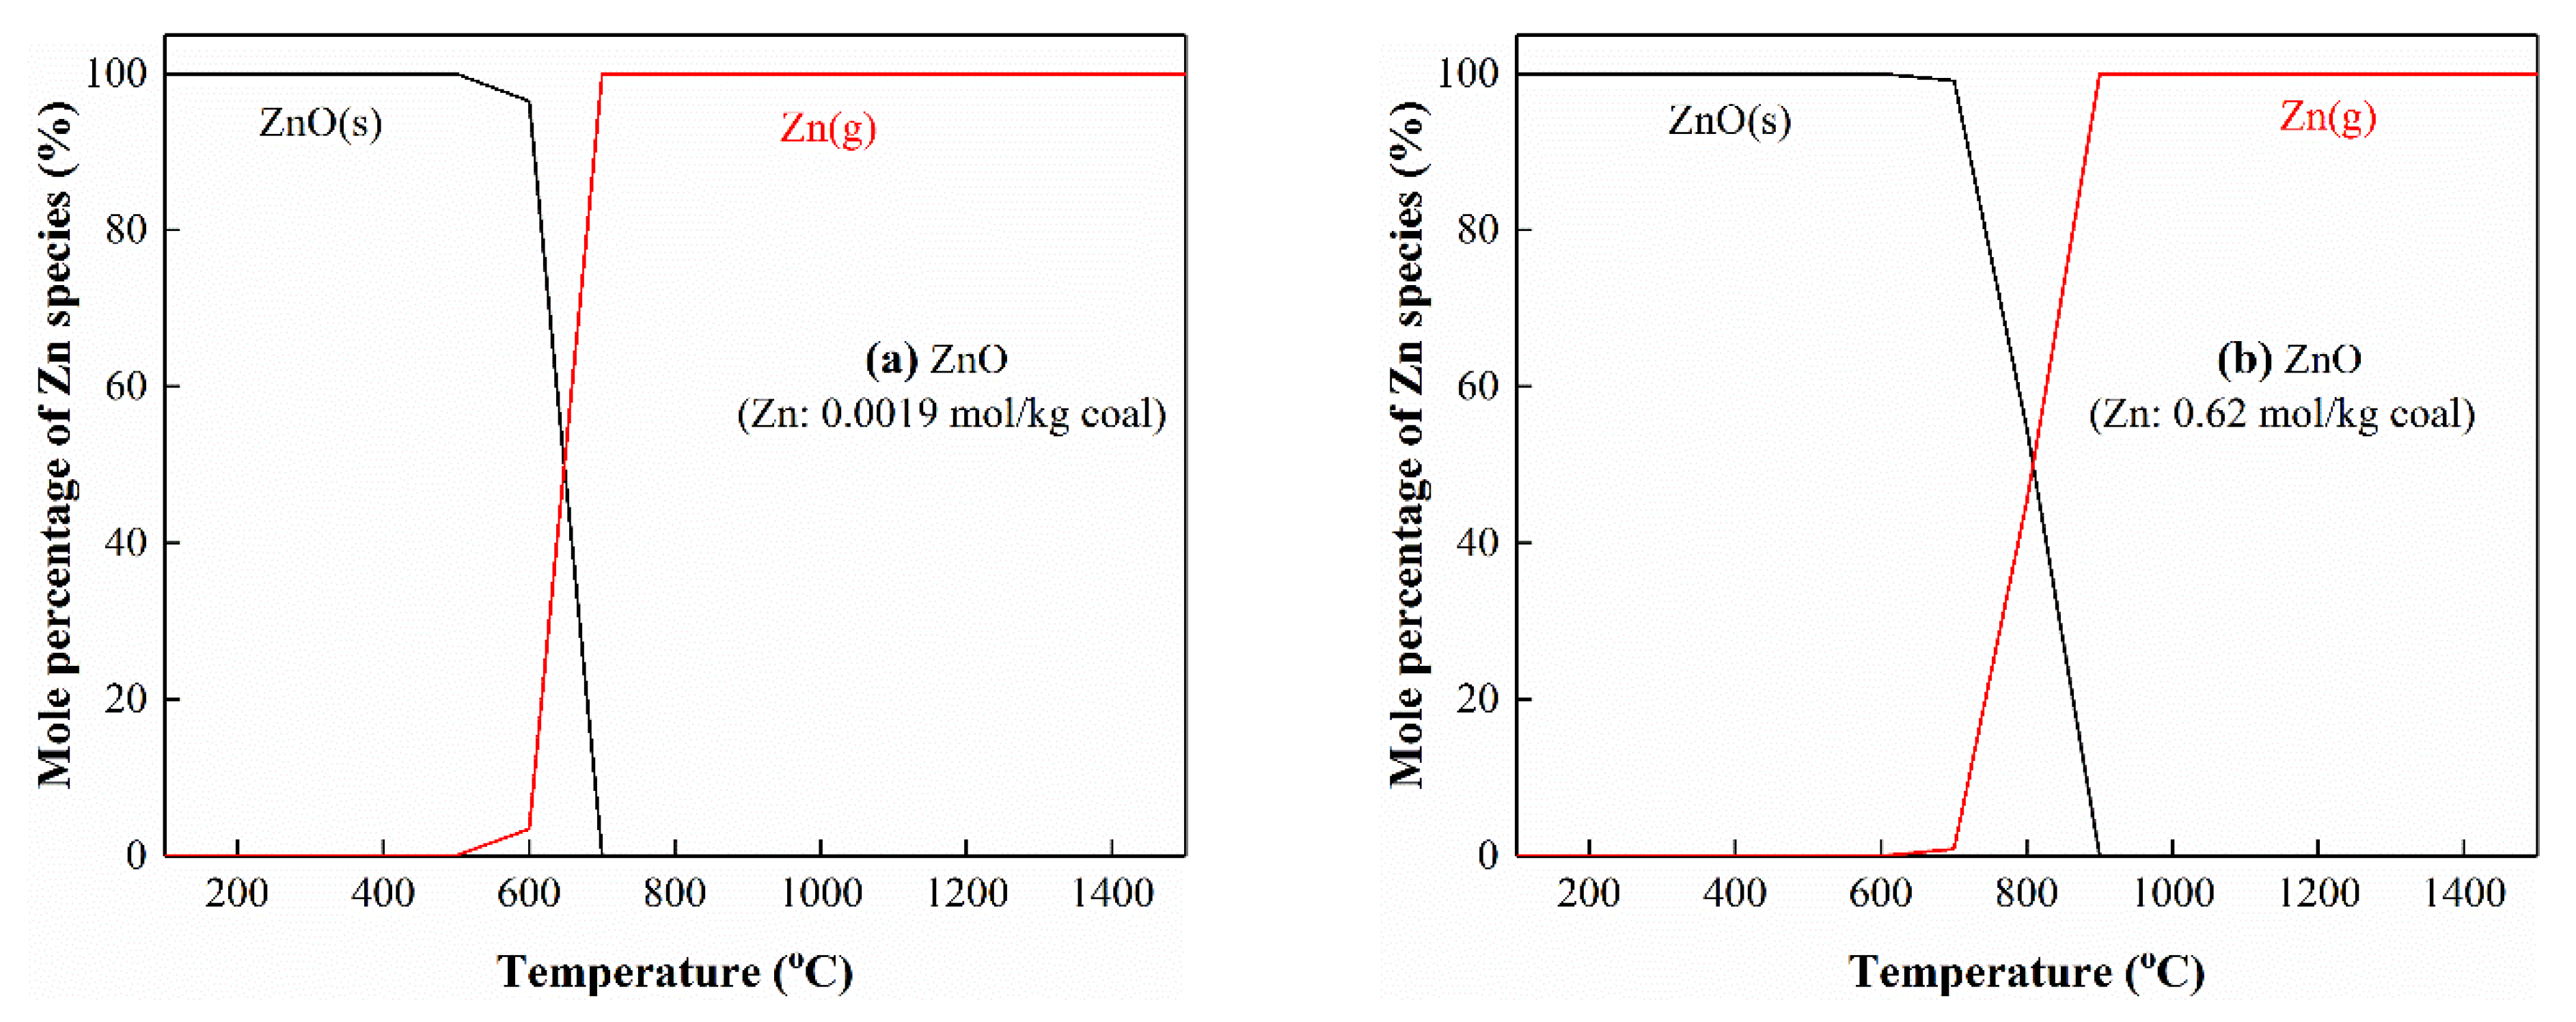
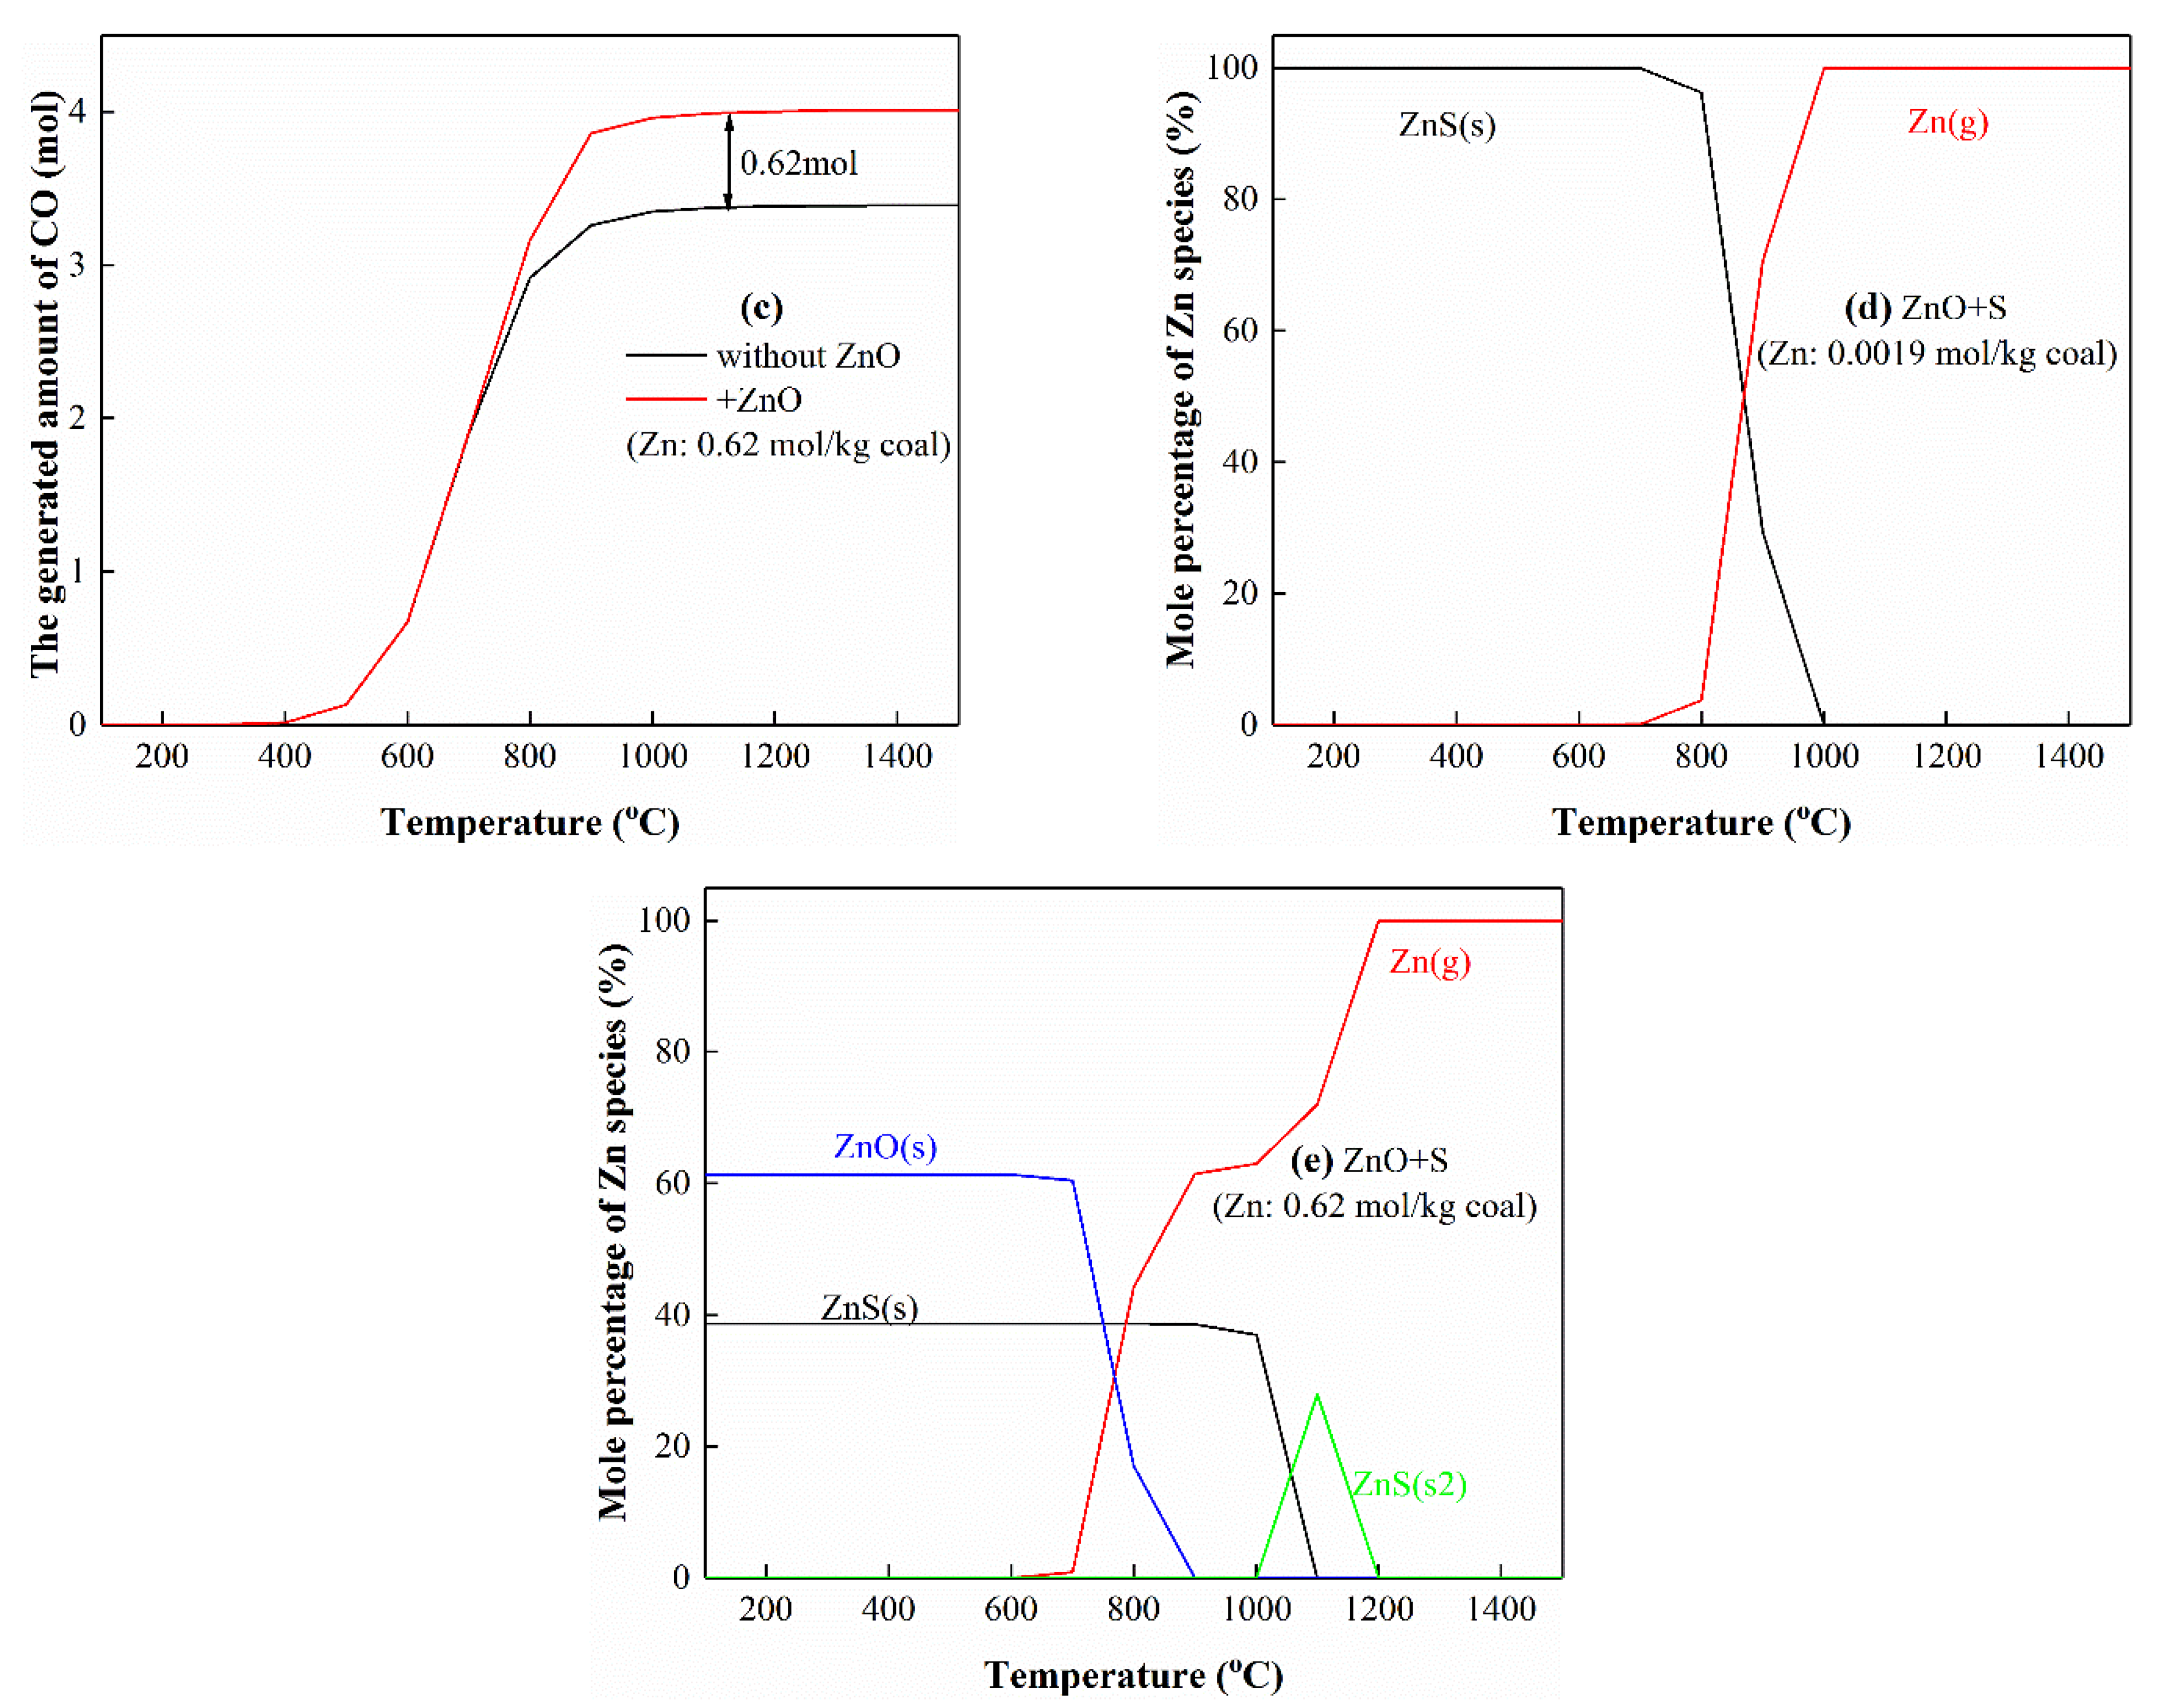
The effect of S on the thermodynamic equilibrium distributions of Zn in the coke was investigated, as shown in Figure 7. When only ZnO exists in the coal, ZnO is reduced by carbon to generate metallic Zn vapor at the temperature range of 500–700 °C with 0.01 wt.% of Zn content (0.0019 mol/kg coal), as displayed in Figure 7a. As the Zn content is increased to 4 wt.% (0.62 mol/kg coal), the stability of ZnO is improved, which decomposes at the temperature range of 600–900 °C (Figure 7b). It is found that the generated amount of CO after the addition of ZnO is 0.62 mol more than that of the base coal (Figure 7c), so the reaction of ZnO and carbon produces CO gas, as described in Reaction (1). When the Zn content is 0.01 wt.% (0.0019 mol/kg coal), the presence of S (0.24 mol/kg coal) suppresses the volatilization of Zn due to the formation of ZnS, which is further reduced to gaseous Zn by carbon at 700–1000 °C (Figure 7d). ZnO and ZnS coexist in the coke as the Zn content is 4 wt.% (0.62 mol/kg coal). The gaseous Zn is produced at 600 °C by the reduction of ZnO and ZnS, which starts to decompose at 900 °C. Some ZnS undergo crystal phase transformation at 1000–1200 °C, from sphalerite ZnS(s) to wurtzite ZnS(s2) and are completely reduced to Zn vapor at 1200 °C (Figure 7e). The thermodynamic equilibrium distributions of Zn with the Zn contents of 0.02 wt.% (0.0052 mol/kg coal), 0.1 wt.% (0.0182 mol/kg coal) and 0.8 wt.% (0.12 mol/kg coal) are also calculated and displayed in Figure S1, further demonstrating that the thermal stabilities of ZnO and ZnS are enhanced with the increase of Zn content.
ZnO + C → Zn(g) + CO(g)

3.5.2. The Interactions of Zn with S and Ca

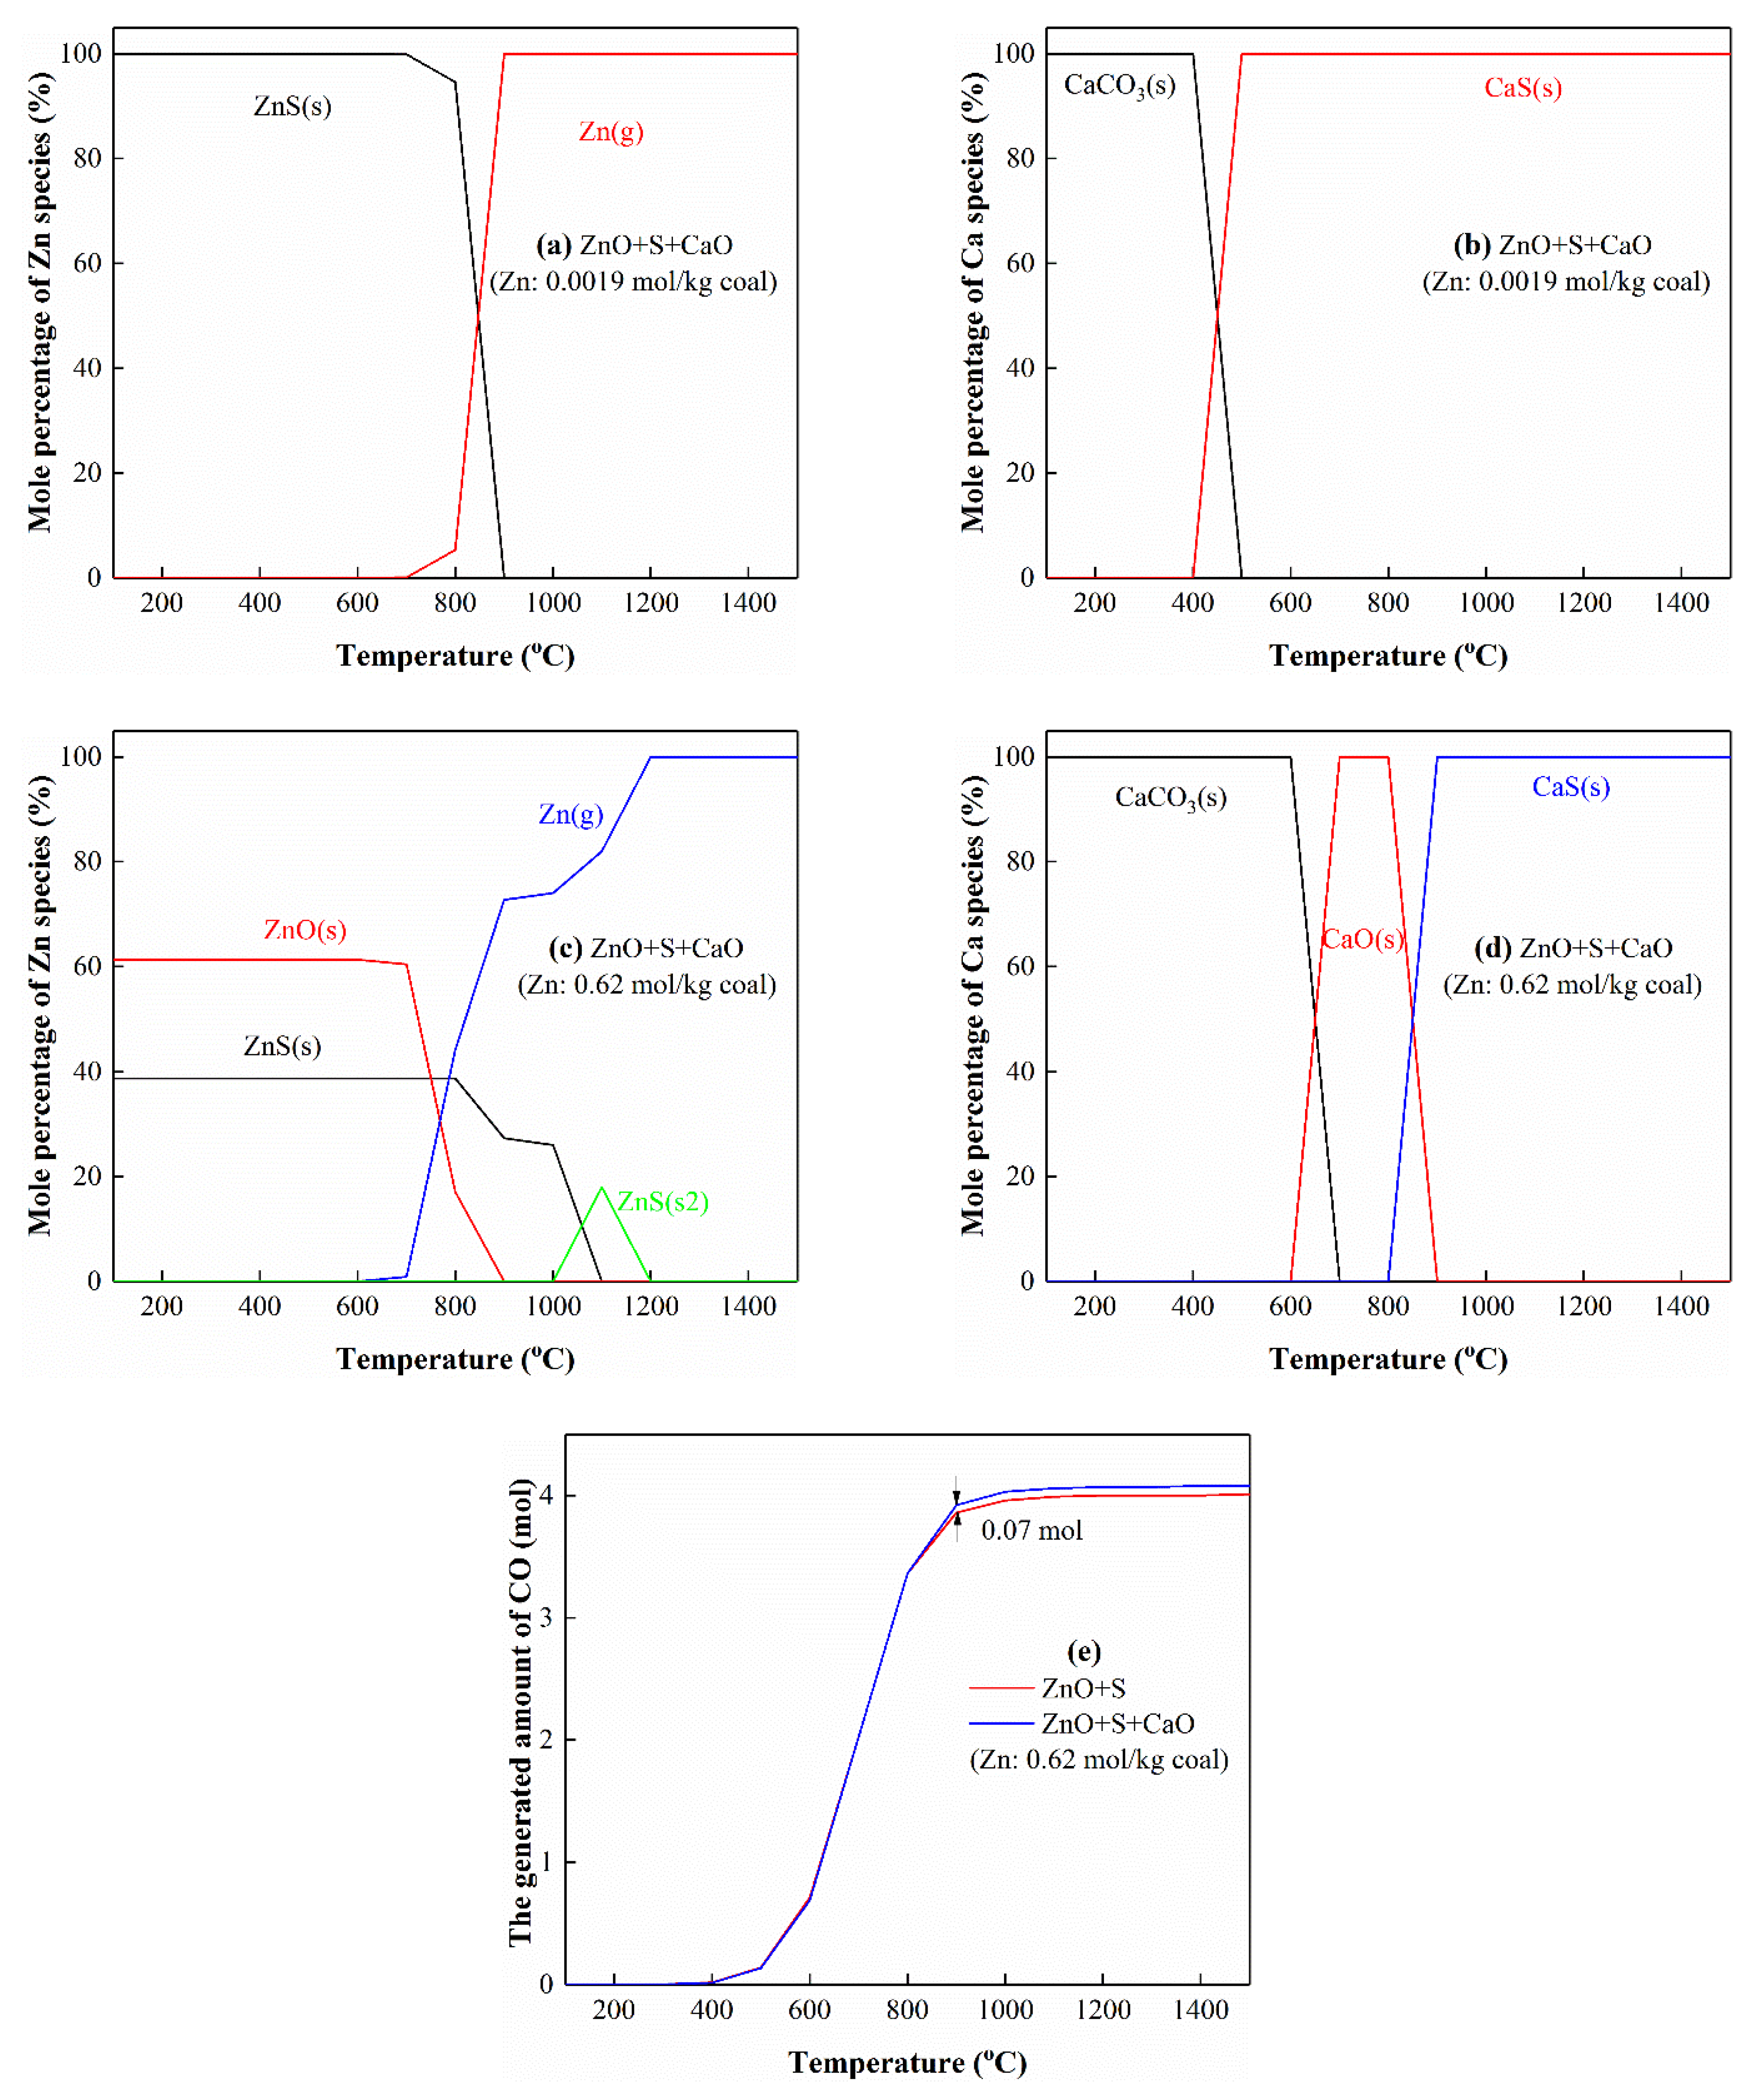
The effect of the co-existence of S and Ca on the thermodynamic equilibrium distribution of Zn was analyzed, as shown in Figure 8. When the Zn content is low (Zn/S/Ca = 0.0019/0.24/0.07), the Zn incorporates with S to form ZnS, which decomposes into gaseous Zn from 700 to 900 °C (Figure 8a). Additionally, Ca also combines with S to generate CaS at 400–500 °C, which is stable before 1500 °C (Figure 8b). When the amount of Zn is high (Zn/S/Ca = 0.62/0.24/0.07), CaO can react with ZnS at 800–900 °C to form CaS and gaseous Zn (Figure 8c,d). Meanwhile, 0.07 mol of CO gas is generated in this process (Figure 8e), as described in Reaction (2). The above results indicate that the presence of Ca reduces the stability of ZnS and promotes the volatilization of Zn from coke. Consistent with the XRD results, CaS can be detected in the coke generated at 700 °C when the Zn content is low (0.0019 mol/kg coal), while CaS is only formed in the coke obtained at 900 °C when the Zn content is high (0.62 mol/kg coal).
CaO + ZnS + C → CaS + Zn(g) + CO(g)

3.5.3. The Interactions of Zn with S and Fe

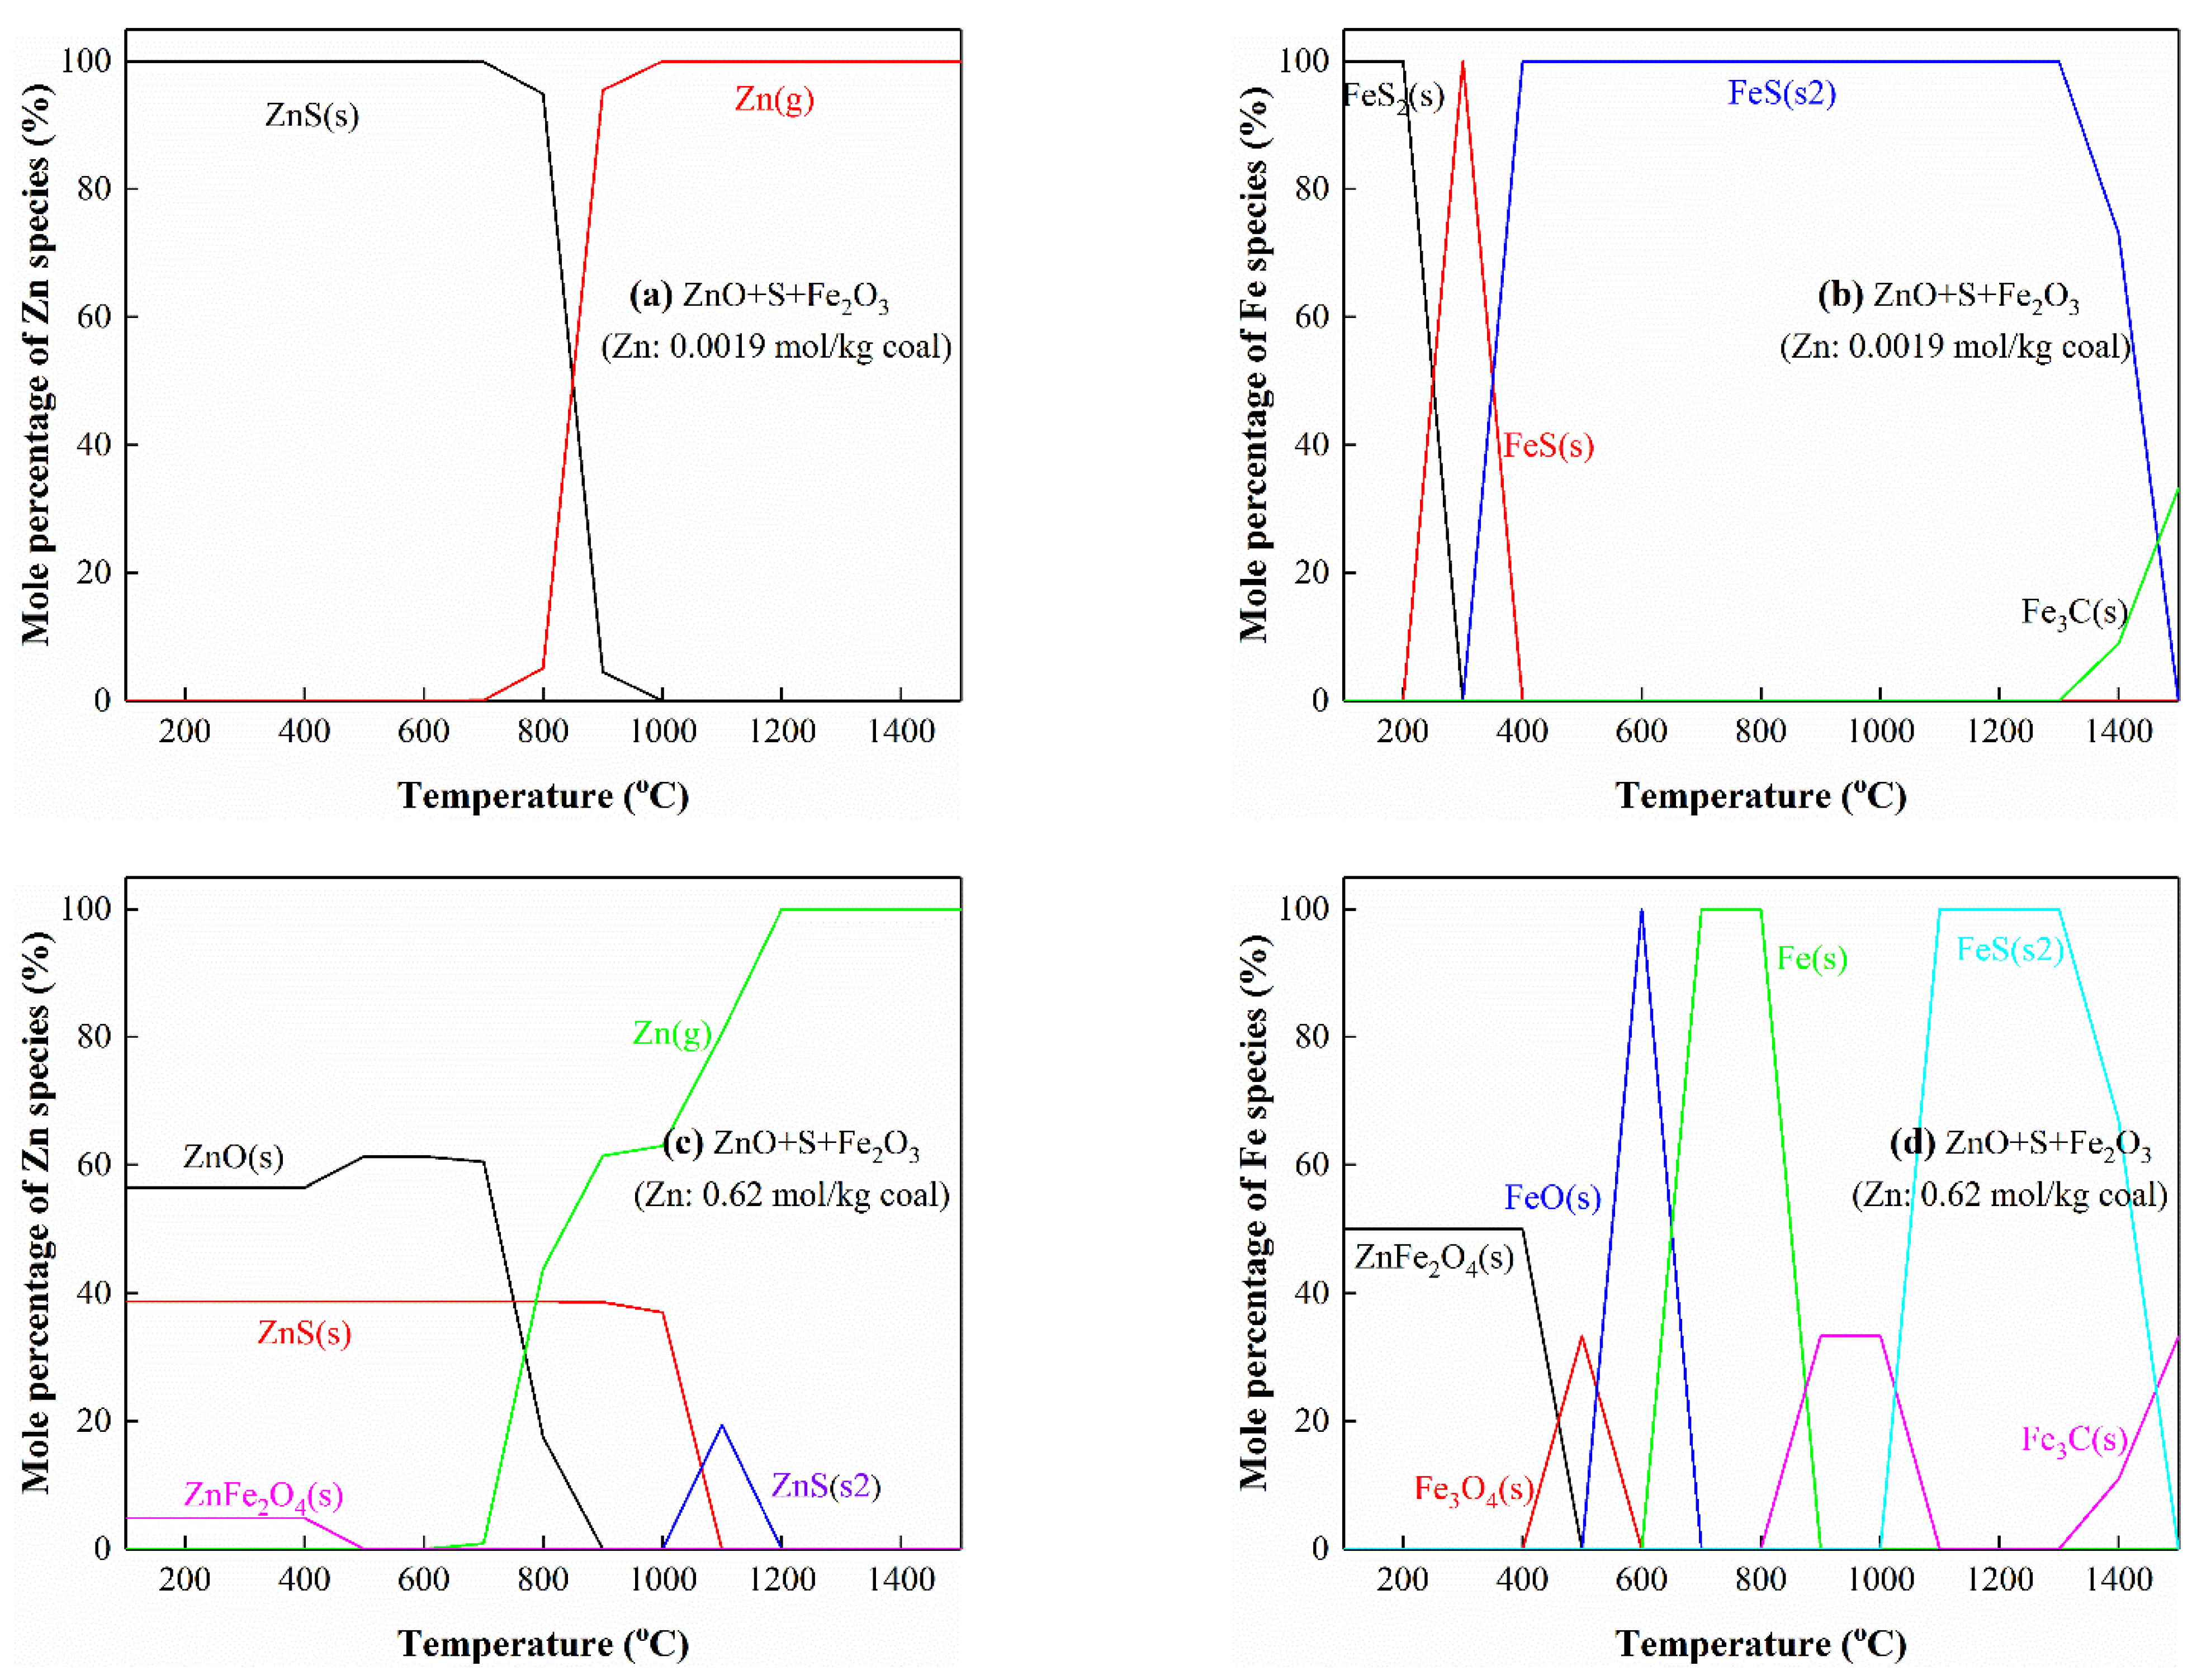
The influence of the co-existence of S and Fe on the thermodynamic equilibrium distributions of Zn is displayed in Figure 9. When the Zn content is low (Zn/S/Fe = 0.0019/0.24/0.06), ZnS is formed and reduced by carbon to gaseous Zn at the temperature range of 700–1000 °C (Figure 9a). Fe combines with S to form FeS2 (pyrite), FeS2 is transformed to FeS(s) (monoclinic pyrrhotite) at 200–300 °C, FeS(s) is converted to FeS(s2) (hexagonal pyrrhotite) at 300–400 °C, and FeS(s2) reacts with carbon to form Fe3C (cementite) at 1300–1500 °C (Figure 9b). When the Zn content is high (Zn/S/Fe = 0.62/0.24/0.06), Fe combines with partial Zn to form ZnFe2O4 (Figure 9c), as indicated in Reaction (3). ZnFe2O4 decomposes into ZnO and Fe3O4 at 400–500 °C. Fe3O4 is continuously reduced to FeO and elemental Fe by carbon at 500–700 °C, then Fe reacts with carbon at 800–900 °C to form Fe3C. Fe3C is further transformed to FeS at 1000–1100 °C, meanwhile, the ZnS is decomposed to metallic Zn gas, finally, FeS is converted to Fe3C at 1300–1500 °C (Figure 9d). The above results demonstrate that the presence of Fe has no effect on the interaction of Zn and S. In addition, when Fe and Ca coexist in coal, compared with the case where only Fe or Ca exists, the phase distributions of Zn and Ca do not change within 100–1500 °C, but the stability of FeS becomes worse. The FeS is transformed to Fe3C from 1200 °C, as shown in Figure S2.
ZnO + Fe2O3 → ZnFe2O4

3.5.4. The Interactions of Zn with Si

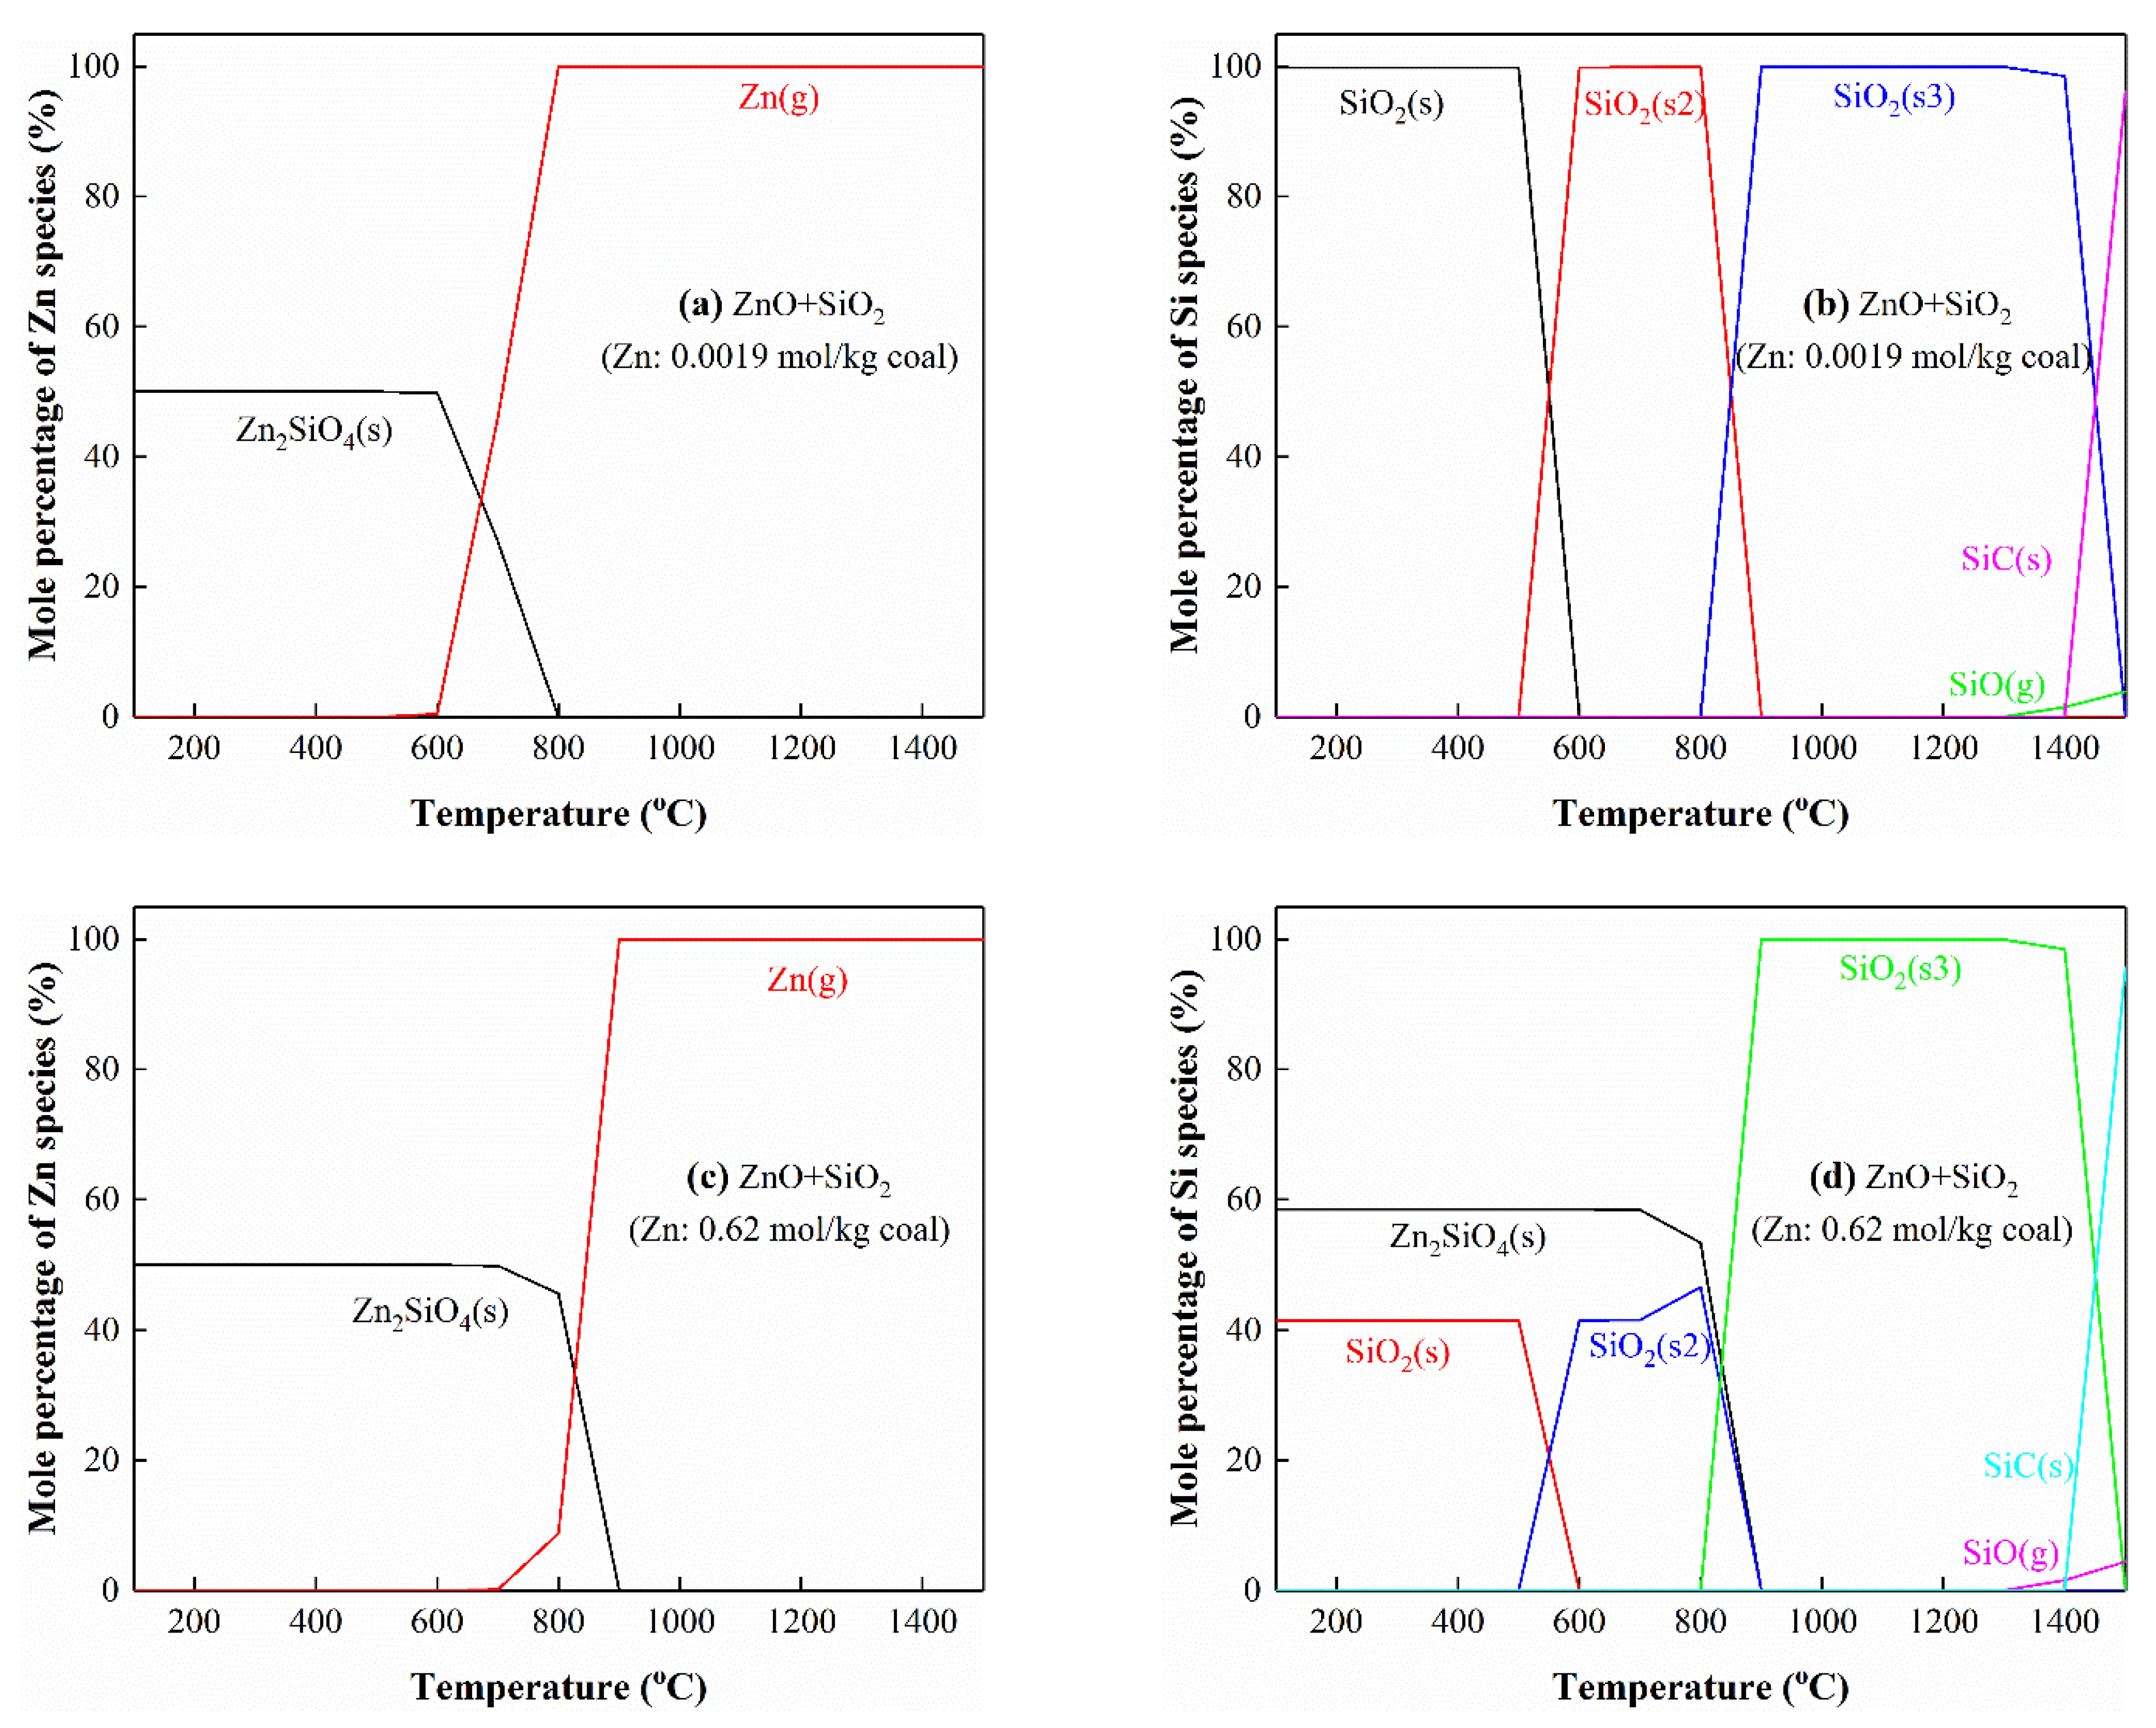
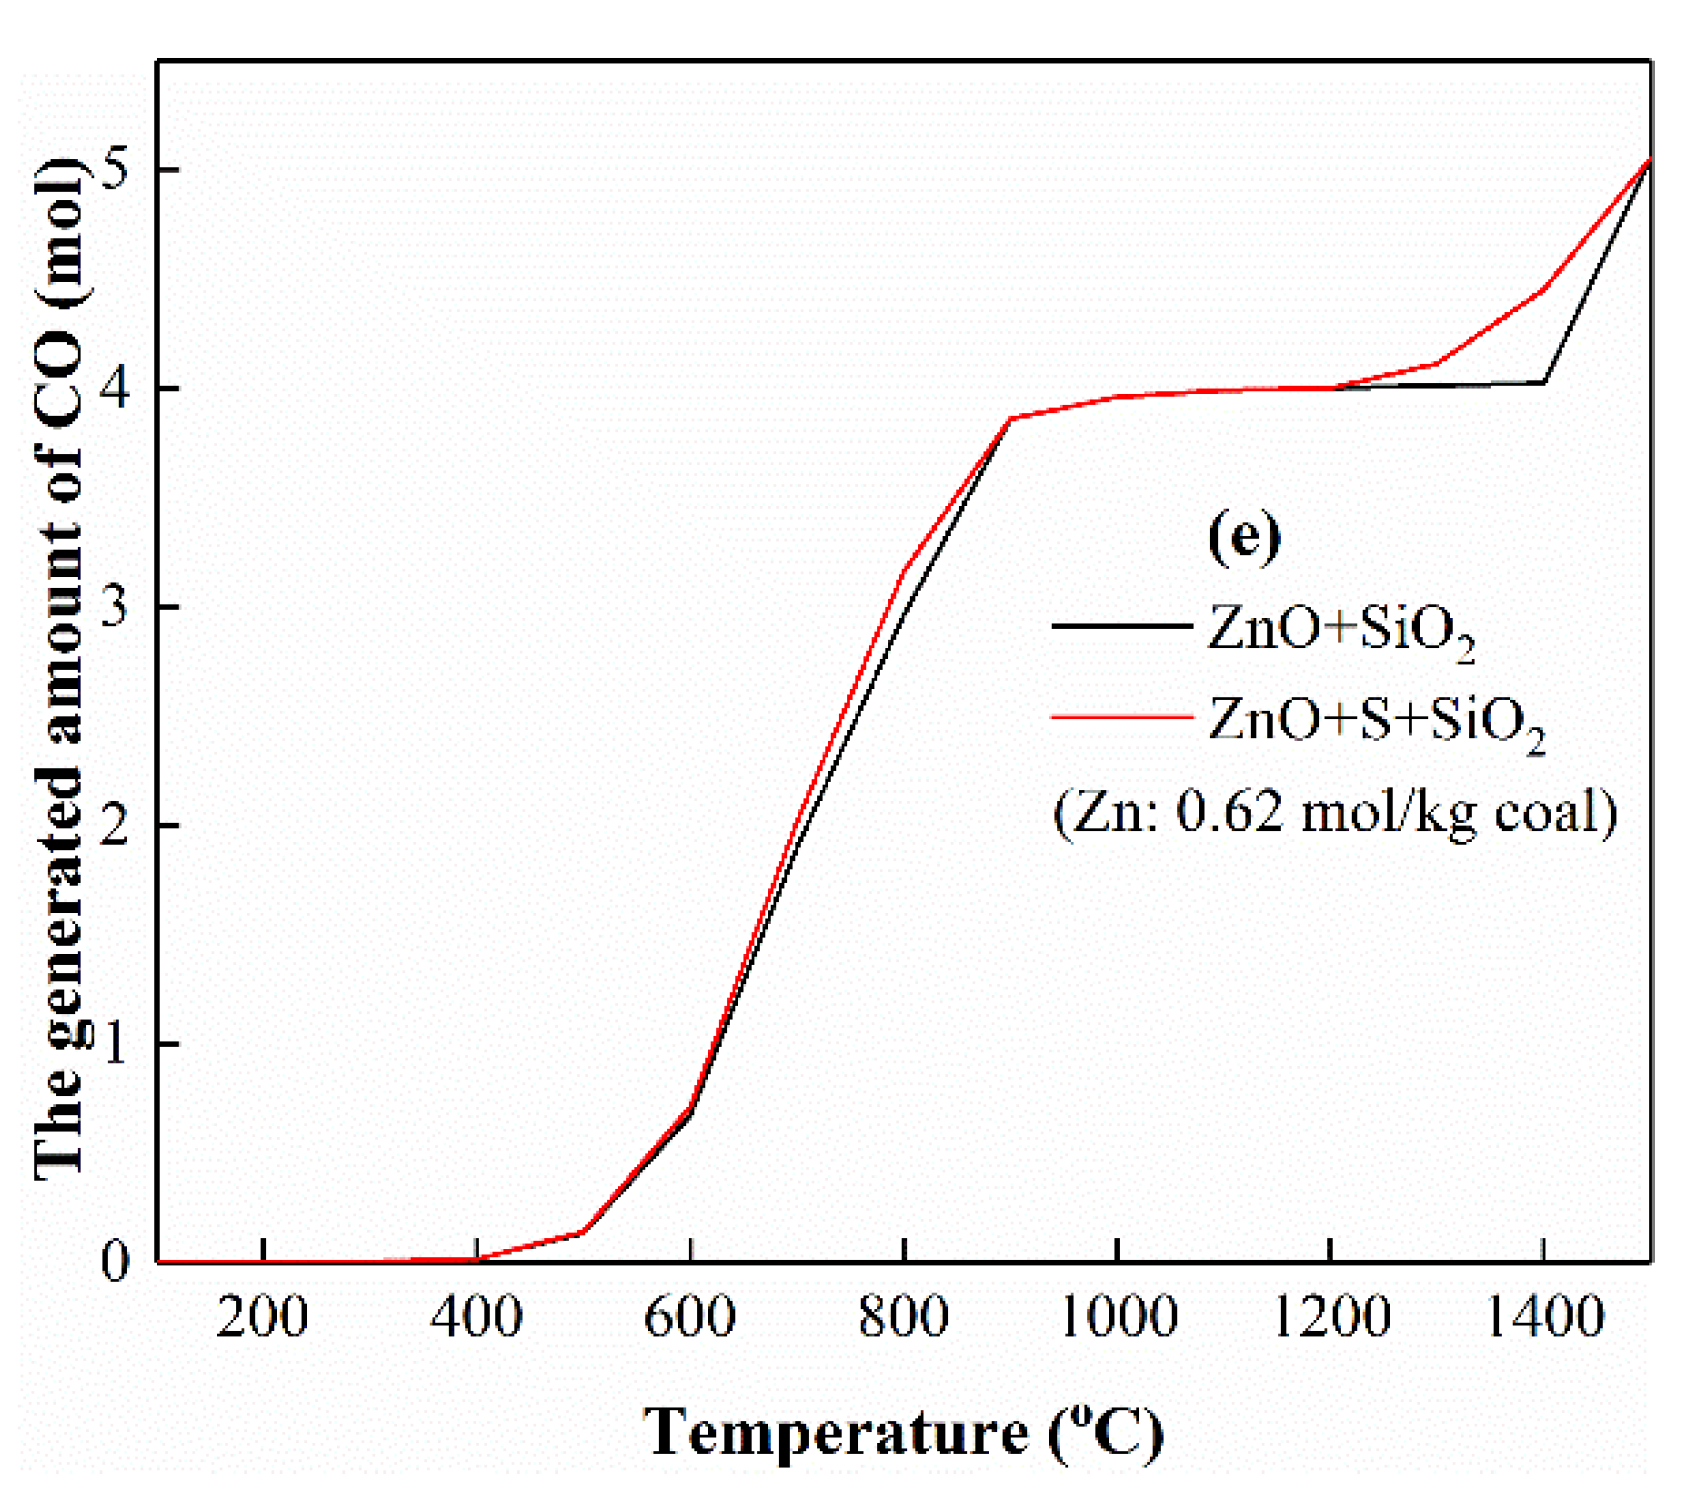
The thermodynamic equilibrium distributions of Zn and Si as Zn and Si coexist in the coal are displayed in Figure 10. When the Zn content is low (Zn/Si = 0.0019/0.53), partial Si combines with Zn to form Zn2SiO4 (Reaction (4)), which is further reduced to gaseous Zn by carbon at 600–800 °C (Reaction (5)), as shown in Figure 10a. SiO2(s) (α-quartz) is converted to SiO2(s2) (β-quartz) at 500–600 °C, SiO2(s2) is transformed to SiO2(s3) (tridymite) at 800–900 °C and partial SiO2(s3) reacts with carbon to form SiO(g) and CO(g) at 1300–1500 °C (Reaction (6)), and SiC(s) and CO(g) at 1400–1500 °C (Reaction (7)), respectively (Figure 10b). When the Zn content is high (Zn/Si = 0.62/0.53), the stability of Zn2SiO4 is improved. It reacts with carbon to generate SiO2(s2) and Zn(g) at 700–800 °C and SiO2(s3) and Zn(g) at 800–900 °C (Reaction (5)), respectively (Figure 10c,d). The phase transitions of Si at the temperature range of 900–1500 °C are the same as the condition of low Zn content (Figure 10d). When S and Si coexist in the system, as shown in Figure S3, Zn preferentially reacts with S to form ZnS. When the Zn content is high (molar ratio of Zn/S > 1), the excessive Zn combines with Si to generate Zn2SiO4, which is converted to SiO2(s2) and Zn(g) at 700–800 °C and SiO2(s3) and Zn(g) at 800–900 °C. In addition, SiO2(s3) can react with S and carbon to generate SiS(g) and CO(g) at 1200 °C (Reaction (8)). The generated amount of CO during the above processes is shown in Figure 10e.
2ZnO + SiO2 → Zn2SiO4
Zn2SiO4 + 2C → SiO2 + 2Zn(g) + 2CO(g)
SiO2 + C → SiO(g) + CO(g)
SiO2 + 3C → SiC + 2CO(g)
SiO2 + S + 2C → SiS(g) + 2CO(g)

3.5.5. The Interactions of Zn with Al

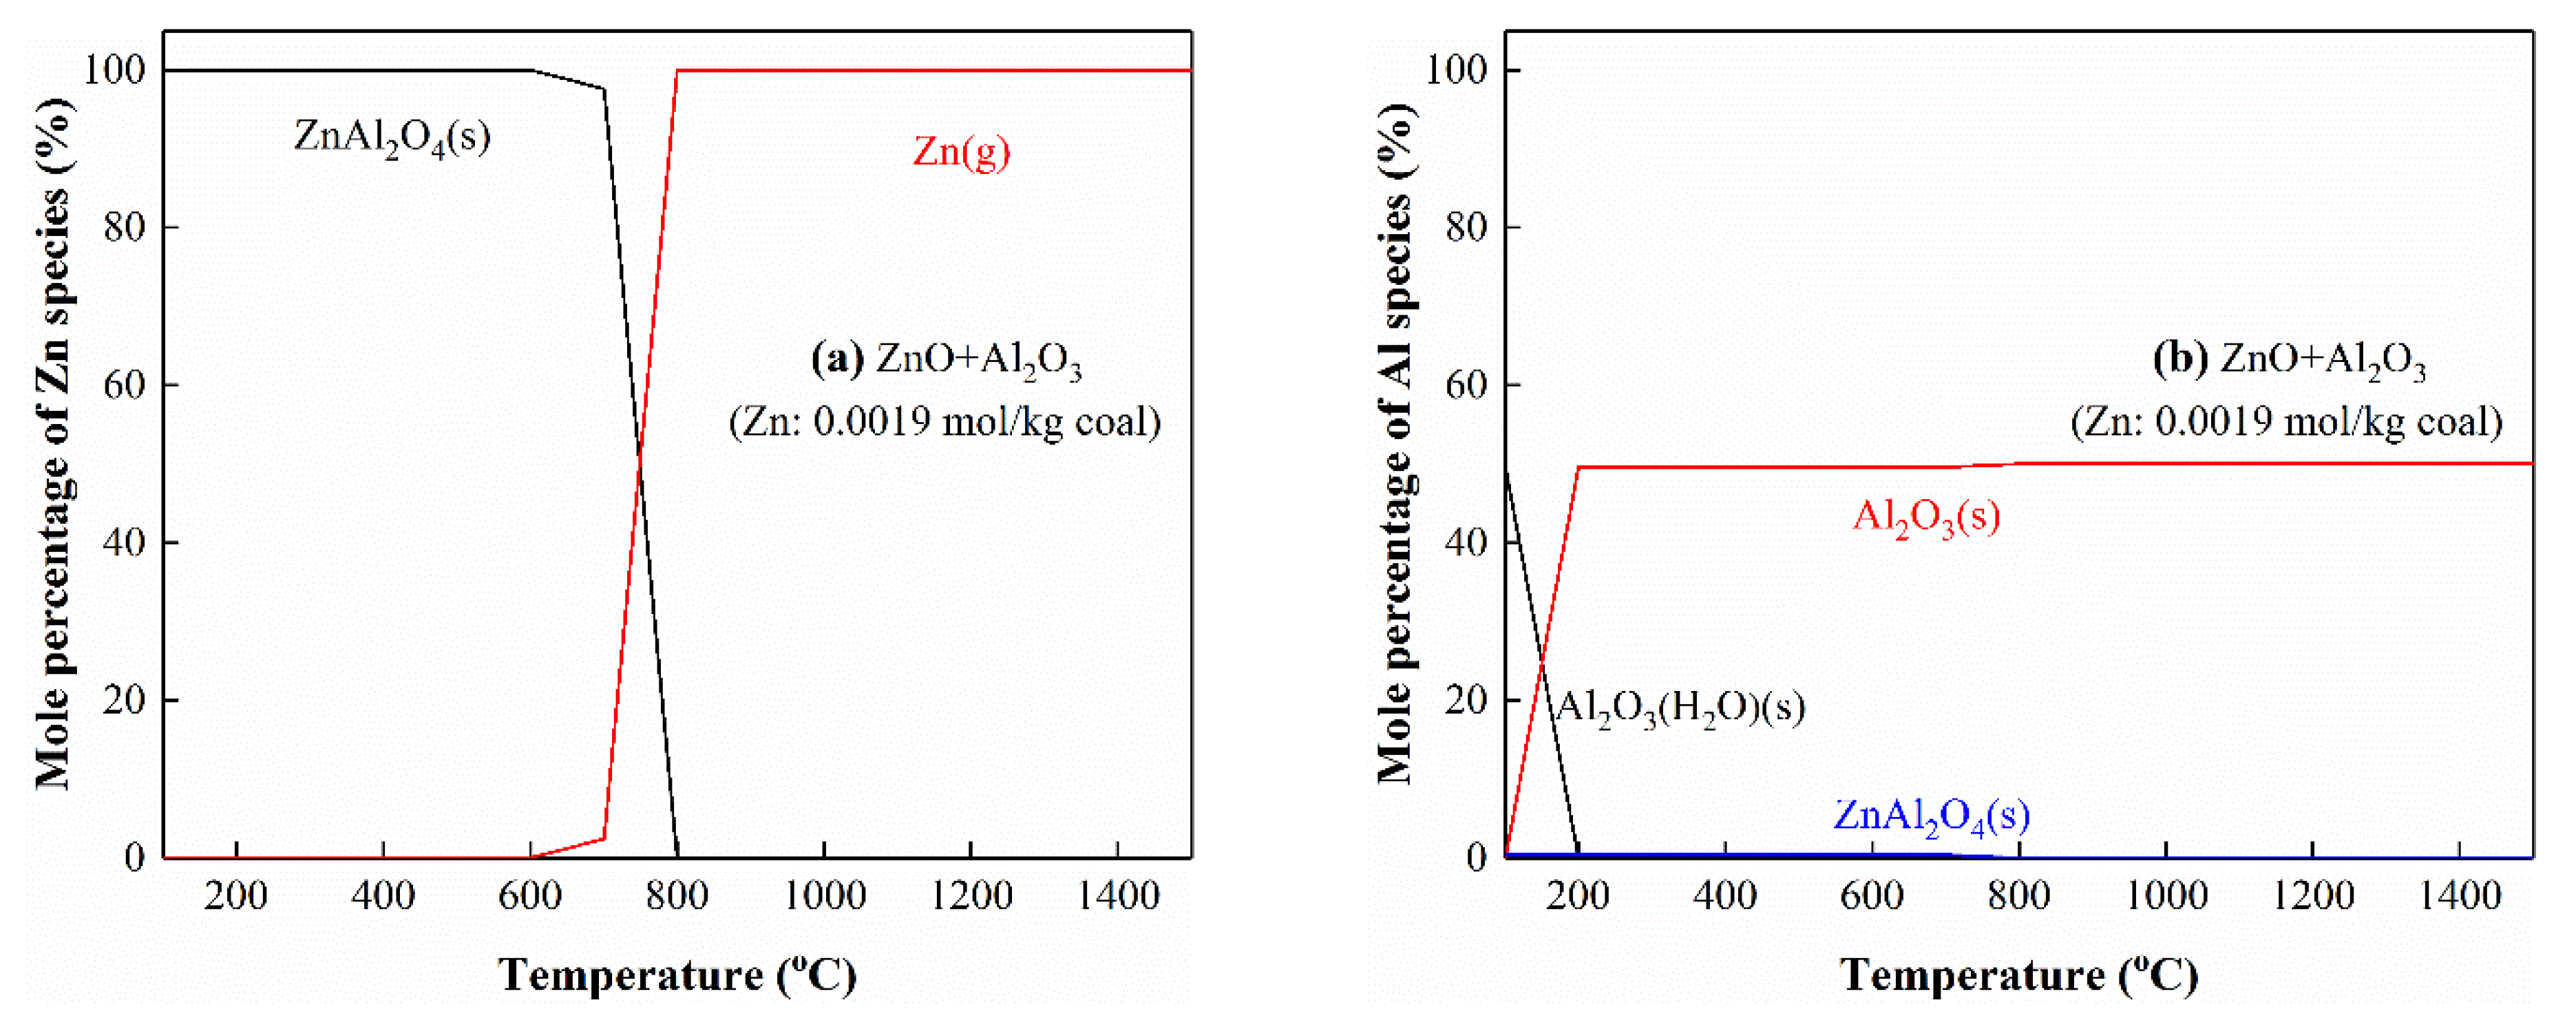
The interactions of Zn and Al were also investigated, as shown in Figure 11. When the Zn content is low (Zn/Al = 0.0019/0.46), partial Al combines with Zn to form ZnAl2O4(s) (Reaction (9)), and ZnAl2O4 is reduced to gaseous Zn and Al2O3(s) by carbon at 600–800 °C (Reaction (10)), as shown in Figure 11a,b. When the Zn content is high (Zn/Al = 0.62/0.46), Zn exists as ZnO(s) and ZnAl2O4(s), which are reduced to Zn(g) by carbon at 600–900 and 900–1000 °C (Figure 11b,c), respectively, suggesting that the stability of ZnAl2O4 is higher than that of ZnO and that the existence of Al inhibits the volatilization of Zn from coke. The reaction of ZnAl2O4 and carbon can also produce CO gas, and the generated amount of CO is shown in Figure 11e, which is the same as the condition that only ZnO exists. When S and Al coexist in the system, as shown in Figure S4, Zn preferentially reacts with S to form ZnS. When the Zn content is high, Zn exists in the form of ZnS, ZnAl2O4 and ZnO, which are decomposed at the temperature range of 900–1200, 800–1000 and 600–800 °C, respectively. Consistent with the XRD results, ZnAl2O4 can be detected in the coke obtained at 900 °C when the Zn content is high (molar ratio of Zn/S > 1).
ZnO + Al2O3 → ZnAl2O4
ZnAl2O4 + C → Al2O3 + Zn(g) + CO(g)

3.5.6. The Interactions of Zn with Si and Al

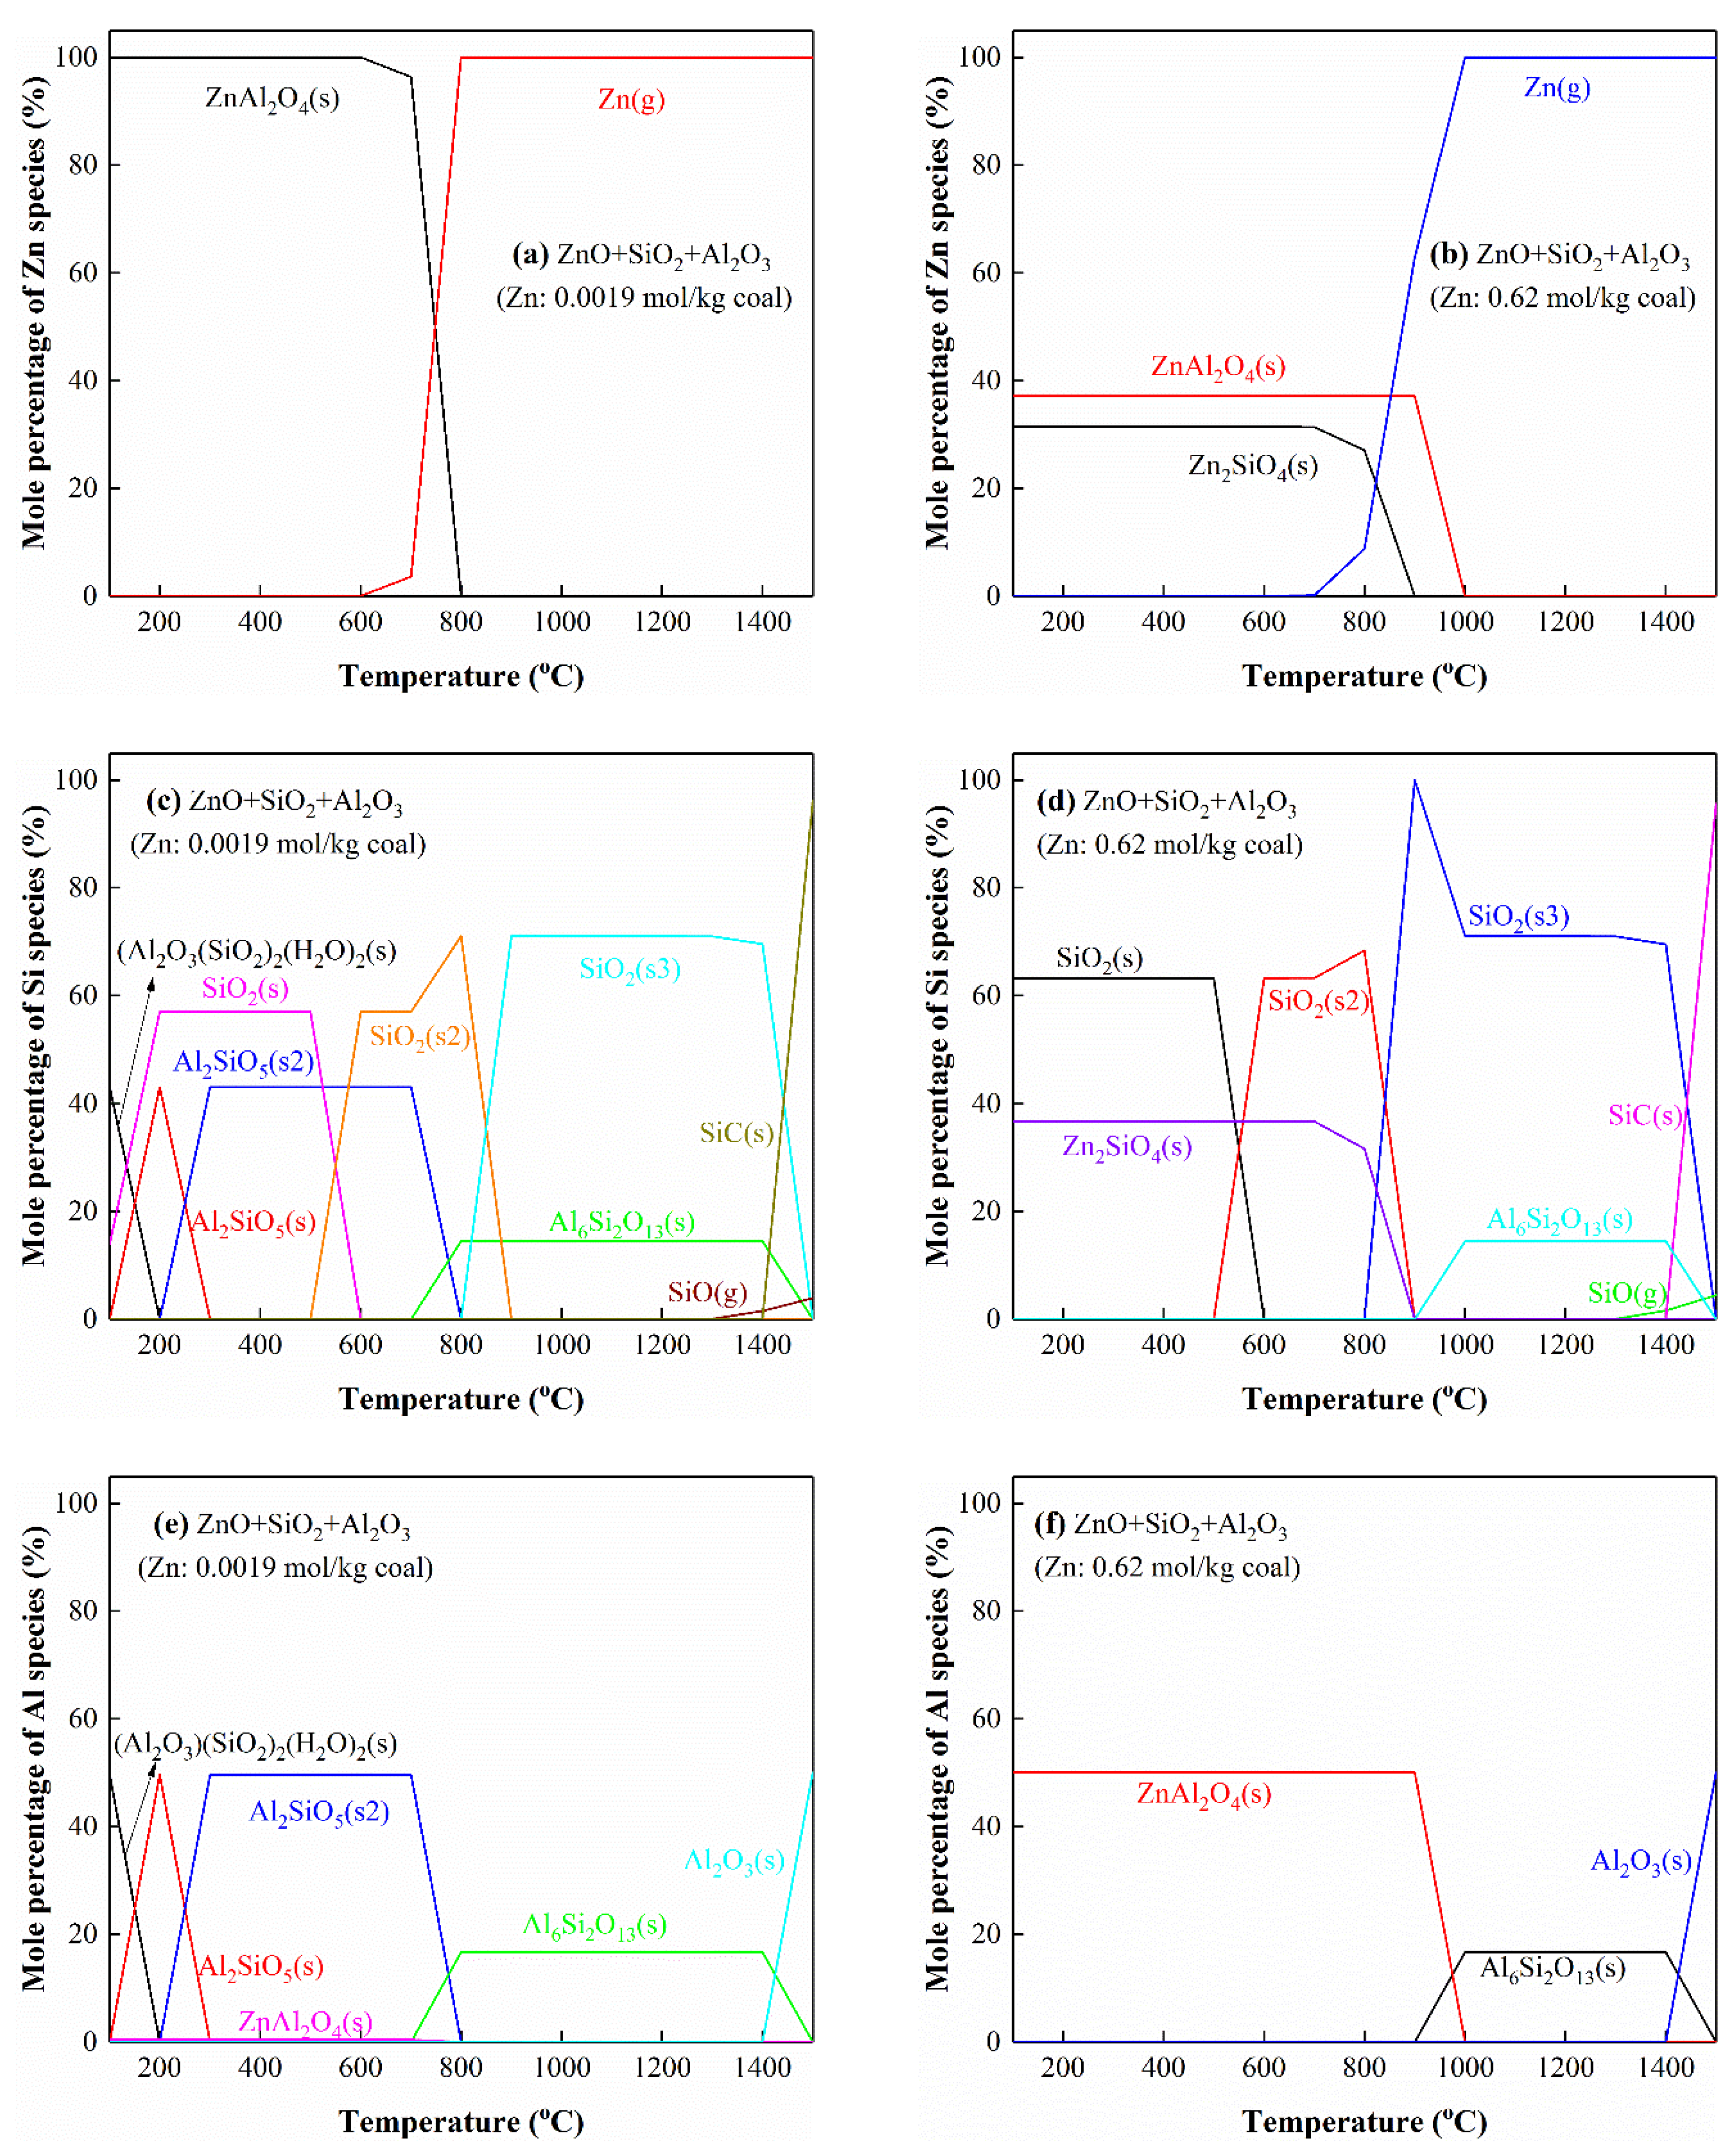
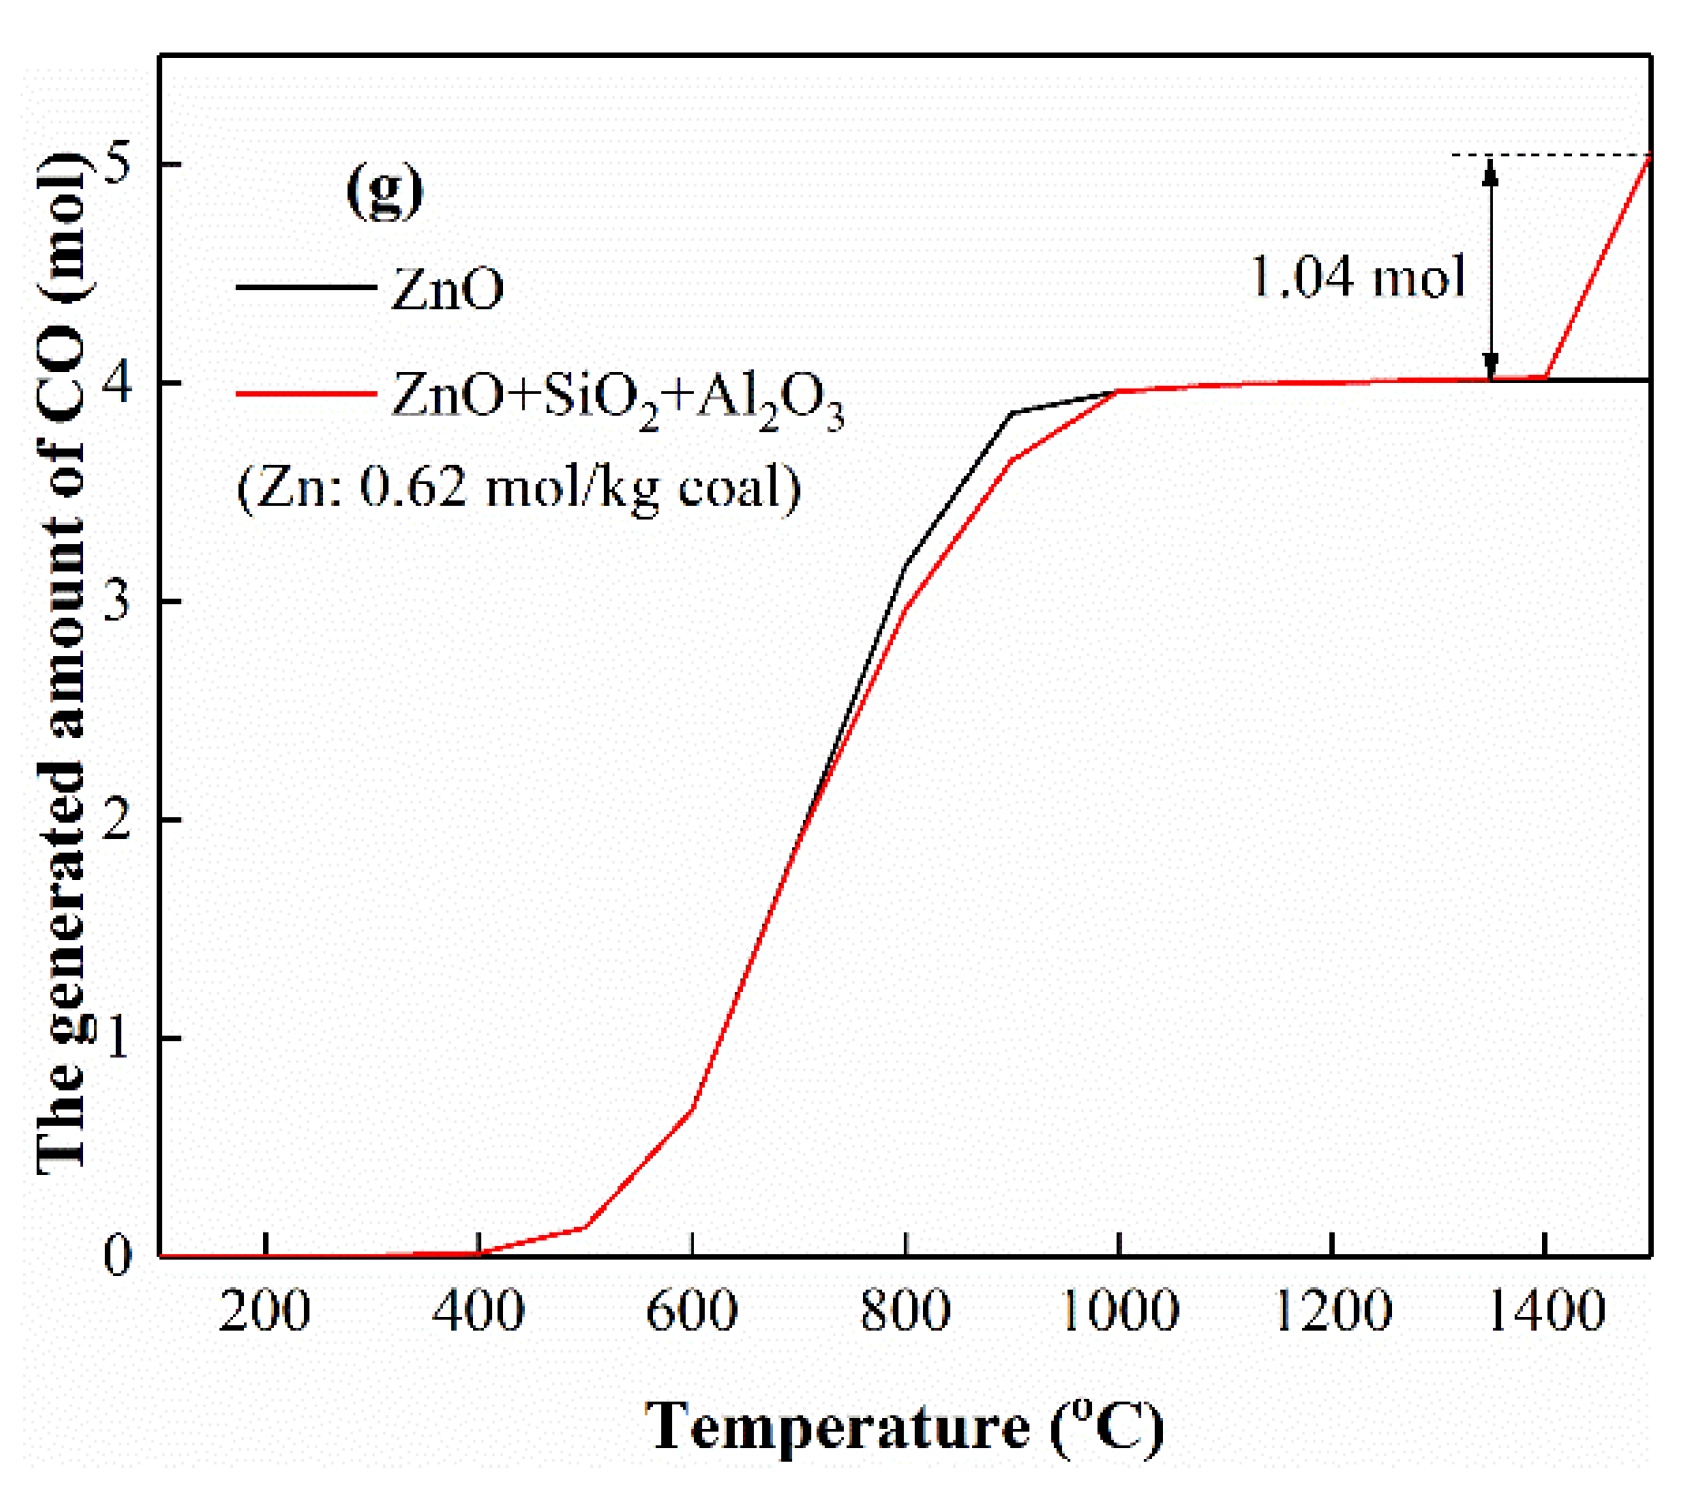
The effect of the co-existence of Si and Al on the thermodynamic equilibrium distributions of Zn was also investigated, as shown in Figure 12. When the Zn content is low (Zn/Si/Al = 0.0019/0.53/0.46mol), Zn combines with Al to form ZnAl2O4(s) (Figure 12a), indicating that Al is easier to react with Zn than Si. The Si and residual Al exists as (Al2O3)(SiO2)2(H2O)2(s) (kaolinite) and SiO2(s), and (Al2O3)(SiO2)2(H2O)2(s) decomposes into Al2SiO5(s) (kyanite) and SiO2(s) at 100–200 °C. Then Al2SiO5(s) (kyanite) transforms to Al2SiO5(s2) (andalusite) at 200–300 °C, and SiO2(s) (α-quartz) converts into SiO2(s2) (β-quartz) at 500–600 °C (Figure 12c). The Al2SiO5(s2) (andalusite) decomposes into Al6Si2O13(s) and SiO2(s2) at 700–800 °C (Figure 12c,e), as described in reaction (11). Additionally, Al6Si2O13(s) reacts with carbon to form Al2O3(s), SiC(s) and CO(g) at 1400–1500 °C (reaction (12)). When Zn content is high (Zn/Si/Al = 0.62/0.53/0.46), Zn combines with Al to form ZnAl2O4(s) and partial Si to generate Zn2SiO4(s) (Figure 12b). Zn2SiO4 is reduced by carbon to generate SiO2(s2) and gaseous Zn at 700–900 °C (Figure 12b,d). Additionally, ZnAl2O4 reacts with SiO2(s3) and carbon to generate Al6Si2O13(s), Zn(g) and CO(g) at 900–1000 °C (Figure 12b,d,f), as described in reaction (13). The generated amount of CO in the reactions (12) and (13) is shown in Figure 12g. When S is present in the system, Zn preferentially reacts with S to form ZnS and the excess Zn combines with Al and Si to generate ZnAl2O4 and Zn2SiO4, respectively, as shown in Figure S5. There is no change in the phase distributions of Al and Si except for the formation of SiS(g) at 1200 °C. The standard-state Gibbs free energies ( Δ r G m θ ) as a function of temperature for reactions (1)–(13) are calculated by FactSage 8.0 and listed in Table S2 and Figure S6. When the Gibbs free energy is negative, the reaction is spontaneous. It is shown that the favored temperature ranges for different reactions are consistent with the generation sequence of corresponding products discussed above.
3Al2SiO5 → Al6Si2O13 + SiO2
Al6Si2O13 + 6C → 3Al2O3 + 2SiC + 4CO(g)
3ZnAl2O4 + 2SiO2 + 3C → Al6Si2O13 + 3Zn(g) + 3CO(g)

3.5.7. The Interactions of Zn with Ca and Al

The effect of the co-existence of Ca and Al on the phase distributions of Zn was investigated, as shown in Figure 13. When the Zn content is low (Zn/Ca/Al = 0.0019/0.07/0.46), Zn combines with Al to form ZnAl2O4, which decomposes to gaseous Zn at 600–800 °C (Figure 13a). CaAl4O7(s) and CaAl12O19(s) are formed by the interaction between Ca and Al at 400 °C, which exists stably at high temperatures (Figure 13c,e). When the Zn content is high (Zn/Ca/Al = 0.62/0.07/0.46), Zn exists as ZnO and ZnAl2O4, and partial ZnAl2O4 begins to decompose at 600–700 °C (Figure 13b), and the generated Al species combines with Ca to form Ca3Al2O6 (Figure 13d,f). Ca3Al2O6 transforms into CaAl4O7 at 800–900 °C, and part of CaAl4O7 converts into CaAl12O19 at 900–1000 °C. The above results show that there is a competitive relationship between Ca and Zn in the interaction of Al. Below 600 °C, Zn preferentially reacts with Al to generate ZnAl2O4. With the increase in temperature, Ca begins to plunder Al to form Ca aluminate. When S is also present in the above system (Figure S7), ZnS is generated as the Zn content is low (Zn/S/Ca/Al = 0.0019/0.24/0.07/0.46). CaAl12O19 and CaS are formed at 400–500 °C, and CaAl12O19 begins to decompose and reacts with S to form CaS and Al2O3 at 700–800 °C. When the Zn content is high (Zn/S/Ca/Al = 0.62/0.24/0.07/0.46), Zn exists as ZnS, ZnAl2O4 and ZnO. ZnAl2O4 decomposes into ZnO at 600–700 °C and gaseous Zn at 700–1000 °C, respectively. Meanwhile, Ca3Al2O6 is generated at 600–700 °C, and partial Ca3Al2O6 transforms into CaAl2O4 at 700–800 °C, then the residual Ca3Al2O6 and CaAl2O4 converts into CaAl4O7 at 800–900 °C. Subsequently, part of CaAl4O7 turns into CaAl12O19 at 900–1000 °C, and the remaining CaAl4O7 and CaAl12O19 combine with S to form CaS and Al2O3 at 1000–1100 °C.

3.5.8. The Interactions of Zn with S, Ca, Al, Si and Fe

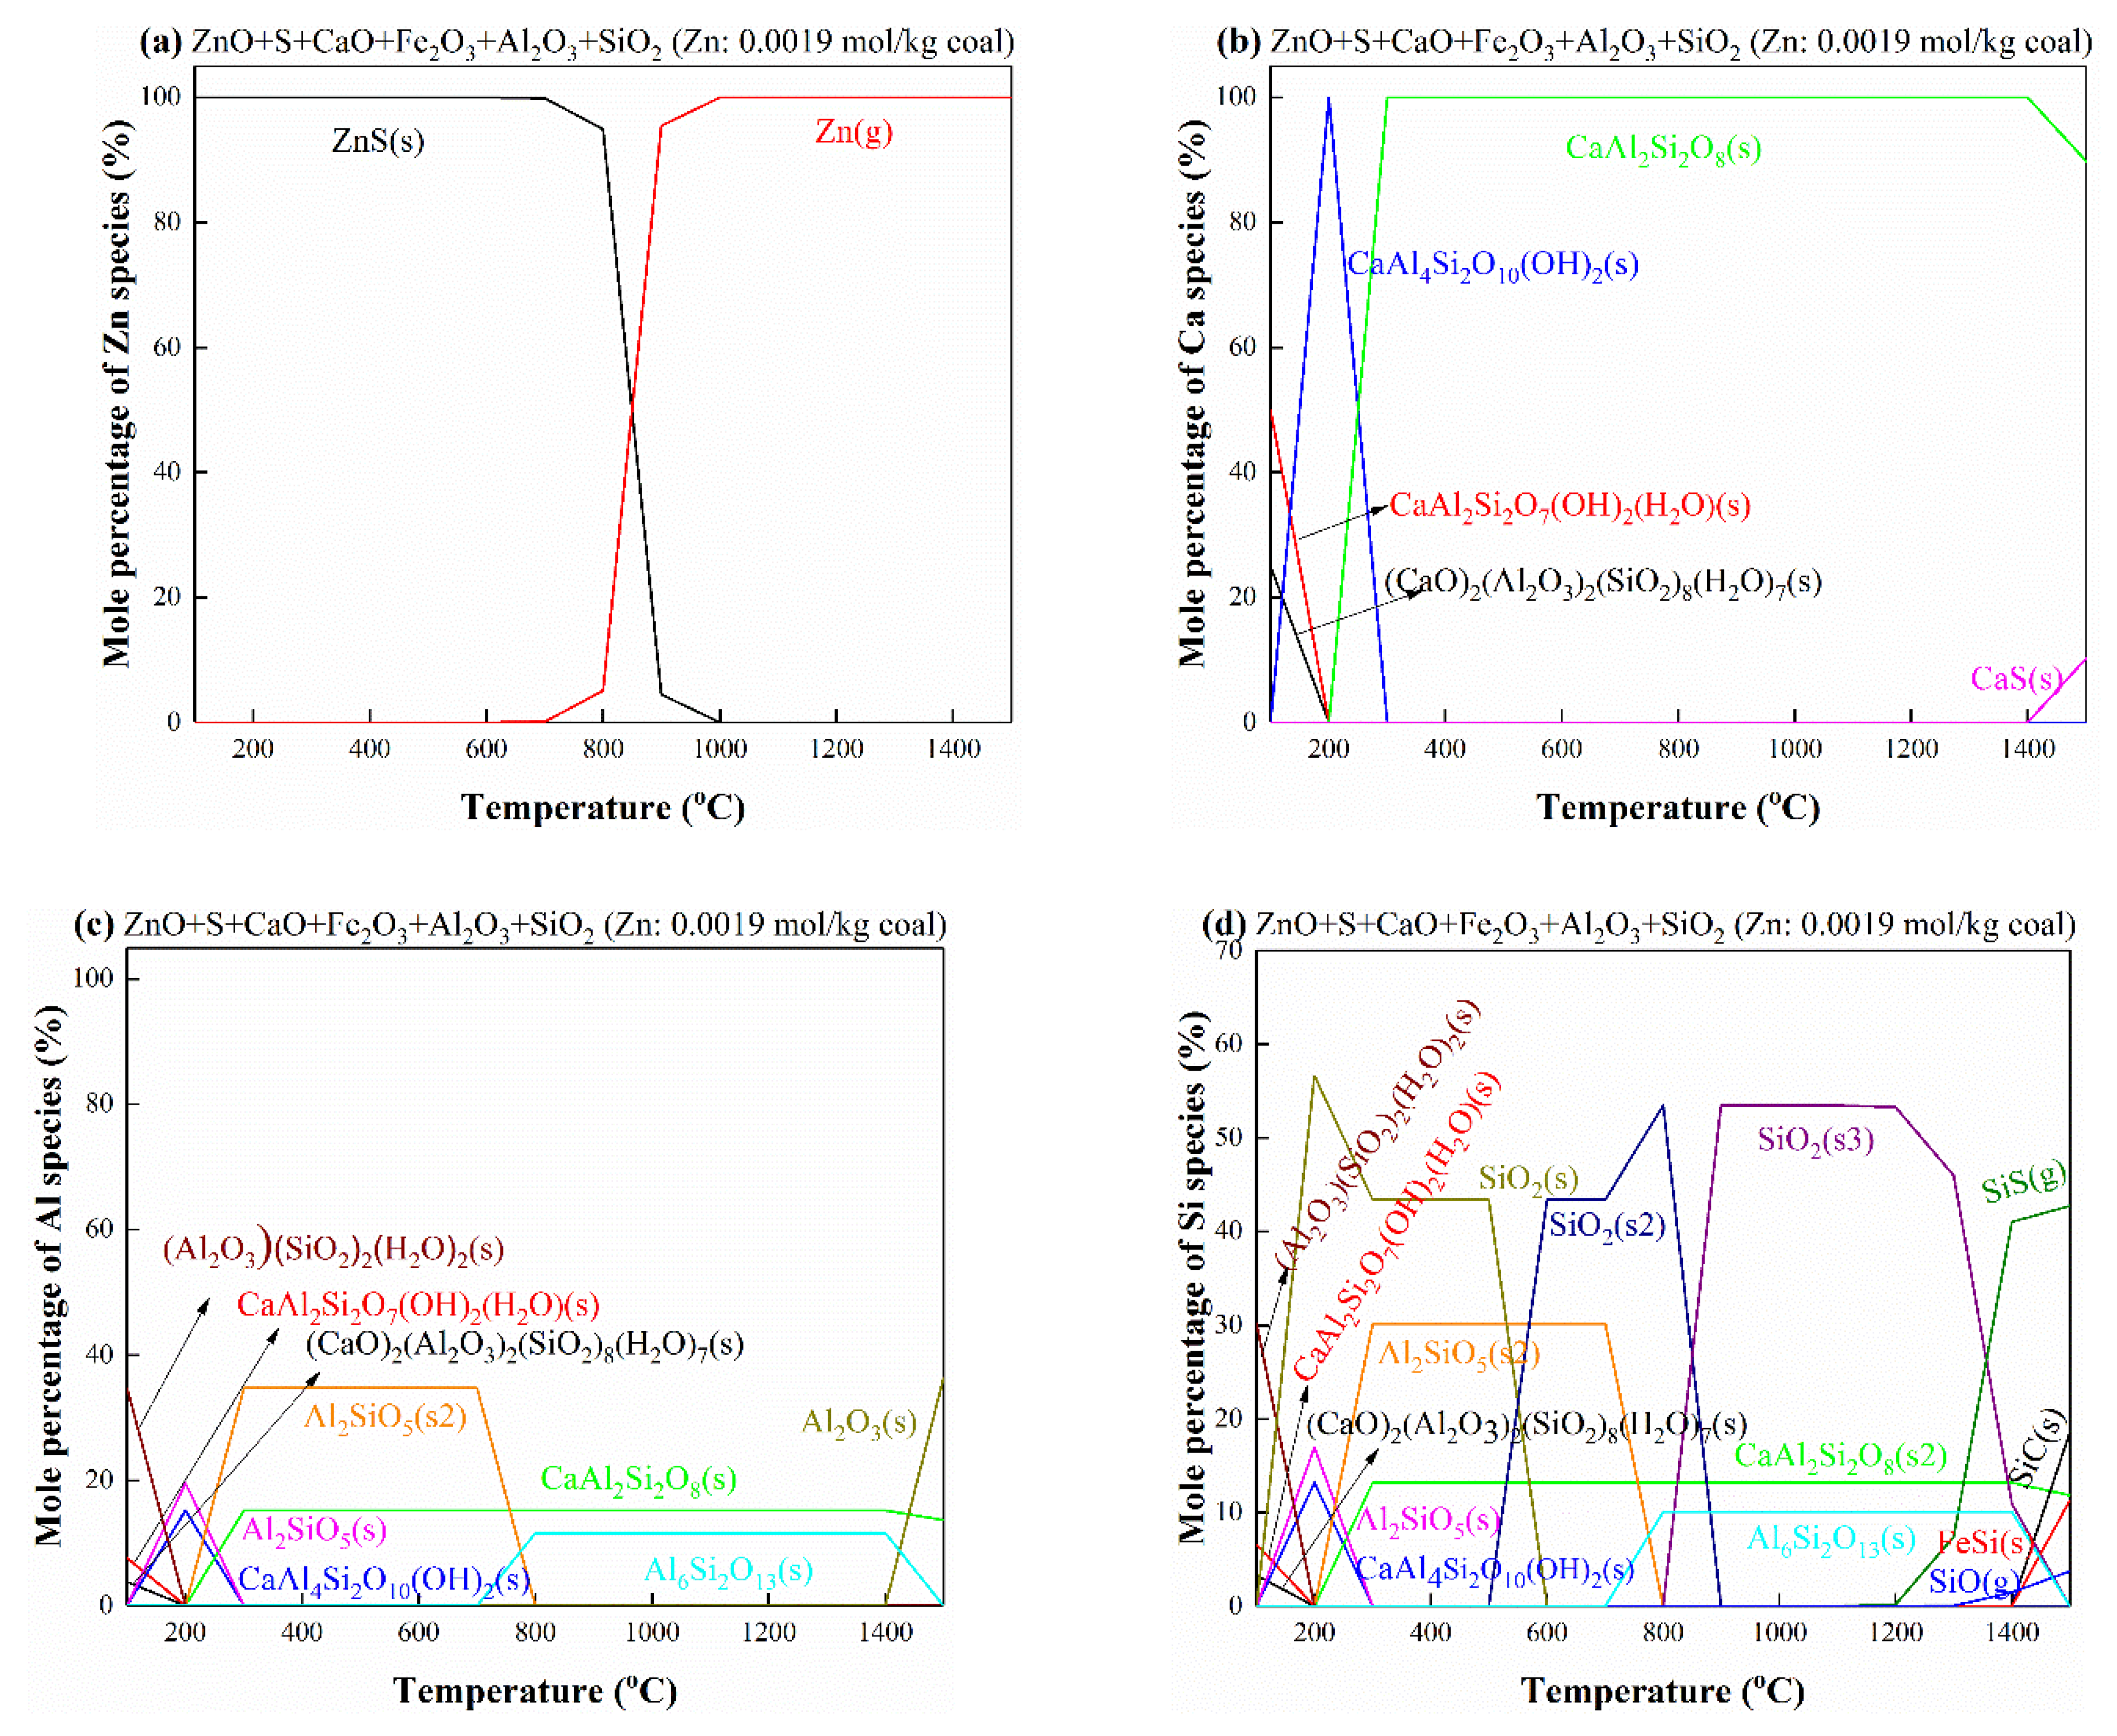
Finally, when Zn, Ca, Al, Si and Fe are simultaneously present in the coal, their phase distributions are displayed in Figure 14 and Figure S8. As the Zn content is low (Zn/S/Ca/Al/Si/Fe = 0.0019/0.24/0.07/0.46/0.53/0.06), Zn still interacts with S to generate ZnS, which turns into gaseous Zn at 700–1000 °C (Figure 14a). The reactions among Ca, Si and Al are complex. CaAl2Si2O7(OH)2(H2O), (CaO)2(Al2O3)2(SiO2)8(H2O)7 and (Al2O3)(SiO2)2(H2O)2 all transform into CaAl4Si2O10(OH)2 and Al2SiO5(s) (kyanite) at 100–200 °C, and CaAl4Si2O10(OH)2 decomposes into CaAl2Si2O8 and Al2SiO5(s2) (andalusite) at 200–300 °C (Figure 14b,c). Meanwhile, the Al2SiO5(s) (kyanite) also transforms into Al2SiO5(s2) (andalusite) at 200 °C, and Al2SiO5(s2) (andalusite) converts into Al6Si2O13(s) at 700–800 °C (Figure 14c). A small amount of CaAl2Si2O8 decomposes and CaS is generated from 1400 °C (Figure 14b–d). At 1400–1500 °C, Al6Si2O13 transforms into Al2O3 and SiC under the action of carbon (Figure 14c,d). The phase distribution of Fe at high temperatures is affected by the presence of Si. Fe3C turns into FeSi at 1400–1500 °C (Figure 14e). When the Zn content is high (Zn/S/Ca/Al/Si/Fe = 0.62/0.24/0.07/0.46/0.53/0.06), Zn exists as ZnS, ZnAl2O4 and Zn2SiO4, as shown in Figure S8. Two-step decompositions at 200–500 and 800–1000 °C are observed for ZnAl2O4, in which the ZnAl2O4 converts into Zn2SiO4 and gaseous Zn, respectively (Figure S8a). Ca3Fe2Si3O12 and CaFeSi2O6 are formed at 100–200 and 100–300 °C, respectively. Ca3Fe2Si3O12 transforms into CaFeSi2O6 and Ca3Al2Si3O12 at 200–300 °C with a little decrease in ZnAl2O4 (Figure S8b,c). Then Ca3Al2Si3O12 converts into CaAl2Si2O8 at 300–400 °C along with consumption of ZnAl2O4 and SiO2(s) (Figure S8c,d). Subsequently, CaFeSi2O6 turns into CaAl2Si2O8 and Fe2SiO4 at 400–500 °C, accompanied by the decomposition of ZnAl2O4. Fe2SiO4 decomposes into elemental Fe and SiO2(s2) at 700–800 °C (Figure S8d,e). The elemental Fe combines with carbon to produce Fe3C at 800–900 °C, which then transforms to FeS at 1000–1100 °C. The FeS decomposes and Fe3C is formed again at 1300–1400 °C, which finally converts into FeSi at 1400–1500 °C.
Consistent with the XRD results, when the Zn content is low (molar ratio of Zn/S < 1), ZnS and SiO2 are the main minerals in the obtained coke, and ZnS, ZnAl2O4 and SiO2 can be detected when the Zn content is high (molar ratio of Zn/S > 1). In addition, CaS is present in the coke whatever the Zn content, which is not the situation as predicted by the thermodynamic equilibrium simulations. It is deduced that there is limited contact of Ca with Al and Si species in the coal, so the Ca preferentially combines with S dispersed in the coal matrix to generate CaS. Moreover, ZnO is found in the coke obtained at 700 °C, while the theoretically predicted Zn2SiO4 is not detected, which should be due to the physical isolation of Zn from Si in the coal or the crystallite size of generated Zn2SiO4 being too small to be detected by the XRD measurement. Based on the above analysis, the Zn species in the blends of coal and waste tires can migrate to the gas products in the form of gaseous Zn via a carbothermal reduction reaction during pyrolysis. The formation temperature of gaseous Zn is dependent on the contents of Zn, S and mineral elements in coal. The S, Al and Si can interact with Zn to inhibit the volatilization of Zn from coke. The reaction sequence with Zn is S > Al > Si, and the thermal stability of products is in the order of ZnS > ZnAl2O4 > Zn2SiO4. The decomposition of ZnS, ZnAl2O4 and Zn2SiO4 can occur in the temperature range of 700–1200, 600–1000 and 600–900 °C, respectively. Moreover, Fe and Ca can also bind with S to form metal sulfides, but their interactions are weaker than that of Zn with S and ZnS can be preferentially formed. In actual industrial production, the central temperature of coke cake produced in the coke oven is controlled at 950–1050 °C to ensure sufficient strength, so most of the Zn species can escape from the coke, which may be detrimental to the refractory bricks of the coke oven. Additionally, the deposition of Zn also increases the risk of clogging of ascension pipe that is used for the discharge of coke oven crude gas.
Although the transformation mechanisms described above are concentrated on the co-pyrolysis process of waste tires and coal, the corresponding rules are also suitable to understand the thermochemical behaviors of Zn in systems containing C, S, Ca, Al, Si and Fe under an inert atmosphere. Particularly, except for Zn, the contents of S and other inorganic components such as Ca, Al, Si and Fe are appreciable in the waste tires [34,61,62,63], which is also verified by our analysis results (see Table 2). Therefore, the conclusions from this study can also provide insights into the migration characteristics of Zn during the pyrolysis of waste tires alone, which is vital to the prevention and control of Zn emission to reduce the environmental burden.

4. Conclusions

In this paper, the transformation behaviors of Zn during co-pyrolysis of waste tires and coal were studied in a fixed-bed reactor system. It is shown that the relative percentage of Zn in the pyrolytic products (coke, tar and gas) obtained at different temperatures is closely related to the content of S and mineral elements (Ca, Al, Si and Fe) in the coal. When the molar ratio of Zn to S is less than 1, ZnS is formed in the coke obtained at 700 °C, resulting in ca. 97% of Zn residual rate in the coke. As the pyrolysis temperature increases to 900 and 1050 °C, ZnS is reduced to metallic Zn vapor by carbon, so the residual rate of Zn in coke decreases and the percentage of Zn in the tar increases. When the molar of Zn exceeds that of S, ZnO and ZnS coexist in the coke produced at 700 °C and partial ZnO is reduced to gaseous Zn by carbon, causing a small decrease in Zn residual rate in coke. Excess ZnO can react with Al2O3 to generate ZnAl2O4 at 900 °C, resulting in the enhancement of the Zn residual rate in coke (50%). Additionally, ZnAl2O4 can also be reduced by carbon to generate gaseous Zn at 1050 °C, giving rise to a reduction of the Zn residual rate in coke to 10%. The thermodynamic equilibrium simulations show that the formation temperature of gaseous Zn is dependent on the contents of Zn, S and mineral elements in coal. The S, Al and Si can interact with Zn to inhibit the volatilization of Zn from coke in the sequence of S > Al > Si, and the thermal stability of products is in the order of ZnS > ZnAl2O4 > Zn2SiO4. The decompositions of ZnS, ZnAl2O4 and Zn2SiO4 into Zn vapor occur in the temperature range of 700–1200, 600–1000 and 600–900 °C, respectively. Based on the above analysis, most Zn species can escape from the coke during the industrial cokemaking process, which is harmful to the refractory materials of the coke oven and brings the risk of blockage of ascension pipe due to the deposition of Zn. The Zn transformation mechanisms studied in this work are applicable not only for the co-pyrolysis of coal and waste tires but also for the pyrolysis of waste tires alone.

Supplementary Materials

The following supporting information can be downloaded at: https://www.mdpi.com/article/10.3390/pr10081635/s1, Figure S1: Thermodynamic equilibrium distributions of Zn when S and Zn coexist in the coal; Table S1: Mass distributions of Zn in the pyrolytic products; Figure S2: The thermodynamic equilibrium distributions of Zn (a, b), Ca (c, d) and Fe (e, f) when S, Zn, Ca and Fe coexist in the system; Figure S3: The thermodynamic equilibrium distributions of Zn (a, c) and silicon (b, d) when S, Zn and Si coexist in the system; Figure S4: The thermodynamic equilibrium distributions of Zn (a, c) and Al (b, d) when S, Zn and Al coexist in the system; Figure S5: Thermodynamic equilibrium distributions of Zn (a, b), Si (c, d) and Al (e, f) when S, Zn, Si and Al coexist in the system; Table S2: Standard Gibbs free energies of typical reactions; Figure S6: The standard-state Gibbs free energies of reactions 1−13 as a function of temperature; Figure S7: Thermodynamic equilibrium distributions of Zn (a, b), Ca (c, d) and Al (e, f) when S, Zn, Ca and Al coexist in the system; Figure S8: Thermodynamic equilibrium distributions of Zn (a), Ca (b), Al (c), Si (d) and Fe (e) in the coal when the Zn content is high (Zn/S/Ca/Al/Si/Fe =0.62/0.24/0.07/0.46/0.53/0.06).

Author Contributions

Conceptualization, S.J. and M.J.; methodology, S.J. and Y.L.; software, S.J. and Y.L.; validation, S.J., Y.L. and X.W.; formal analysis, Y.L., J.W., X.W. and R.Z.; investigation, Y.L., J.W., X.W. and R.Z.; resources, J.W. and L.L.; data curation, S.J. and Y.L.; writing—original draft preparation, Y.L.; writing—review and editing, S.J.; visualization, S.J. and Y.L.; supervision, L.L. and M.J.; project administration, M.J.; funding acquisition, L.L. All authors have read and agreed to the published version of the manuscript.

Funding

This research was funded by the National Natural Science Foundation of China [No. U1710252].

Institutional Review Board Statement

Not applicable.

Informed Consent Statement

Not applicable.

Data Availability Statement

The data used to support the findings of this study are available from the corresponding author upon request.

Acknowledgments

This work was financially supported by the National Natural Science Foundation of China (No. U1710252).

Conflicts of Interest

The authors declare no conflict of interest.

References

  1. Elbaba, I.F.; Wu, C.; Williams, P.T. Catalytic pyrolysis-gasification of waste tire and tire elastomers for hydrogen production. Energy Fuels 2010, 24, 3928–3935. [Google Scholar] [CrossRef]
  2. Lehmann, C.M.B.; Rostam-Abadi, M.; Rood, M.J.; Sun, J. Reprocessing and reuse of waste tire rubber to solve air-quality related problems. Energy Fuels 1998, 12, 1095–1099. [Google Scholar] [CrossRef]
  3. Pan, D.L.; Jiang, W.T.; Guo, R.T.; Huang, Y.; Pan, W.G. Thermogravimetric and kinetic analysis of Co-combustion of waste tires and coal blends. ACS Omega 2021, 6, 5479–5484. [Google Scholar] [CrossRef] [PubMed]
  4. RMurillo; Navarro, M.V.; López, J.M.; Aylón, E.; Callén, M.S.; García, T.; Mastral, A.M. Kinetic model comparison for waste tire char reaction with CO2. Ind. Eng. Chem. Res. 2004, 43, 7768–7773. [Google Scholar] [CrossRef]
  5. Levendis, Y.A.; Atal, A.; Carlson, J.B. On the correlation of CO and PAH emissions from the combustion of pulverized coal and waste tires. Environ. Sci. Technol. 1998, 32, 3767–3777. [Google Scholar] [CrossRef]
  6. Zhang, Y.S.; Wu, C.; Nahil, M.A.; Williams, P. Pyrolysis-catalytic steam reforming/gasification of waste tires for production of carbon nanotubes and hydrogen. Energy Fuels 2015, 29, 3328–3334. [Google Scholar] [CrossRef]
  7. Levendis, Y.; Atal, A.; Carlson, J.; Dunayevskiy, Y.; Vouros, P. Comparative study on the combustion and emissions of waste tire crumb and pulverized coal. Environ. Sci. Technol. 1996, 30, 2742–2754. [Google Scholar] [CrossRef]
  8. Zaharia, M.; Sahajwalla, V.; Kim, B.C.; Khanna, R.; Saha-Chaudhury, N.; O’Kane, P.; Dicker, J.; Skidmore, C.; Knights, D. Recycling of rubber tires in electric arc furnace steelmaking: Simultaneous combustion of metallurgical coke and rubber tyres blends. Energy Fuels 2009, 23, 2467–2474. [Google Scholar] [CrossRef]
  9. Díaz-Bautista, M.A.; Alvarez-Rodríguez, R.; Clemente-Jul, C.; Mastral, A.M. AFBC of coal with tyre rubber. Influence of the co-combustion variables on the mineral matter of solid by-products and on Zn lixiviation. Fuel 2013, 106, 10–20. [Google Scholar] [CrossRef]
  10. Kříž, V.; Brožová, Z.; Přibyl, O.; Sýkorová, I. Possibility of obtaining hydrogen from coal/waste-tyre mixture. Fuel Processing Technol. 2008, 89, 1069–1075. [Google Scholar] [CrossRef]
  11. Straka, P.; Bučko, Z. Co-gasification of lignite/waste-tyre mixture in a moving bed. Fuel Processing Technol. 2009, 90, 1202–1206. [Google Scholar] [CrossRef]
  12. Oni, B.A.; Sanni, S.E.; Olabode, O.S. Production of fuel-blends from waste tyre and plastic by catalytic and integrated pyrolysis for use in compression ignition (CI) engines. Fuel 2021, 297, 120801. [Google Scholar] [CrossRef]
  13. Murugan, S.; Ramaswamy, M.C.; Nagarajan, G. A comparative study on the performance, emission and combustion studies of a DI diesel engine using distilled tyre pyrolysis oil-diesel blends. Fuel 2008, 87, 2111–2121. [Google Scholar] [CrossRef]
  14. Frigo, S.; Seggiani, M.; Puccini, M.; Vitolo, S. Liquid fuel production from waste tyre pyrolysis and its utilisation in a diesel engine. Fuel 2014, 116, 399–408. [Google Scholar] [CrossRef]
  15. Bičáková, O.; Straka, P. Co-pyrolysis of waste tire/coal mixtures for smokeless fuel, maltenes and hydrogen-rich gas production. Energy Convers. Manag. 2016, 116, 203–213. [Google Scholar] [CrossRef]
  16. Mastral, A.M.; Murillo, R.; Callén, M.S.; García, T. Evidence of coal and tire interactions in coal-tire coprocessing for short residence times. Fuel Processing Technol. 2001, 69, 127–140. [Google Scholar] [CrossRef]
  17. Aydın, H.; İlkılıç, C. Optimization of fuel production from waste vehicle tires by pyrolysis and resembling to diesel fuel by various desulfurization methods. Fuel 2012, 102, 605–612. [Google Scholar] [CrossRef]
  18. Song, Z.L.; Yan, Y.C.; Xie, M.M.; Lv, X.; Yang, Y.Q.; Liu, L.; Zhao, X.Q. Effect of steel wires on the microwave pyrolysis of tire powders. ACS Sustain. Chem. Eng. 2018, 6, 13443–13453. [Google Scholar] [CrossRef]
  19. Leung, D.Y.C.; Yin, X.L.; Zhao, Z.L.; Xu, B.Y.; Chen, Y. Pyrolysis of tire powder: Influence of operation variables on the composition and yields of gaseous product. Fuel Processing Technol. 2002, 79, 141–155. [Google Scholar] [CrossRef]
  20. Lopez, G.; Olazar, M.; Aguado, R.; Elordi, G.; Amutio, M.; Artetxe, M.; Bilbao, J. Vacuum pyrolysis of waste tires by continuously feeding into a conical spouted bed reactor. Ind. Eng. Chem. Res. 2010, 49, 8990–8997. [Google Scholar] [CrossRef]
  21. Osorio-Vargas, P.; Shanmugaraj, K.; Herrera, C.; Campos, C.H.; Torres, C.C.; Castillo-Puchi, F.; Arteaga-Pérez, L.E. Valorization of waste tires via catalytic fast pyrolysis using palladium supported on natural halloysite. Ind. Eng. Chem. Res. 2021, 60, 18806–18816. [Google Scholar] [CrossRef]
  22. Campuzano, F.; Cardona-Uribe, N.; Agudelo, A.F.; Sarathy, S.M.; Martínez, J.D. Pyrolysis of waste tires in a twin-auger reactor using CaO: Assessing the physicochemical properties of the derived products. Energy Fuels 2021, 35, 8819–8833. [Google Scholar] [CrossRef]
  23. Onay, O.; Koca, H. Determination of synergetic effect in co-pyrolysis of lignite and waste tyre. Fuel 2015, 150, 169–174. [Google Scholar] [CrossRef]
  24. Ren, Q.Q.; Wu, Z.Y.; Hu, S.; He, L.M.; Su, S.; Wang, Y.; Jiang, L.; Xiang, J. Sulfur self-doped char with high specific capacitance derived from waste tire: Effects of pyrolysis temperature. Sci. Total Environ. 2020, 741, 140193. [Google Scholar] [CrossRef] [PubMed]
  25. Xu, J.Q.; Yu, J.X.; He, W.Z.; Huang, J.W.; Xu, J.S.; Li, G.M. Replacing commercial carbon black by pyrolytic residue from waste tire for tire processing: Technically feasible and economically reasonable. Sci. Total Environ. 2021, 793, 148597. [Google Scholar] [CrossRef] [PubMed]
  26. Xu, J.Q.; Yu, J.X.; He, W.Z.; Huang, J.W.; Xu, J.S.; Li, G.M. Recovery of carbon black from waste tire in continuous commercial rotary kiln pyrolysis reactor. Sci. Total Environ. 2021, 772, 145507. [Google Scholar] [CrossRef]
  27. Xu, J.Q.; Yu, J.X.; Xu, J.L.; Sun, C.L.; He, W.Z.; Huang, J.W.; Li, G.M. High-value utilization of waste tires: A review with focus on modified carbon black from pyrolysis. Sci. Total Environ. 2020, 742, 140235. [Google Scholar] [CrossRef]
  28. Leeder, W.R. Additions of discarded automobile tyres to coke-oven blends. Fuel 1974, 53, 283–284. [Google Scholar] [CrossRef]
  29. Chaala, A.; Roy, C. Production of coke from scrap tire vacuum pyrolysis oil. Fuel Processing Technol. 1996, 46, 227–239. [Google Scholar] [CrossRef]
  30. Acevedo, B.; Barriocanal, C.; Alvarez, R. Pyrolysis of blends of coal and tyre wastes in a fixed bed reactor and a rotary oven. Fuel 2013, 113, 817–825. [Google Scholar] [CrossRef]
  31. Han, M.C.; He, H.W.; Kong, W.K.; Dong, K.; Wang, B.Y.; Yan, X.; Wang, L.M.; Ning, X. High-performance electret and antibacterial polypropylene meltblown nonwoven materials doped with boehmite and ZnO nanoparticles for air filtration. Fibers Polym. 2022, 23, 1947–1955. [Google Scholar] [CrossRef]
  32. Cheng, Z.L.; Guo, Z.G.; Fu, P.; Yang, J.; Wang, Q.W. New insights into the effects of methane and oxygen on heat/mass transfer in reactive porous media. Int. Commun. Heat Mass Transf. 2021, 129, 105652. [Google Scholar] [CrossRef]
  33. Liu, Y.; Zhang, Z.L.; Liu, X.; Wang, L.; Xia, X.H. Ore image classification based on small deep learning model: Evaluation and optimization of model depth, model structure and data size. Miner. Eng. 2021, 172, 107020. [Google Scholar] [CrossRef]
  34. Fernandez, A.M.; Barriocanal, C.; Gupta, S.; French, D. Effect of blending carbon-bearing waste with coal on mineralogy and reactivity of cokes. Energy Fuels 2014, 28, 291–298. [Google Scholar] [CrossRef]
  35. Fernández, A.M.; Barriocanal, C.; Díaz-Faes, E. Recycling tyre wastes as additives in industrial coal blends for cokemaking. Fuel Processing Technol. 2015, 132, 173–179. [Google Scholar] [CrossRef]
  36. Qin, X.; Xu, H.S.; Zhang, G.G.; Wang, J.D.; Wang, Z.; Zhao, Y.Q.; Wang, Z.Y.; Tan, T.W.; Bockstaller, M.R.; Zhang, L.Q.; et al. Enhancing the performance of rubber with nano ZnO as activators. ACS Appl. Mater. Interfaces 2020, 12, 48007–48015. [Google Scholar] [CrossRef]
  37. Rhodes, E.P.; Ren, Z.Y.; Mays, D.C. Zinc leaching from tire crumb rubber. Environ. Sci. Technol. 2012, 46, 12856–12863. [Google Scholar] [CrossRef]
  38. Esezobor, D.E.; Balogun, S.A. Zinc accumulation during recycling of iron oxide wastes in the blast furnace. Ironmak. Steelmak. 2006, 33, 419–425. [Google Scholar] [CrossRef]
  39. Zhang, F.; An, S.L.; Luo, G.P.; Zhang, S.Z. Behaviours of zinc and lead in blast furnace of Baotou iron and steel group Co. Adv. Mater. Res. 2011, 194, 306–309. [Google Scholar] [CrossRef]
  40. Stepin, G.M.; Mkrtchan, L.S.; Dovlyadov, I.V.; Borshchevskii, I.K. Problems related to the presence of Zinc in Russian blast-furnace smelting and ways of solving them. Metallurgist 2001, 45, 382–390. [Google Scholar] [CrossRef]
  41. Trinkel, V.; Mallow, O.; Thaler, C.; Schenk, J.; Rechberger, H.; Fellner, J. Behavior of chromium, nickel, lead, zinc, cadmium, and mercury in the blast furnace-a critical review of literature data and plant investigations. Ind. Eng. Chem. Res. 2015, 54, 11759–11771. [Google Scholar] [CrossRef]
  42. Yang, X.F.; Chu, M.S.; Shen, F.M.; Zhang, Z.M. Mechanism of zinc damaging to blast furnace tuyere refractory. Acta Metall. Sin.-Engl. 2009, 22, 454–460. [Google Scholar] [CrossRef]
  43. Li, K.J.; Zhang, J.L.; Liu, Z.J.; Wang, T.Q.; Ning, X.J.; Zhong, J.B.; Xu, R.S.; Wang, G.W.; Ren, S.; Yang, T.J. Zinc accumulation and behavior in tuyere coke. Metall. Mater. Trans. B 2014, 45, 1581–1588. [Google Scholar] [CrossRef]
  44. Zeng, X.W.; Zheng, S.; Zhou, H.C. The phenomena of secondary weight loss in high-temperature coal pyrolysis. Energy Fuels 2017, 31, 10178–10185. [Google Scholar] [CrossRef]
  45. Jones, I.; Preciado-Hernandez, J.; Zhu, M.M.; Zhang, J.; Zhang, Z.Z.; Zhang, D.K. Utilisation of spent tyre pyrolysis char as activated carbon feedstock: The role, transformation and fate of Zn from the perspective of production. Waste Manag. 2021, 126, 549–558. [Google Scholar] [CrossRef]
  46. Darmstadt, H.; Roy, C.; Kaliaguine, S. Characterization of pyrolytic carbon blacks from commercial tire pyrolysis plants. Carbon 1995, 33, 1449–1455. [Google Scholar] [CrossRef]
  47. Mis-Fernandez, R.; Azamar-Barrios, J.A.; Rios-Soberanis, C.R. Characterization of the powder obtained from wasted tires reduced by pyrolysis and thermal shock process. J. Appl. Res. Technol. 2008, 6, 95–104. [Google Scholar] [CrossRef]
  48. Ilnicka, A.; Okonski, J.; Cyganiuk, A.W.; Patyk, J.; Lukaszewicz, J.P. Zinc regarding the utilization of waste tires by pyrolysis. Pol. J. Environ. Stud. 2016, 25, 2683–2687. [Google Scholar] [CrossRef]
  49. Cataldo, F. On the characterisation of carbon black from tire pyrolysis. Fuller. Nanotub. Carbon Nanostructures 2020, 28, 368–376. [Google Scholar] [CrossRef]
  50. Zhou, Q.Q.; Yang, S.S.; Wang, H.T.; Liu, Z.Y.; Zhang, L. Selective deoxygenation of biomass volatiles into light oxygenates catalysed by S-doped, nanosized zinc-rich scrap tyre char with in-situ formed multiple acidic sites. Appl. Catal. B Environ. 2021, 282, 119603. [Google Scholar] [CrossRef]
  51. Wang, B.; Li, W.; Ma, C.; Yang, W.; Pudasainee, D.; Gupta, R.; Sun, L. Synergistic effect on the co-gasification of petroleum coke and carbon-based feedstocks: A state-of-the-art review. J. Energy Inst. 2022, 102, 1–13. [Google Scholar] [CrossRef]
  52. Liu, Y.; Zhang, Z.L.; Liu, X.; Wang, L.; Xia, X.H. Efficient image segmentation based on deep learning for mineral image classification. Adv. Powder Technol. 2021, 32, 3885–3903. [Google Scholar] [CrossRef]
  53. Zhang, X.Y.; Ma, F.N.; Dai, Z.X.; Wang, J.; Chen, L.; Ling, H.; Soltanian, M.R. Radionuclide transport in multi-scale fractured rocks: A review. J. Hazard. Mater. 2022, 424, 127550. [Google Scholar] [CrossRef]
  54. Banerjee, S.S.; Hait, S.; Natarajan, T.S.; Wießner, S.; Stöckelhuber, K.W.; Jehnichen, D.; Janke, A.; Fischer, D.; Heinrich, G.; Busfield, J.J.; et al. Water-responsive and mechanically adaptive natural rubber composites by in situ modification of mineral filler structures. J. Phys. Chem. B 2019, 123, 5168–5175. [Google Scholar] [CrossRef] [PubMed]
  55. Wang, X.D.; Summers, C.J.; Wang, Z.L. Mesoporous single-crystal ZnO nanowires epitaxially sheathed with Zn2SiO4. Adv. Mater. 2004, 16, 1215–1218. [Google Scholar] [CrossRef]
  56. Yang, H.P.; Chen, H.P.; Ju, F.D.; Yan, R.; Zhang, S.H. Influence of pressure on coal pyrolysis and char gasification. Energy Fuels 2007, 21, 3165–3170. [Google Scholar] [CrossRef]
  57. Chen, H.P.; Luo, Z.W.; Yang, H.P.; Ju, F.D.; Zhang, S.H. Pressurized pyrolysis and gasification of Chinese typical coal samples. Energy Fuels 2008, 22, 1136–1141. [Google Scholar] [CrossRef]
  58. Cheng, J.; Zhang, Y.S.; Wang, T.; Norris, P.; Chen, W.Y.; Pan, W.P. Thermogravimetric-Fourier transform infrared spectroscopy-gas chromatography/mass spectrometry study of volatile organic compounds from coal pyrolysis. Energy Fuels 2017, 31, 7042–7051. [Google Scholar] [CrossRef]
  59. Seidelt, S.; Müller-Hagedorn, M.; Bockhorn, H. Description of tire pyrolysis by thermal degradation behavior of main components. J. Anal. Appl. Pyrolysis 2006, 75, 11–18. [Google Scholar] [CrossRef]
  60. Yu, D.; Ma, Z.; Wang, R. Efficient smart grid load balancing via fog and cloud computing. Math. Probl. Eng. 2022, 3151249. [Google Scholar] [CrossRef]
  61. Osipov, A.A.; Ul’yanov, V.V.; Gulevskii, V.A.; Mel’nikov, V.P.; Kharchuk, S.E. Thermodynamics of processes in the liquid-metal pyrolysis of waste car tires. Theor. Found. Chem. Eng. 2019, 53, 1035–1047. [Google Scholar] [CrossRef]
  62. Selbes, M.; Yilmaz, O.; Khan, A.A.; Karanfil, T. Leaching of DOC, DN, and inorganic constituents from scrap tires. Chemosphere 2015, 139, 617–623. [Google Scholar] [CrossRef] [PubMed]
  63. Larionov, K.B.; Slyusarskiy, K.V.; Ivanov, A.A.; Mishakov, I.V.; Pak, A.Y.; Jankovsky, S.A.; Stoyanovskii, V.O.; Vedyagin, A.A.; Gubin, V.E. Comparative analysis of the characteristics of carbonaceous material obtained via single-staged steam pyrolysis of waste tires. J. Air Waste Manag. 2022, 72, 161–175. [Google Scholar] [CrossRef] [PubMed]
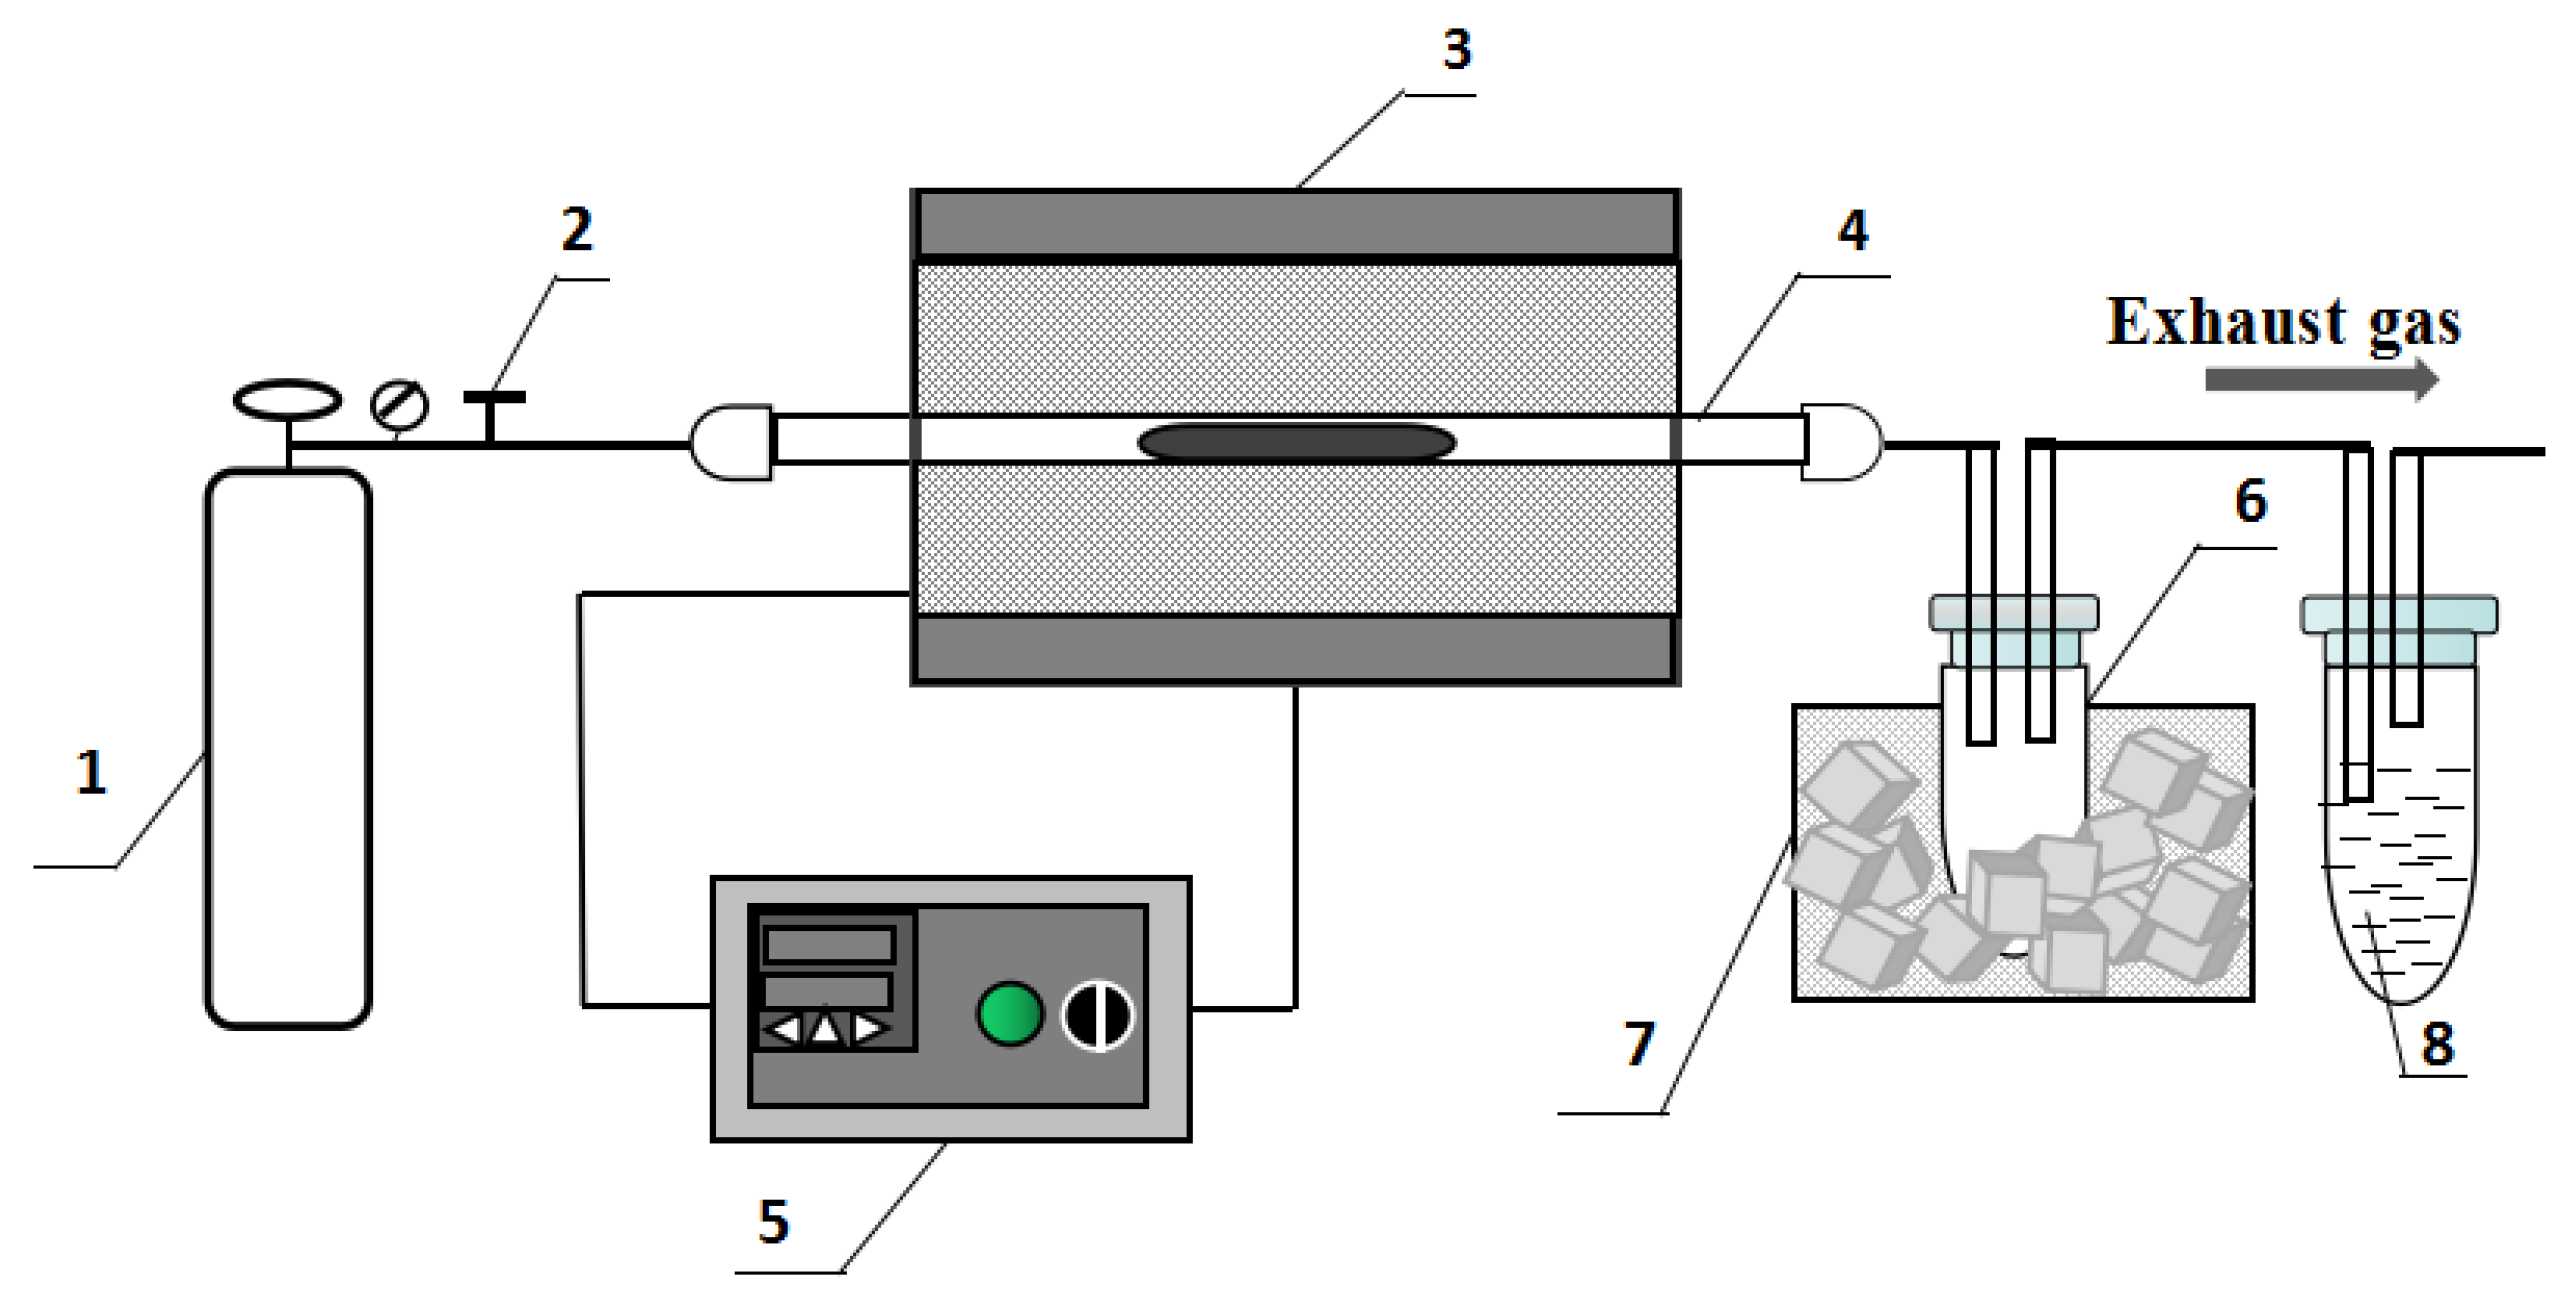
Figure 1. Schematic diagram of fixed-bed experimental device. 1—N2 cylinder, 2—flowmeter, 3—electric heating furnace, 4—quartz tube, 5—program temperature controller, 6—coal tar collector, 7—ice water, 8—HCl solution.
Processes 10 01635 g001
Figure 2. XRD patterns of base coal and three tire wastes (a) and their ashes (b).
Processes 10 01635 g002
Figure 3. TG-DTG (a) and DSC (b) curves of coal, WT-2, coal containing 5 wt.% of WT-2 or 5 wt.% of ZnO.
Processes 10 01635 g003
Figure 4. XRD patterns of cokes obtained by the separate pyrolysis of coal (a) and WT-2 (b) at different temperatures.
Processes 10 01635 g004
Figure 5. XRD patterns of coke generated by pyrolysis of coal containing 1 wt.% (a), 3 wt.% (b) and 5 wt.% (c) of WT-2, 1 wt.% (d) and 5 wt.% (e) of ZnO.
Processes 10 01635 g005aProcesses 10 01635 g005b
Figure 6. The relative percentages (%) (a,c,e) and contents (g/g coke) (b,d,f) of Zn in the coke, tar and gas under different pyrolysis conditions.
Processes 10 01635 g006
Figure 7. The thermodynamic equilibrium distributions of Zn (ae) and generated amount of CO (c) when S and Zn coexist in the coal.
Processes 10 01635 g007aProcesses 10 01635 g007b
Figure 8. The thermodynamic equilibrium distributions of Zn (a,c), Ca (b,d) and generated amount of CO (e) when S, Zn and Ca coexist in the coal.
Processes 10 01635 g008
Figure 9. The thermodynamic equilibrium distributions of Zn (a,c) and Fe (b,d) when S, Zn and Fe coexist in the coal.
Processes 10 01635 g009
Figure 10. The thermodynamic equilibrium distributions of Zn (a,c), Si (b,d) and generated amount of CO (e) when Zn and Si coexist in the coal.
Processes 10 01635 g010aProcesses 10 01635 g010b
Figure 11. The thermodynamic equilibrium distributions of Zn (a,c), Al (b,d) and generated amount of CO (e) when Zn and Al coexist in the coal.
Processes 10 01635 g011aProcesses 10 01635 g011b
Figure 12. The thermodynamic equilibrium distributions of Zn (a,b), Si (c,d), Al (e,f) and generated amount of CO (g) when Zn, Si and Al coexist in the coal.
Processes 10 01635 g012aProcesses 10 01635 g012b
Figure 13. Thermodynamic equilibrium distributions of Zn (a,b), Ca (c,d) and Al (e,f) when Zn, Ca and Al coexist in the coal.
Processes 10 01635 g013
Figure 14. Thermodynamic equilibrium distributions of Zn (a), Ca (b), Al (c), Si (d) and Fe (e) in the coal when the Zn content is low (Zn/S/Ca/Al/Si/Fe = 0.0019/0.24/0.07/0.46/0.53/0.06).
Processes 10 01635 g014aProcesses 10 01635 g014b
Table 1. Characteristics of coal and tire wastes.
AmplesProximate AnalysisElemental AnalysisZn
(wt.% a)
Moisture
(wt.%)
Ash
(wt.% a)
VM b
(wt.% a)
C
(wt.% c)
N
(wt.% c)
H
(wt.% c)
S
(wt.% c)
O
(wt.% c)
Coal1.857.3626.2489.141.601.780.926.560.01
WT-11.357.0062.0287.930.623.811.675.972.17
WT-21.409.2460.3685.820.604.311.887.392.13
WT-31.509.7967.6883.940.604.282.079.112.24
a Dry basis. b Volatile matter. c Dry ash-free basis.
Table 2. Mineral compositions of coal and WT-2.
SamplesAl
(wt.%)
Ca
(wt.%)
Fe
(wt.%)
Mg
(wt.%)
Si
(wt.%)
Ti
(wt.%)
Coal1.230.270.330.0251.510.053
WT-20.0380.290.130.0421.010.006
Publisher’s Note: MDPI stays neutral with regard to jurisdictional claims in published maps and institutional affiliations.