
Optimization of the Sustainable Distribution Supply Chain Using the Lean Value Stream Mapping 4.0 Tool: A Case Study of the Automotive Wiring Industry

Abstract
:1. Introduction
2. Literature Review
2.1. Lean Production System
2.2. Research in VSM 4.0 Published between 2016 and 2021
2.2.1. Publications of the Theme in Relation to New Technologies between 2016 and 2021
2.2.2. Publications sur VSM Classique et VSM 4.0
3. Lean Value Stream Mapping VSM Implementation Method
3.1. Value Stream Mapping
3.2. Advantages of the Lean VSM Tool in Logistics
- It helps to go beyond the level of single individual processes and to visualize the entire supply chain as a whole (the VSM map starts with the arrival of the products at the warehouse and ends with the shipment of the products to the final customer);
- Detection of waste and indication of the causes;
- Providing a basis for discussing the importance of the various logistics processes;
- It constitutes a draft for discussion towards a lean approach, the outline of the plan of a future organization;
- The VSM map shows the links between the different product and information flows.
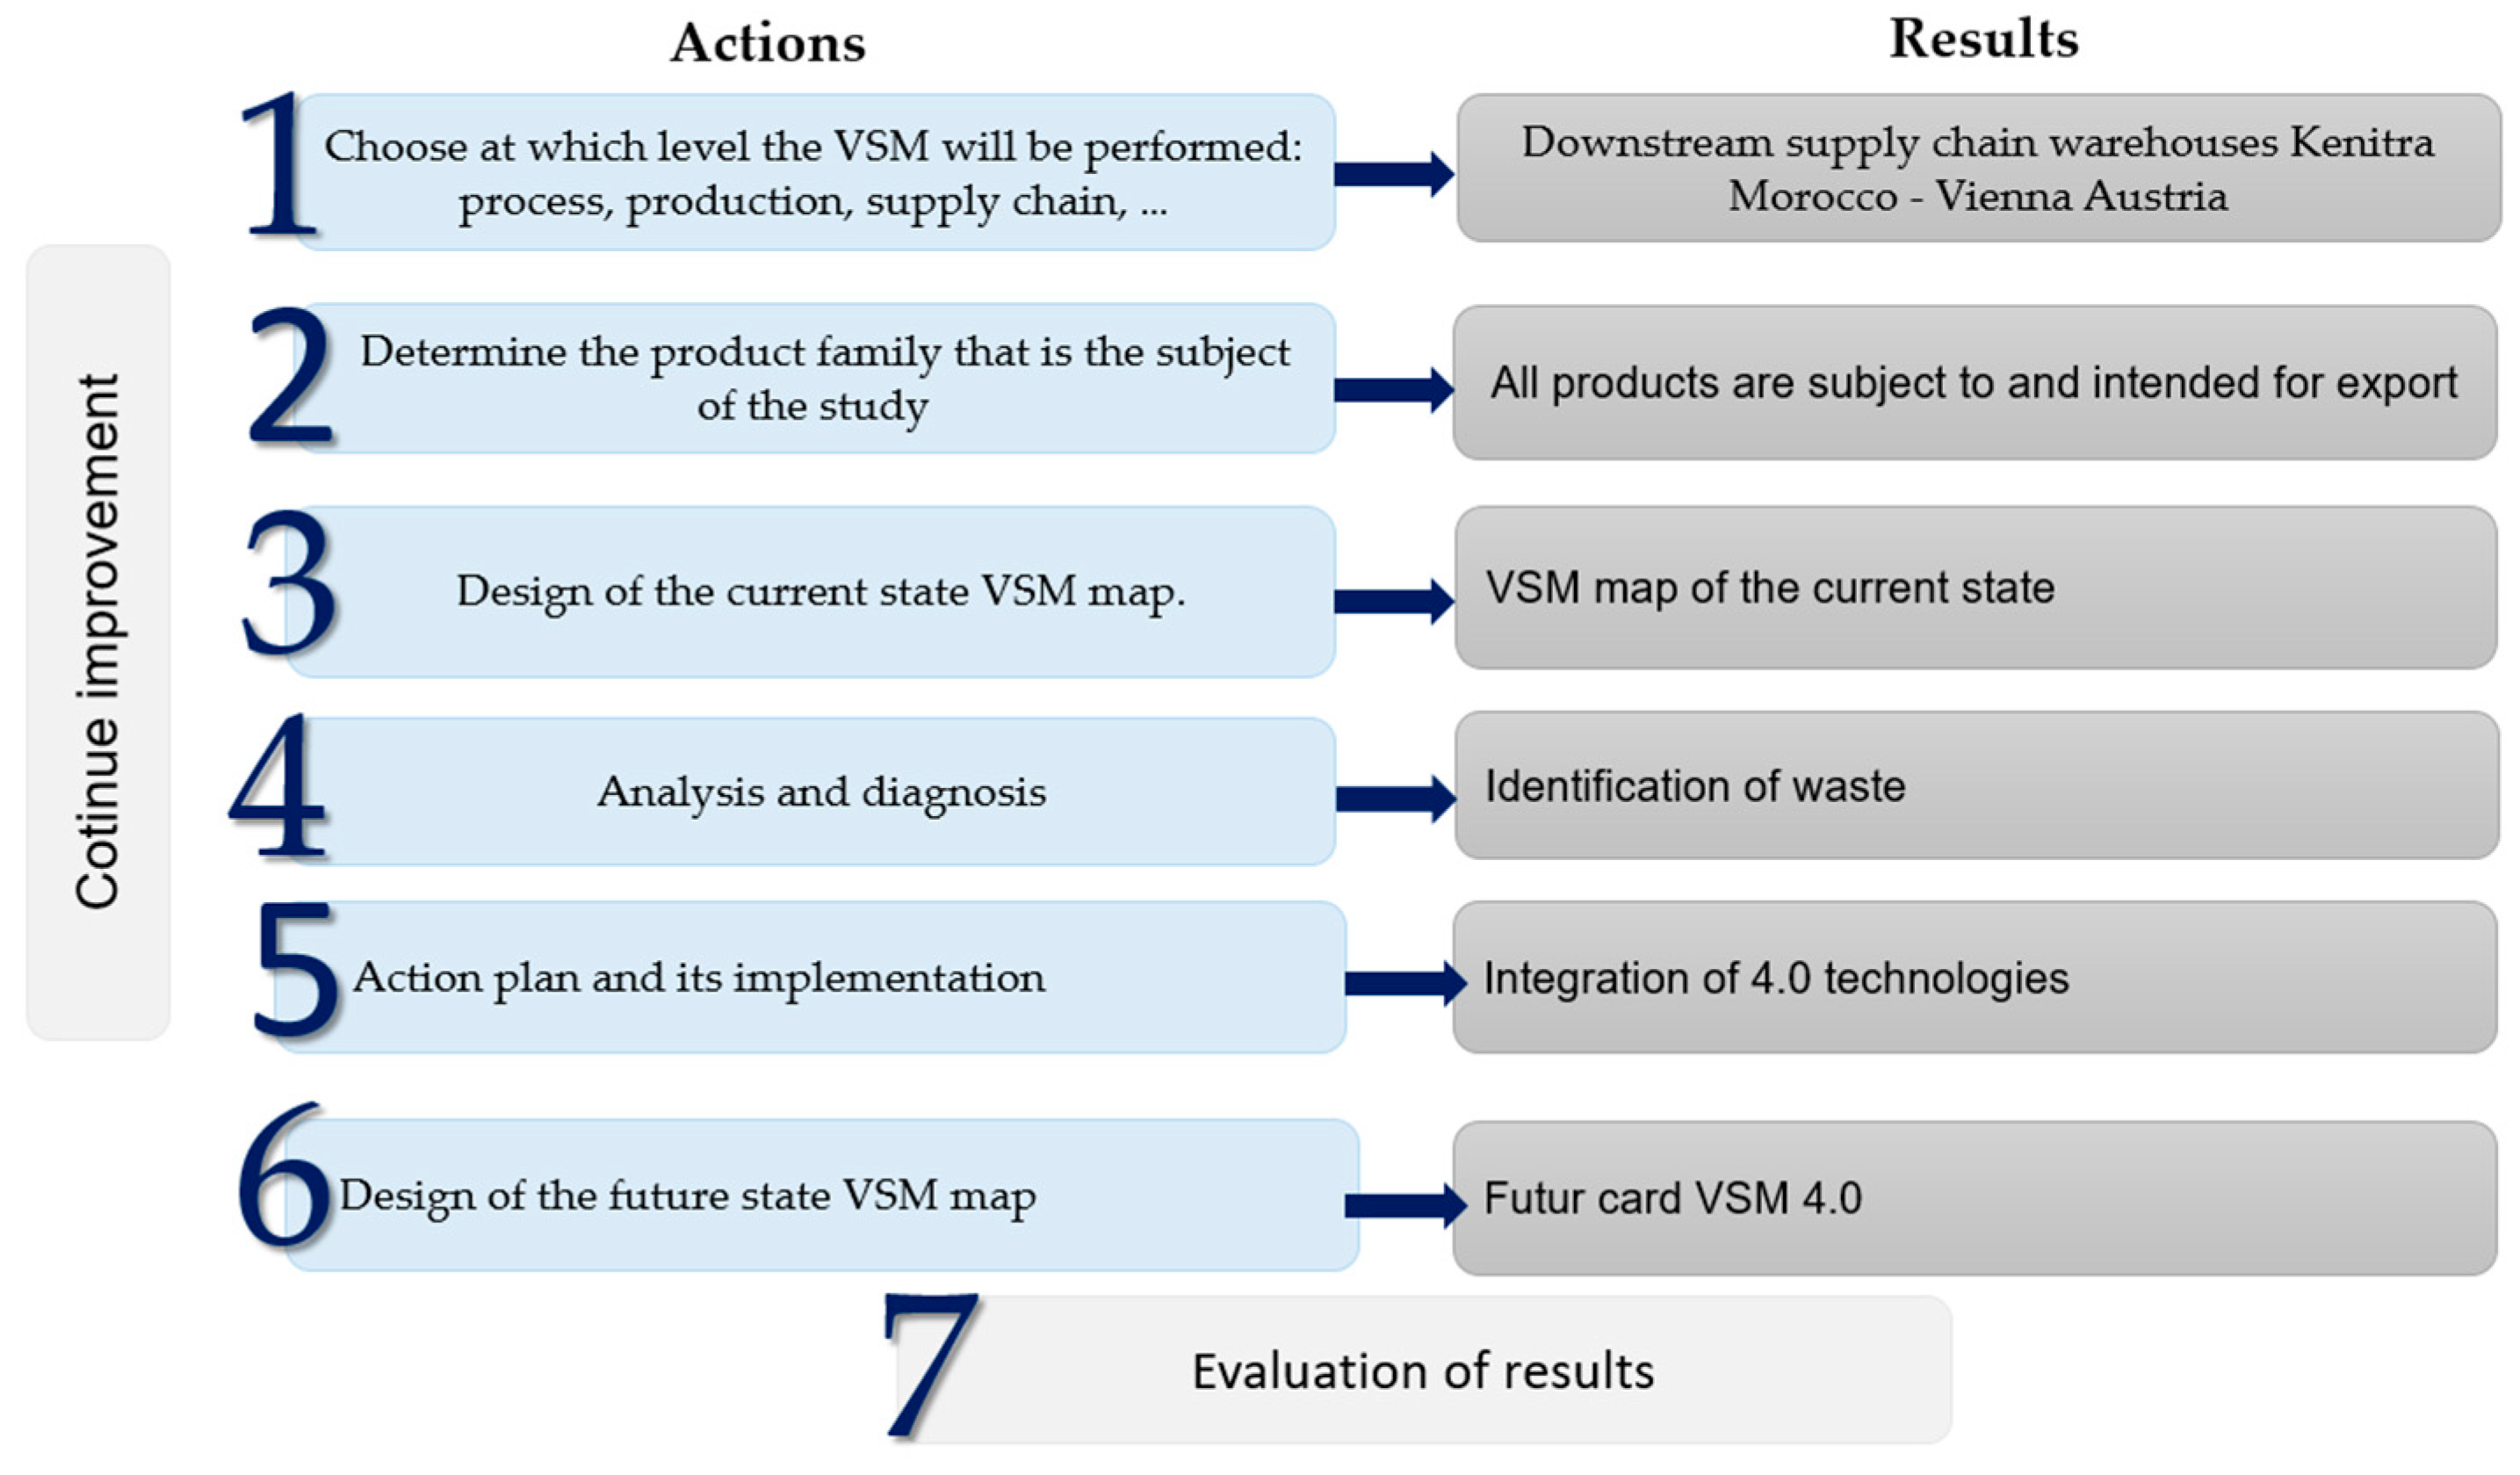
3.3. VSM Map Design Process
4. Contribution of 4.0 Technologies in Logistics
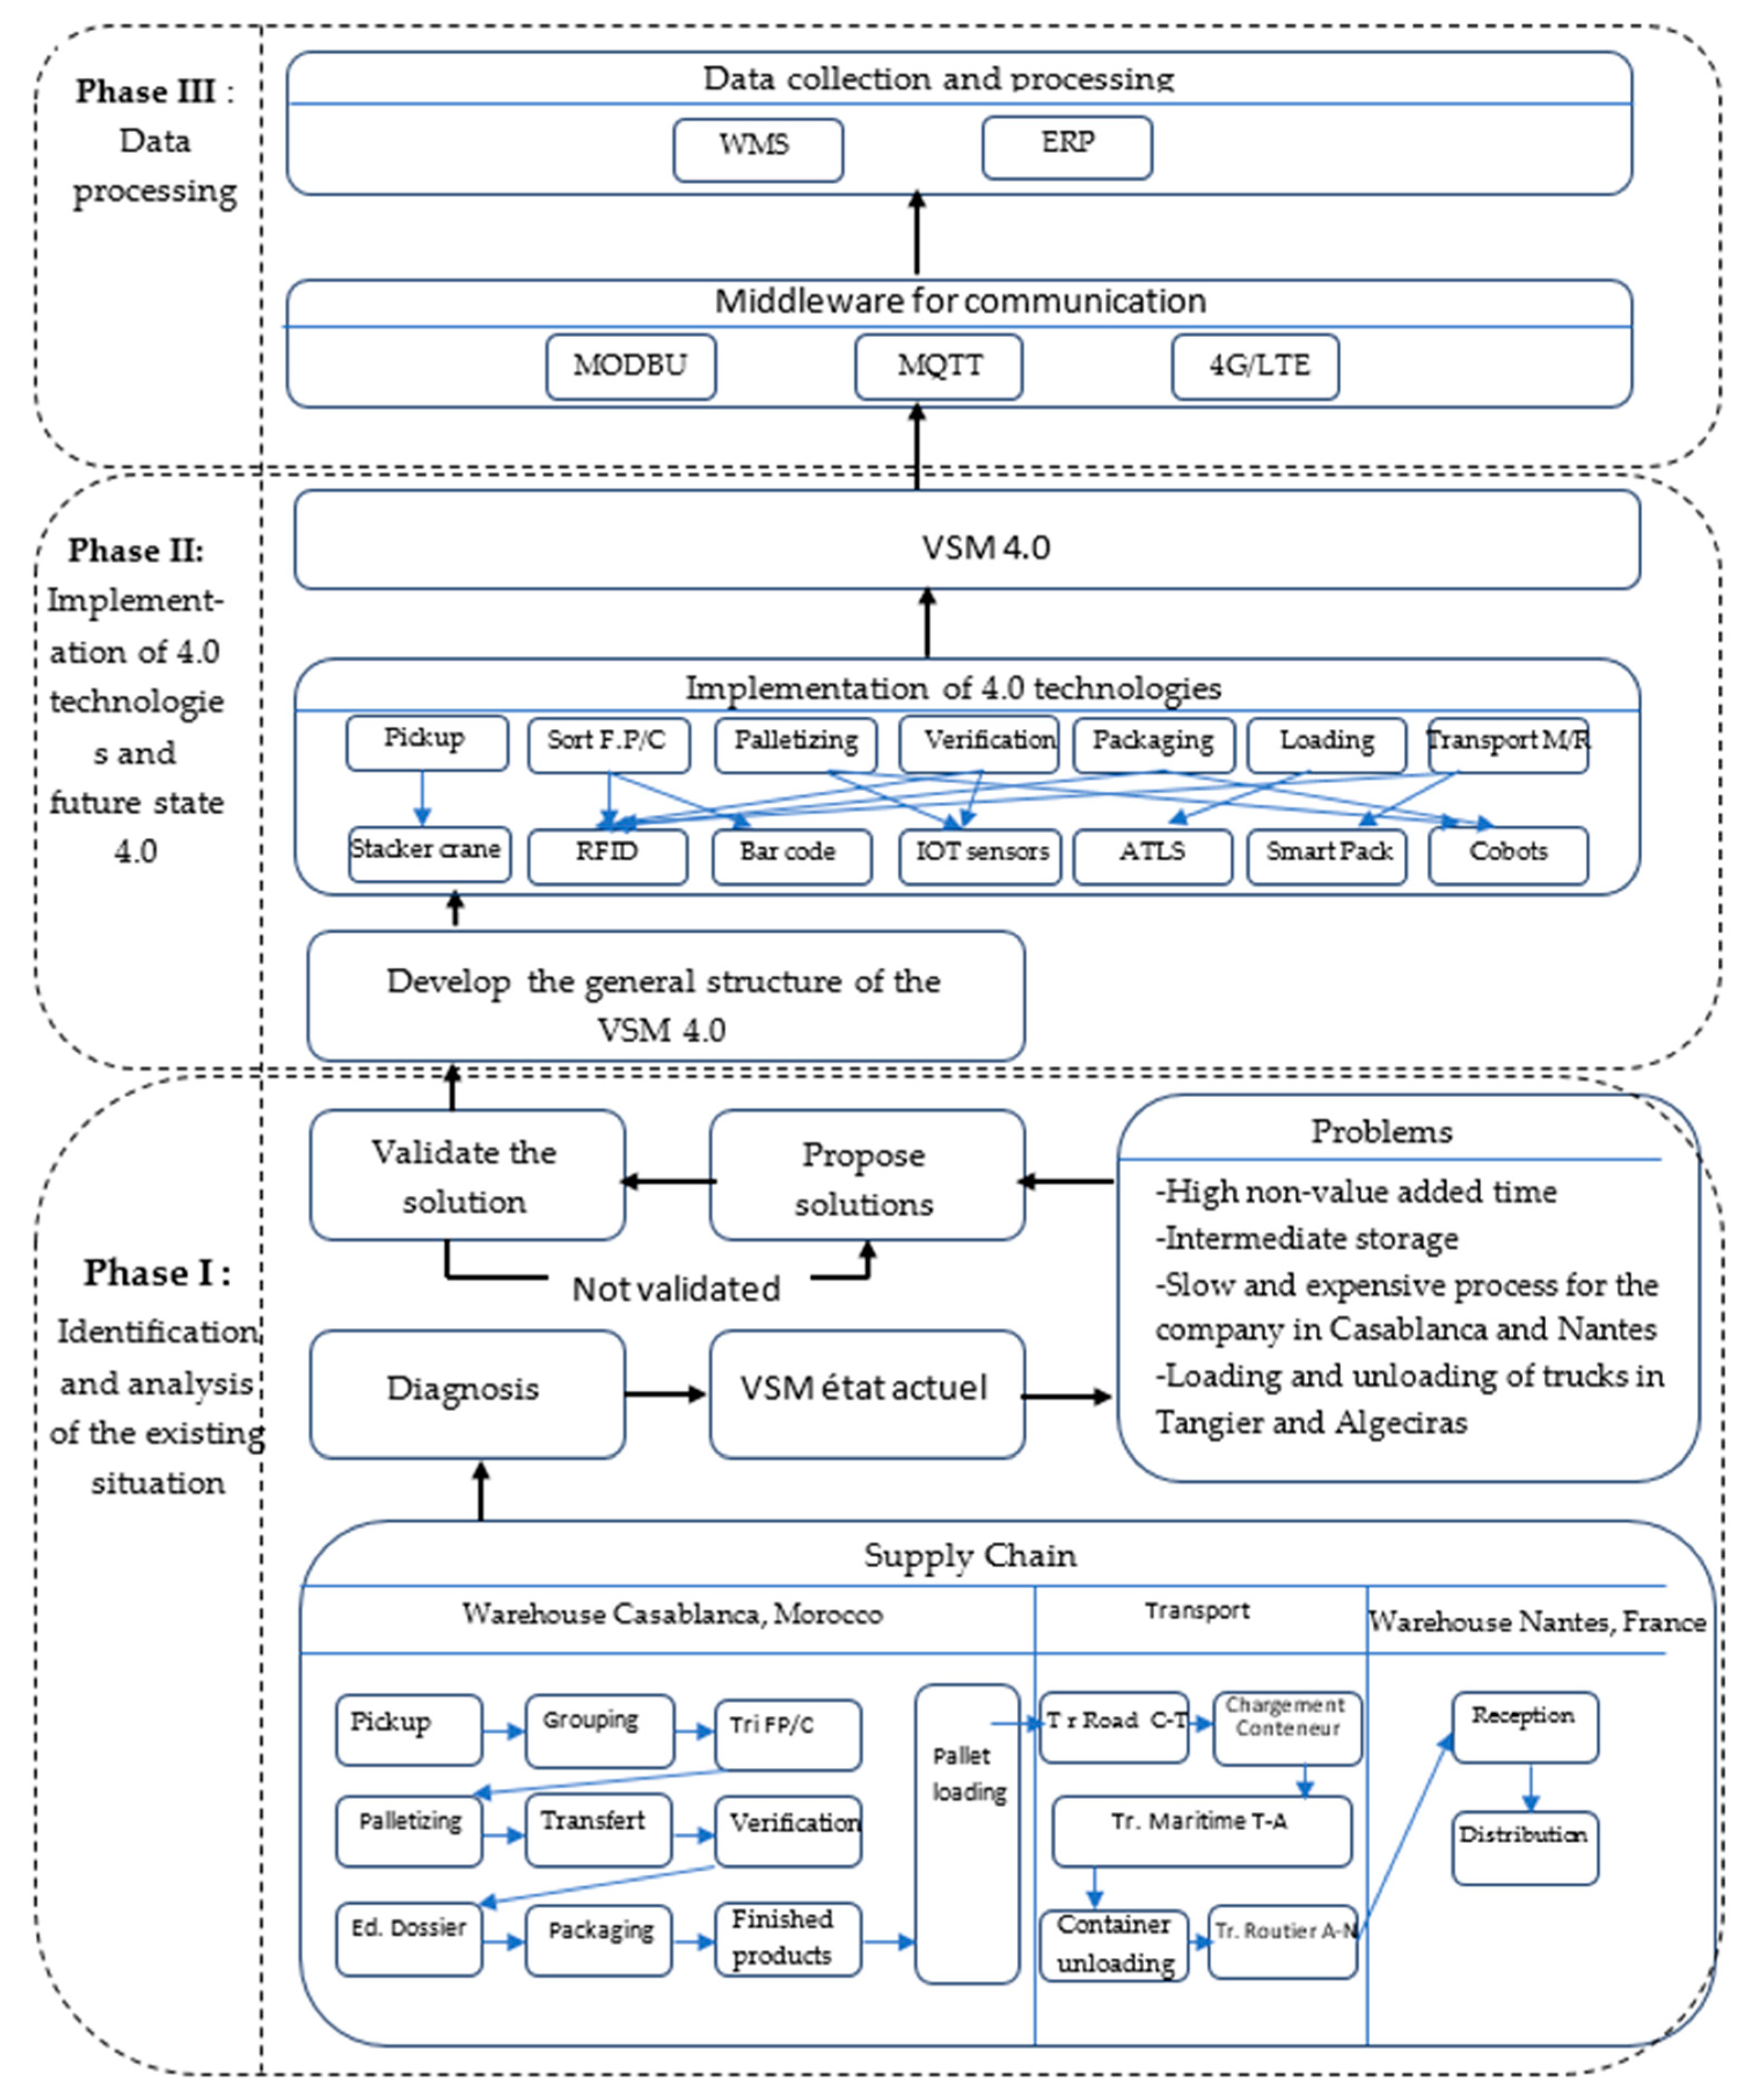
5. Case Study of an International Supply Chain in the Automotive Industry
5.1. Presentation of the Study
- (1)
- Road transport from Kenitra to Tangier by truck;
- (2)
- Sea transport from Tangier to Algeciras by a commercial ship;
- (3)
- Road transport from Algeciras to Vienna by the same truck;
- (4)
- It should be noted that for this transport, the goods remain in the truck from its loading in Kenitra until its unloading in Vienna, unlike the first method of transport which was the goods in containers.
5.2. Analysis of the Current State
- Identify the different steps in our supply chain, from order preparation to delivery to customers (see Table 3).
- Consider the logistics competitiveness of each country involved in this supply chain by proposing a new process.
- Present the map of the current state of the process. Each task is presented by a box attached with a data box that contains information such as the number of operators in each workstation with the cycle time of all tasks, Lead Time, Down Time, and Process Times.
5.3. Implementation of the Methodology
5.4. Implementation of Technologies
- The most efficient way to optimize time and gain more cost.
- The investment cost is not too high for the implementation of these technologies.
- The training and mastery of these technologies by its employees.
- The transition time between the current state and the future state is not long.
5.5. Future State Mapping VSM 4.0
- Automation and fusion of several processes: handling, transport, data collection, etc.
- The use of 4.0 technologies offers a fast product flow, and where data can be transmitted in real time.
- The VSM will continuously receive new data and information from the entire supply chain, allowing both the management of flows and the identification of waste that hinders the competitiveness of the company.
- Track the product throughout the process to identify and locate it quickly and above all to eliminate the possibility of loss. Simultaneous updating facilitates the consolidation of data, making it easier to make decisions.
- Change and improvement in the transportation of goods.
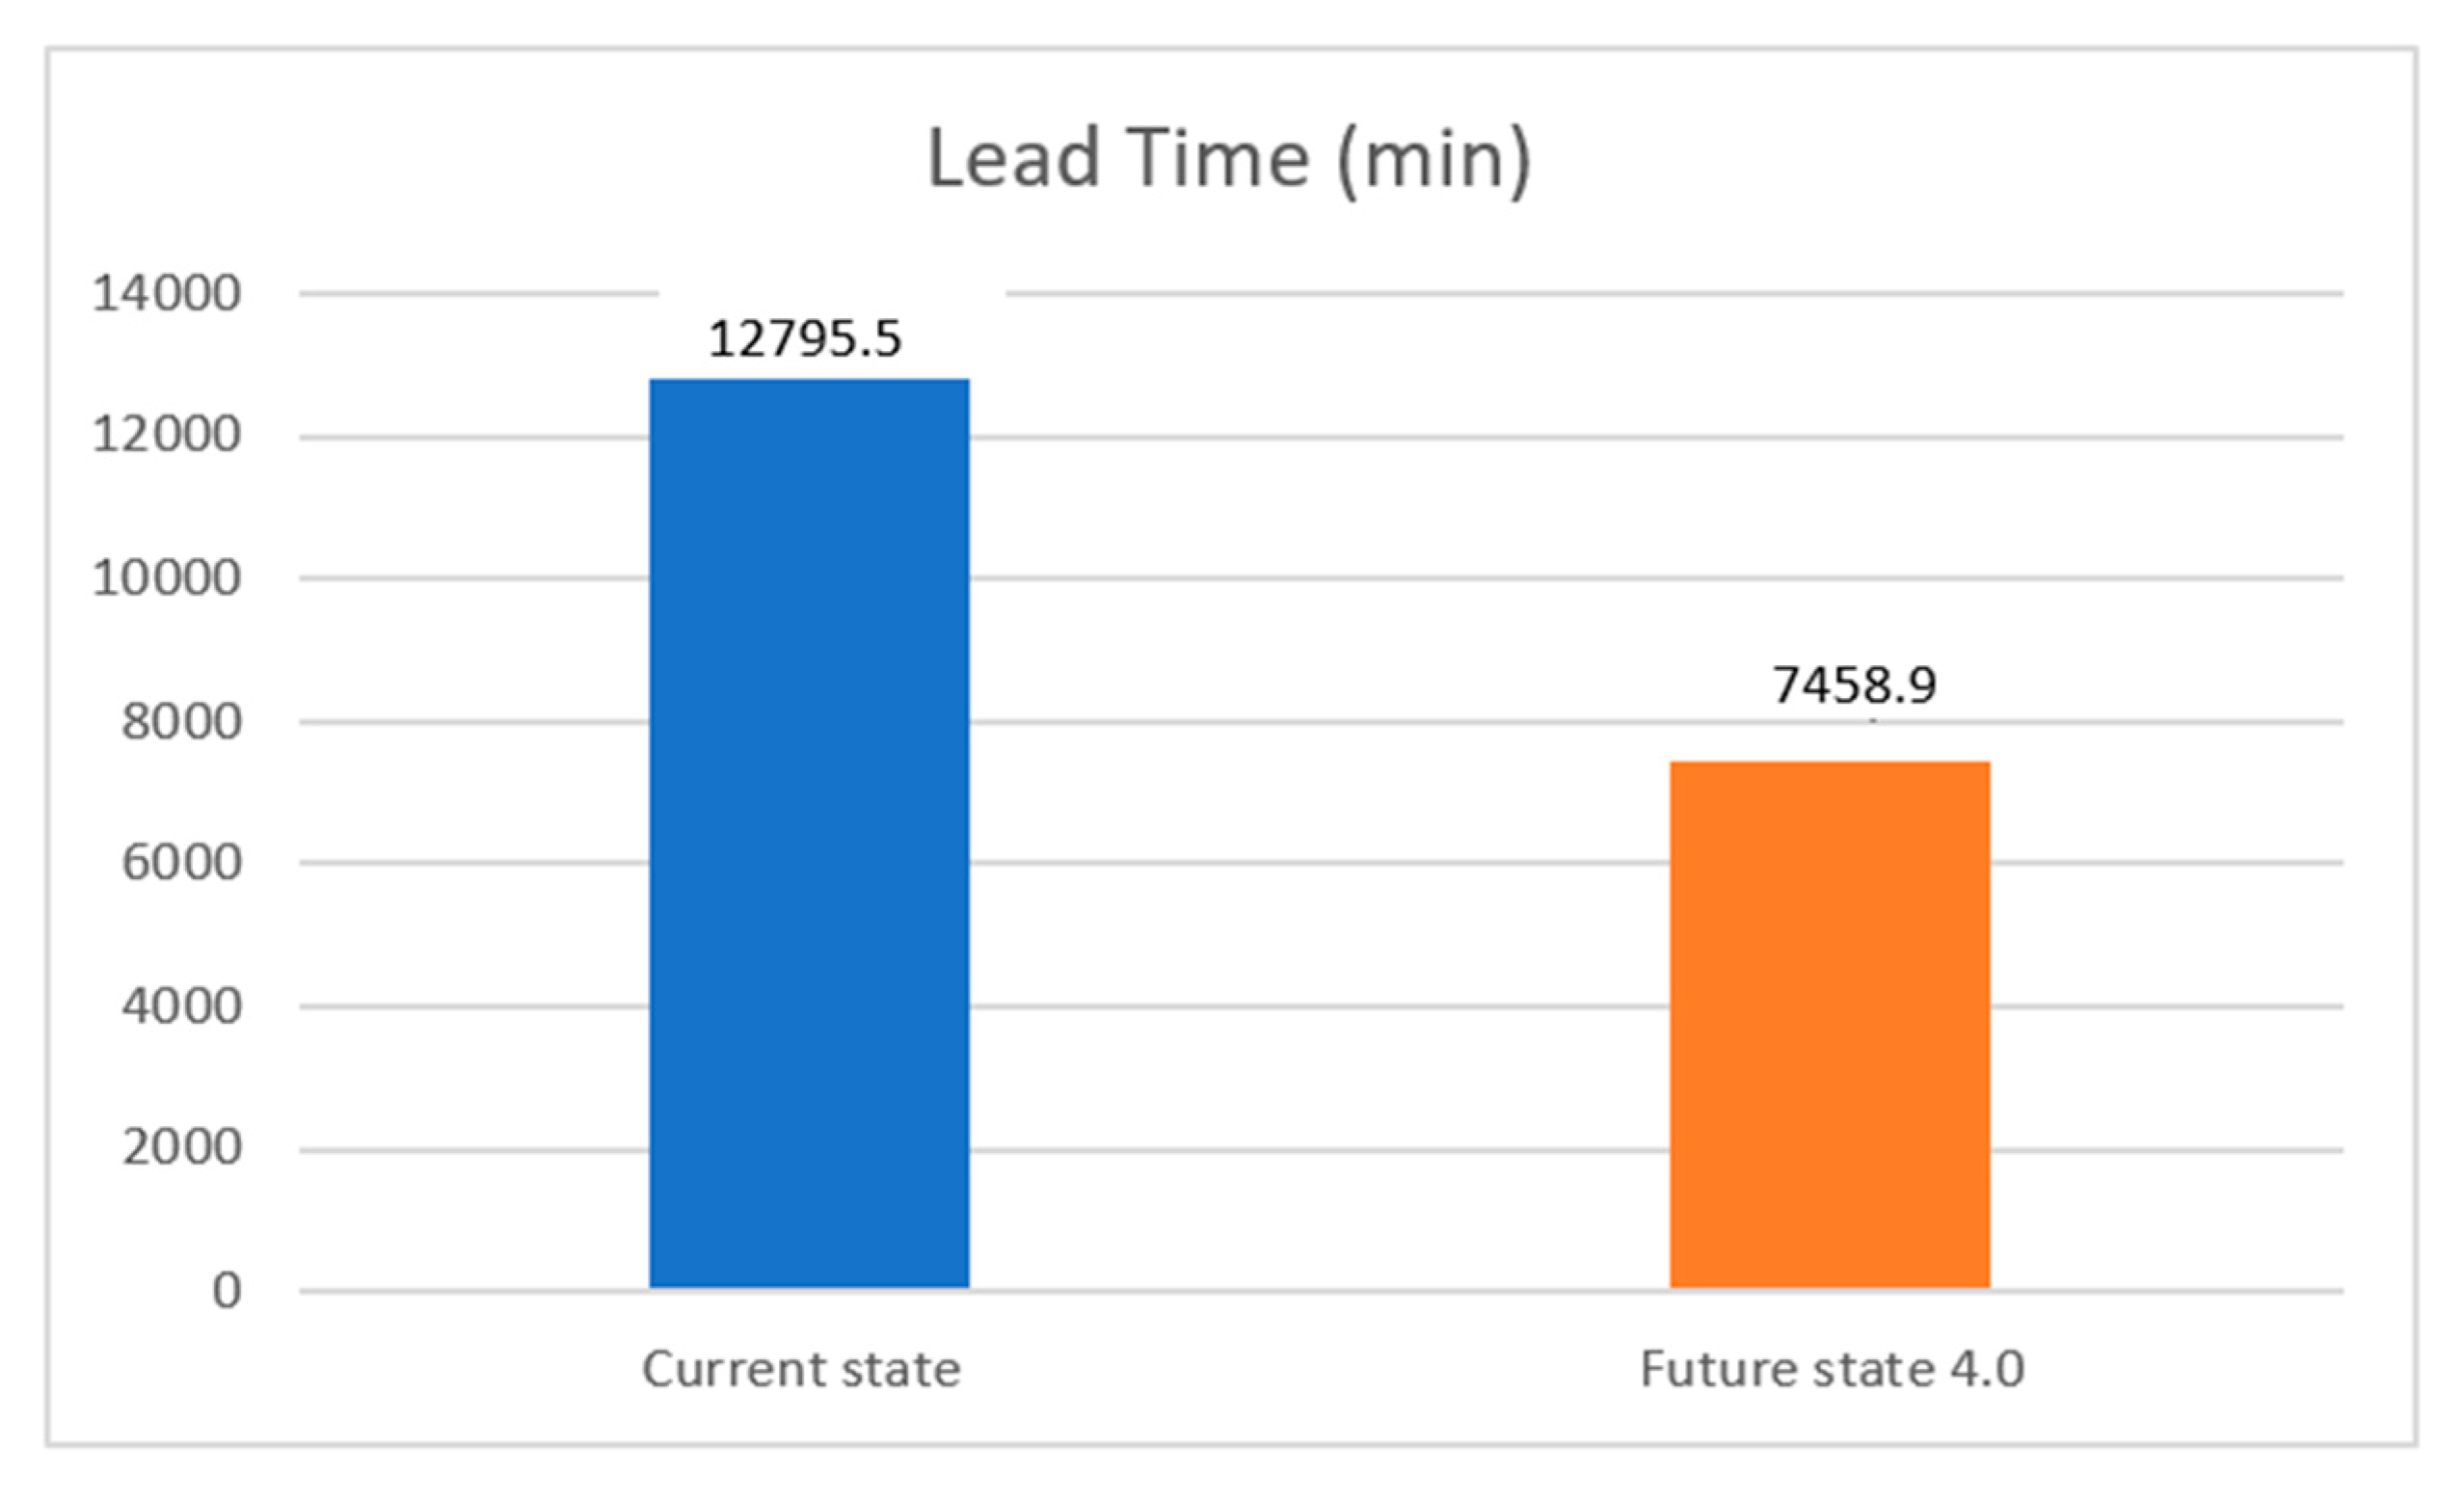
6. Analysis of the Results
6.1. Implementation of the Technologies (Future State) in the SC
6.2. SC Performance after Integration of New Technologies
6.2.1. Economic Performance
- Time and cost savings in Tangier and Algeciras: loading and unloading avoided;
- Reduction of loading and unloading time by using ATLS tools.
- Identifying the different steps in our supply chain, from order preparation to delivery to customers.
- Taking into account the logistics competitiveness of each country involved in this supply chain by proposing a new process.
- Presenting a map of the current state of the process. Each task is presented by a box attached with a data box that contains information such as the number of operators in each workstation with the cycle time of all tasks, Lead Time, Down Time, and Process Times. (see Figure 8).
6.2.2. Social Performance
6.2.3. Environmental Performance
- Reduction in the cost of energy consumption that can be explained by the switch to an electric automated handling that replaced the traditional fuel-based handling means;
- Elimination of noise (noise pollution) and CO2 emission;
- Reduction of waste (hydrocarbon waste, sludge, grease, used oil);
- The optimization of the movement circuit at the warehouse level has eliminated the risk of damage to packages during movement and consequently reduced the number of claims by customers for obsolete products.
7. Discussion
8. Conclusions
Author Contributions
Funding
Acknowledgments
Conflicts of Interest
References
- Industrie Automobile au Maroc: Le Chiffre D’affaires a L’export Depasse 83.7 Milliards de Dirhams 2021, UN Record. Available online: https://fr.le360.ma/economie/industrie-automobile-au-maroc-le-chiffre-daffaires-a-lexport-depasse-837-milliards-de-dirhams-en-254131 (accessed on 17 April 2022).
- El Kihel, Y.; Amrani, A.; Ducq, Y.; Amegouz, D. Implementation of Lean through VSM modeling on the distribution chain: Automotive case. In Proceedings of the 2019 International Colloquium on Logistics and Supply Chain Management (LOGISTIQUA), Paris, Franc, 12–14 June 2019; pp. 1–7. [Google Scholar] [CrossRef]
- El Kammouni, R.; Kamach, O.; Masmoudi, M. Value Stream Mapping 4.0: A Structural Modeling Approach. In Proceedings of the 13ème Conference Internationale De Modelisation, Optimisation Et Simulation (MOSIM2020), Agadir, Maroc, 12–14 November 2020. [Google Scholar]
- Gao, Z.; Castiglione, A.; Nappi, M. Biometrics in Industry 4.0: Open Challenges and Future Perspectives. IEEE Trans. Ind. Inform. 2022, 1–4. [Google Scholar] [CrossRef]
- Gao, Z.; Paul, A.; Wang, X. Éditorial invité: Jumelage numérique: Intégration de l’IA-ML et de l’analyse big data pour la représentation virtuelle. IEEE Trans. Ind. Inform. 2022, 18, 1355–1358. [Google Scholar] [CrossRef]
- Tao, F.; Sui, F.; Liu, A.; Qi, Q.; Zhang, M.; Song, B.; Guo, Z.; Lu, S.C.-Y.; Néant, A.Y.C. 2018b Digital twin-driven product design framework. Int. J. Prod. Res. 2019, 57, 3935–3953. [Google Scholar] [CrossRef]
- Demir, S.; Yilmaz, I.; Paksoy, T.S. Augmented Reality in Supply Chain Management. In Logistics 4.0; CRC Press: Boca Raton, FL, USA, 2020; pp. 136–145. [Google Scholar] [CrossRef]
- Hartmann, L.; Meudt, T.; Seifermann, S.; Metternich, J. Value stream method 4.0: Holistic method to analyse and design value streams in the digital age. Procedia CIRP 2018, 78, 249–254. [Google Scholar] [CrossRef]
- Sherwood, J.A.; Dignam, L.J.J.; Dobbins, T.; Boeman, R.G. US Composites Manufacturing Industry Technical Roadmap. Facilitating Industry by Engineering, Roadmapping and Science (FIBERS) to Advance US Manufacturing of Composites. 2017, pp. 1–53. Available online: https://www.uml.edu/docs/FIBERS%20Composites%20Manufacturing%20Roadmapping%20Report_Published-31Aug2017_tcm18-286787.pdf (accessed on 18 July 2022).
- Kolberg, D.; Zühlke, D. Lean automation enabled by industry 4.0 technologies. IFAC-Pap. 2015, 48, 1870–1875. [Google Scholar] [CrossRef]
- Satoglu, S.; Ustundag, A.; Cevikcan, E.; Durmusoglu, M.B. Lean production systems for industry 4.0. In Industry 4.0: Managing the Digital Transformation; Springer: Cham, Switzerland, 2018; pp. 43–59. [Google Scholar]
- de Paula Ferreira, W.; Armellini, F.; de Santa-Eulalia, L.A.; Thomasset-Laperrière, V. Extending the lean value stream mapping to the context of Industry 4.0: An agent-based technology approach. J. Manuf. Syst. 2022, 63, 1–14. [Google Scholar] [CrossRef]
- Nounou, A.; Jaber, H.; Aydin, R. A cyber-physical system architecture based on lean principles for managing industry 4.0 setups. Int. J. Comput. Integr. Manuf. 2022, 1–19. [Google Scholar] [CrossRef]
- Aksar, O.; Elgun, D.; Beldek, T.; Konyalıoğlu, A.K.; Camgöz-Akdağ, H. An Integrated Value Stream Mapping and Simulation Approach for a Production Line: A Turkish Automotive Industry Case. In Digitizing Production Systems; Springer: Cham, Switzerland, 2022; pp. 357–371. [Google Scholar] [CrossRef]
- Boonsothonsatit, G.; Tonchiangsai, K.; Choowitsakunlert, S. Value stream mapping-based logistics 4.0 readiness for Thailand automotive-part manufacturers. In Proceedings of the 2020 2nd International Conference on Management Science and Industrial Engineering, Osaka, Japan, 7–9 April 2020; pp. 309–313. [Google Scholar] [CrossRef]
- Ramadan, M.; Salah, B.; Othman, M.; Ayubali, A. Industry 4.0-based real-time scheduling and dispatching in lean manufacturing systems. Sustainability 2020, 12, 2272. [Google Scholar] [CrossRef]
- Schneider, M.; Michalicki, M.; Rittberger, S. Lean and Industry 4.0—How to Develop a Lean Digitalization Strategy with the Value Stream Method. In European Lean Educator Conference; Springer: Cham, Switzerland, 2019; pp. 127–135. [Google Scholar] [CrossRef]
- Huang, Z.; Kim, J.; Sadri, A.; Dowey, S.; Dargusch, M.S. Industry 4.0: Development of a multi-agent system for dynamic value stream mapping in SMEs. J. Manuf. Syst. 2019, 52, 1–12. [Google Scholar] [CrossRef]
- Phuong, N.A.; Guidat, T. Sustainable value stream mapping and technologies of Industry 4.0 in manufacturing process reconfiguration: A case study in an apparel company. In Proceedings of the 2018 IEEE International Conference on Service Operations and Logistics, and Informatics (SOLI), Singapore, 18 July 2018; pp. 85–90. [Google Scholar]
- Lugert, A.; Völker, K.; Winkler, H. Dynamization of Value Stream Management by technical and managerial approach. Procedia CIRP 2018, 72, 701–706. [Google Scholar] [CrossRef]
- Meudt, T.; Metternich, J.; Abele, E. Value stream mapping 4.0: Holistic examination of value stream and information logistics in production. Cirp. Ann. 2017, 66, 413–416. [Google Scholar] [CrossRef]
- Saraswat, P.; Kumar, D.; Sain, M.K. Reduction of work in process inventory and production lead time in a bearing industry using value stream mapping tool. Int. J. Manag. Value Supply Chain. (IJMVSC) 2015, 6, 27–35. [Google Scholar] [CrossRef]
- Flauder, J. Déploiement du Lean Management dans un atelier de conditionnement et conduite du changement. Sci. Pharm. 2015, Dumas-01202623. Available online: https://dumas.ccsd.cnrs.fr/dumas-01202623 (accessed on 28 April 2022).
- Gupta, R.K.; Singh, M.P.; Sharma, L.K. Reduction of Wastage Using Value Stream Mapping: Case Study. Int. J. Res. Mech. Eng. Technol. 2014, 4, 52–55. [Google Scholar]
- Haefner, B.; Kraemer, A.; Stauss, T.; Lanza, G. Quality value stream mapping. Procedia Cirp. 2014, 17, 254–259. [Google Scholar] [CrossRef]
- Villarreal, B. The transportation value stream map (TVSM). Eur. J. Ind. Eng. 2012, 6, 216–233. [Google Scholar] [CrossRef]
- Dushyanth Kumar, K.R.; Shivashankar, G.S.; Rajeshwar, S.K. Application of value stream mapping in pump assembly process: A case study. Ind. Eng. Manag. 2015, 4, 3. [Google Scholar]
- Hirsch-Kreinsen, H. Industrie 4.0. In Handbuch Innovationsforschung; Springer: Wiesbaden, Germany, 2021; pp. 811–826. [Google Scholar]
- Mosser, J. Cartographie 4.0 Pour la Transformation Numérique Des Processus. Ph.D. Thesis, Ecole Polytechnique, Montreal, QC, Canada, 2020. [Google Scholar]
- Manning, J.; et Sörlin, F. Value Stream Mapping as a Basis for Process Improvement in the Pharmaceutical Industry; Lund University Faculty of Engineering Departement of Industrial Management and Logistics: Lund, Sweden, 2017. [Google Scholar]
- Deniaud, I.; Marmier, F.; Michalak, J.L. Méthodologie et outil de diagnostic 4.0: Définir sa stratégie de transition 4.0 pour le management de la chaîne logistique. Logistique Manag. 2020, 28, 4–17. [Google Scholar] [CrossRef]
- Transformation-Digital. Available online: https://www.mecalux.fr/blog/transformation-digitale (accessed on 2 June 2022).
- Bai, C.; Dallasega, P.; Orzes, G.; Sarkis, J. Industry 4.0 technologies assessment: A sustainability perspective. Int. J. Prod. Econ. 2020, 229, 107776. [Google Scholar] [CrossRef]
- Ahuett-Garza, H.; Kurfess, T. A brief discussion on the trends of habilitating technologies for Industry 4.0 and Smart manufacturing. Manuf. Lett. 2018, 15, 60–63. [Google Scholar] [CrossRef]
- Barz, C.; Jalba, C.K.; Erdei, Z.; Hahn, S.M.L. Approaches for the planning and implementation of Industry 4.0. Period. Eng. Nat. Sci. PEN 2019, 7, 375–380. [Google Scholar] [CrossRef]
- Singh, D. Use of RFID System and Improvement in Library Services. IJR 2022, 8, 283. [Google Scholar] [CrossRef]
- Valamede, L.S.; Akkari, A.C.S. Lean 4.0: A new holistic approach for the integration of lean manufacturing tools and digital technologies. Int. J. Math. Eng. Manag. Sci. 2020, 5, 851. [Google Scholar] [CrossRef]
- Crestan, L. Implementation of a Dashboard for Measuring Warehouse Performance-Proposal Based on a Business Intelligence Software. ING—École de Génie Industriel et de L’information. Available online: https://www.politesi.polimi.it/handle/10589/187128 (accessed on 28 April 2022).
- La Fonction WMS Gestion d’entrepôt Préparation de Commande. Available online: https://www.e-prelude.com/ (accessed on 25 May 2021).
- Samuel, K.E.; Ruel, S. Systèmes d’information et résilience des chaînes logistiques globales. Syst. D’information Manag. 2013, 18, 57–85. [Google Scholar] [CrossRef]
- Automatic-Truck-Loading. Available online: https://technicaintl.com/solutions/automatic-truck-loading/ (accessed on 13 April 2021).
- Transstockeur-Pour-Palettes. Available online: https://www.mecalux.fr/stockage-automatise/stockage-automatise-palettes/transstockeur-pour-palettes (accessed on 20 June 2021).


| N° | Year | Title | Authors | Type | Contenent |
|---|---|---|---|---|---|
| 1 | 2022 | Extending the lean value stream mapping to the context of Industry 4.0: An agent-based technology approach [12] | Ferreira, Armellini, F., Santa-Eulalia, Thomasset-Laperrière | Article | Integrating VSM with hybrid simulation (HS) and extending its scope to the Industry 4.0 context |
| 2 | A cyber-physical system architecture based on lean principles for managing industry 4.0 setups [13] | Nounou, Jaber, H., Aydin, | Article | Smart VSM 4.0 to improve material and information flow and autonomous decision making via IOT | |
| 3 | An Integrated Value Stream Mapping and Simulation Approach for a Production Line: A Turkish Automotive Industry Case [14] | Aksar, O., Elgun, D., Beldek, T., Konyalıoğlu, A.K., Camgöz-Akdağ, H | Conference | To guide the automotive sectors by analyzing the current situation with the Lean concept and using the necessary technologies. | |
| 4 | 2020 | VALUE STREAM MAPPING 4.0: A STRUCTURAL MODELING APPROACH [3] | Rania El Kammouni, Oualid Kamach, Malek Masmoudi | Article | VSM 4.0 for a collaborative work environment for management teams and production process optimization through digitization |
| 5 | Value Stream Mapping-based Logistics 4.0 Readiness for Thailand Automotive-Part Manufacturers [15] | Boonsothonsatit, G.; Tonchiangsai, K.; & Choowitsakunlert, S. | Article | The article discusses a methodology to transition to logistics 4.0 based on VSM and the adaptation of 4.0 technologies. | |
| 6 | Industry 4.0-based real-time scheduling and dispatching in lean manufacturing systems [16] | Ramadan Muawia Salah Bachir | Article | An Industry 4.0 based Lean framework called DVSM dynamics to digitize Lean manufacturing with Industry 4.0 Lean tools and technologies. | |
| 7 | Lean and Industry 4.0—How to Develop a Lean Digitalization Strategy with the Value Stream Method [17] | Schneider Markus | Article | Methodology that enables manufacturing companies to develop an individual digitalization strategy using Industry 4.0 | |
| 8 | 2019 | Industry 4.0: Development of a multi-agent system for dynamic value stream mapping in SMEs [18] | Huang, Z., Kim, J., Sadri, A., Dowey, S., Dargusch | Article | Application of VSM in SMEs is more difficult for complicated product processing and improvements in labor management and facility utilization. |
| 9 | 2018 | Sustainable value stream mapping and technologies of Industry 4.0 in manufacturing process reconfiguration [19] | Phuong, N.A., Guidat, T | Article | RFID, big data and usability improvement as solutions and the impact of their implementation on process sustainability |
| 10 | Value stream method 4.0: Holistic method to analyze and design value streams in the digital age [8] | Hartmann, L., Meudt, T., Seifermann, S., Metternich, J | Article | Promising new opportunities from digitalization and Industry 4.0 to integrate information flows. | |
| 11 | 2017 | From value stream mapping to value stream management—how the static lean method can be further developed to a dynamic management approach using solutions of Industry 4.0 [20] | Lugert, A., Winkler, H. | Article | VSM is common in manufacturing companies and has advantages but also some shortcomings suffered by the current megatrends in the production environment. |
| 12 | Value stream mapping 4.0: Holistic examination of value stream and information logistics in production [21] | Joachim Metternich | Article | Mapping allows the analysis of process chains and helps to deduce improvement potentials | |
| 13 | 2015 | Reduction of Work in Process Inventory and Production Lead Time in a Bearing Industry Using Value Stream Mapping Tool [22] | Rajenthirakumar et Shankar | Article | A case study on the application of VSM in the automotive sector, resulting in a 67% reduction in cycle time by optimizing value-added activities |
| 14 | Deployment of Lean Management in a packaging workshop and change management [23] | Julia Flauder | Thèse | Lean should extend to all links in the supply chain, upstream and downstream of production, which has long been its focus. | |
| 15 | 2014 | Reduction of Wastage Using Value Stream Mapping: Case Study [24] | Rajendra kumar | Article | The application of the VSM on the production flow shows that the non-value-added activities have been optimized such as waiting time, handling time… |
| 16 | Quality Value Stream Mapping [25] | B. Haefner, A. Kraemer, T. Stauss, and G. Lanza | Article | Q-VSM is a tool for the visualization, design and analysis of quality assurance measures for the manufacturing system in the electronics industry | |
| 17 | 2012 | The transportation value stream map (TVSM) [26] | Bernardo Villarreal | Article | T-VSM modeling that provides a detailed description of storage and transportation operations |
| New Technologies | Contribution of the New Technologies on the Logical Processes | |
|---|---|---|
| 1 | Big Data | - Comprehensive real-time data collection and evaluation - Rapid data processing - Support decision making - Analyze and separate important data - Support more effective knowledge transfer to achieve business goals [31]. |
| 2 | Data storage in the cloud | - Reduces the initial investment required when implementing a WMS, since instead of acquiring the entire technical infrastructure, a monthly rent is paid for the license. - Large-scale processing - Flexible use for computing and storage [32]. |
| 3 | IOT | - Related to the various sensors that collect information from the physical world and transfer it to digital databases [32]. - Improving Supply Chain Visibility - Accurate information in real time [33]. |
| 4 | COBOTS | - Transport of goods - Order picking - Improve supply chain efficiency [31]. |
| 5 | AM (Additive Manufacturing) | - AM refers to a set of automated processes that build products layer by layer, based on three-dimensional models designed in computer-aided design software. - Its objective is to standardize the packaging of the same size [34]. |
| 6 | Drones | - Flying over the logistics sector with the aim of providing support for the performance of certain tasks, such as inventory management [28]. |
| 7 | AI | - Simulate natural intelligence to interpret external data - Learn from this data for descriptive, predictive, or normative analysis in logistics. - Help generate supplies, anticipate customer orders in the warehouse [25]. |
| 8 | AR (Augmented Reality) | - Works with virtual objects that overlap with the existing environment. - Virtual and real information, acquired with a camera, are digitally merged, and represented on a screen - Create an interface between employees and digital products or equipment [10]. |
| 9 | VS (Virtual simulation) | VS is a computer-based modeling system that promotes real-time data to reflect the physical world in a virtual model that includes machines, products, logistics flows and humans [31] |
| 10 | RFID (Radio frequency identification) | - Identify and track without physical contact. - Read, store, and write information on electronic tags using radio waves [35]. - Composed of a chip, a tag (antenna role) and a reader. - To be read, the tags need to be present in the radio wave radius of the reader [35]. |
| 11 | Smart Pack | - Connecting packages - Monitor the conditions of transport of goods - Collect time-stamped data on geolocation, shocks, temperature, and humidity - Transmit the data according to the chosen frequency [33]. |
| 12 | Code-barre | - Bar code, or bar code (CAB), is the representation of a numerical or alphanumerical data in the form of a symbol made up of bars and spaces. -The thickness varies according to the symbology used and the data thus coded [36]. |
| 13 | Power BI | - Power BI Warehouse Performance content was created so that warehouse and operations managers can monitor important inbound, outbound and inventory metrics. - It uses warehouse management, product, and other trans-actional data [37]. |
| 14 | WMS | - Guide the receipt and storage of inventory - Optimize order preparation and shipping - Advises on inventory replenishment [38]. |
| 15 | Scan 3D | - A three-dimensional scanner is a device for scanning and 3D acquisition - Analyzes the objects or their close environment to collect precise information on the form and possibly on the appearance (color, texture…) [39]. - This device helps us to facilitate the quality control of the goods, 3D modeling. |
| 16 | ERP | - Collects all data from a warehouse into a centralized database - Enable informed and intelligent decision making - By using an ERP system, inventory will be automatically integrated with all aspects of the business, from planning to production to accounting [40]. |
| 17 | ATLS | - Robotic system by which pallets are automatically loaded and unloaded from trucks with little operator intervention. - The ideal solution to speed up and secure the receipt and dispatch of goods in the loading area of the warehouse [41]. |
| 18 | AGV/LGV | - Self-guided vehicles, similar to forklifts, move autonomously and automatically, following a pre-determined or pre-programmed path. - To guide them, two systems are available: self-guided (AGV) or laser guidance (LGV) [25]. |
| 19 | Stacker cranes | Automation of product entry and exit operations. Elimination of errors derived from manual management. Control and updating of inventory management [42]. |
| Activities | Definition |
|---|---|
| Product pickup | The accumulation of the stock of finished products requires several rounds of collection during the rotation of all the teams. |
| Grouping of packages | By grouping, we mean putting the products in racks in the shipping area. |
| Sorting of Finished Product (FP)/Customer | The dispatch area is divided into different zones to store one batch per customer. |
| Sorting PF/Reference | In the shipping area, sorting can also be done by reference. |
| Palletizing | La mise en palette de produit finis commence dès qu’une référence atteint la quantité exigée par le client. |
| Transfer of packages | The palletization of finished products starts as soon as a reference reaches the quantity required by the customer. The pallets having the required standards of packaging and quantity will have to be transferred by means of the radio frequency gun from warehouse F to warehouse E |
| Edition of the expedition file | Preparation of the export file (Invoices…) |
| Packaging and shipping | The pallets transferred to the warehouse and well checked are now ready to be stretch-wrapped with the help of handling means. |
| Moving of finished pallets | The finished pallets must be loaded respecting the priority to the pallets that must be the first to be unloaded. |
| Loading of packages | The filling of the trailer begins each time there are finished pallets while respecting the loading norms in force. |
| Road Transport Kenitra-Tangier | Transport the goods to the port of Tangier Med. |
| Sea Transport Tangier-Algeciras | Checking in Tangier Med and boarding for Algeciras. |
| Road transport Algeria-Vienna | Transporting the goods from the port of Algeciras to the warehouse in Vienna |
| Reception and unloading | Unloading and storage of the finished products in the EAVA warehouse in Austria. |
| Technologies | Big Data | Cloud Computing | IoT | Cobots | AM | Drones | AI | AR | VS | RFID | Smart Pack | Bar Code | Power BI | WMS | Scan-3D | ERP | ATLS | AGV/LGV | Transtockeur | |
|---|---|---|---|---|---|---|---|---|---|---|---|---|---|---|---|---|---|---|---|---|
| Functions | ||||||||||||||||||||
| Pick-up & grouping of products | X | X | X | X | X | X | ||||||||||||||
| Product sorting | X | X | X | X | X | X | X | X | X | X | ||||||||||
| Palletization & transfer of packages | X | X | X | X | X | |||||||||||||||
| Editing the file | X | X | X | X | X | X | X | X | ||||||||||||
| Packaging & Shipping | X | X | X | X | X | |||||||||||||||
| Moving finished pallets | X | X | X | X | ||||||||||||||||
| Loading and unloading | X | X | X | X | X | |||||||||||||||
| Road, sea and warehouse delivery | X | X | X | X | ||||||||||||||||
| Tasks | Contribution of New Technologies |
|---|---|
| Pickup & consolidation | Stacker cranes 1, and Augmented Reality - Product location and identification in the warehouse - Products are scanned and registered in real time, - Transport of products from production according to traceability to the grouping area - Optimize the role of the operator and optimize space - Merging of picking and grouping - The storage capacity is doubled - The circuit of movements is optimized - Reduced number of accidents - Reduced energy consumption - Reduced number of damaged packages WMS - Receipt of goods from imported files, the characteristics of goods received and purchase orders (order number, reference, quantities, etc.) are recorded in a file - Direct connection between the warehouse and the company’s ERP system, which has led to better order management and a significant reduction in the delivery time to the customer - Possibility to follow each product inside the warehouse by controlling the inventory. |
| Sorting products | Bar codes - Automatic sorting where you already know where each product is and to which category it belongs - Reduce the verification time for the operator |
| Palletizing & transfer | AGV and augmented reality - Optimize the role of the operators in this stage by automatic palletizing system - Reduce largely the time of palletization in this stage - Reduced number of accidents - Eeduced energy consumption |
| Verification and editing of the file | RFID & Scan - Instantly detect which product is which and fill in the file data automatically - The shipping warehouse manager here will have the role of confirming the exit of the product without the need for manual entry. - It will save time for the final verification of the products. - Follow-up of the product until the loading in the trucks. |
| Packing and shipping | RFID - In this step, RFID technology allows us to track each finished product after wrapping and labeling, the WMS software allows us to control the goods before shipment and their allocation to the truck, we can add a third operator to speed up the operation. |
| Moving of finished pallets | AGV - For fast and organized movement without the need for operator intervention - Reduction of movements inside the warehouse, and facilitates the work of the operators - The movement circuit is optimized - Reduced number of accidents - Reduced energy consumption |
| Charging | ATLS - Reduction of the loading time in the trucks - Rare intervention of the operator whose role will be to supervise - All the boxes are of standardized size which will allow to gain in storage space and to optimize the distances between boxes - Optimize the company’s logistic resources… |
| Road and sea transport and warehouse delivery | RFID & Smart pack - Traceability and tracking of products - Optimize the time of search and transport of boxes - Locate where each product is at any time |
| Distribution | AGV and stacker crane - Gain in reactivity and delivery time - The circuit of movements is optimized - Reduced number of accidents - Reduced energy consumption - Reduced number of damaged packages |
| Process | Current State | Improvement through New Technologies | Future State 4.0 (min) | ||||
|---|---|---|---|---|---|---|---|
| Operators | Cycle Time (min) | Non-Value Added Time (min) | Operators | Temps de Cycle (min) | Temps de Non-Valeur Ajoutée (min) | ||
| Pickup | 2 | 3,5 | 40 | Stacker cranes, RA | 3 | 4 | 10 |
| Grouping | 3 | 8 | 4 | ||||
| Sort FP/C | 2 | 2 | 40 | Bar codes | 1 | 0,3 | 6 |
| Palletizing | 1 | 5 | 40 | AGV | 1 | 2 | 6 |
| Transfer | 1 | 4 | 30 | AGV | 0 | 0,5 | 3 |
| Verification | 1 | 3 | 6 | RFID & Scan | 2 | 2 | 5 |
| Edition Dossier | 1 | 2 | 0 | ||||
| Packaging | 2 | 5 | 6 | AGV | 1 | 1 | 3 |
| Move products | 2 | 2 | 3 | AGV | 0 | 0,5 | 3 |
| Loading EAKM | 3 | 4 | 10 | Stacker cranes, ATLS, AGV, RA | 1 | 2,3 | 10 |
| EAVA unloading and distribution | 3 | 4 | 1 | 2,3 | |||
| Total | 21 | 42,5 | 179 | 10 | 14,9 | 46 | |
| Comparison Table | |||
|---|---|---|---|
| Indicator | Current State | Future State 4.0 | % Gain |
| Number of positions (tasks) | 11 | 9 | 20% |
| Lead Time | 8 days 21 h | 5 days 4 h | 41% |
| Number of operators | 21 | 10 | 52% |
| Process | Process Time (min) | Non-Value-Added Time (Min) | |
|---|---|---|---|
| Current State | Future State 4.0 | ||
| Road Transport Kenitra-Tanger | 185 | 436 | 250 |
| Sea Transport Tangier-Algeciras | 133 | 4320 | 2470 |
| Road Transport Algeciras-Vienna | 1740 | 5760 | 2620 |
| Total Time | 2058 | 10,516 | 5340 |
| Indicators | The Year 2020 | The Year 2021 |
|---|---|---|
| The number of accidents | - 25 accidents - 23 minors less than 10 days sick leave - 2 major more than two months of sick leave | 5 minors |
| Absenteeism rate | 63 | 9 |
| the number of hours of maintenance intervention | 242 | 27 |
Publisher’s Note: MDPI stays neutral with regard to jurisdictional claims in published maps and institutional affiliations. |
© 2022 by the authors. Licensee MDPI, Basel, Switzerland. This article is an open access article distributed under the terms and conditions of the Creative Commons Attribution (CC BY) license (https://creativecommons.org/licenses/by/4.0/).
Share and Cite
Kihel, Y.E.; Kihel, A.E.; Embarki, S. Optimization of the Sustainable Distribution Supply Chain Using the Lean Value Stream Mapping 4.0 Tool: A Case Study of the Automotive Wiring Industry. Processes 2022, 10, 1671. https://doi.org/10.3390/pr10091671
Kihel YE, Kihel AE, Embarki S. Optimization of the Sustainable Distribution Supply Chain Using the Lean Value Stream Mapping 4.0 Tool: A Case Study of the Automotive Wiring Industry. Processes. 2022; 10(9):1671. https://doi.org/10.3390/pr10091671
Chicago/Turabian StyleKihel, Yousra El, Ali El Kihel, and Soufiane Embarki. 2022. "Optimization of the Sustainable Distribution Supply Chain Using the Lean Value Stream Mapping 4.0 Tool: A Case Study of the Automotive Wiring Industry" Processes 10, no. 9: 1671. https://doi.org/10.3390/pr10091671
APA StyleKihel, Y. E., Kihel, A. E., & Embarki, S. (2022). Optimization of the Sustainable Distribution Supply Chain Using the Lean Value Stream Mapping 4.0 Tool: A Case Study of the Automotive Wiring Industry. Processes, 10(9), 1671. https://doi.org/10.3390/pr10091671