
Flow Characteristics and Optimization Design of the Stator–Rotor Cavity of the Full Tubular Pump
by
 ,
,
Lijian Shi
1,*,
Jun Zhu
1,
Jindong Li
2,
Fangping Tang
1,
Beishuai Chen
3,
Yuhang Jiang
1,
Tian Xu
1 and
Yao Chai
1 1
College of Hydraulic Science and Engineering, Yangzhou University, Yangzhou 225000, China
2
Jiangsu Hydraulic Research Institute, Nanjing 210000, China
3
Jiangsu Pumping Station Technology Co., Ltd. of South-to-North Water Diverslon Project, Yangzhou 225000, China
*
Author to whom correspondence should be addressed.
Processes 2022, 10(9), 1688; https://doi.org/10.3390/pr10091688
Submission received: 28 June 2022
/
Revised: 2 August 2022
/
Accepted: 19 August 2022
/
Published: 25 August 2022
(This article belongs to the Special Issue Design and Optimization Method of Pumps)
Abstract
:The full tubular pump device is taken as the research object in this article. This research method adopts the numerical simulation technology based on the SST (Shear-Stress-Transport) k-ω turbulence model to explore the internal flow characteristics of the stator–rotor cavity of the full tubular pump and optimize the stator–rotor clearance structure. The research shows that under the design conditions, compared with the axial flow pump, the torque increases by 47.91 N·m at the stator–rotor cavity structure and the efficiency decreases by about 20%. The torque at the rotor clearance of the full tubular pump accounts for about 50% of the torque at the rotor. Since there is a large area of backflow on both sides of the cavity, and there is a vortex structure on the inlet side of the cavity, it shows that the rotor structure and its area greatly affect the operating efficiency of the pump device. With the reduction in the rotor force area, the clearance length, and the outer diameter of the disc, the operating efficiency of the pump device gradually increases. Under the design conditions, the optimized model has a maximum efficiency increase of 14.04% and the torque at the cavity rotor is reduced by 39.25 N·m. The results show that the operating efficiency of the full tubular pump is closely related to its rotor structure area, and the force area of the rotor structure needs to be controlled in the actual design process.
1. Introduction
As a new type of mechatronics low-head pump [1,2], the full tubular pump has the advantages of compact structure, convenient installation, and stable operation, but its efficiency and head are significantly lower than those of the axial flow pump [3,4]. Studies have shown that the main reasons for its reduced efficiency are the hydraulic loss caused by the backflow of the clearance and the friction loss of the disc caused by the rotor housing [5,6].
Most of the early studies on the full tubular pump were discussed from the aspects of its application value, flow channel, and structural stability. On the submersible motor of the full tubular pump, Cheng S. [7] adopted the special weld structure of submersible motor with welded rotor for the full tubular pump, found that the welding seam has a great influence on the running noise of the motor, and proposed a rubber damping technology to reduce vibration and noise. In order to diagnose the cause of the motor failure, Xu X. F. et al. [8] carried out fault prediction and analysis of the pump and used BP neural network to capture the fault frequency of the motor. Cao L. J. et al. [9] studied the wide application of the full tubular pump and deduced the stability of the autocoupling installation method through theoretical formulas. Jiang P. H. et al. [10] and Zhu H. M. et al. [11] studied the characteristics of the full tubular pump and introduced the application prospects of the full tubular pump specifically. Jiao H. F. [12] studied the influence of stator–rotor clearance on the hydraulic performance through CFD (Computational Fluid Dynamics) numerical simulation technology and found that with the increase of backflow clearance, the clearance flow rate of the full tubular pump increases, the influence of clearance backflow on the flow pattern at the inlet and outlet of the impeller increases, the work capacity of the impeller gradually becomes worse, and the head and efficiency of the full tubular pump gradually decrease.
At present, there is no relevant research on the internal flow mechanism and its induced characteristics of the stator–rotor clearance flow field of the full tubular pump. Fortunately, many scholars have achieved fruitful research results on the flow mechanism of blade tip clearance, which can provide a reference for the research of this paper. Li Y. J. et al. [13], Yang C. M. et al. [14], and Dai C. C. et al. [15] revealed the flow mechanism of clearance leakage flow. They all concluded that as the size of the blade tip clearance increases, the clearance leakage becomes more unstable; this will result in increased hydraulic losses and a significant drop in head and efficiency. You D. et al. [16] analyzed the temporal and spatial dynamics of the rotor tip clearance flow and found that there is a strong correlation between the tip leakage vortex and the tip separation vortex in the circular motion. The research results of Laborde R. et al. [17] show that the geometry of the axial flow pump tip clearance has a great influence on the clearance leakage cavitation. It is pointed out that rounding the pressure surface of the blade tip can effectively reduce the clearance cavitation. Meng F. et al. [18] used CFD to simulate five clearance radii of impeller hub; they observed that the radial clearance at the blade root has a great influence on the hydraulic performance of the two-way pump and the leakage of the clearance increases with the increase in the clearance. Li Y. B. et al. [19] chose the mixed flow pump with no tip clearance and tip clearances of 0.5, 1.0, and 1.5 mm as the object and found that when the blade tip clearance reaches 0.5 mm in the mixed flow pump, the saddle area characteristics in the flow-head curve can be effectively suppressed. With the development of experimental measurement technology, many scholars have clearly captured the tip clearance leakage vortex by means of PIV, LDV, and high-speed photography [20,21,22,23].
In recent years, with the development of technology, CFD has become one of the effective methods to study the flow field in the pump. It can provide detailed information on the flow field, which helps to better understand the complex flow in the impeller [24,25,26,27,28]. This paper further discusses the flow mechanism inside the stator and rotor cavity of the full tubular pump and analyzes the reasons why the hydraulic performance of the full tubular pump is generally lower than that of the axial flow pump. Moreover, based on the original cavity structure, the force-bearing area of the rotor is optimized, and the influence of different rotor structures on the hydraulic performance is discussed. The purpose of this study is to improve the efficiency of the full tubular pump and provide guidance for the optimal design of the stator–rotor cavity of the full tubular pump.
2. Numerical Method
2.1. Turbulence Model
Since the special structure of the full tubular pump and its clearance backflow increase the complexity of the flow field at the pump inlet, it is necessary to select a suitable turbulence model to capture the details of the flow field. The SST k-ω turbulence model has high predictability in terms of internal flow and energy characteristics, especially for flow separation under adverse pressure gradients. The SST k-ω turbulence model corrects the eddy viscosity coefficient and considers the variant equation obtained by turbulent shear stress transmission in the inverse pressure boundary layer. According to the results of Menter F. R. et al. [29,30,31], the SST k-ω turbulence model aims to make highly accurate predictions of flow separation under adverse pressure gradients by incorporating the transfer of turbulent shear stress into the eddy viscosity formulation. It also successfully avoids the overprediction of eddy viscosity.
In this simulation, the eddy viscosity coefficient k modular equation and ω equation can be written as follows:
where t is the time, ρ is the Density of water, k is the turbulent kinetic energy, μ is the coefficient of kinetic viscosity, and ω is the dissipation rate of turbulent energy.
The turbulent viscosity νt is shown as follows:
The blending functions F1 and F2 are based on the distance to the boundary layer and on the flow variables, and the formulas are as follows:
where S is an invariant measure of the strain rate, y is the distance to the nearest wall, ν is the kinematic viscosity, and the constant parameters in the above equations are β’ = 0.09, α = 0.556, β1 = 0.075, σk1 = 2, σω1 = 2, β2 = 0.0828, σk2 = 2, σω2 = 1.1682.
2.2. Grid
Due to the complex structure of the full tubular pump, the fluid domain of this calculation model is divided into the following parts: inlet pipe, support, stator–rotor cavity, impeller, guide vane, and outlet pipe. Figure 1 shows the three-dimensional calculation model of the full tubular pump; the specific dimensions of this model are as follows: the length of the inlet pipe is 0.8 m, the length of the outlet pipe is 0.86 m, and the diameter changes from 0.4 m to 0.3 m in the diffusion or contraction section; the length of the supports is 0.15 m, and the number of supports is 5; the diameter is 0.52 m at the stator and 0.4 m at the rotor; the impeller diameter is 0.3 m, the number of blades is 4, and the rated speed is 1450 r/min; the diameter of the guide vane is 0.3 m, and the number of blades is 7. The design flow Qd of this model is 360 L/s, and the design head H is 5.5 m. The entire fluid domain grid adopts a hexahedral structured grid, and the grid model of the main flow components is shown in Figure 2. Since the clearance flow is very important in the stator–rotor cavity and the clearance size is only 1 mm, it puts forward higher requirements on the quality of the grid in the cavity. Therefore, the clearance grid in the stator–rotor cavity needs to be refined to ensure that the clearance flow can be accurately captured.
In order to accurately capture the clearance flow and obtain accurate calculation results, the clearance grid is encrypted by using the structured grid. This section will verify the mesh nodes at the cavity clearance. In this section, three division schemes are designed for the grid nodes at the clearance, which are 3, 11, and 21 nodes, respectively. The distribution of different grid nodes is shown in Figure 3 and Figure 4.
Figure 5 shows the velocity distribution at the clearance with different grid nodes. The velocity in the cavity clearance exhibits a distribution trend of “Higher closer to the rotor, lower closer to the stator” along the radial direction, which is mainly caused by the centrifugal effect caused by the rotation of the rotor. When the number of clearance nodes is 3 and 11, the radial velocity gradient does not present a uniform trend. The flow details at the clearance cannot be accurately captured, which is mainly manifested as the difference in velocity distribution at the wall boundary layer. Therefore, the grid nodes are very important to obtain accurate clearance flow characteristics, and the number of clearance grid nodes in this paper is set to 21.
Figure 6 quantitatively analyzes the velocity distribution at the stator–rotor cavity clearance with radial distance. Comparing the velocity distribution trends of different grid nodes, it is found that the velocity close to the rotor side is faster, and the velocity decreases gradually as the distance tends to the stator. The velocity distribution trends of the 3-node grid and the 11-node grid show a linear distribution trend. The speed variation from the stator side to the rotor side is small. According to the viscous characteristics of the fluid, the relative movement between the liquid layers produces shear stress; so, its velocity distribution shows a parabolic distribution trend. Therefore, when the grid node reaches 21, the velocity distribution trend is more accurate.
Grid is the main carrier of numerical calculation and analysis, especially the grid distribution at the wall boundary layer, which requires finer grids to capture the flow field. The dimensionless number y+ value of the first-layer grid is usually used for quantitative analysis, which is an important parameter to measure the grid size of the wall boundary layer. It is specifically characterized as the ratio of the product of the distance from the first-layer grid node to the wall boundary and the friction velocity to the dynamic viscosity, as shown in Equation (9), so as to ensure that the y+ value is evenly distributed within the logarithmic number. The average y+ value of the impeller and the stator–rotor cavity is shown in Table 1. The y+ value of each part of this paper is controlled within 30, which meets the calculation requirements of the turbulence model [32,33,34].
where μτ is the friction velocity.
2.3. Grid-Independent Analysis
Figure 7 shows the verification results of efficiency changing with the number of elements of the grid under design conditions. Since the number of elements of the grid and the degree of density have a great impact on the accuracy of numerical simulation results, this paper uses efficiency as an analysis index to verify grid independence. According to the changing trend of the efficiency, after the number of elements of the grid reaches 4.1 million, the efficiency changes steadily. The relative error between the adjacent grid numbers is within 1%, which meets the calculation requirements. In this paper, considering the above stator–rotor cavity clearance grid distribution, 4.73 million grids are finally used as the calculation grid.
2.4. Boundary Conditions
The turbulence model used in this paper is the SST k-ω turbulence model, which adaptively handles the velocity and pressure distribution of the boundary layer through the automatic wall function. The wall boundary conditions satisfy the no-slip condition. Multiple reference coordinate systems are adopted in this calculation model. The impeller region is set as the rotating coordinate system, and the rest of the calculation domain is set as the static coordinate system. Considering the interaction between the static domain and the rotating domain, the “Frozen Rotor” model is used at the interface, while the “None” model is used for the interface between the rest of the static domain and the static domain. The inlet boundary condition is set to total pressure with a value of 1 atm, and the turbulence intensity at the inlet is 5%. The outlet boundary condition is set to mass flow. The number of constant iteration steps is 1200. The convergence accuracy is set to 1 × 10⁻⁴. The computational time required for the numerical computation is 5 h 04 min.
3. Results
3.1. Energy Characteristics Analysis
In order to study the influence of the stator–rotor cavity on the hydraulic performance of the full tubular pump, we reveal the internal flow characteristics of the stator–rotor cavity of the full tubular pump. In this paper, under the calculation conditions of ensuring the same conditions, the stator–rotor cavity structure in the calculation model of the full tubular pump is removed, and the influence of the presence or absence of the stator–rotor cavity on the hydraulic performance of the full tubular pump is analyzed. The pump device without the stator–rotor cavity structure can be regarded as an axial flow pump device, and the calculation model is shown in Figure 8.
Figure 9 compares the energy performance difference between the axial flow pump and the full tubular pump. It can be seen from the performance curves the change trends of the flow-head and flow-efficiency of two pumps. The head and efficiency of the full tubular pump are significantly lower than those of the axial flow pump, especially since the efficiency varies greatly. Under each flow condition, the efficiency of the full tubular flow pump is lower than 65%. Under the design condition (Qd = 360 L/s), the efficiency is 63.35%, while the efficiency of the axial flow pump is 83.2%. The absolute value of the efficiency differs by 20%, indicating that the shaft power of motor operation is increased by adding stator–rotor structure on the rim edge of the blade. Compared with the head, it is found that under the design condition, the head difference between the full tubular pump and the axial flow pump is about 0.16 m. As the flow rate deviates to the small flow condition, the head difference changes more and more, which means that the leakage flow in the clearance disturbs the stable flow field at the impeller inlet.
Due to the difference in head and efficiency, the next part of this paper will focus on the stator–rotor cavity flow and the torque on the rotor. In order to explore the variation trend of torque on the rotor structure under various flow conditions, the rotor is divided into three parts, as shown in Figure 10.
The torque T on the rotor of the cavity is expressed as the torque sum of each part, and the calculation formula is as follows:
where T1 is the torque of the rotor at the clearance, T2 is the torque on both sides of the rotor, and T3 is the torque at the inlet and outlet of the cavity.
Figure 11 shows the distribution trend of each part torque on the rotor as the flow conditions change. It can be seen from the variation trend of each torque in the figure that the torque of the rotor is dominated by the torque T1 on the clearance. The average proportion of T1 under each flow condition is about 52.4%, reaching 25.2 N·m. The torque T2 accounts for about 32.8%, while the torque T3 is the smallest torque, accounting for about 14.8%. The torque variation trend of each part is small with flow conditions.
Figure 12 shows the trend of cavity flow and torque of the full tubular pump. The torque of the rotor and the flow rate of the cavity both show an increasing trend with the decrease in the flow rate. As the full tubular pump has more stator–rotor cavity structures than the axial flow pump, the full tubular pump has more torque on the rotor. Under the Qd condition (Q = 360 L/s), the rotor torque is 47.91 N·m and the shaft power increases by 7.27 kW. Under the 0.78 Qd condition (Q = 280 L/s), the rotor torque is 48.92 N·m and the shaft power increases by 7.58 kW. Under the 1.17 Qd condition (Q = 420 L/s), the rotor torque is 46.77 N·m and the shaft power increases by 7.10 kW. As the flow rate decreases, the cavity flow q changes from 1.66 L/s to 4.35 L/s. From the relationship between the torque and the cavity flow, it can be seen that the torque of the cavity rotor is greatly affected by the cavity flow rate.
The cavity clearance is an important flow component in the full tubular pump, similar to the tip clearance in the axial flow pump. It can be seen from the above analysis that there is an obvious velocity gradient change in the cavity clearance of the full tubular flow pump. Therefore, it is necessary to evaluate the flow resistance situation at this location by theoretical formulas to further understand the flow resistance in the cavity clearance. The calculation formula is as follows:
where ξ is the flow resistance coefficient, ρ is the fluid density, Δp is the pressure difference between the inlet and outlet sides of the leakage channel, and v is the flow velocity of the leakage channel.
Figure 13 shows the variation trend of the flow resistance coefficient on the cavity clearance under various flow conditions. It can be seen from the figure that with the increase in flow, the flow resistance coefficient on the clearance shows a decreasing trend, which also corresponds to the decreasing trend of clearance leakage. Under the small flow condition, the leakage of the clearance is the largest. Since the flow area at the clearance is small, the flow rate in the cavity clearance is the highest at this time, and the corresponding flow resistance coefficient increases, which indicates that the flow resistance in the cavity clearance is also increasing.
Table 2 shows the force analysis of the rotor and impeller under different flow conditions. With the increase in flow conditions, the axial force on the impeller and the rotor gradually decreases. Comparing the axial force of the impeller and the rotor, it is found that the rotor is subjected to a large proportion of the axial force. Under each flow condition, the axial force on the rotor accounts for 79.1%, 76.77%, and 63.35% of the impeller. However, the radial force is relatively small. This is mainly due to the force area of the rotor; so, the axial force on the rotor cannot be ignored in the structural design.
3.2. Flow Field Analysis
Figure 14 shows the profile velocity streamlines of the stator–rotor cavity under various flow conditions. Comparing the cavity streamlines under various flow conditions, it is found that the cavities on both sides of the clearance are filled with backflow of different scales; further, because the volume of the cavity is large and the flow rate is small, the flow velocity of the cavity on both sides is low and the backflow intensity is small. However, because the size of the clearance is 1 mm, the flow velocity here is faster and the force area is larger, resulting in a larger torque. The flow leaking from the cavity impinges on the impeller inlet flow field so that the leakage flow interacts with the fluid at the impeller rim and flows along the rim wall toward the impeller inlet. The flow leaking from the cavity clearance has the characteristics of high speed and high energy; moreover, because the fluid is affected by the centrifugal force generated by the high-speed rotation of the rotor, the flow near the rotor side has a larger flow rate.
In order to better reveal the evolution of the main vortex structure in the cavity and the change process of the flow state, different cross-sections at the inlet side of the cavity are selected for research, and their specific positions are located at the vortex belt of the cavity inlet, as shown in Figure 15. The velocity eddy strength is used to evaluate the vortex strength, which can effectively identify vortices of different scales. The velocity eddy current intensity is dimensionless, shown in the following formula [35]:
Figure 16 shows the eddy current intensity and streamline distribution at different sections of the cavity under different flow conditions. On the whole, the vortex area in the cavity is mainly distributed in the area of relatively high vortex intensity. Additionally, the local large-scale vortex structures in the cross-section can correspond to the vortex regions in the streamlines, which fill the entire section. It is found that the vortex near the wall is larger in scale and the flow pattern changes are more complex, which may be influenced by the boundary layer on the wall and does not show good regularity. Further, according to the previous study, the increase in the flow conditions will lead to a decrease in the cavity flow, which makes the vortex scale also decrease.
3.3. Structure Optimization of the Rotor
From the above research, it is found that the cavity structure has an influence on the hydraulic performance of the full tubular pump. In the torque of each part of the rotor structure, the torque at the cavity clearance T1 accounts for more than 50% of the total torque of the rotor. Therefore, in the structural design optimization of this section, in order to avoid the influence of the cavities on both sides of the stator-rotor during the rotor optimization, they are removed during optimization, and the clearance size between the stator and rotor is always controlled to be constant. By optimizing the rotor volume, the influence of the rotor on the efficiency of the full tubular pump is analyzed. This optimization aims at improving the operational efficiency of the pump device and comprehensively lists four schemes by reducing the rotor area A, the length L at the cavity clearance T1, and the outer diameter Dz of the disc. The structural model and specific dimensions are shown in Figure 17.
Table 3 shows the predicted results of each rotor structure under the design conditions. It can be seen from Table 3 that the operating efficiency of the pump device is obviously affected by the force area of the rotor, the length of the clearance, and the outer diameter. Compared with the original model, the highest efficiency is improved by 14.04%, which indicates that the operating efficiency of the pump device is closely related to the rotor structure area, and the force area of the rotor structure needs to be controlled in the actual design. However, the head of the pump device decreases with the decrease in the optimized parameters. It can also be seen from the table that with the decrease in the rotor area, length, and outer diameter of the disk, it is easier to cause the leakage of the cavity flow and the maximum leakage increases by 1.53 L/s, which will lead to an increase in the pressure difference at the inlet and outlet sides of the cavity.
Figure 18a shows the variation trend of torque under design conditions. Under design conditions, the torque of each part of the rotor structure decreases with the reduction in the rotor area. In Scheme 4, the rotor torque finally reaches 8.66 N·m, which is 39.25 N·m lower than the initial model. In Scheme 4, the torque on the clearance T1 reaches 5.36 N·m, the torque on T2 is 1.07 N·m, and the torque on T3 is 2.23 N·m. In Figure 18b, Ti/Ai is expressed as the ratio of torque to its corresponding surface area. It can be seen that although the rotor surface torque decreases with the decrease in the rotor surface area, the ratio of the total torque to the surface area is a certain value, which is about 230 N/m. Combined with Figure 11, it can be explained that the torque at the rotor is mainly related to the surface area of the rotor, and has little influence on different flow conditions. This shows that reducing the surface area of the rotor structure is beneficial to reducing the torque on the rotor surface and improving the operating efficiency of the device.
Figure 19 shows the flow resistance coefficient on the clearance T1 under different cavity structures and the change in the cavity flow rate with the flow conditions. It can be seen from the figure that the flow resistance coefficient and the flow rate of the cavity in different schemes all decrease with the increase in the flow rate. However, with the reduction in the rotor structure area, the operation efficiency of the pump devices in Schemes 1 to 4 is improved, and the cavity flow rate and flow resistance coefficient are also increased. Compared with Scheme 1 and Scheme 4, the cavity flow rate increased by 1.48 L/s under the design conditions. However, under the design condition, the flow resistance coefficient increases by 0.14, which indicates that the reduction in the rotor area will increase the pressure difference on the cavity, resulting in the increase in hydraulic loss.
3.4. Model Test Validation
In order to further verify the reliability of the cavity clearance grid and the feasibility of the rotor structure in the above Scheme 4, this paper conducts a model test on the cavity structure by processing the rotor in Scheme 4. The prediction results of the numerical simulation are further verified by the model test performance curve.
The model pump device mainly includes an impeller, guide vane, stator–rotor cavity, inlet pipe, and outlet pipe. The impeller diameter of the full tubular pump D is 300 mm, and the hub ratio of the blade is 0.4. The hub ratio of the guide vane is also 0.4, and the number of guide vane blades is 7. The stator–rotor cavity structure is processed according to Scheme 4. The test speed n is 1450 r/min. The rotor and the blade are fixed by four, 3-mm, countersunk screws. The model test device is shown in Figure 20.
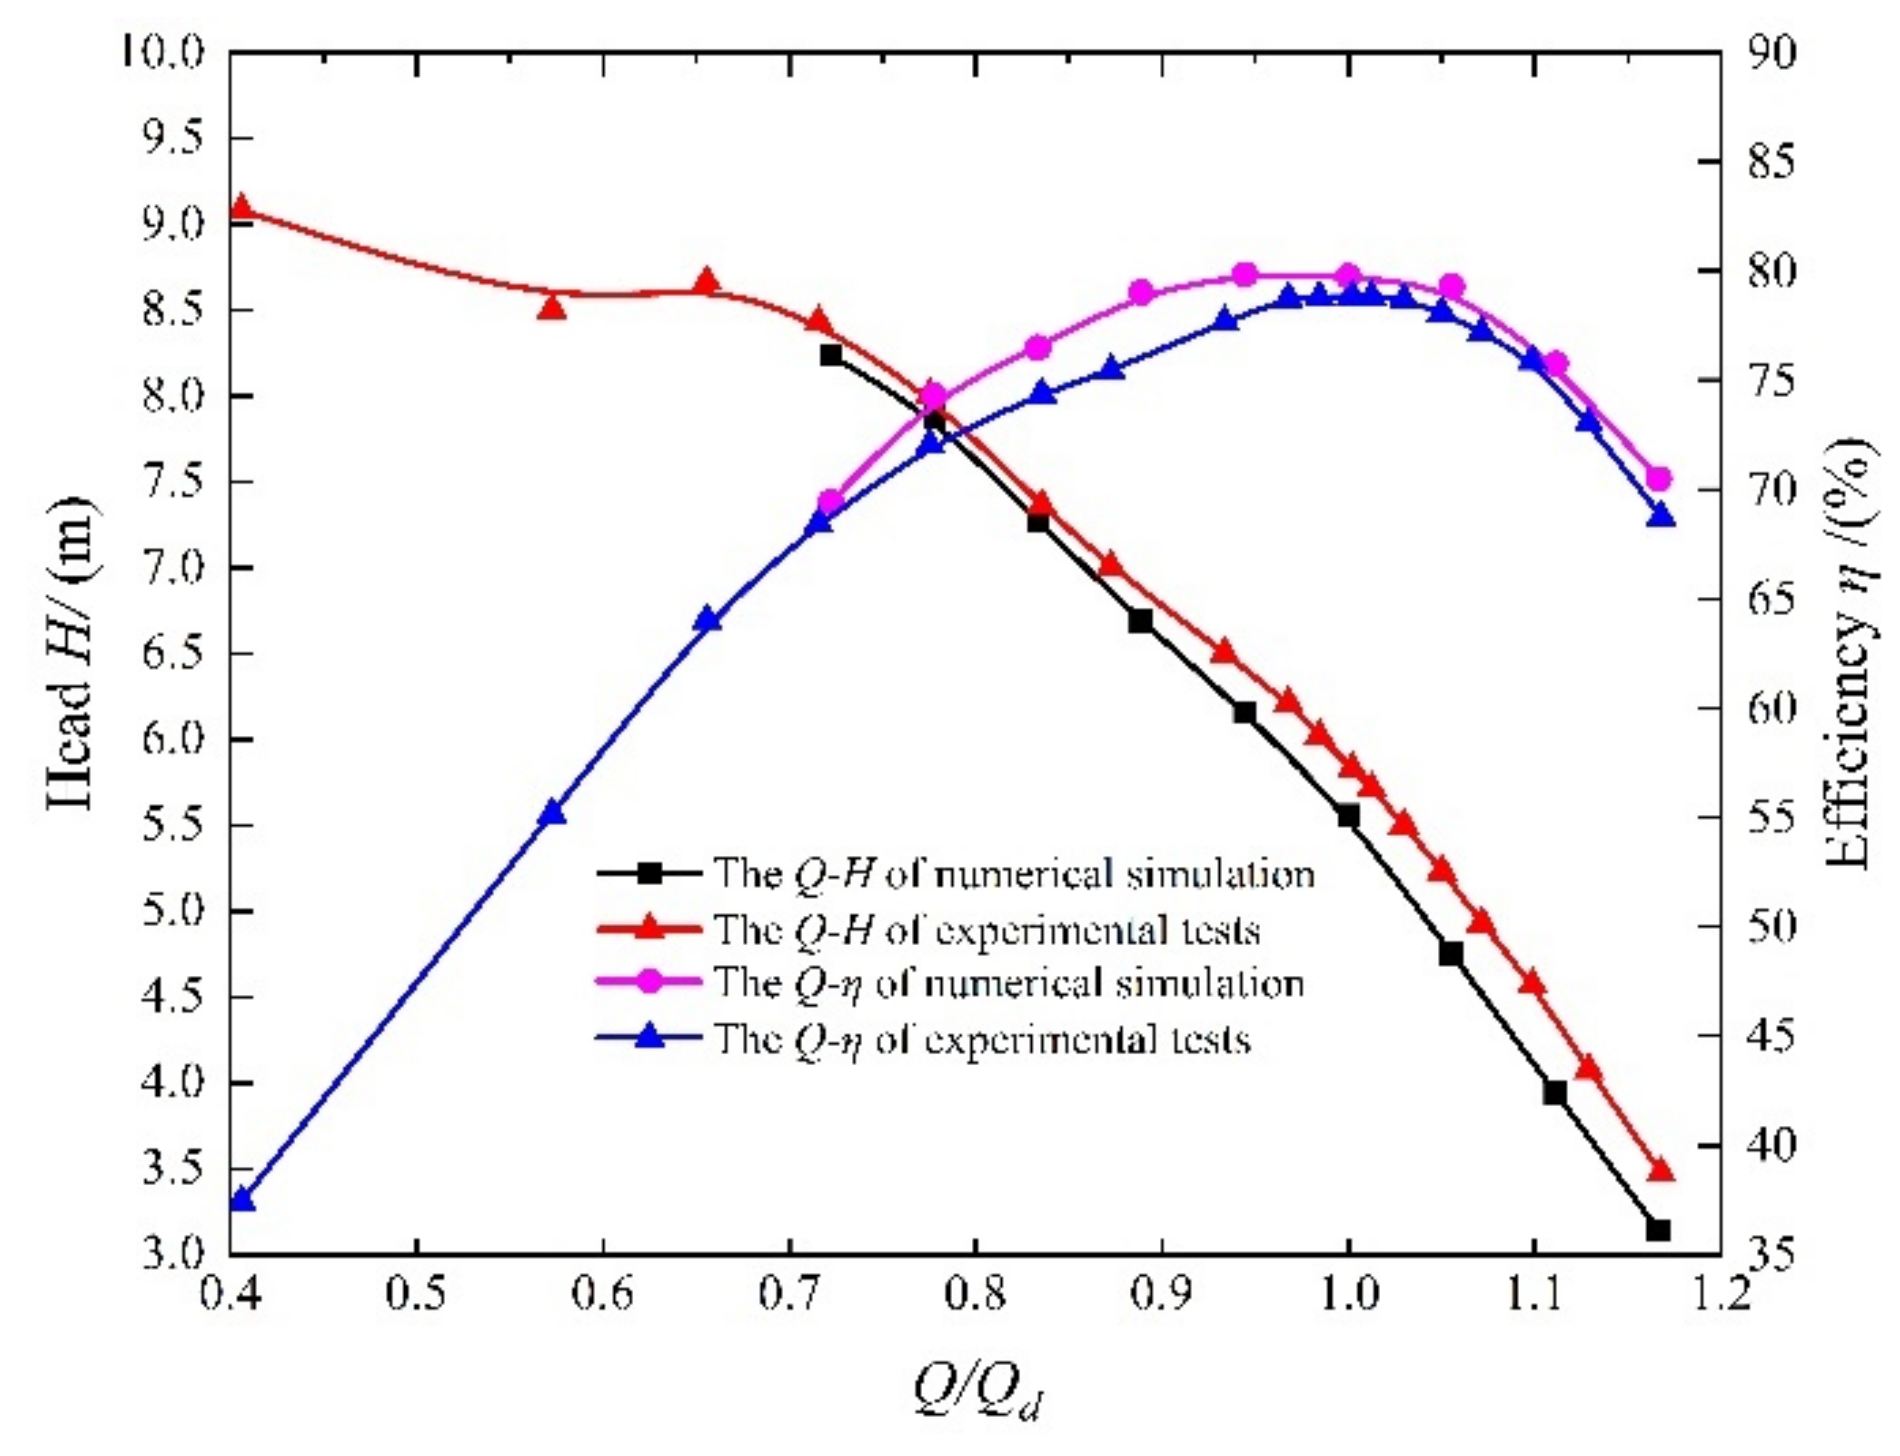
Figure 21 shows the comparison between the numerical simulation and model test results of the full tubular pump device. Comparing the predicted results, the changing trend of the Q-H and Q-η curves predicted by numerical simulation is basically consistent with the model test. The head predicted by numerical simulation is obviously lower than that of the model test. Under the design condition Qd, the test head is 5.83 m, which is 4.6% relative error to the numerical simulation. The test operation efficiency is 78.83%, which is 1.2% relative error to the numerical simulation. When the flow rate is in the range of 0.7 Qd–1.17 Qd, the relative error of the numerical simulation prediction value of the full tubular pump is all within 5%. Therefore, it shows that the numerical simulation results in this paper are reliable and accurate.
4. Conclusions
In this paper, CFD technology is the main research method. The flow characteristics of the stator–rotor are analyzed emphatically and compare the influence of different rotor structures on the hydraulic performance of the full tubular pump. The major conclusions are summarized as follows.
- 1.
- There are large-area vortex structures on both sides of the cavity, and the backflow intensity is low. Due to the centrifugal effect caused by the rotor rotation, the flow velocity around the rotor in the cavity is higher. The vortex in the stator–rotor cavity is mainly concentrated on the inlet side, and the change in the vortex size in the cavity is mainly affected by the cavity flow.
- 2.
- Under the design condition, the torque on the rotor clearance is relatively large, reaching about 50% of the total rotor torque. By comparing the axial forces of the impeller and the rotor, it is found that the rotor accounts for 79.1%, 76.77%, and 63.35% of the impeller under various flow conditions. From its proportion, it can be seen that the load acting on the rotor increases due to the large force area of the rotor.
- 3.
- By optimizing the rotor structure, it is found that it has a great influence on the efficiency of the full tubular pump. Compared with the original model, the efficiency is increased by 14.04% and the torque is reduced by 39.25 N m. Under the design condition, the head decreases by 0.11 m at most and the leakage increases by 1.53 L/s. It shows that the operating efficiency of the pump device is closely related to the area of the rotor structure, and the area of the rotor structure needs to be controlled in the actual design process.
In the structural optimization of the full tubular pump device in the future, in addition to taking into account the need to control the flow of the cavity to cool the motor, the rotor structure area should be shortened as much as possible to reduce the energy loss of the device.
Author Contributions
Data curation, L.S. and J.L.; formal analysis, F.T. and B.C.; writing—original draft, J.Z. and T.X.; writing—review and editing, Y.J. and Y.C. All authors have read and agreed to the published version of the manuscript.
Funding
This work was supported by the National Natural Science Foundation of China (grant number 51376155); the Natural Science Foundation of Jiangsu Province of China (grant number BK20190914); China Postdoctoral Science Foundation Project (2019M661946); the Natural Science Foundation of Jiangsu Higher Education Institutions of China (grant number 19KJB570002); the Jiangsu Water Conservancy Science and Technology project (No. 2021012); the Priority Academic Program Development of Jiangsu Higher Education Institutions (grant number PAPD).
Institutional Review Board Statement
Not applicable.
Informed Consent Statement
Not applicable.
Data Availability Statement
All the data in this paper are obtained by physical experiment and numerical simulation, respectively, and the data used to support the findings of this study are available from the corresponding author upon request.
Acknowledgments
The authors included in the article have consented to the acknowledgement.
Conflicts of Interest
The authors declare no conflict of interest.
Nomenclature
| D | impeller diameter, mm |
| Qd | design flow, L/s |
| ρ | density, kg/m3 |
| ξ | flow resistance coefficient |
| g | local acceleration of gravity, m/s2 |
| H | head, m |
| η | efficiency, % |
| n | rotation speed, r/min |
| bep | best efficiency point |
| α | velocity Eddy Strength |
| μ | Poisson ratio |
| y+ | distance to the nearest wall |
| ν | kinematic viscosity |
| k | turbulent energy, m2/s2 |
| i, j | stands for the x, y, z direction |
| uj | stands for the velocity in different coordinate directions, m/s |
| xj | stands for the coordinate component, m |
References
- Gu, Z.S. Development and application of a new type submersible tubular pump. Water Resour. Hydropower Eng. 2010, 41, 54–57. [Google Scholar]
- Liu, C. Researches and Developments of Axial-flow Pump System. Trans. Chin. Soc. Agric. Mach. 2015, 46, 49–59. [Google Scholar]
- Zhang, C.Y. Numerical Simulation and Optimization of a Motor-Pump System; Yangzhou University: Yangzhou, China, 2020. [Google Scholar]
- Zhang, C.; Liu, C.; Feng, X.; Chu, C.; Xie, L.; Lei, Z.; Hydraulic, S.O. Numerical simulation of flow characteristics and performance prediction of a motor pump. Southto-North Water Transf. Water Sci. Technol. 2019, 17, 185–192. [Google Scholar]
- Shi, L.J.; Jiao, H.F.; Gou, J.L.; Yuan, Y.; Tang, F.P.; Yang, F. Influence of Backflow Gap Size on Hydraulic Performance of Full-flow Pump. Trans. Chin. Soc. Agric. Mach. 2020, 51, 139–146. [Google Scholar]
- Shi, L.J.; Zhang, W.P.; Jiao, H.F.; Tang, F.; Wang, L.; Sun, D.; Shi, W. Numerical Simulation and Experimental Study on the Comparison of the Hydraulic Characteristics of an Axial-Flow Pump and a Full Tubular Pump. Renew. Energy 2020, 153, 1455–1464. [Google Scholar] [CrossRef]
- Cheng, S. Starting Performance and Electromagnetic Noise Analysis of Submersible Motor with Welded Rotor in Entirely Tubular Electric Pump; Hefei University of Technology: Hefei, China, 2020. [Google Scholar]
- Xu, X.F.; Ge, Q. Fault Diagnosis of Tubular Motor Pump Based on BP Neural Network. Intern. Combust. Engine Parts 2021, 2, 139–140. [Google Scholar]
- Cao, L.J.; Liu, C.Y.; Zhong, Y.F. Application of Full Tubular Submersible Pump and Stability Analysis of Self-Coupling Installation at Water Outlet; Hunan Hydro & Power: Changsha, China, 2015; pp. 87–91. [Google Scholar]
- Jiang, P.H. Comparison and Selection of Pump Types for the Reconstruction and Expansion Project of Youyi Electric Discharge Station; Heilongjiang Hydraulic Science and Technology: Harbin, China, 2020; Volume 48, pp. 102–103. [Google Scholar]
- Zhu, H.M. Research on the Application of Fully Tubular Submersible Gate Pump. Jianghuai Water Resour. Sci. Technol. 2015, 36, 18–19. [Google Scholar]
- Jiao, H.F. Study on the Hydraulic Performance and Radial Gap Size of the Full-flow Pump; Yangzhou University: Yangzhou, China, 2020. [Google Scholar]
- Li, Y.J.; Shen, J.F.; Yi, Y.P.; Liu, Z.Q. Numerical Investigation of Pressure Fluctuations on Axial-flow Pump Blades Affected by Tip-gap Size. Trans. Chin. Soc. Agric. Mach. 2014, 45, 59–64. [Google Scholar]
- Yang, C.M.; Chen, C.C.; Wang, J.N.; Song, W.W.; Xia, P.F. Numerical Study for Behavior of Tip Clearance Flow in Axial-Flow Pump. J. Mech. Eng. 2003, 39, 49–51. [Google Scholar] [CrossRef]
- Dai, C.C.; Guo, P.C.; Luo, X.Q. Numerical Analysis of Tip Clearance F Low Characteristic N Axial-Flow Pump. Fluid Mach. 2009, 37, 32–35. [Google Scholar]
- You, D.; Mittal, R.; Wang, M.; Moin, P. Computational Methodology for Large-Eddy Simulation of Tip-Clearance Flows. AIAA J. 2004, 42, 271–279. [Google Scholar] [CrossRef]
- Laborde, R.; Chantrel, P.; Mory, M. Tip Clearance and Tip Vortex Cavitation in an Axial Flow Pump. J. Electron. Packag. Trans. ASME 1997, 119, 680–685. [Google Scholar] [CrossRef]
- Meng, F.; Li, Y.J.; Yuan, S.Q. Effect of Hub Clearance on Hydraulic Performance in Bidirectional Axial-flow Pump. Trans. Chin. Soc. Agric. Mach. 2020, 51, 131–138. [Google Scholar]
- Li, Y.B.; Hu, P.L.; Li, R.N.; Li, P.H.; Bi, Z. Numerical analysis for effects of different blade tip clearance on performance in mixed-flow pump. Trans. Chin. Soc. Agric. Mach. 2014, 30, 86–93. [Google Scholar]
- Oweis, G.F.; Fry, D.; Chesnakas, C.J.; Jessup, S.D.; Ceccio, S.L. Development of a Tip-Leakage Flow-Part 1: The Flow Over a Range of Reynolds Numbers. J. Fluids Eng. 2006, 128, 751–764. [Google Scholar] [CrossRef]
- Wu, H.X.; Tan, D.; Miorini, R.L.; Katz, J. Three-Dimensional Flow Structures and Associated Turbulence in the Tip Region of a Waterjet Pump Rotor Blade. Exp. Fluids 2011, 51, 1721–1737. [Google Scholar] [CrossRef]
- Xi, S.; Desheng, Z.; Bin, X.; Yongxin, J.; Weidong, S.; Van Esch, B.P.M. Experimental Investigation of the Transient Patterns and Pressure Evolution of Tip Leakage Vortex and Induced-Vortices Cavitation in an Axial Flow Pump. J. Fluids Eng. 2020, 142, 101206. [Google Scholar] [CrossRef]
- Dreyer, M.; Decaix, J.; Münch-Alligné, C.; Farhat, M. Mind the Gap: A New Insight into the Tip Leakage Vortex Using Stereo-PIV. Exp. Fluids 2014, 55, 1849. [Google Scholar] [CrossRef]
- Zhang, X.; Tang, F.; Liu, C.; Shi, L.; Liu, H.; Sun, Z.; Hu, W. Numerical Simulation of Transient Characteristics of Start-Up Transition Process of Large Vertical Siphon Axial Flow Pump Station. Front. Energy Res. 2021, 9, 706975. [Google Scholar] [CrossRef]
- Wang, W.; Tai, G.; Pei, J.; Pavesi, G.; Yuan, S. Numerical investigation of the effect of the closure law of wicket gates on the transient characteristics of pump-turbine in pump mode. Renew. Energy 2022, 194, 719–733. [Google Scholar] [CrossRef]
- Zhang, X.W.; Tang, F.P. Investigation on hydrodynamic characteristics of coastal axial flow pump system model under full working condition of forward rotation based on experiment and CFD method. Ocean. Eng. 2022, 253, 111286. [Google Scholar] [CrossRef]
- Kan, K.; Zheng, Y.; Chen, H.; Zhou, D.; Dai, J.; Binama, M.; Yu, A. Numerical simulation of transient flow in a shaft extension tubular pump unit during runaway process caused by power failure. Renew. Energy 2020, 154, 1153–1164. [Google Scholar] [CrossRef]
- Kan, K.; Yang, Z.; Lyu, P.; Zheng, Y.; Shen, L. Numerical study of turbulent flow past a rotating axial-flow pump based on a level-set immersed boundary method. Renew. Energy 2021, 168, 960–971. [Google Scholar] [CrossRef]
- Menter, F.R. Two-Equation Eddy-Viscosity Turbulence Models for Engineering Applications. AIAA J. 1994, 32, 1598–1605. [Google Scholar] [CrossRef]
- Menter, F.R. Zonal Two Equation k-ω Turbulence Models for Aerodynamic Flows. In Proceeding of the 24rd Fluid Dynamics Conference, Orlando, FL, USA, 6 July 1993. [Google Scholar]
- Menter, F.R.; Kuntz, M.; Langtry, R. Ten Years of Industrial Experience with the SST Turbulence Model. Turbul. Heat Mass Transf. 2003, 4, 625–632. [Google Scholar]
- Zi, D.; Wang, F.; Tao, R.; Hou, K.Y. Research for impacts of boundary layer grid scaleon flow field simulation results in pumping station. J. Hydraul. Eng. 2016, 47, 139–149. [Google Scholar]
- Khanarmuei, M.; Rahimzadeh, H.; Sarkardeh, H. Effect of Dual Intake Direction on Critical Submergence and Vortex Strength. J. Hydraul. Res. 2019, 57, 272–279. [Google Scholar] [CrossRef]
- Wang, Y.; Zhang, F.; Yuan, S.; Chen, K.; Wei, X.; Appiah, D. Effect of Unrans and Hybrid Rans-Les Turbulence Models on Unsteady Turbulent Flows Inside a Side Channel Pump. J. Fluids Eng. 2020, 142, 061503. [Google Scholar] [CrossRef]
- Liu, C. Pumps and Pumping Stations; China Water & Power Press: Beijing, China, 2009. [Google Scholar]
Figure 1.
Three-dimensional calculation model of the full tubular pump.
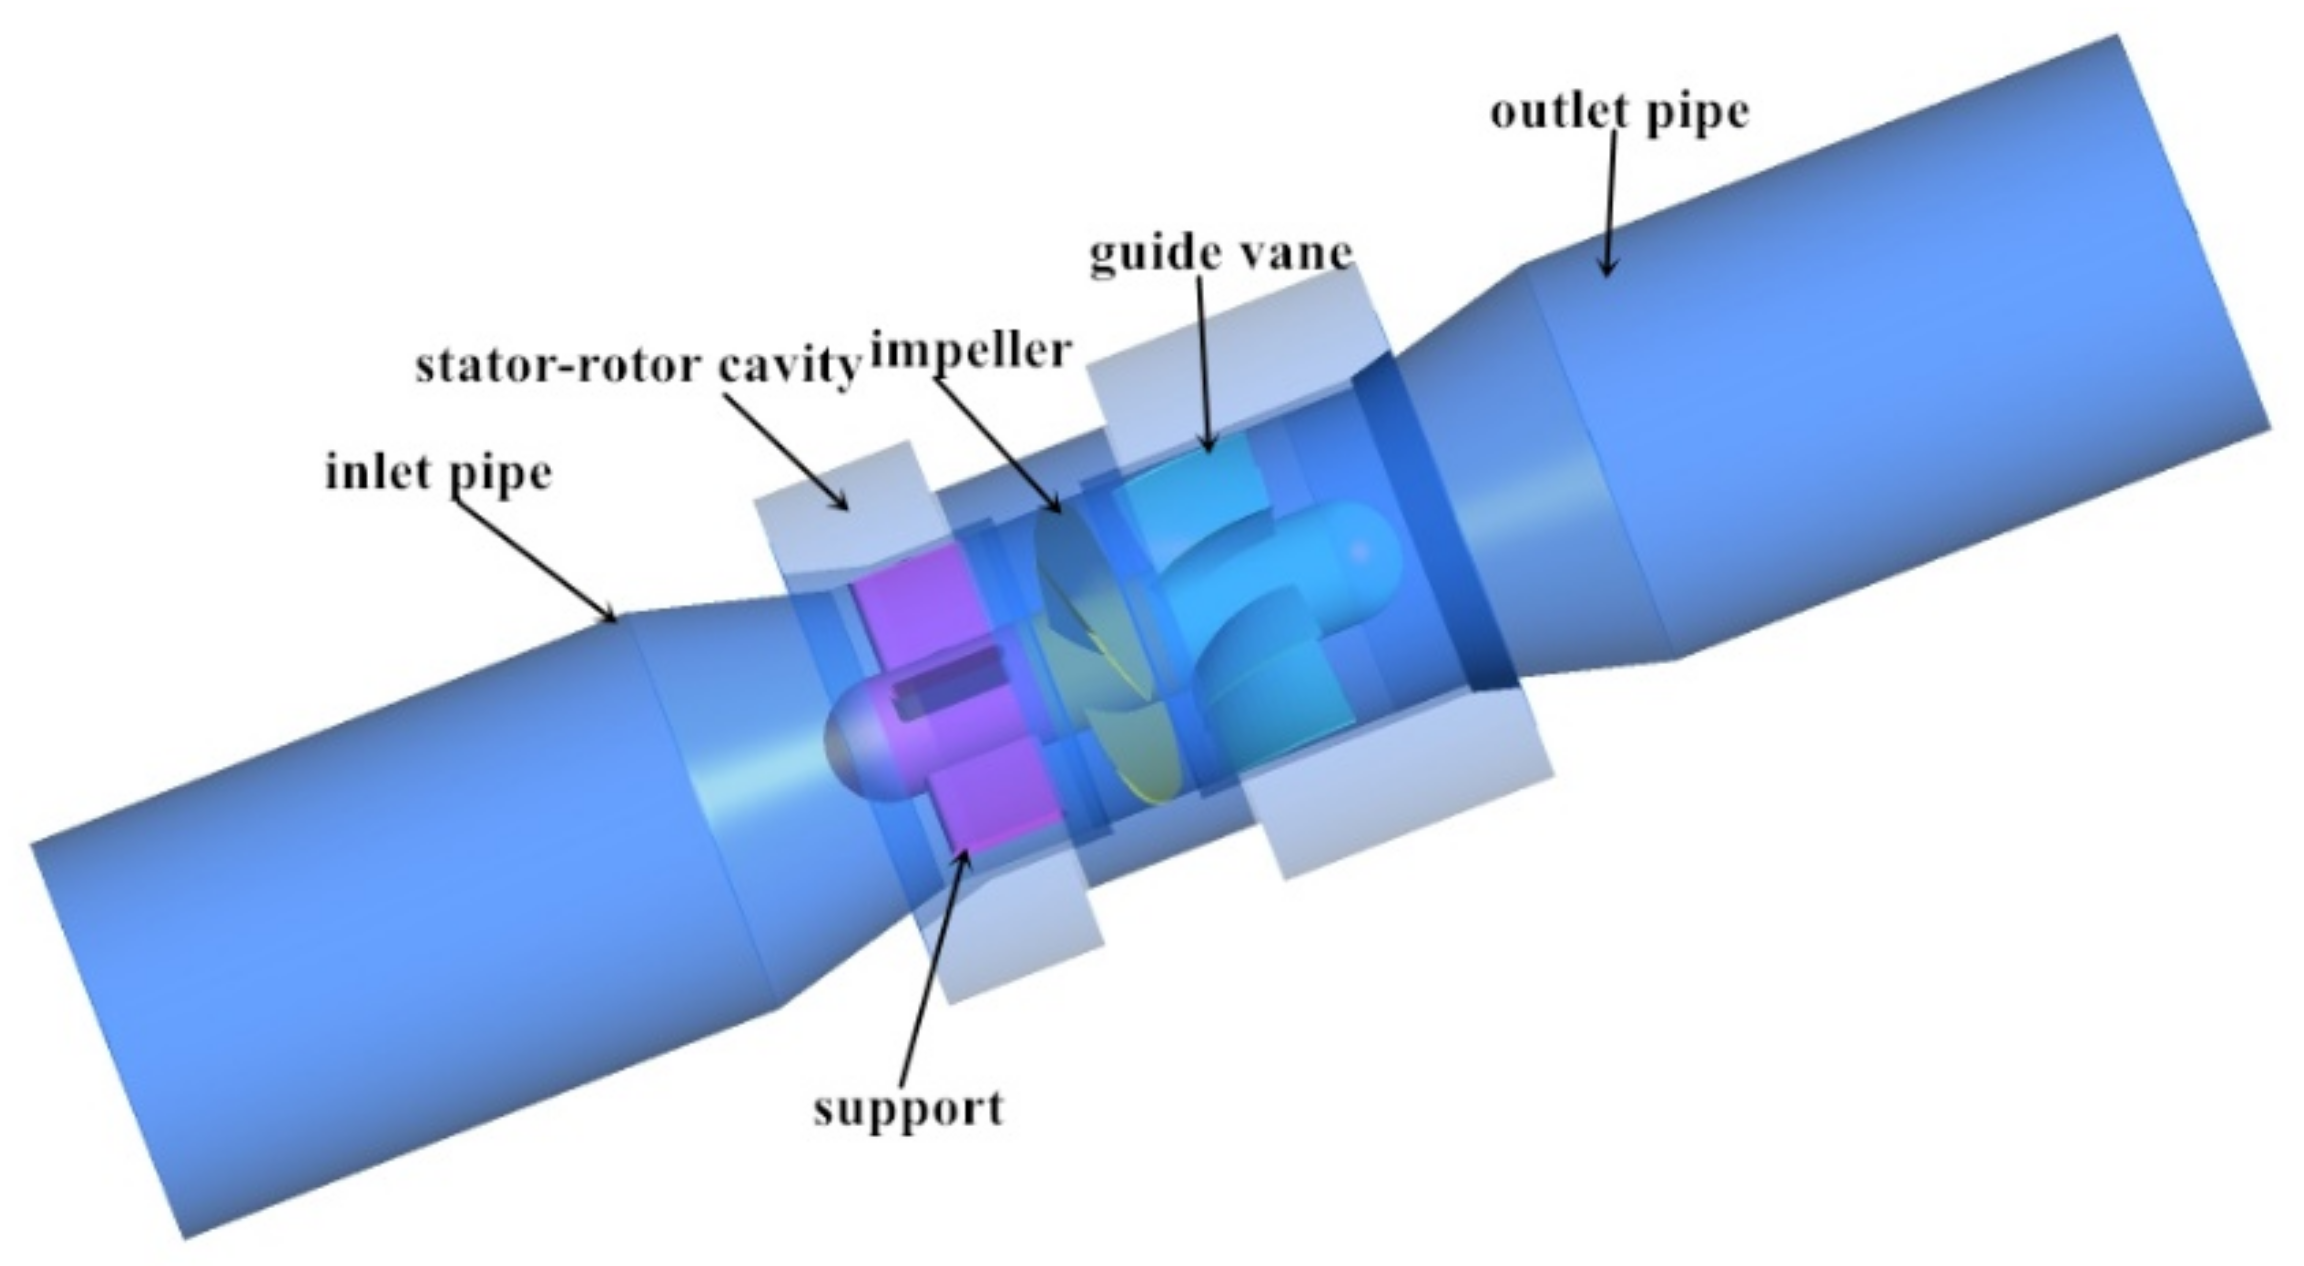
Figure 2.
The grid of the main flow components. (a) Support, (b) Impeller, (c) Guide vane, (d) Inlet pipe, (e) Stator–rotor cavity.
Figure 2.
The grid of the main flow components. (a) Support, (b) Impeller, (c) Guide vane, (d) Inlet pipe, (e) Stator–rotor cavity.
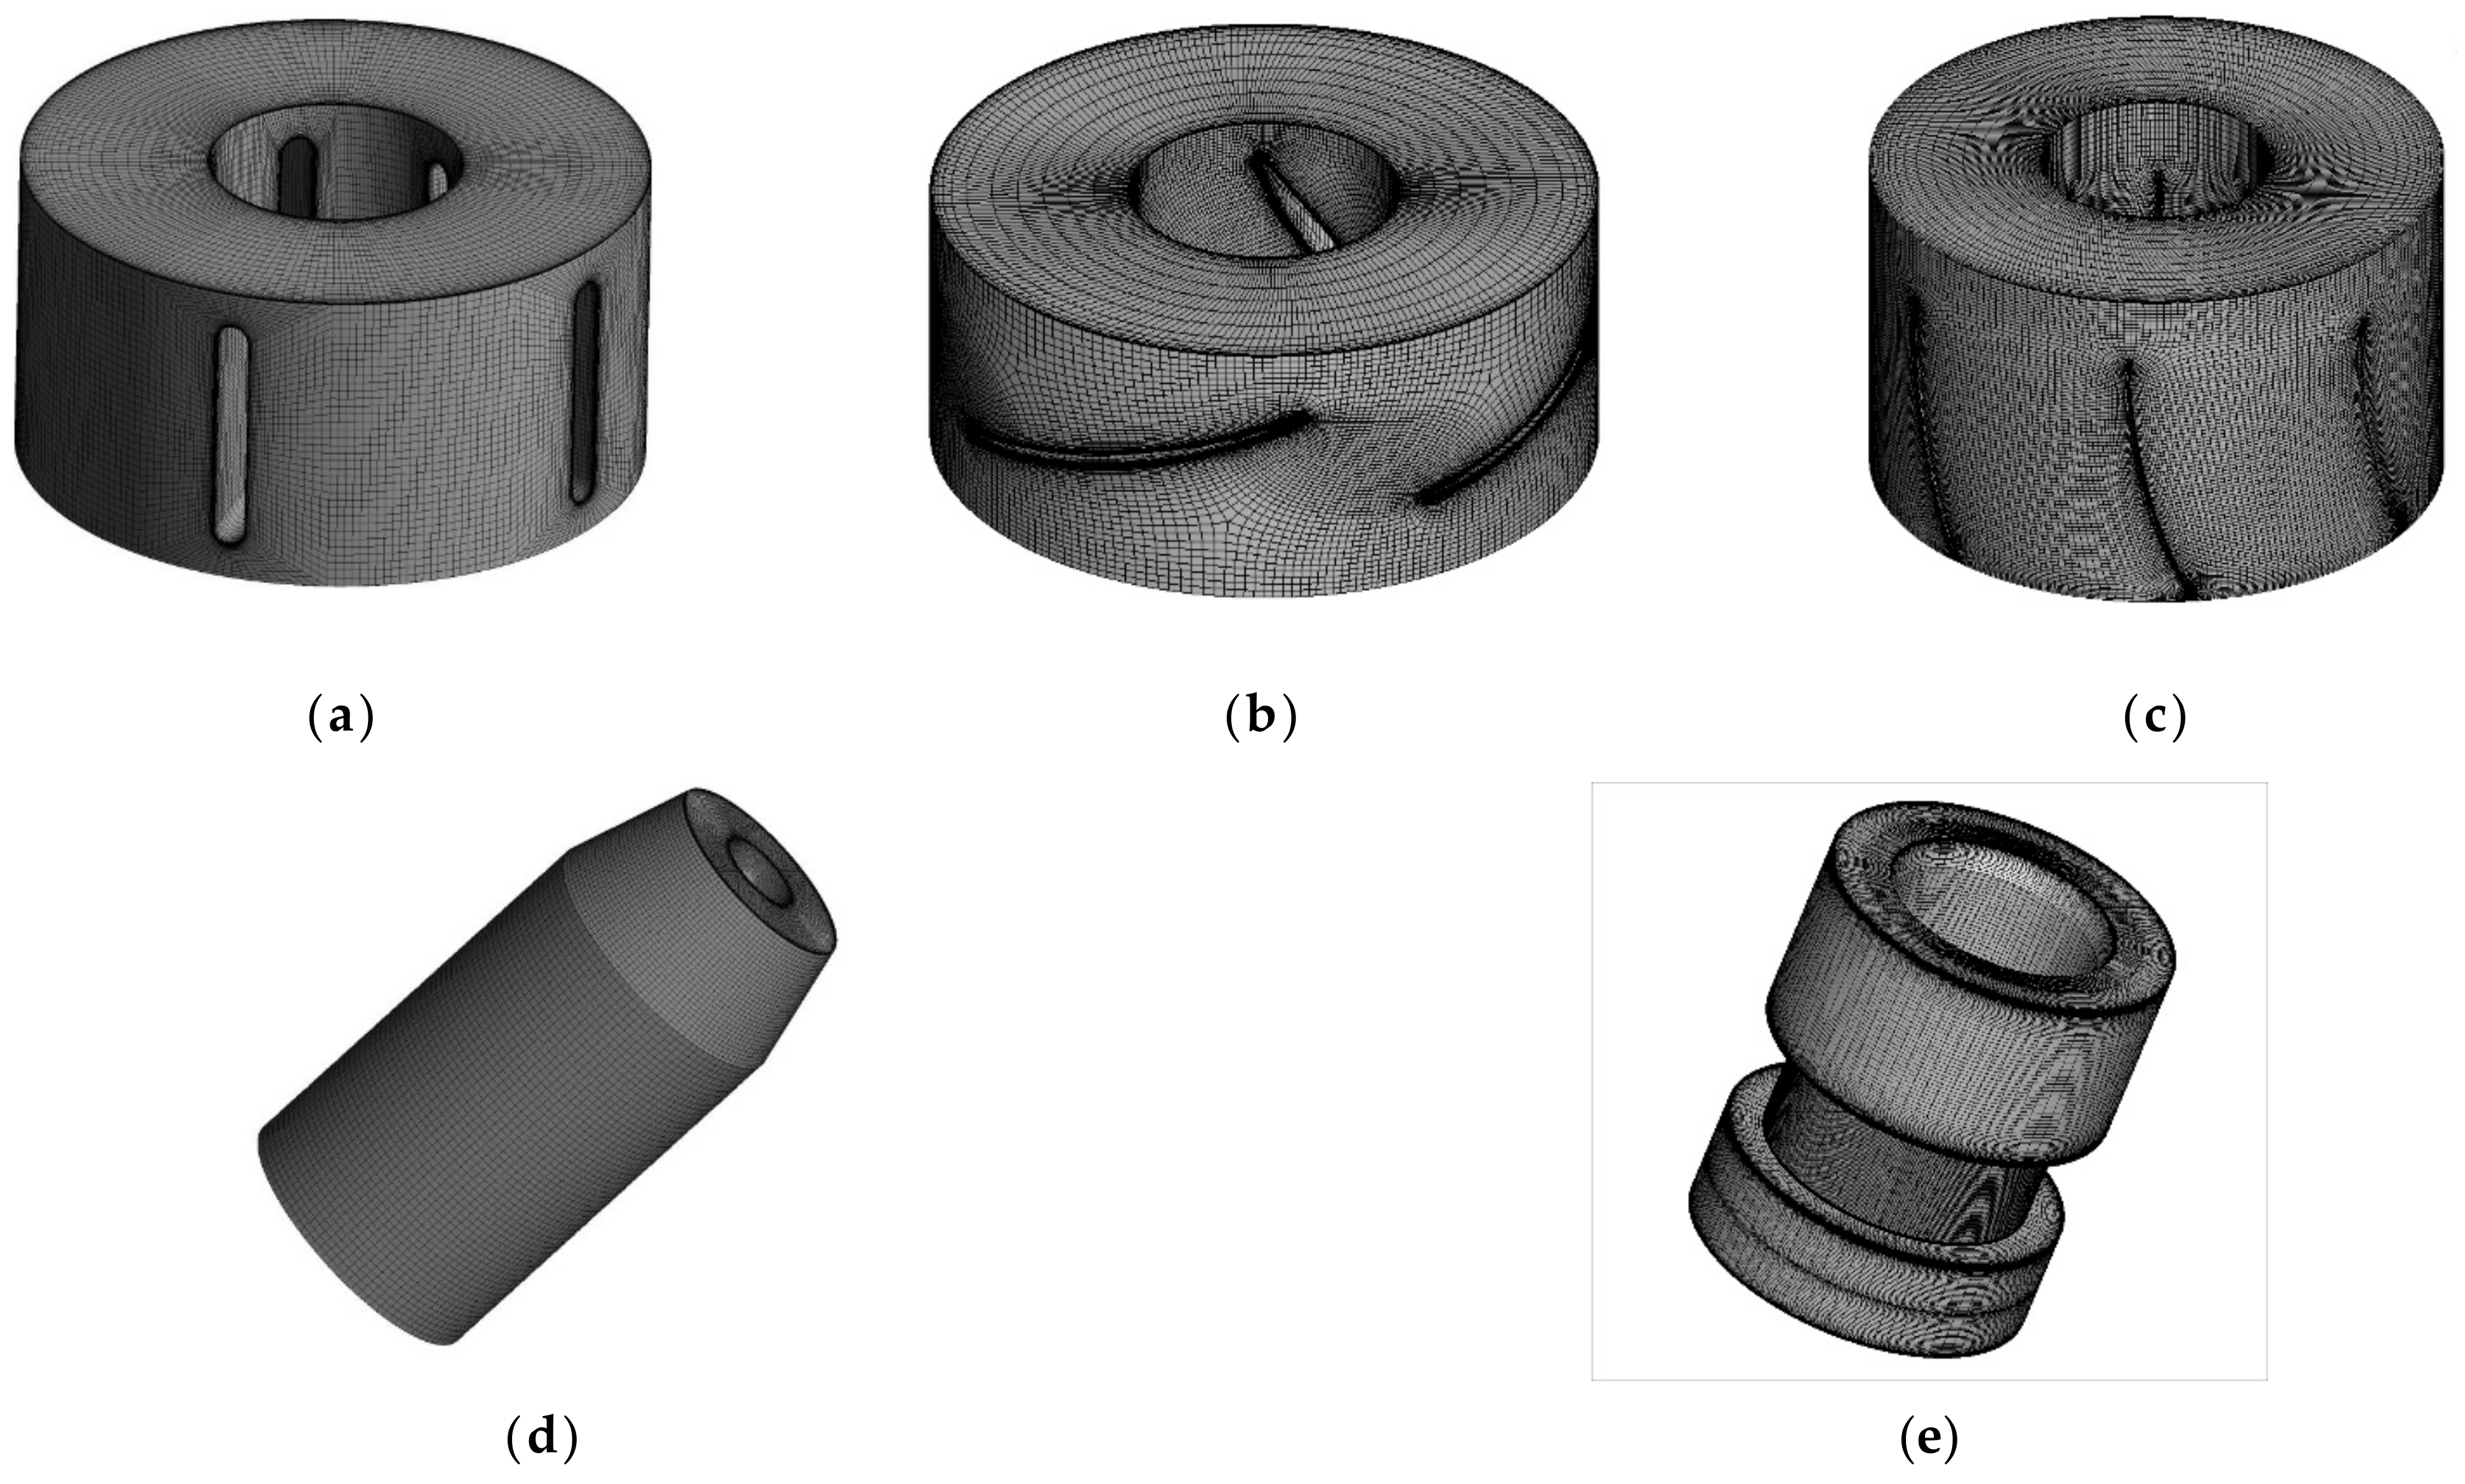
Figure 3.
The schematic model of the stator–rotor cavity.

Figure 4.
The distribution of different grid nodes. (a) 3 nodes, (b) 11 nodes, (c) 21 nodes.
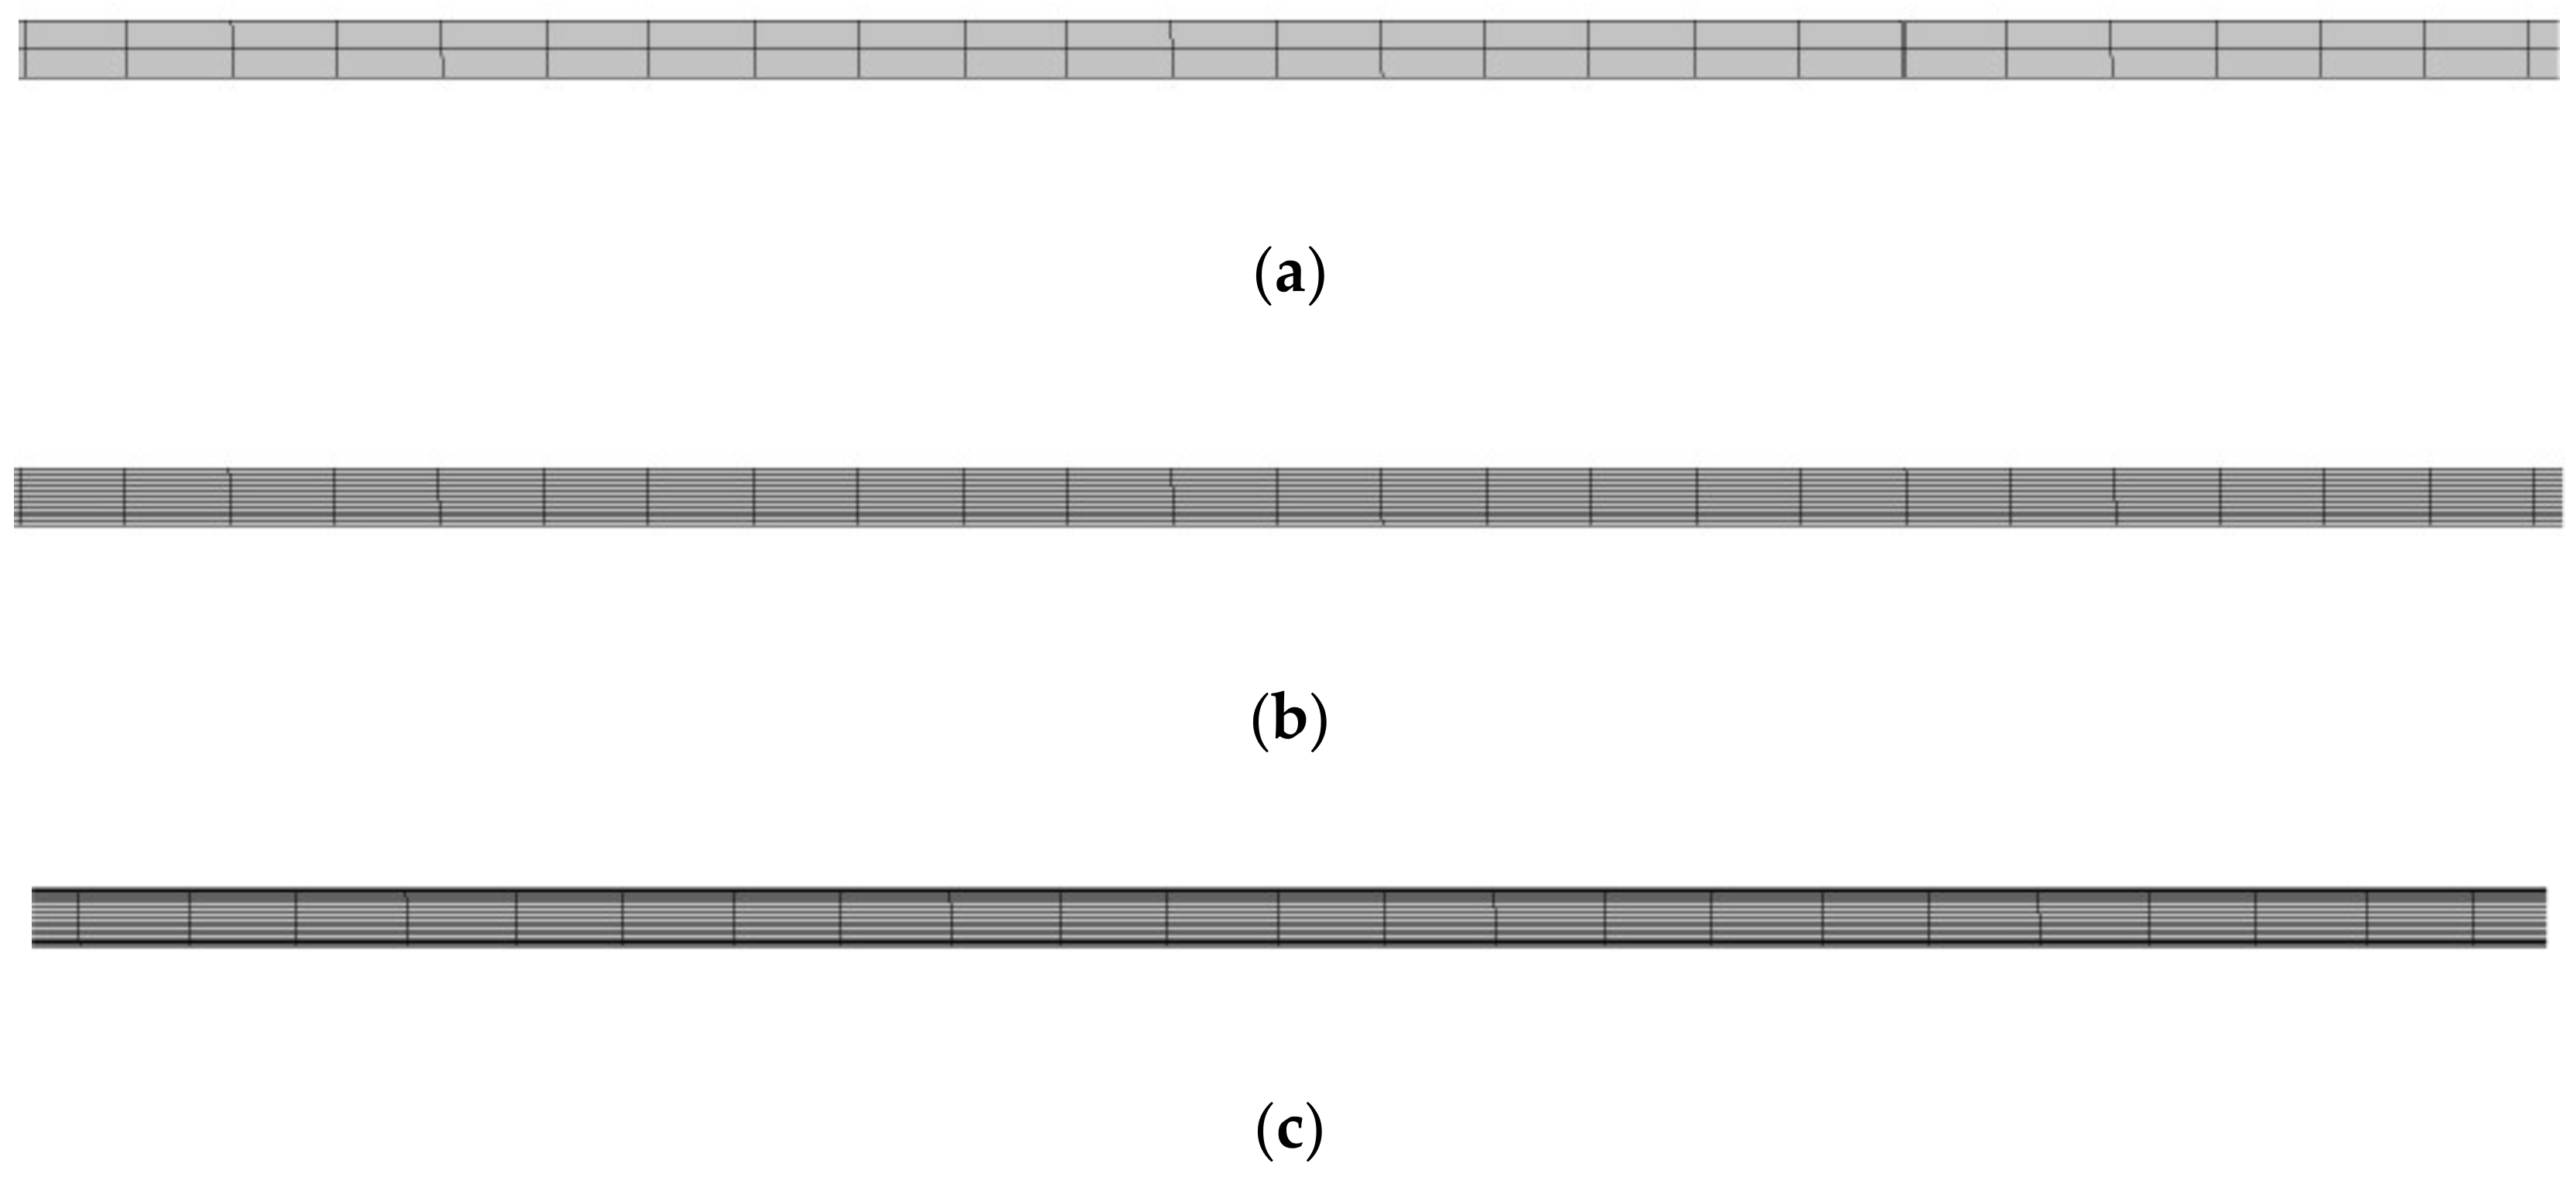
Figure 5.
The velocity distribution of different grid nodes. (a) 3 nodes, (b) 11 nodes, (c) 21 nodes.
Figure 5.
The velocity distribution of different grid nodes. (a) 3 nodes, (b) 11 nodes, (c) 21 nodes.

Figure 6.
The velocity distribution on the clearance with radial distance.
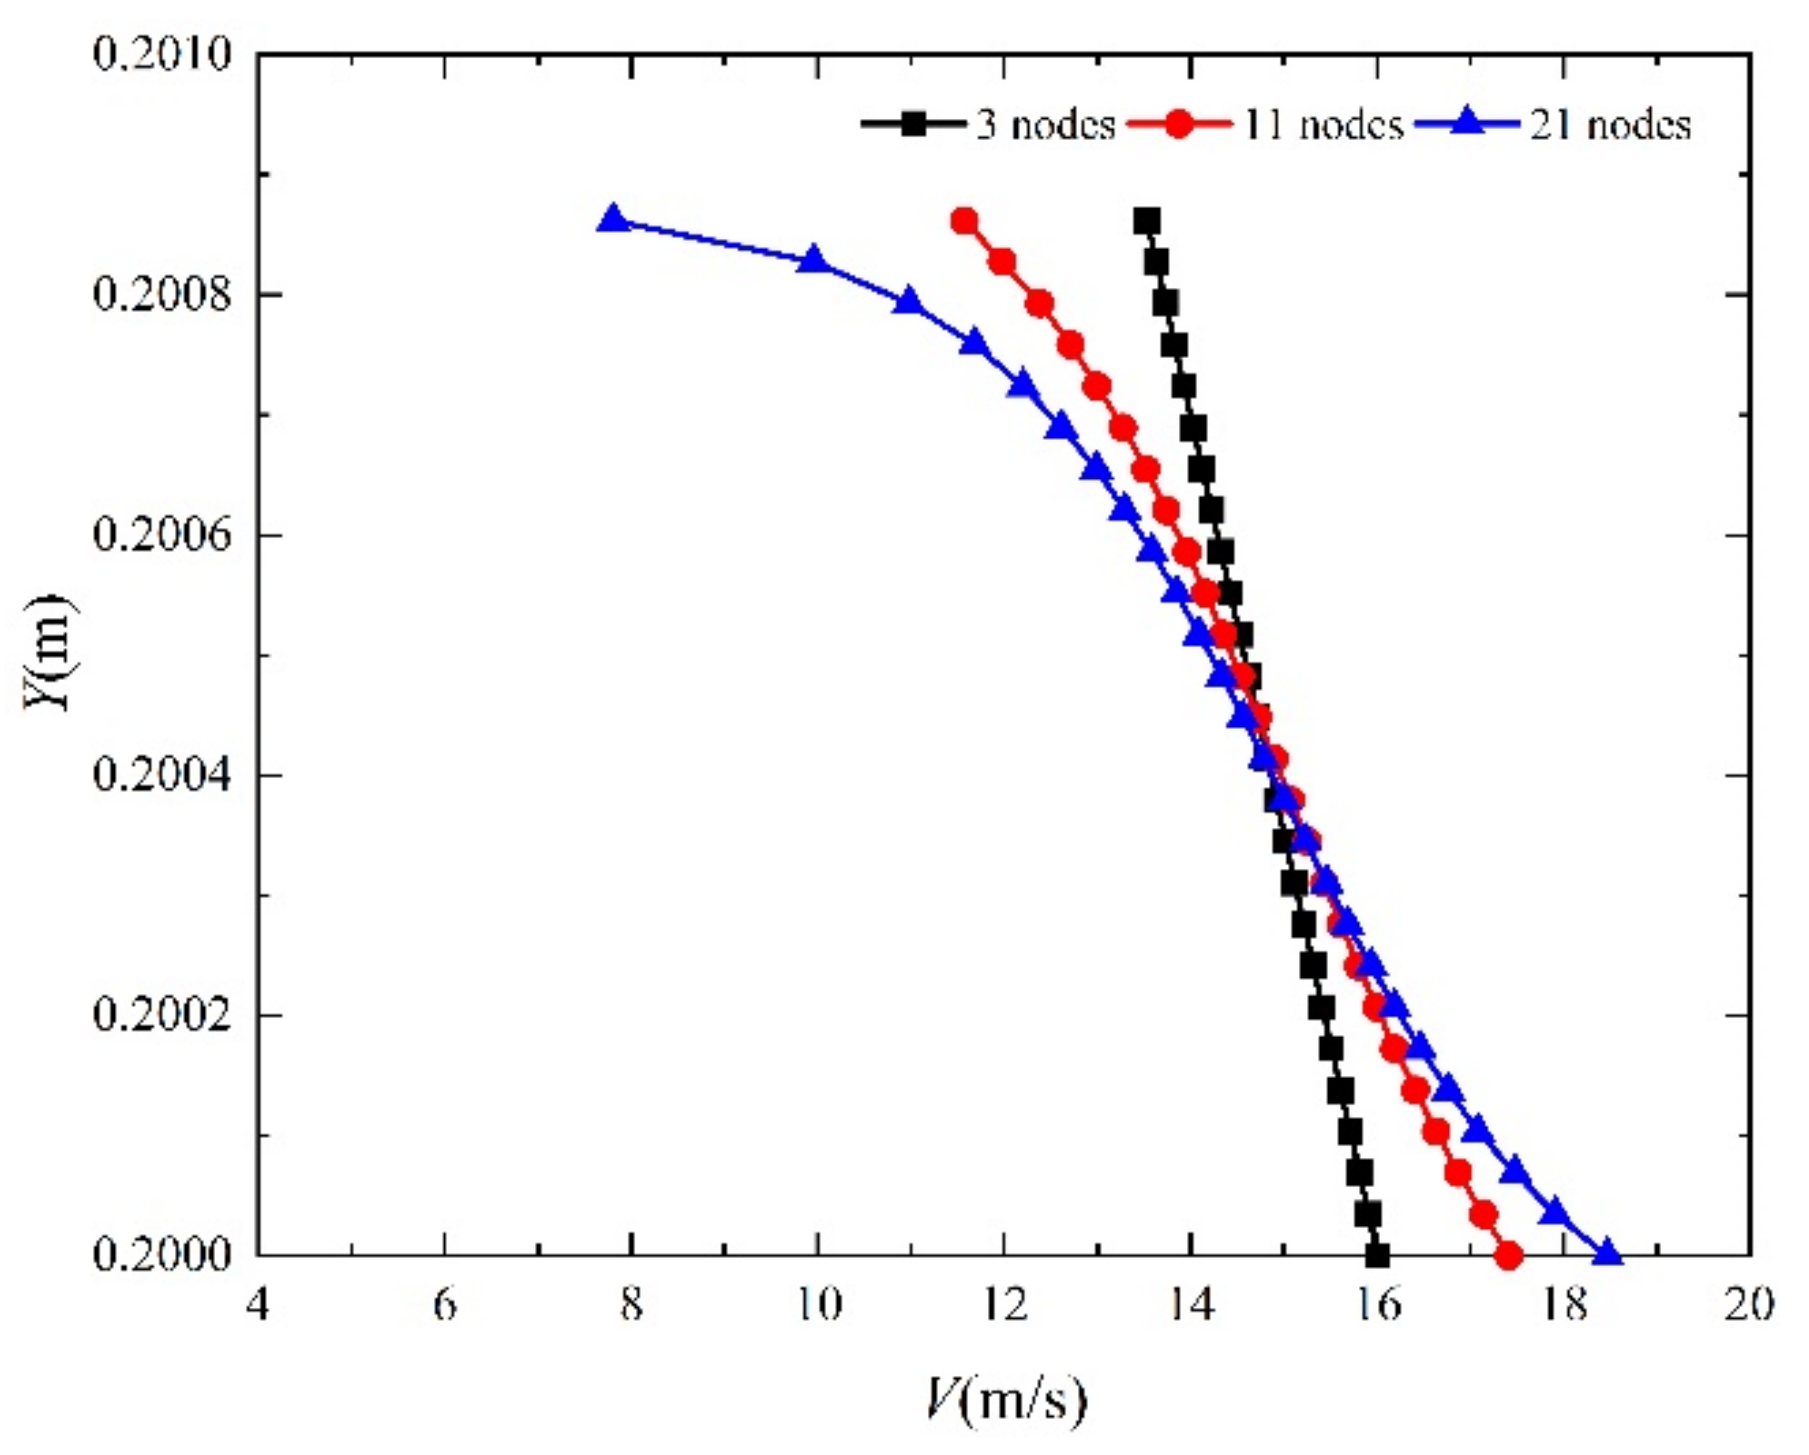
Figure 7.
Efficiency-based grid independence verification.

Figure 8.
Computational model. (a) The full tubular pump, (b) The axial flow pump.

Figure 9.
The performance curve of the axial flow pump and the full tubular pump.
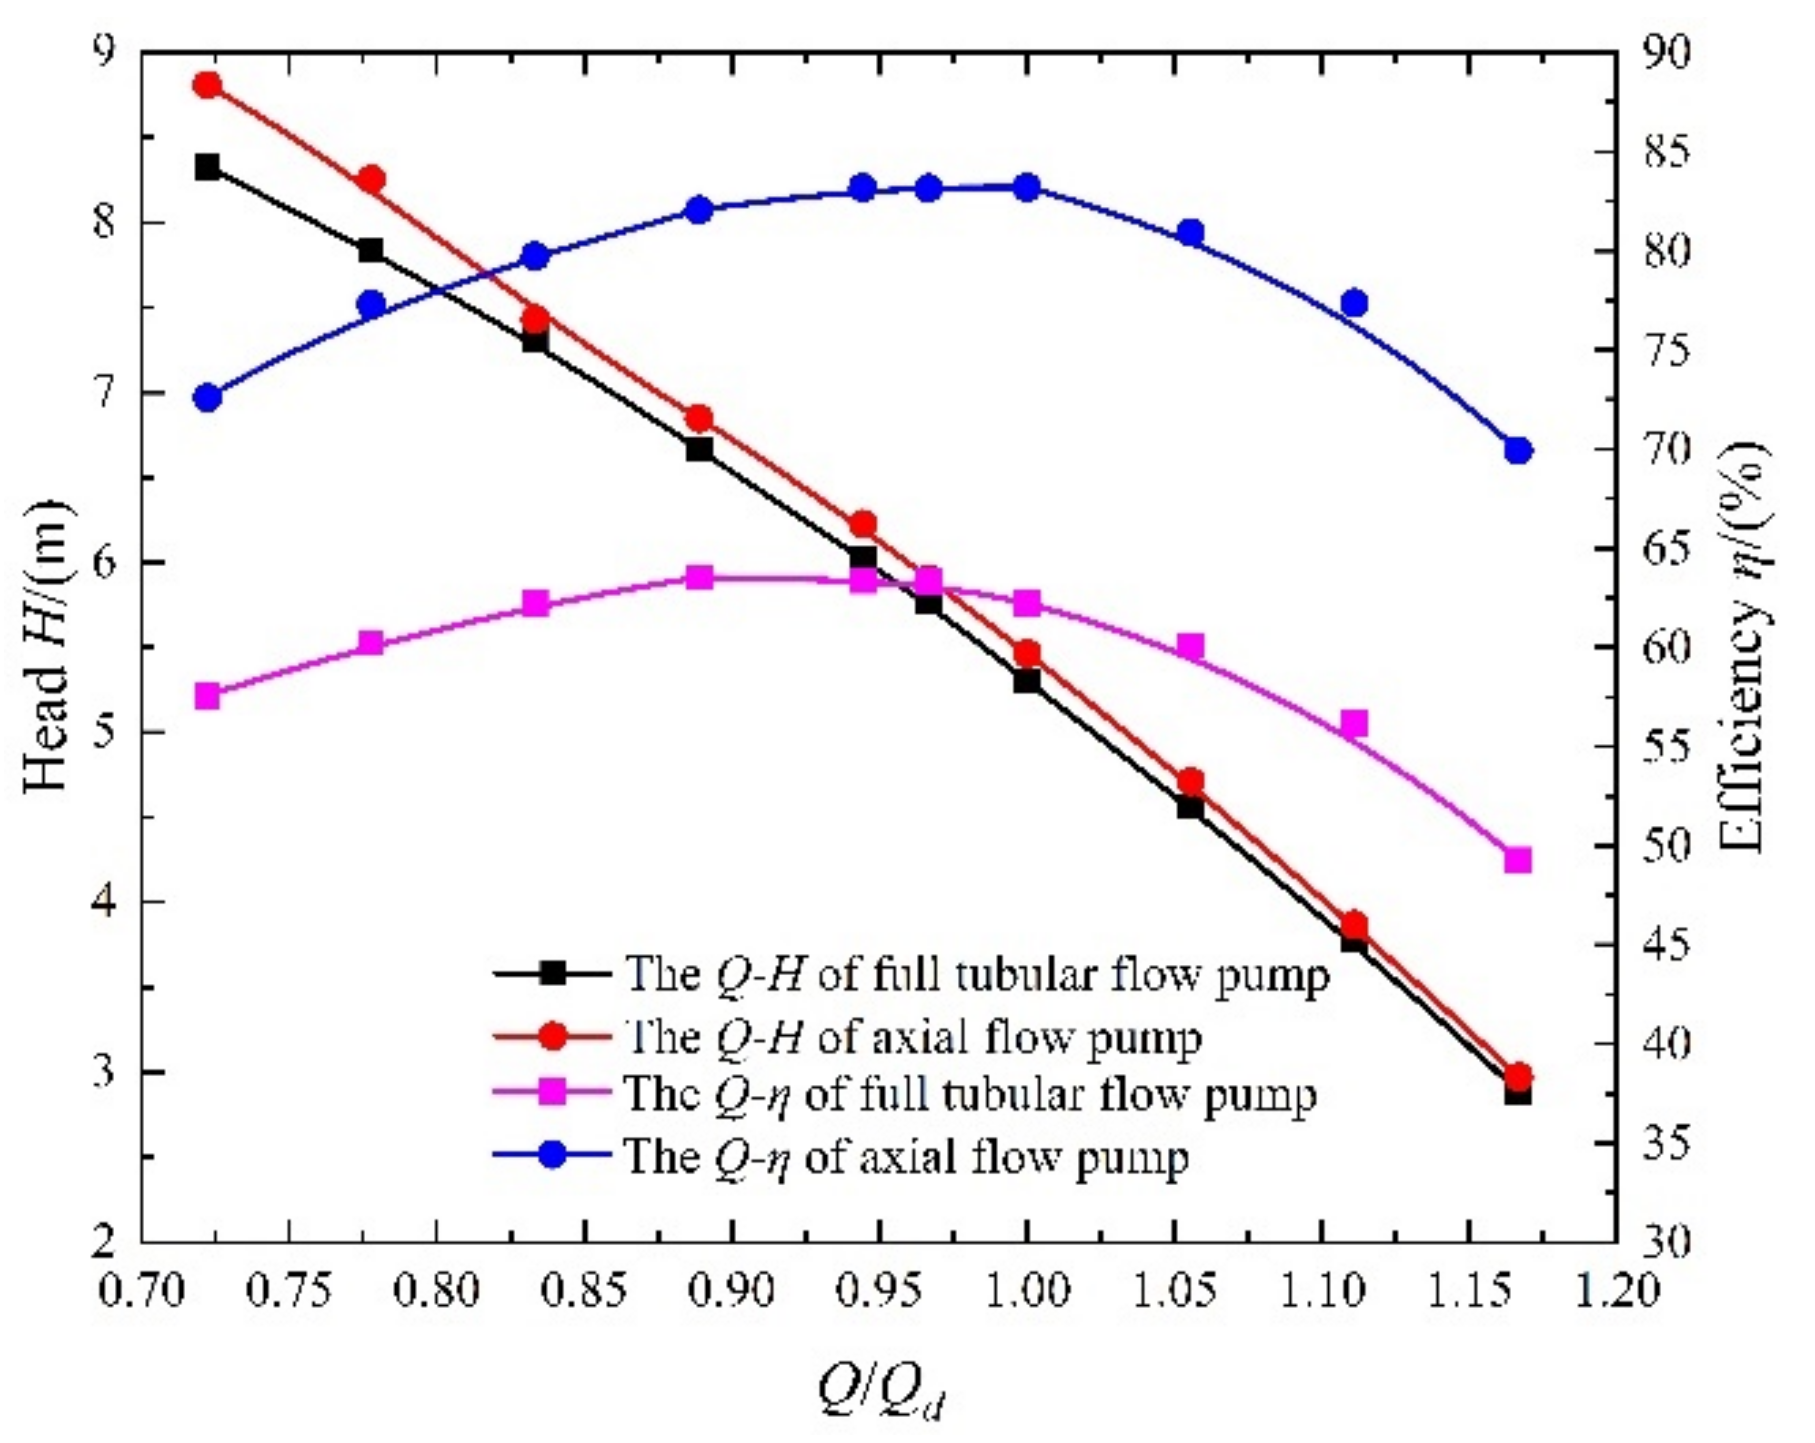
Figure 10.
Schematic diagram of the rotor structure.
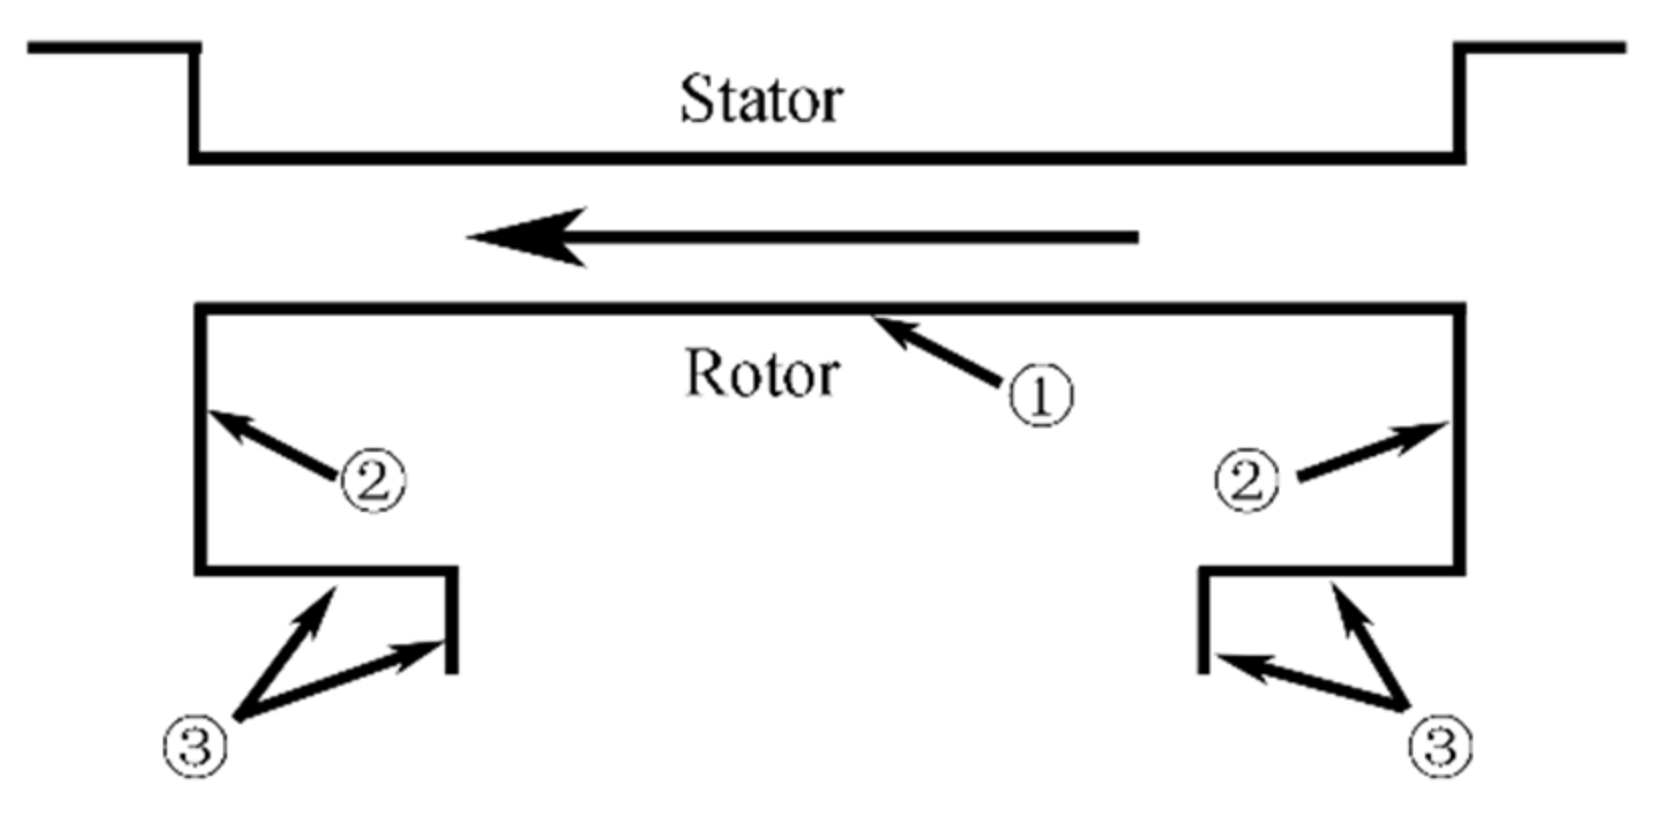
Figure 11.
The torque variation of each part torque.
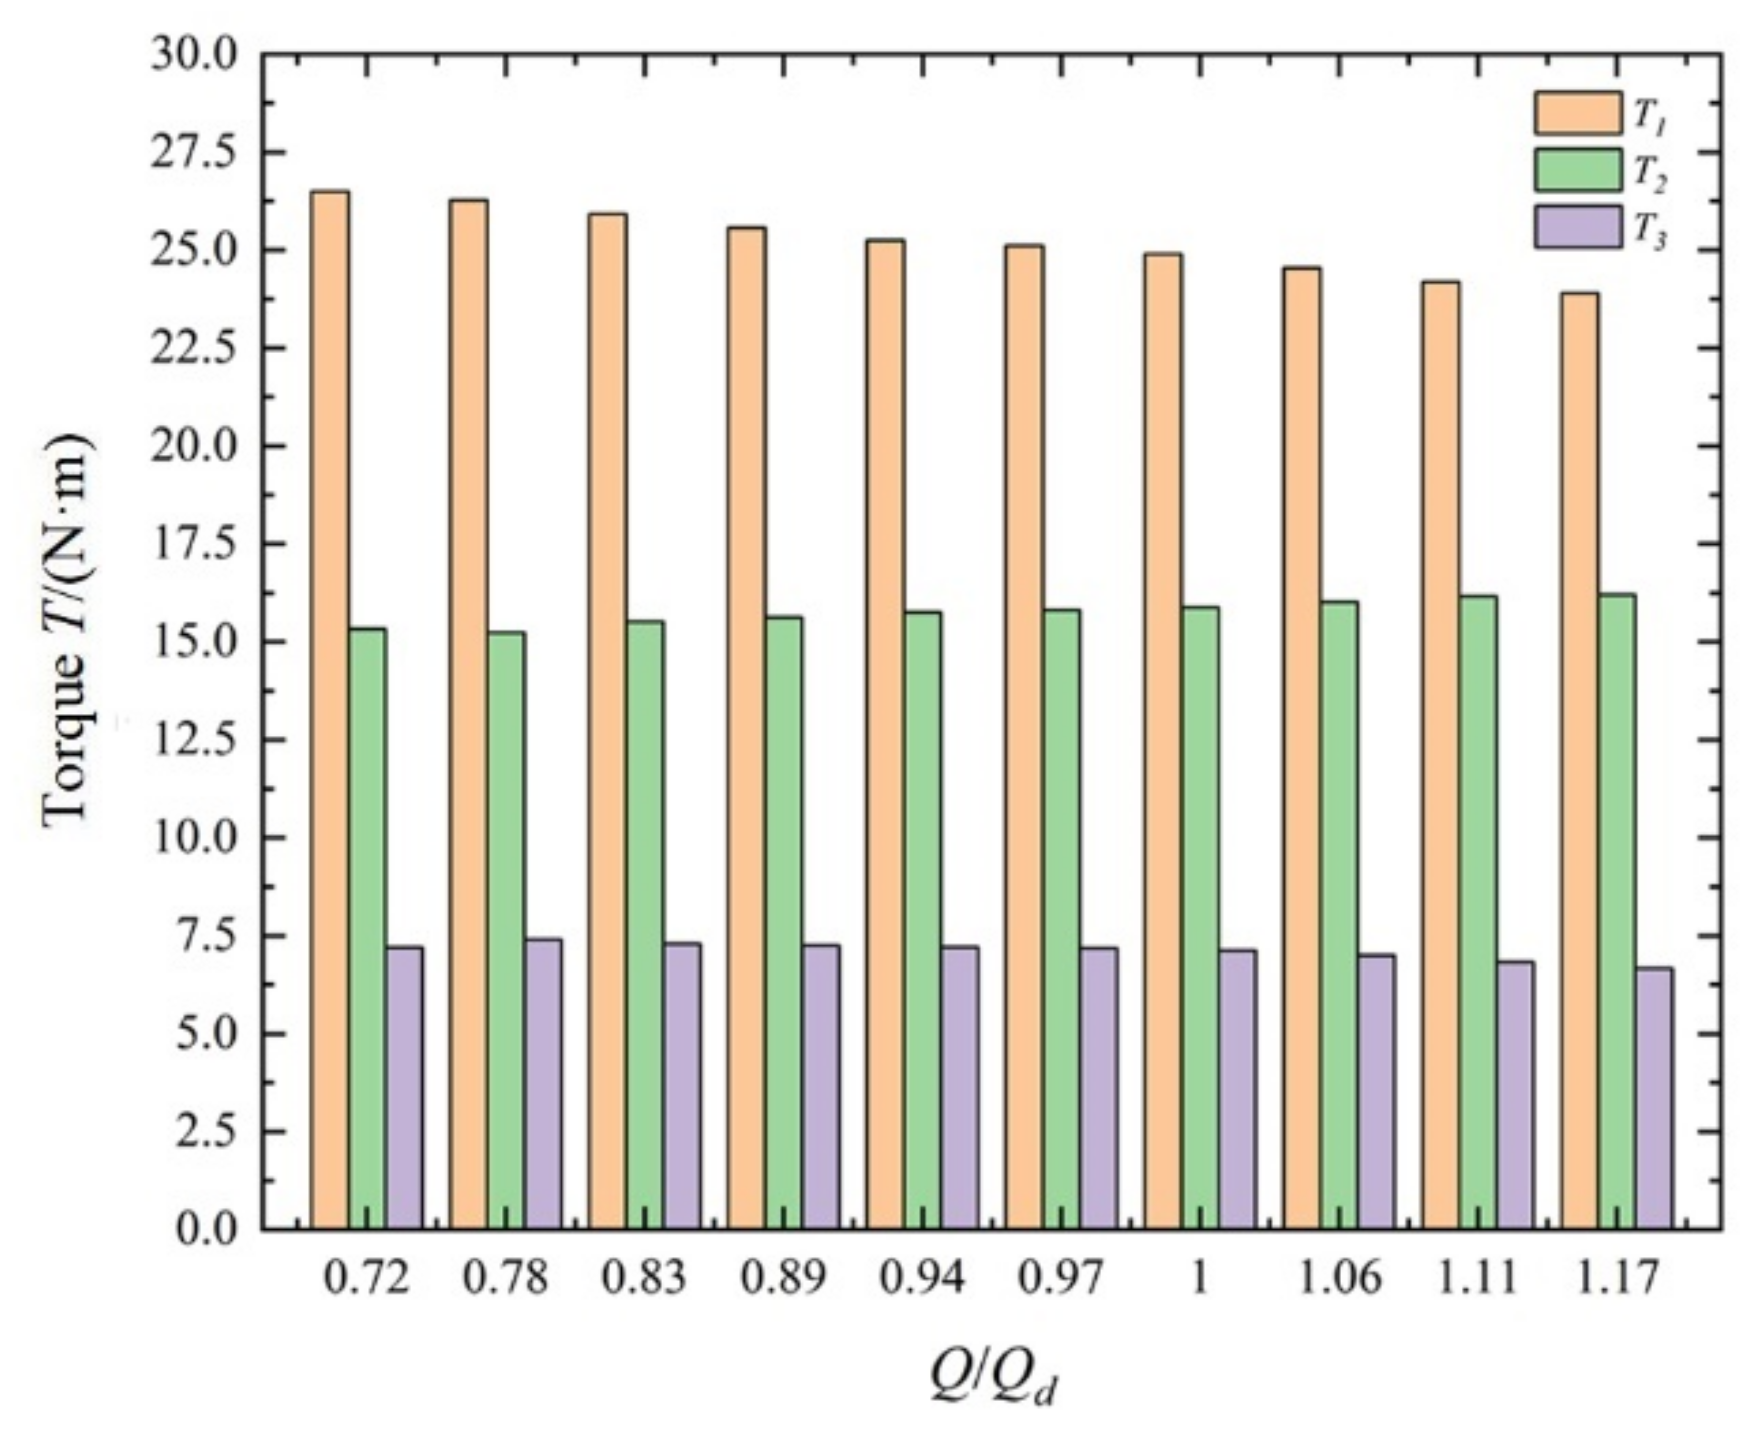
Figure 12.
The cavity flow and rotor torque of the full tubular pump. (a) The cavity flow and rotor torque, (b) The relationship between torque and cavity flow.
Figure 12.
The cavity flow and rotor torque of the full tubular pump. (a) The cavity flow and rotor torque, (b) The relationship between torque and cavity flow.
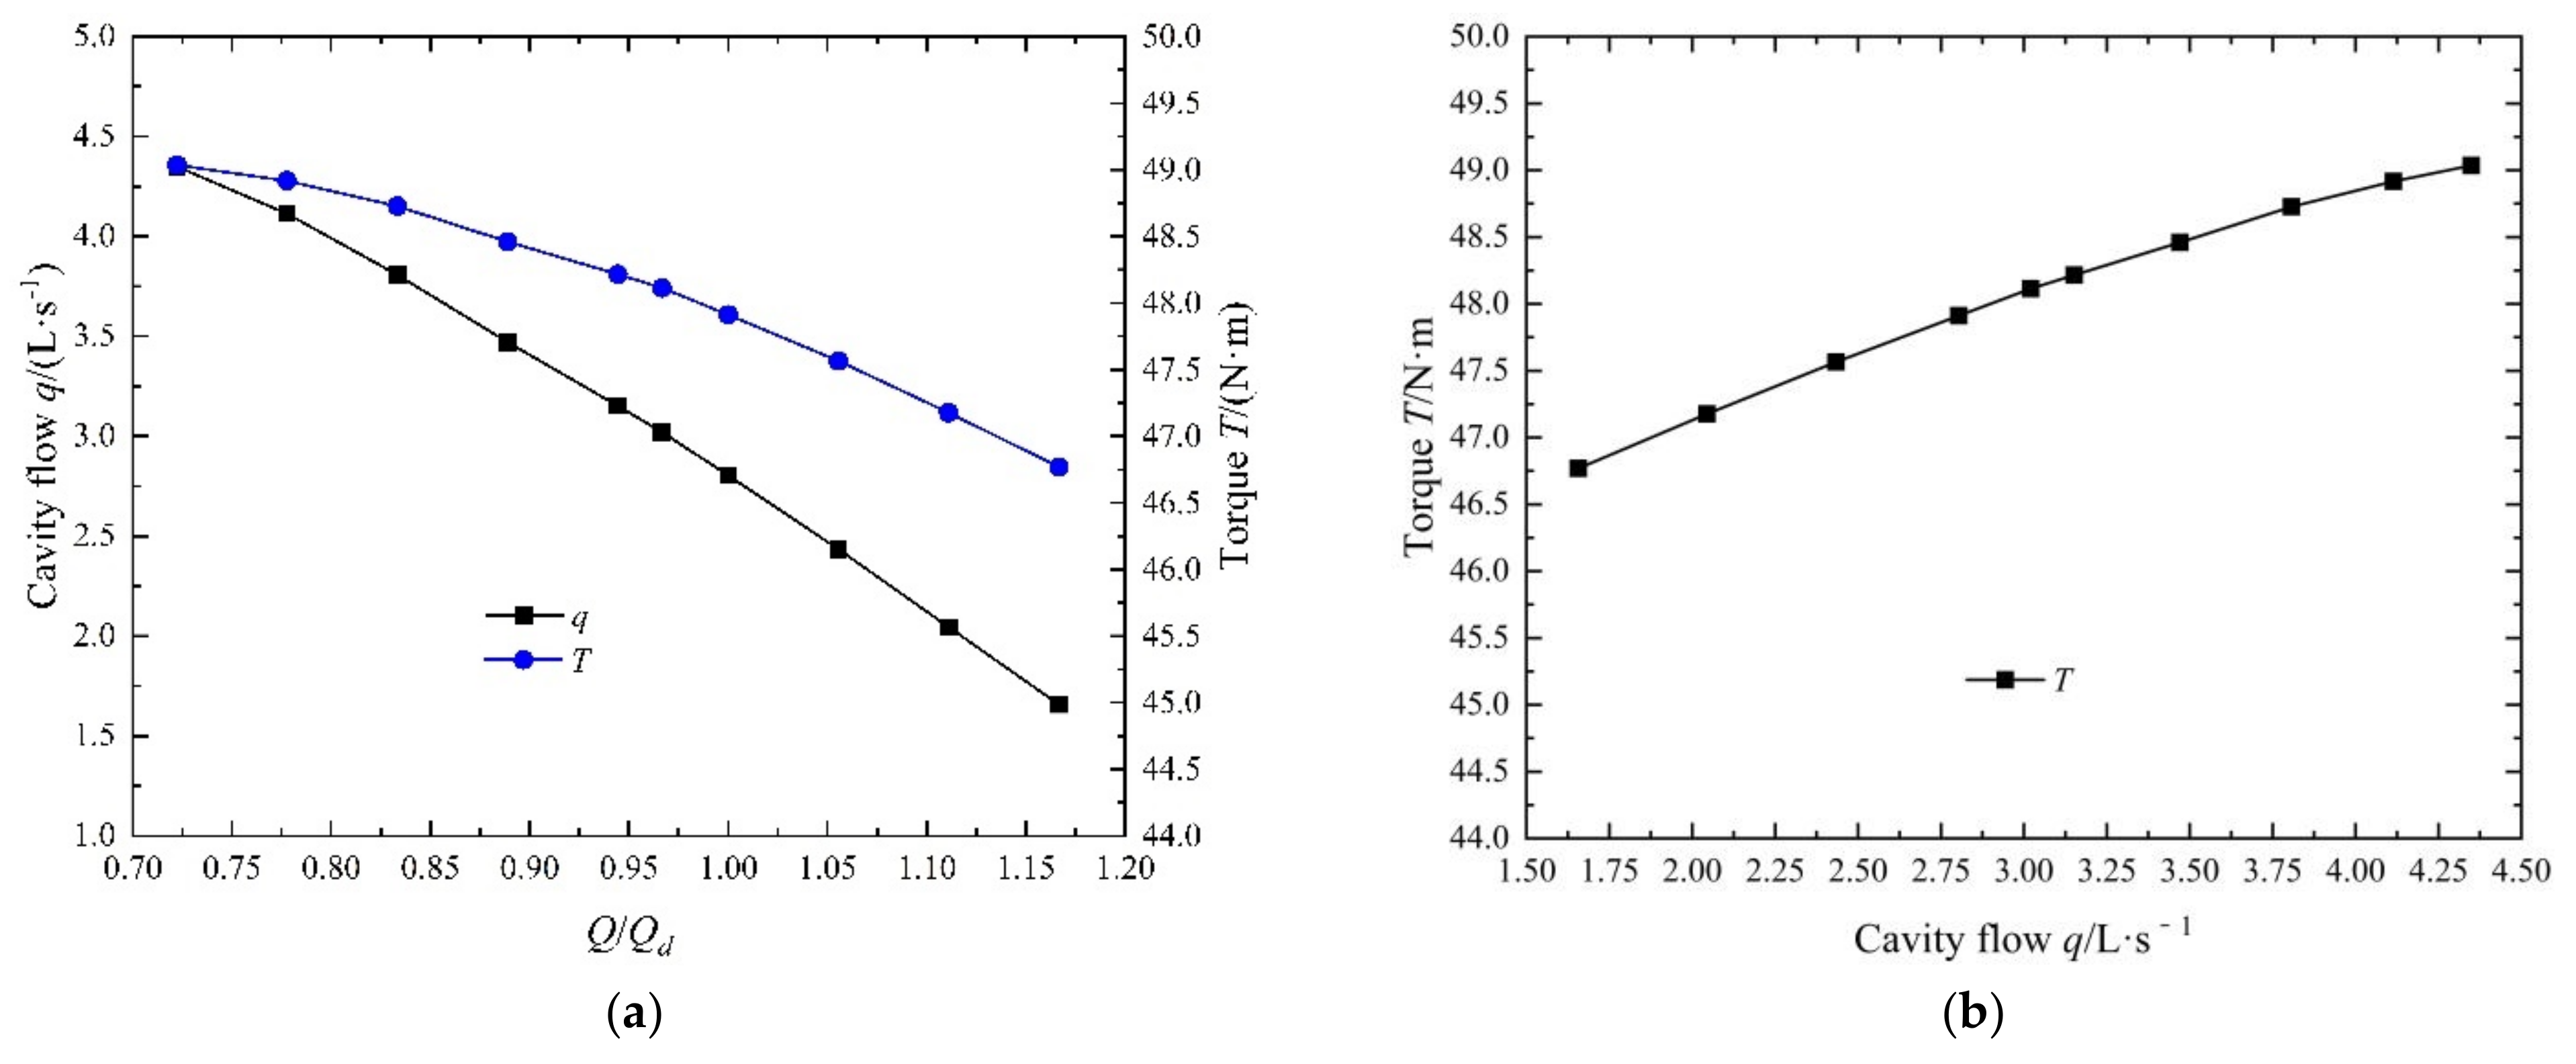
Figure 13.
The clearance flow resistance coefficient.
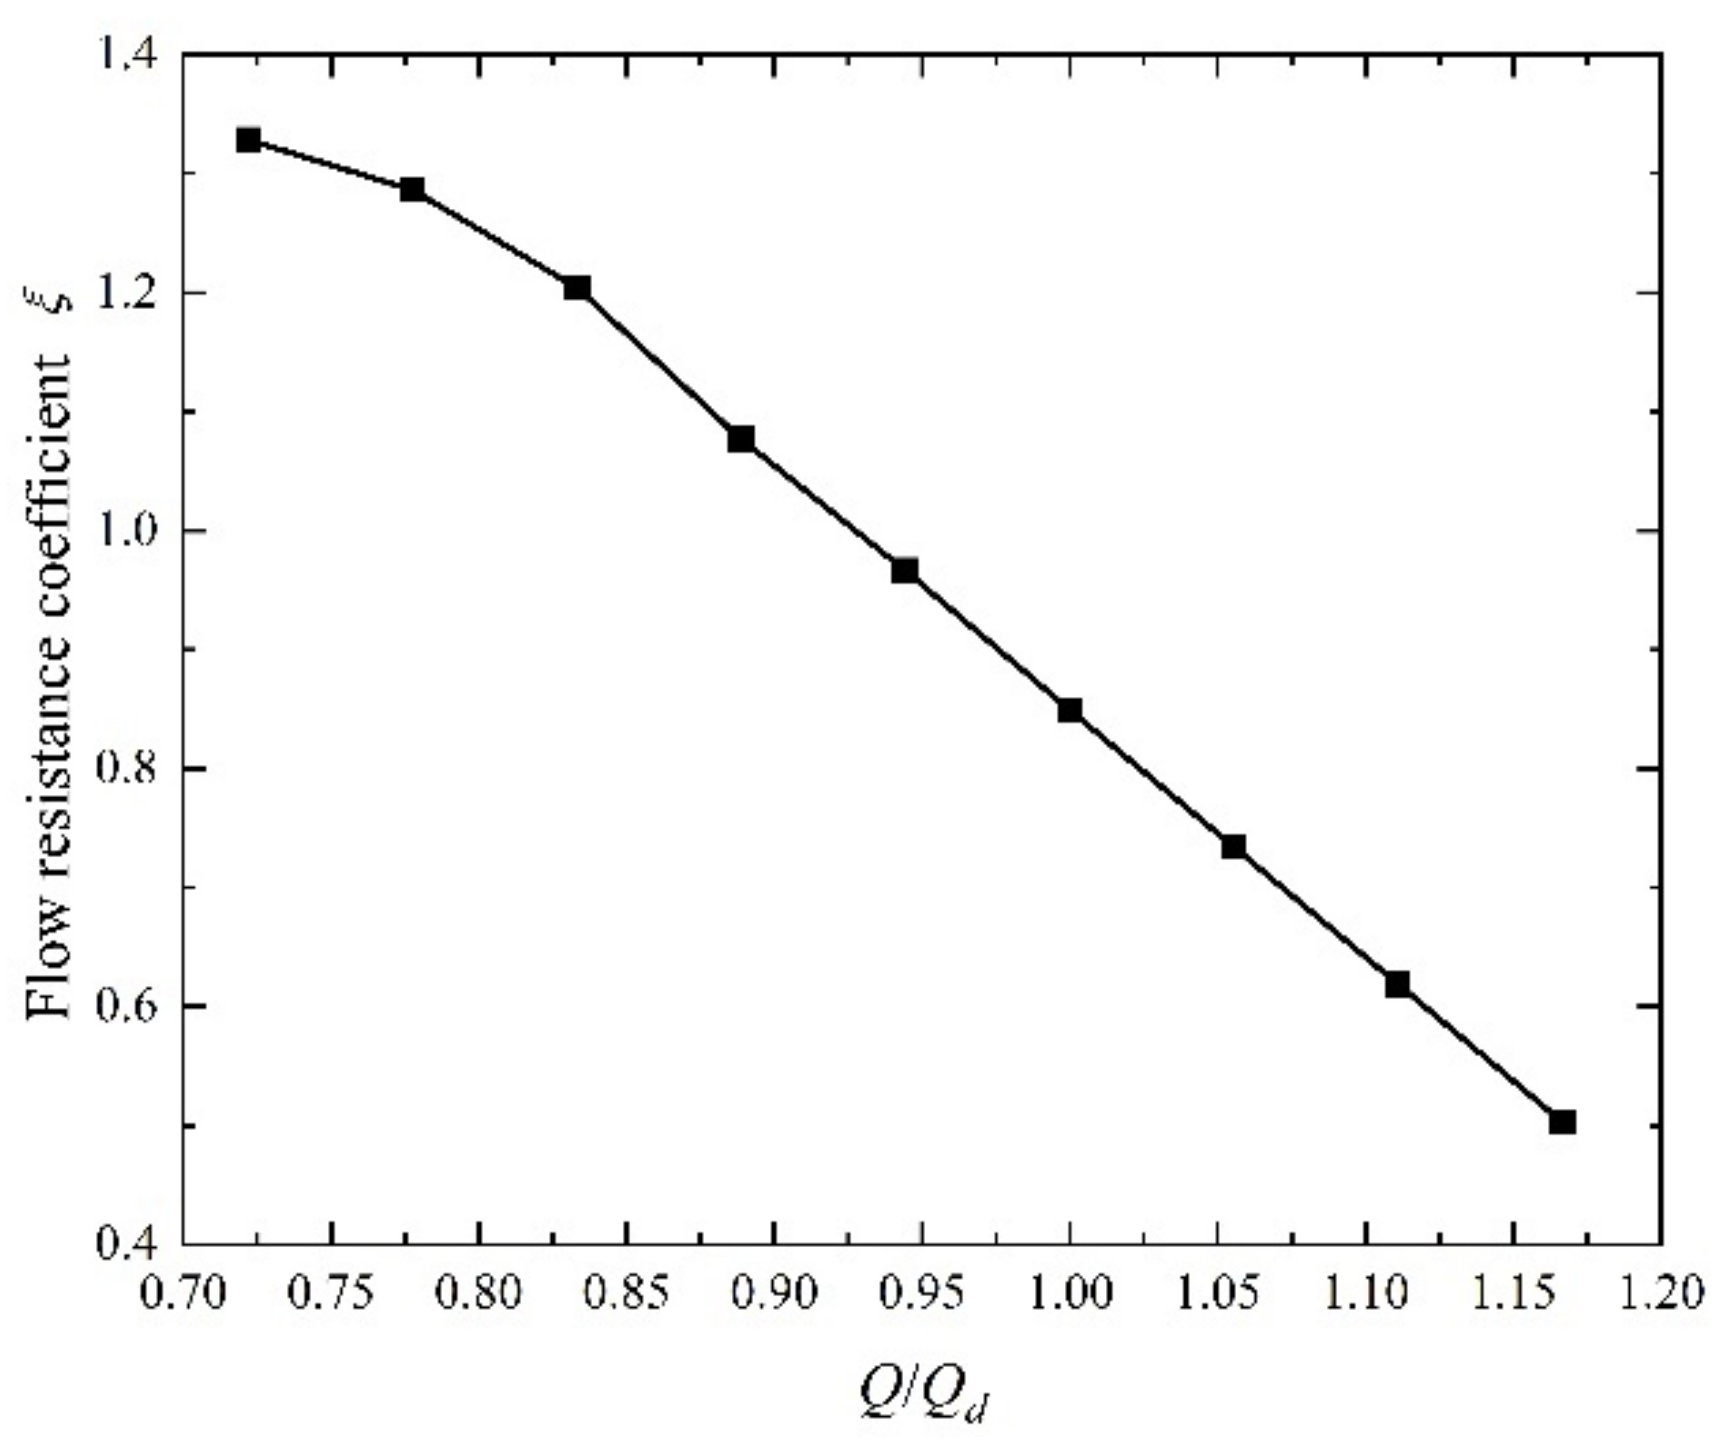
Figure 14.
The sectional velocity streamline of the stator–rotor cavity. (a) 0.78 Qd, (b) Qd, (c) 1.17 Qd.
Figure 14.
The sectional velocity streamline of the stator–rotor cavity. (a) 0.78 Qd, (b) Qd, (c) 1.17 Qd.
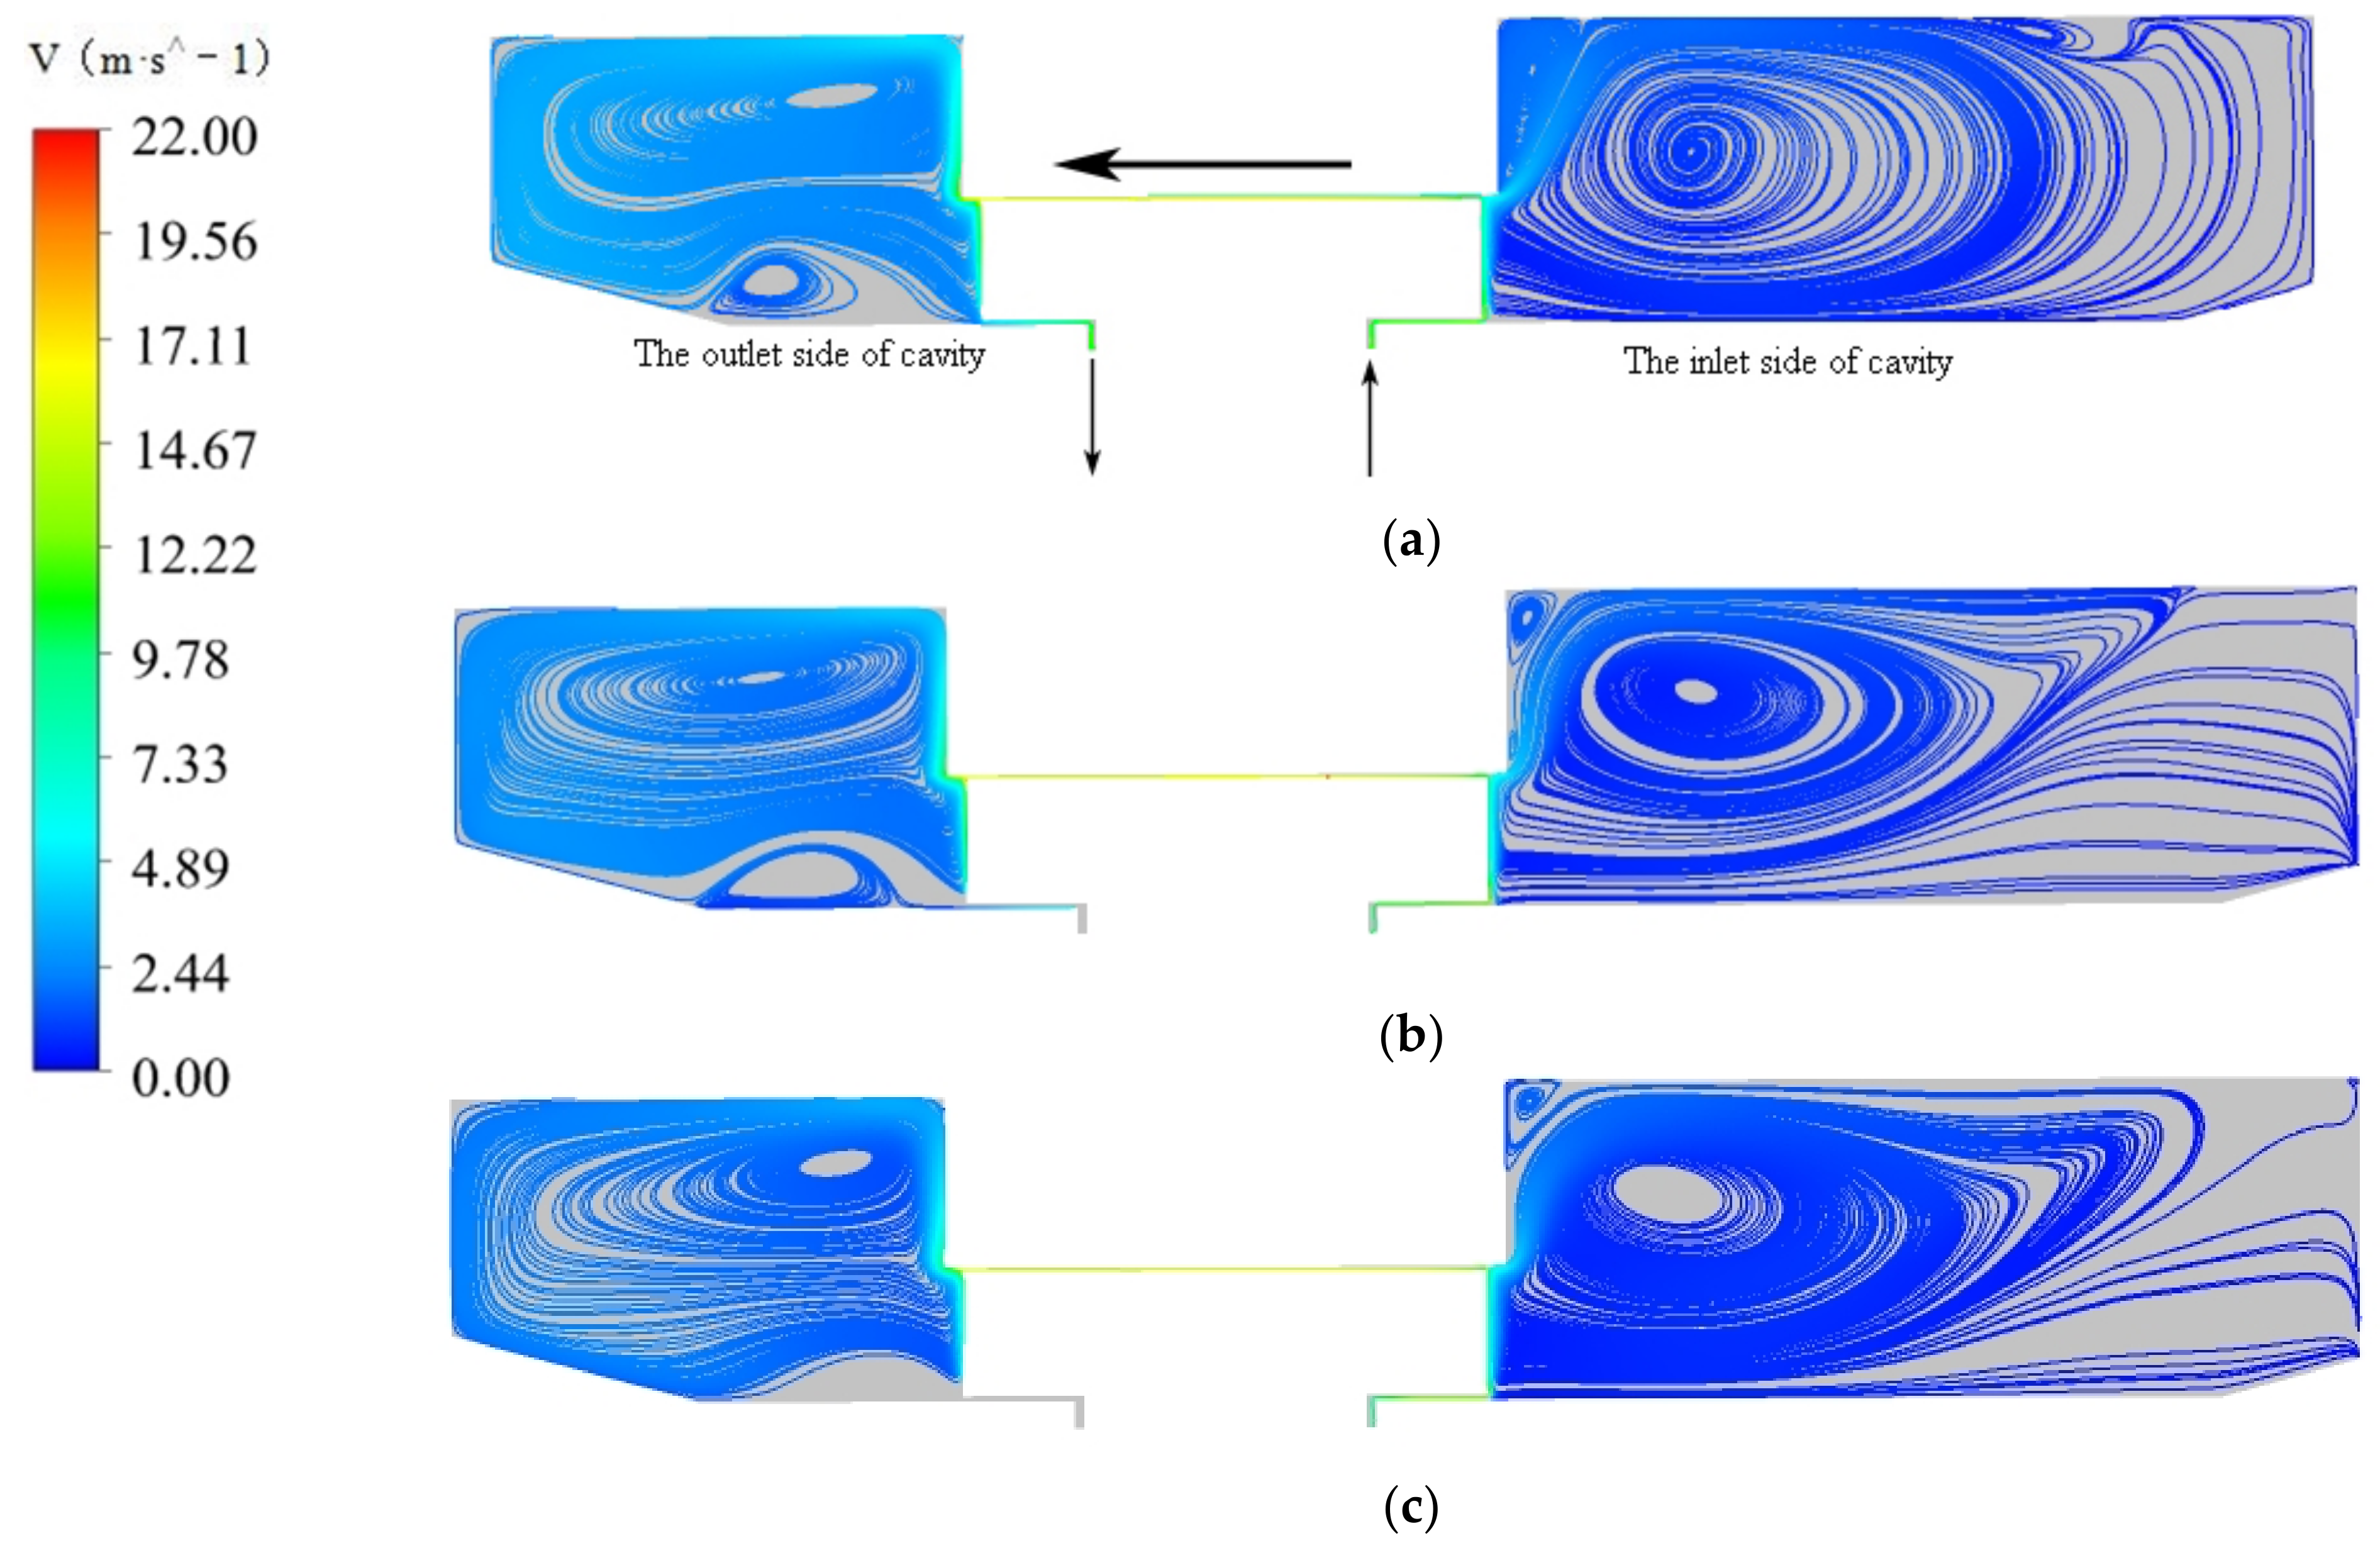
Figure 15.
The different cross-sectional positions.

Figure 16.
The eddy current intensity and streamline distribution of different sections.
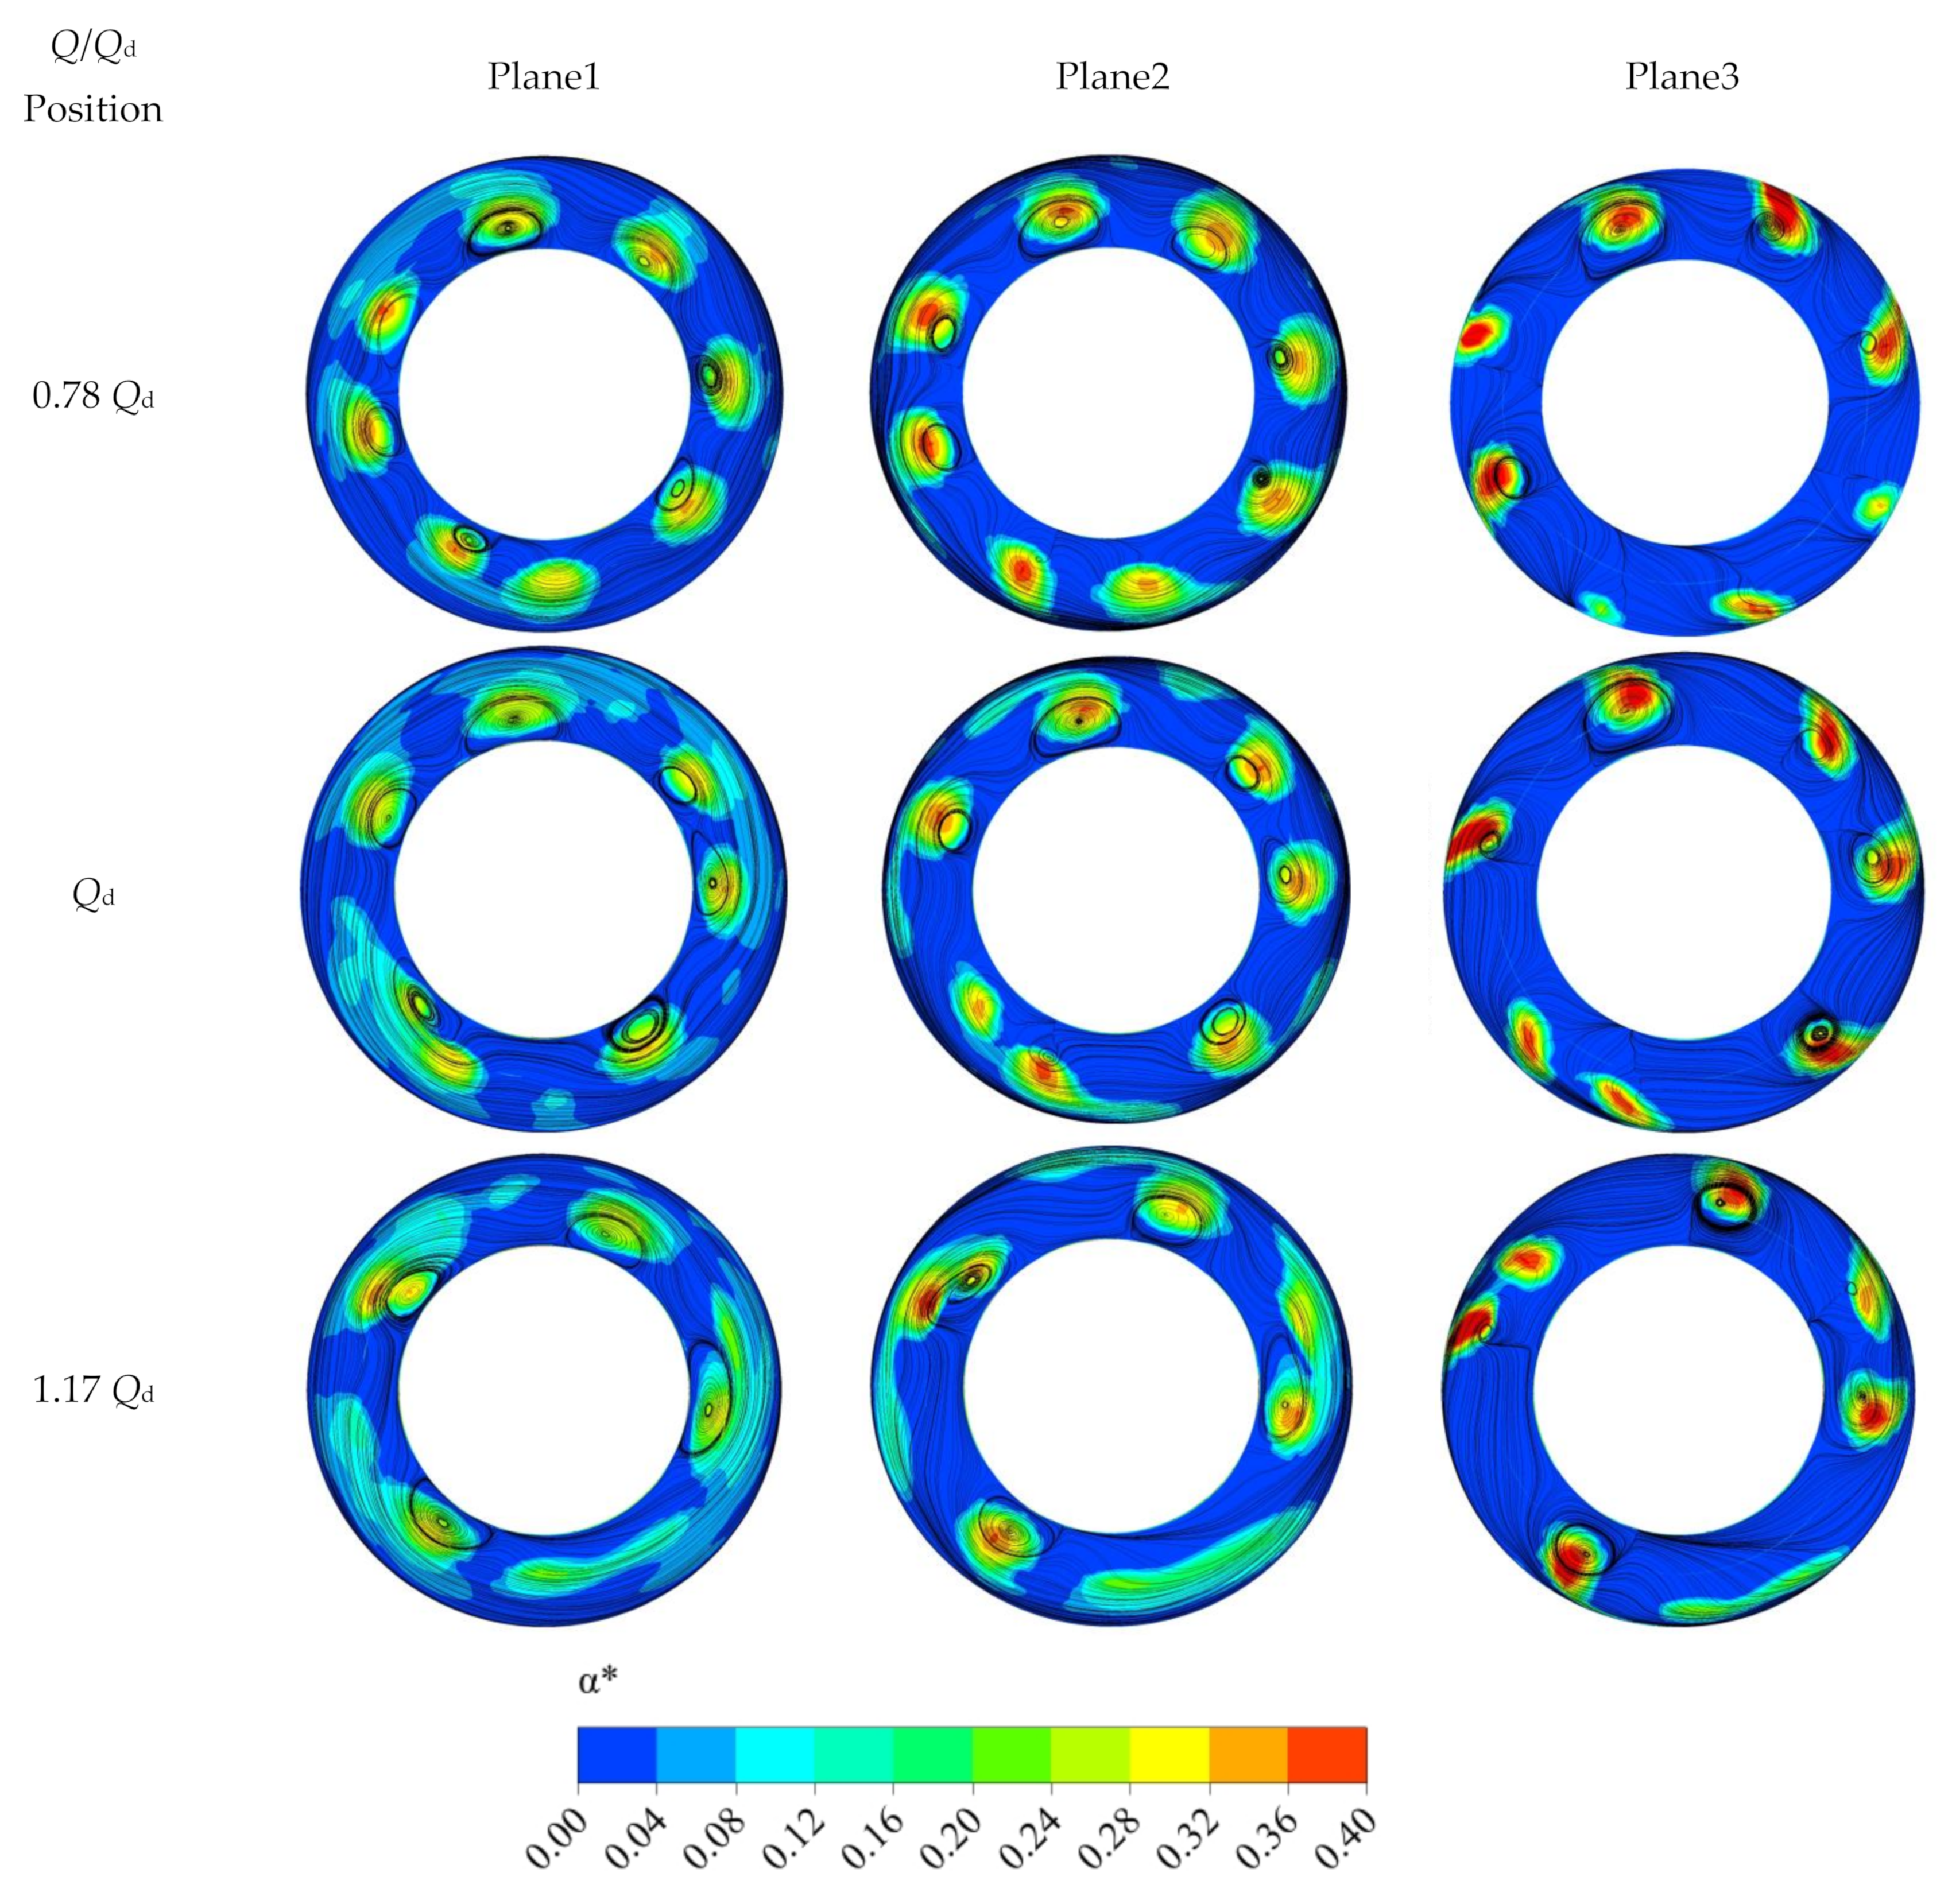
Figure 17.
The cavity rotor structure. (a) Scheme 1, (b) Scheme 2, (c) Scheme 3, (d) Scheme 4, (e) Stator-rotor optimization parameters.
Figure 17.
The cavity rotor structure. (a) Scheme 1, (b) Scheme 2, (c) Scheme 3, (d) Scheme 4, (e) Stator-rotor optimization parameters.

Figure 18.
Torque diagram of different schemes. (a) The torque of each scheme, (b) The ratio of torque to area.
Figure 18.
Torque diagram of different schemes. (a) The torque of each scheme, (b) The ratio of torque to area.
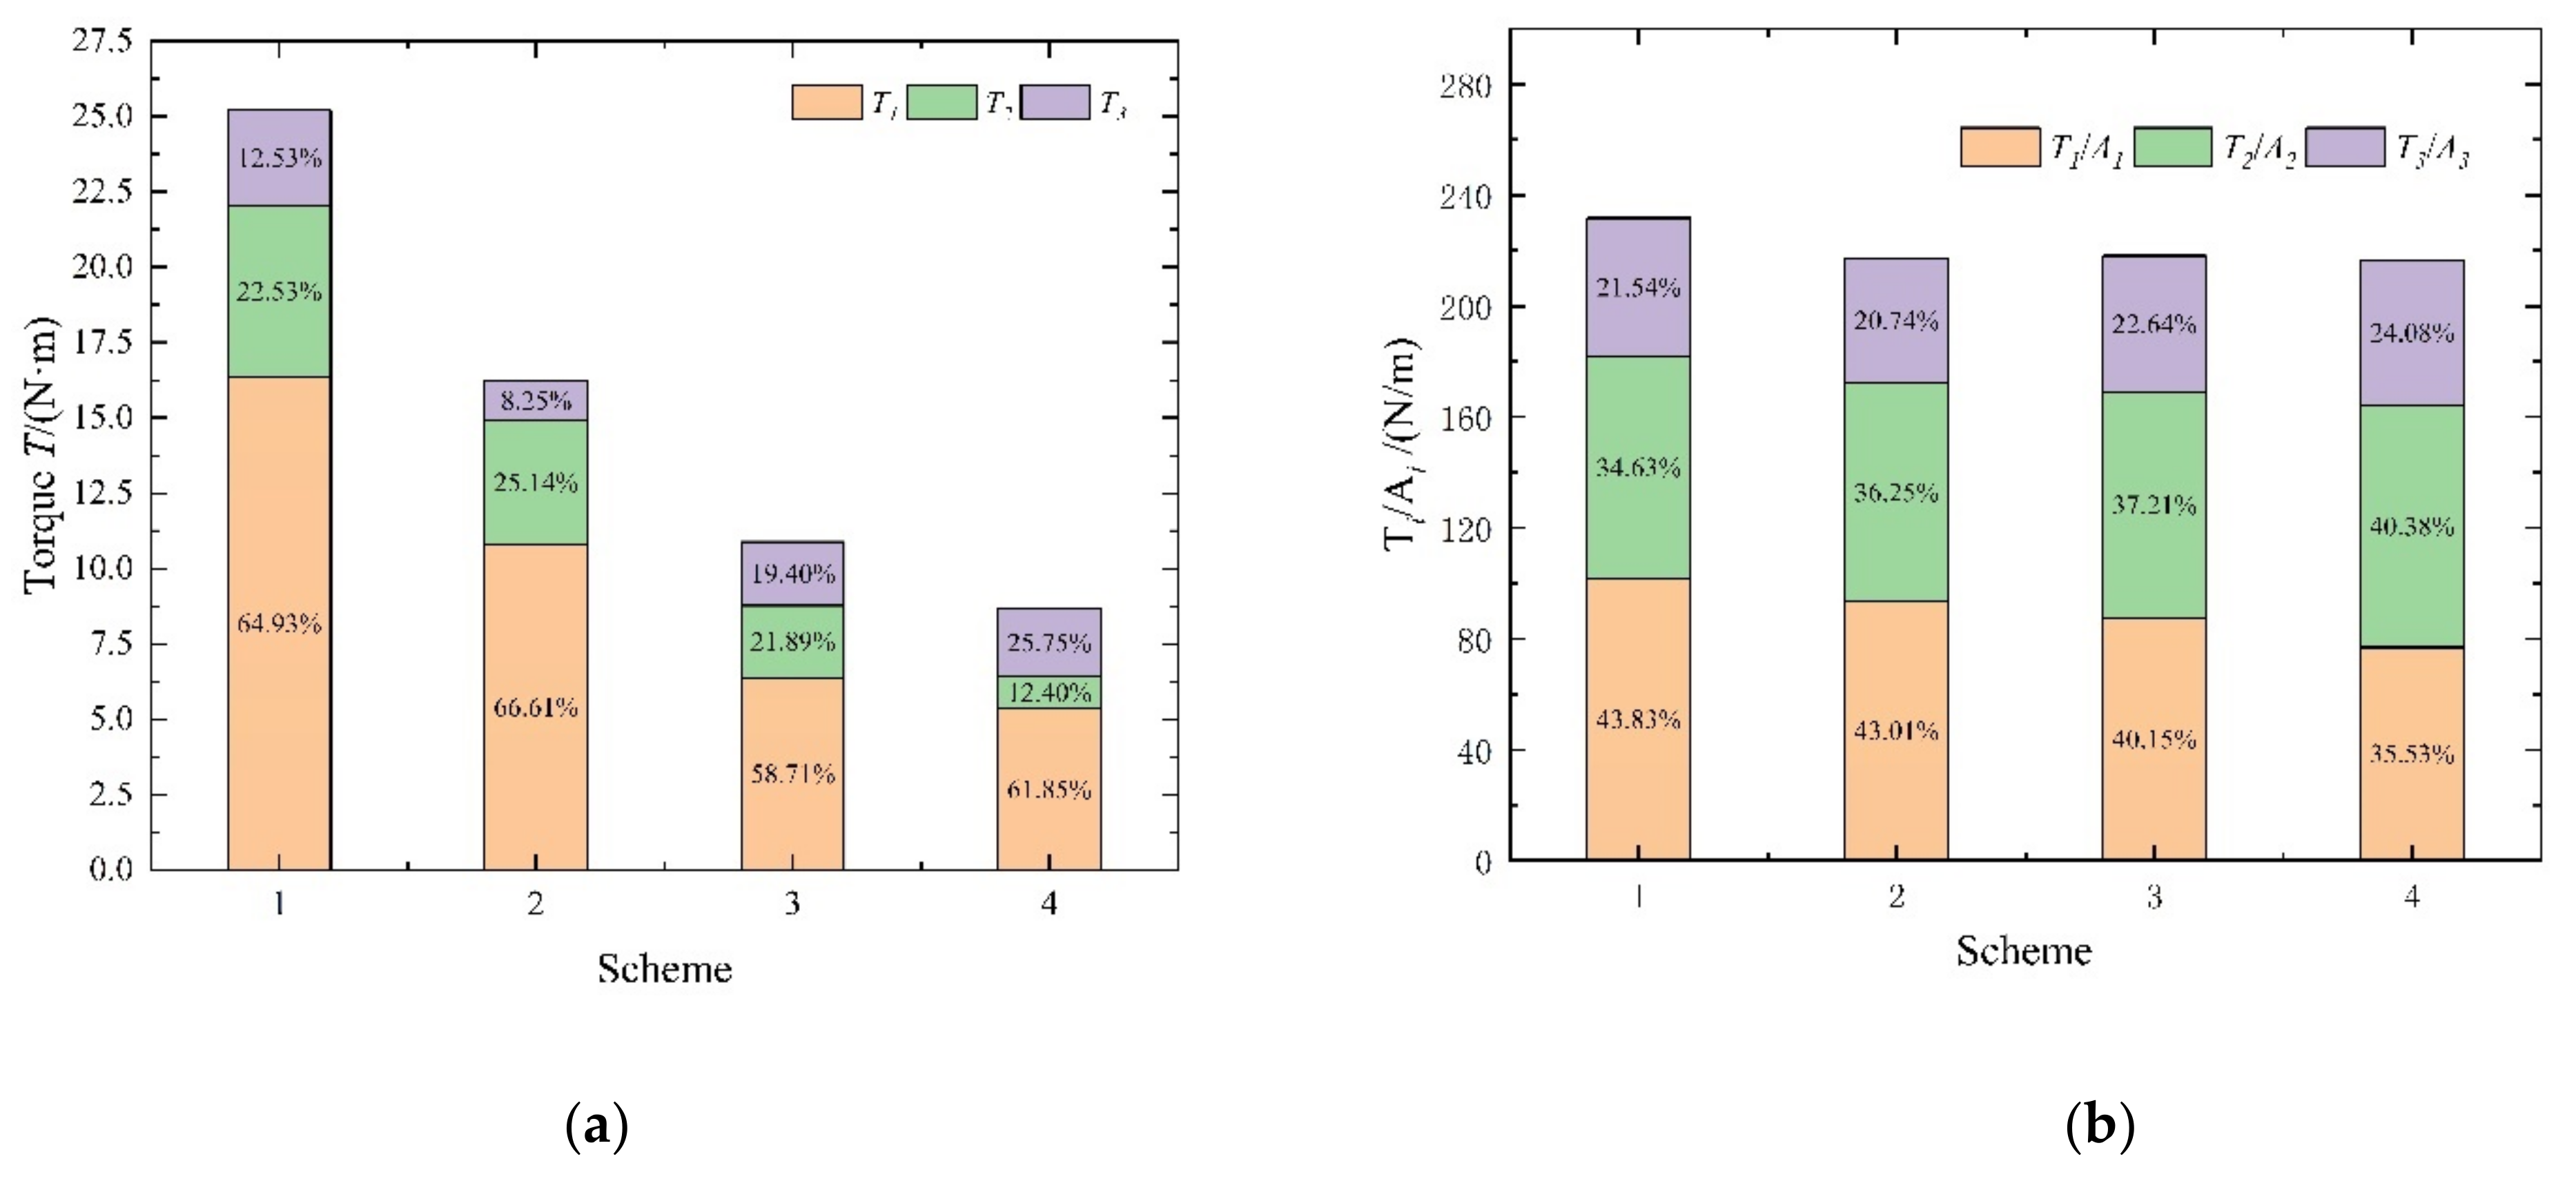
Figure 19.
Flow resistance coefficient and cavity flow of rotor with different schemes. (a) The flow resistance coefficient, (b) The cavity flow.
Figure 19.
Flow resistance coefficient and cavity flow of rotor with different schemes. (a) The flow resistance coefficient, (b) The cavity flow.
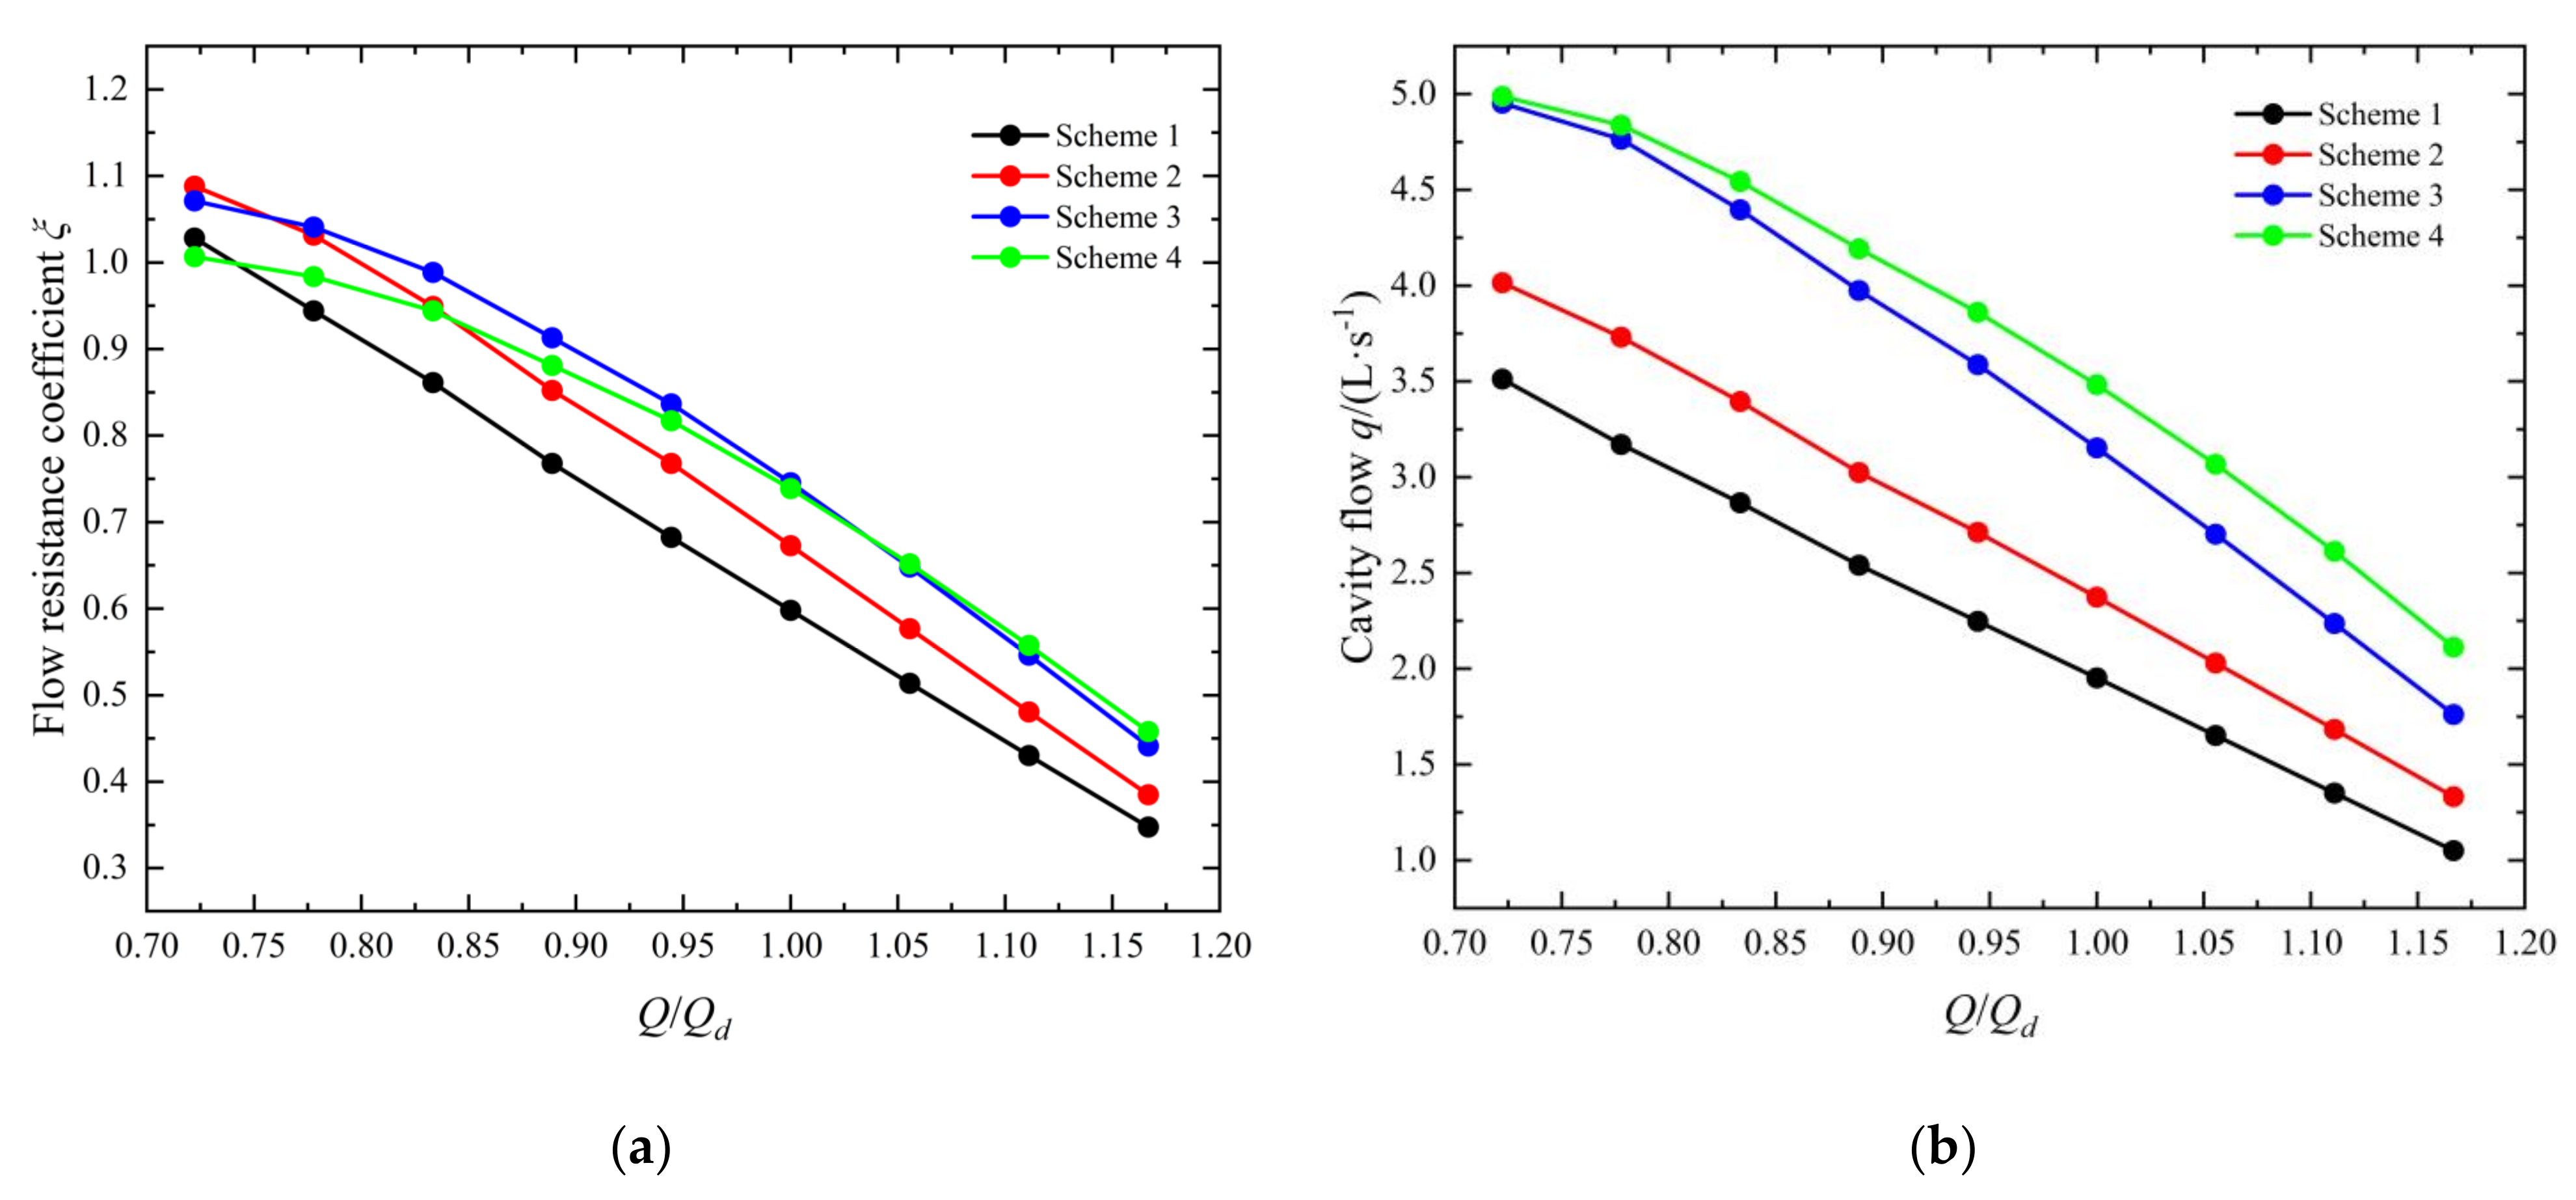
Figure 20.
Model pump device.
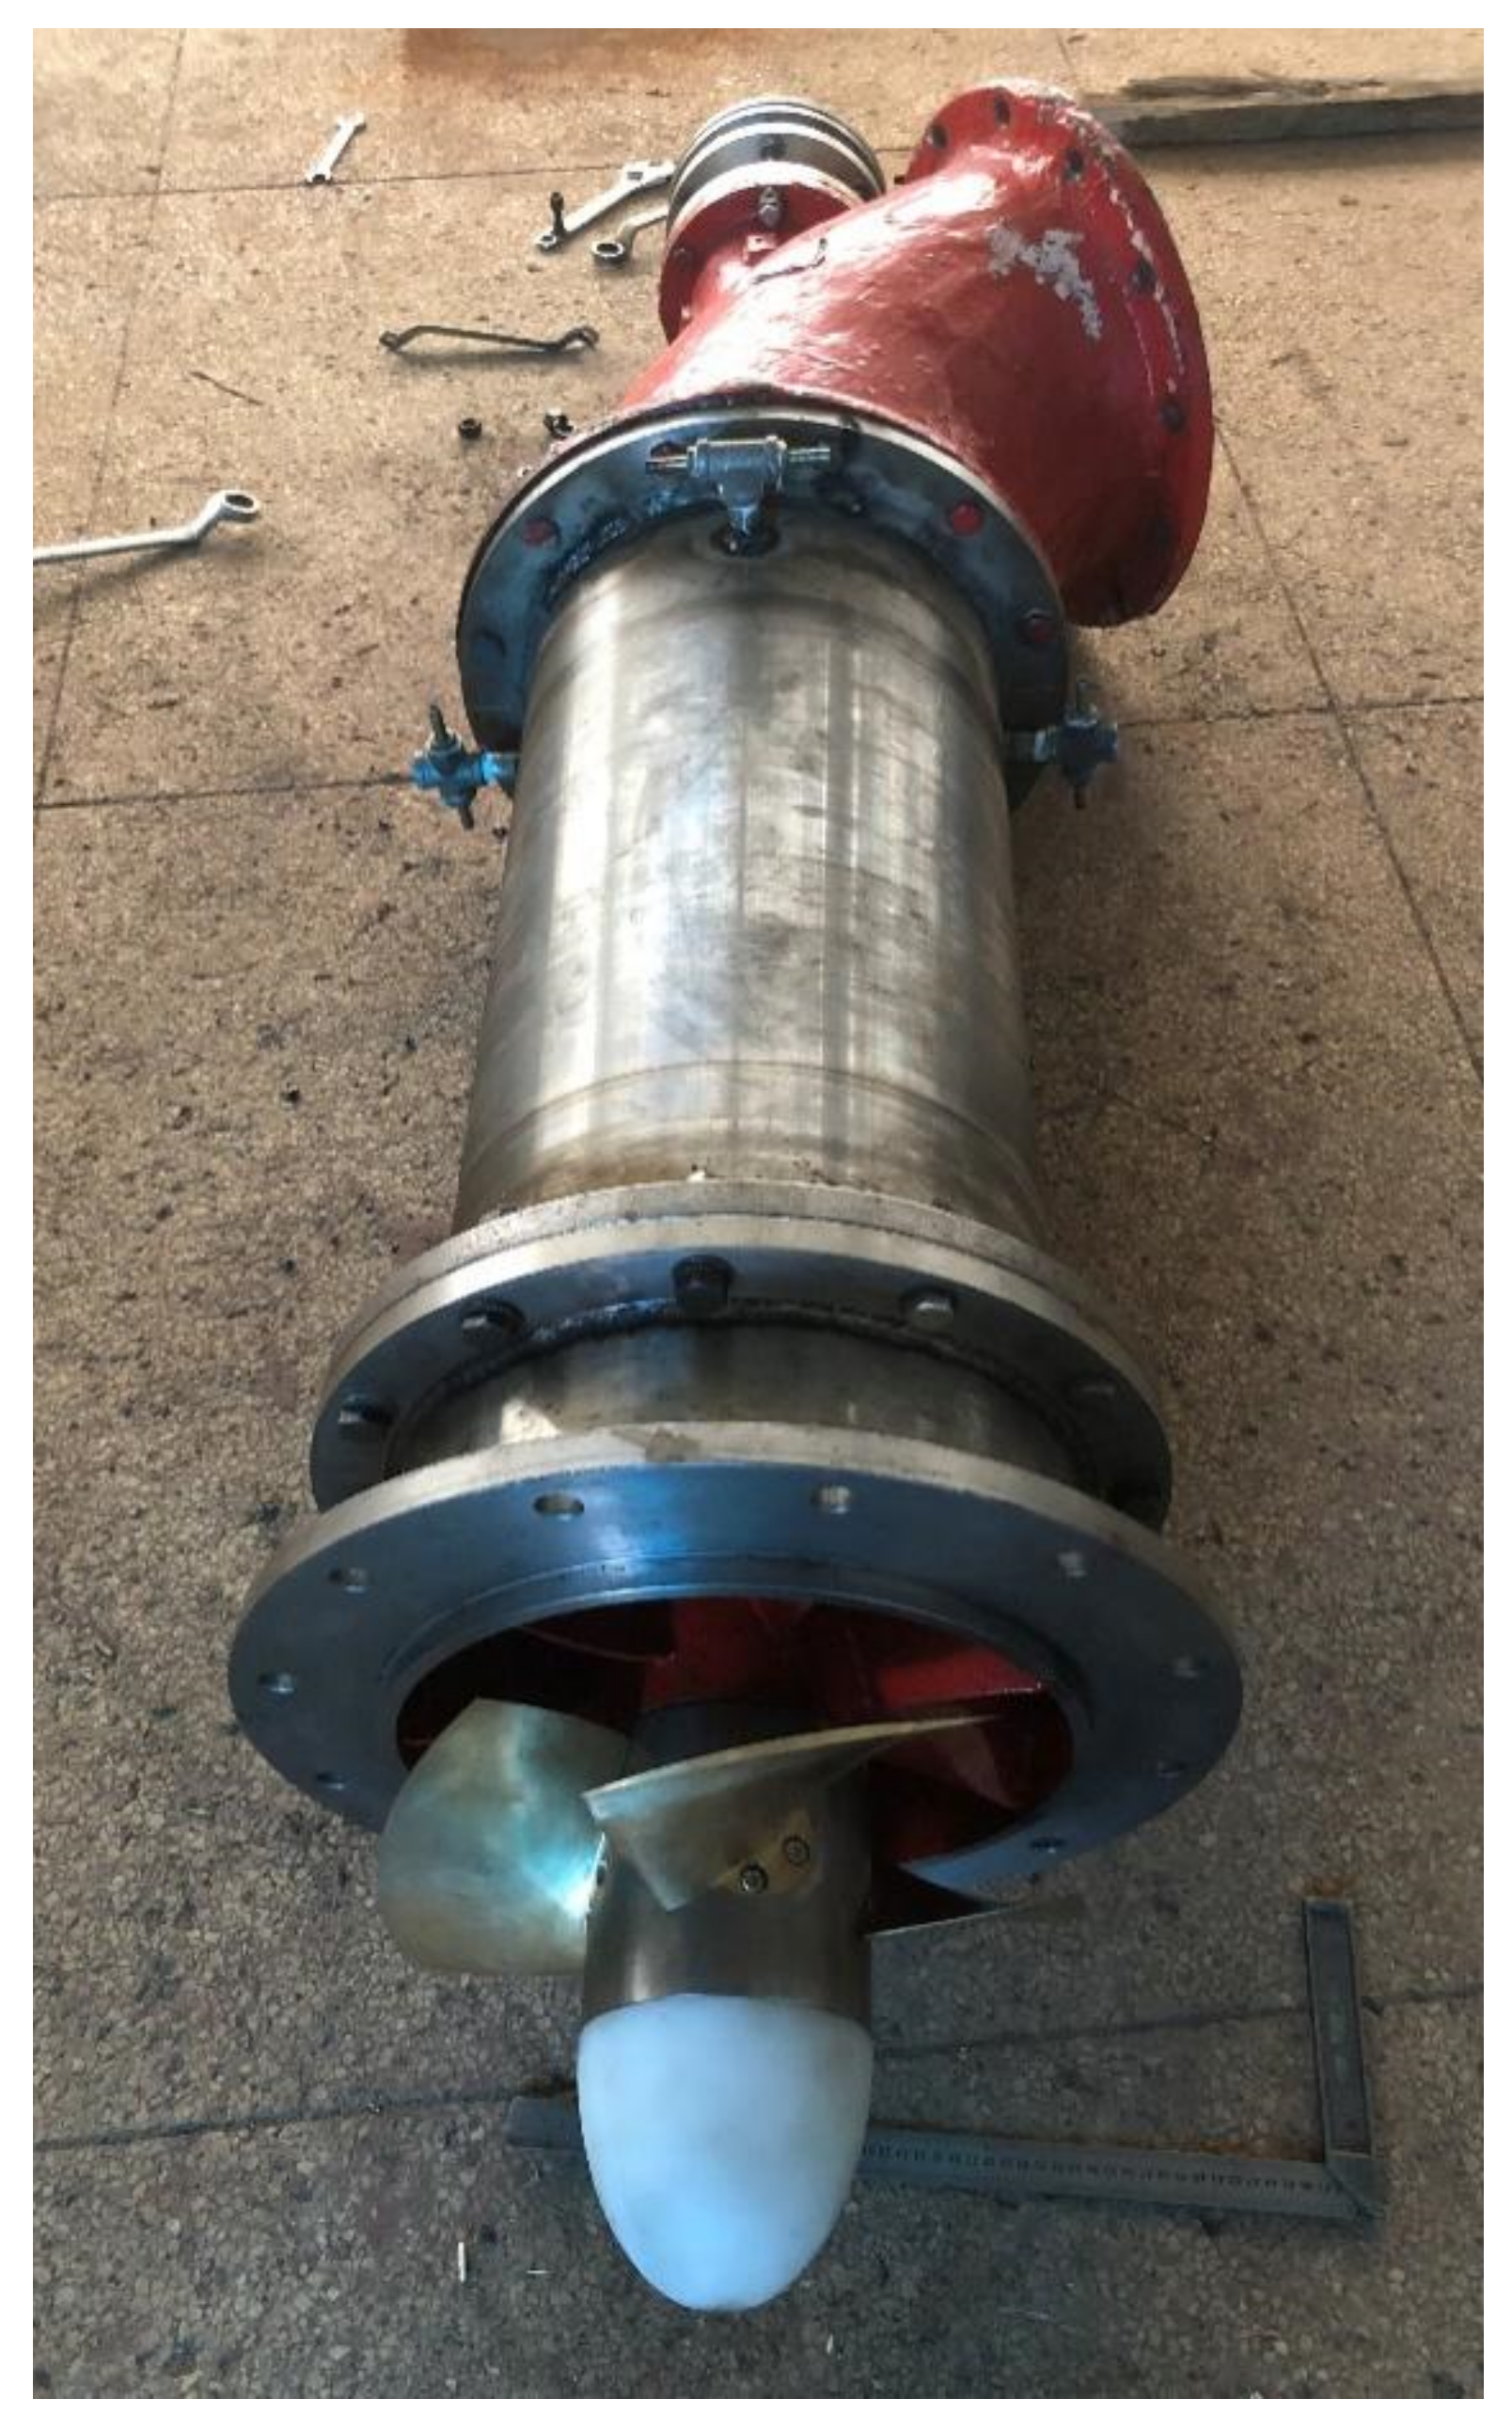
Figure 21.
Performance curve verification.

Table 1.
Average y+ of each part.
| Part | Blade | Hub | Stator | Rotor |
|---|---|---|---|---|
| Average y+ | 31.68 | 19.40 | 10.95 | 14.27 |
Table 2.
Axial and radial forces of rotor and impeller.
| Flow | Axial Force (Fz)/N | Radial Force (F)/N | ||
|---|---|---|---|---|
| Impeller | Rotor | Impeller | Rotor | |
| 0.78 Qd | −4307.68 | −3407.76 | 16.04 | 10.4 |
| Qd | −3128.52 | −2401.68 | 29.10 | 9.75 |
| 1.17 Qd | −2079.46 | −1442.06 | 42.80 | 10.18 |
Table 3.
The summary of prediction results.
| Rotor Area (A) | Length (L) | Outer Diameter (Dz) | Head (H)/m | Efficiency (η)/% | Leakage Flow (q)/L s−1 | |
|---|---|---|---|---|---|---|
| Scheme 1 | 0.75 A | 0.8 L | 0.96 Dz | 5.35 | 70.73 | 1.95 |
| Scheme 2 | 0.5 A | 0.6 L | 0.92 Dz | 5.32 | 74.37 | 2.37 |
| Scheme 3 | 0.37 A | 0.4 L | 0.87 Dz | 5.26 | 76.46 | 3.15 |
| Scheme 4 | 0.32 A | 0.4 L | 0.83 Dz | 5.24 | 77.39 | 3.48 |
A is the rotor area, L is the length of the cavity clearance, and Dz is the outer diameter of the rotor.
Publisher’s Note: MDPI stays neutral with regard to jurisdictional claims in published maps and institutional affiliations. |
© 2022 by the authors. Licensee MDPI, Basel, Switzerland. This article is an open access article distributed under the terms and conditions of the Creative Commons Attribution (CC BY) license (https://creativecommons.org/licenses/by/4.0/).
Share and Cite
MDPI and ACS Style
Shi, L.; Zhu, J.; Li, J.; Tang, F.; Chen, B.; Jiang, Y.; Xu, T.; Chai, Y. Flow Characteristics and Optimization Design of the Stator–Rotor Cavity of the Full Tubular Pump. Processes 2022, 10, 1688. https://doi.org/10.3390/pr10091688
AMA Style
Shi L, Zhu J, Li J, Tang F, Chen B, Jiang Y, Xu T, Chai Y. Flow Characteristics and Optimization Design of the Stator–Rotor Cavity of the Full Tubular Pump. Processes. 2022; 10(9):1688. https://doi.org/10.3390/pr10091688
Chicago/Turabian StyleShi, Lijian, Jun Zhu, Jindong Li, Fangping Tang, Beishuai Chen, Yuhang Jiang, Tian Xu, and Yao Chai. 2022. "Flow Characteristics and Optimization Design of the Stator–Rotor Cavity of the Full Tubular Pump" Processes 10, no. 9: 1688. https://doi.org/10.3390/pr10091688
Note that from the first issue of 2016, this journal uses article numbers instead of page numbers. See further details here.