Communication

Impact of Hydrogen Liquefaction on Hydrogen Fuel Quality for Transport Applications (ISO-14687:2019)

1
National Physical Laboratory, Teddington, London TW11 0LW, UK
2
Air Liquide Innovation Campus Paris, 78350 Paris, France
*
Authors to whom correspondence should be addressed.
Processes 2022, 10(9), 1697; https://doi.org/10.3390/pr10091697
Submission received: 23 June 2022 / Revised: 22 August 2022 / Accepted: 23 August 2022 / Published: 26 August 2022
(This article belongs to the Section Energy Systems)

Abstract

:
Decarbonisation of the energy sector is becoming increasingly more important to the reduction in climate change. Renewable energy is an effective means of reducing CO2 emissions, but the fluctuation in demand and production of energy is a limiting factor. Liquid hydrogen allows for long-term storage of energy. Hydrogen quality is important for the safety and efficiency of the end user. Furthermore, the quality of the hydrogen gas after liquefaction has not yet been reported. The purity of hydrogen after liquefaction was assessed against the specification of Hydrogen grade D in the ISO-14687:2019 by analysing samples taken at different locations throughout production. Sampling was carried out directly in gas cylinders, and purity was assessed using multiple analytical methods. The results indicate that the hydrogen gas produced from liquefaction is of a higher purity than the starting gas, with all impurities below the threshold values set in ISO-14687:2019. The amount fraction of water measured in the hydrogen sample increased with repeated sampling from the liquid hydrogen tank, suggesting that the sampling system used was affected by low temperatures (−253 °C). These data demonstrate for the first time the impact of liquefaction on hydrogen purity assessed against ISO-14687:2019, showing that liquified hydrogen is a viable option for long-term energy storage whilst also improving quality.

1. Introduction

Climate change is one of the largest global issues faced to date, linked to the increasing concentrations of atmospheric greenhouse gases emitted by human activities. An estimated 33 Gt-CO2 was released into the atmosphere in 2019 by the energy-related sector, contributing to approximately 87% of total global emissions [1,2]. Many countries vowed to tackle CO2 emissions and signed the Paris agreement in 2015. Further commitments were made at COP26 in 2021 [3,4]. One way of tackling emissions is by decarbonising the energy sector using alternative energy sources and fuels (e.g., nuclear power, renewables and hydrogen). A particular issue faced in the energy sector is the storage of energy when production outweighs demand and how to address the energy fluctuation attributed to using renewable sources such as wind and solar [5]. The storage of energy in conventional batteries is an obvious solution and can be efficient in the short term. Due to self-discharge and the degradation of batteries, they are less efficient for long-term energy storage [6].
An interesting alternative is using hydrogen as energy storage, where excess energy is used for hydrogen production (e.g., electrolysis) and the resulting gas is stored. Hydrogen can be stored for long periods of time whilst maintaining its high energy density. Generating hydrogen by electrolysis powered with renewable energy sources removes the production of CO2. Using a green source of hydrogen as fuel to produce energy allows for the large-scale decarbonisation of the energy sector needed to combat climate change. Hydrogen after long-term storage can be used for electricity generation. Moreover, hydrogen’s use for heat (e.g., boilers) and transportation (e.g., hydrogen fuel cells) increases its viability as a fuel and provides a decarbonising effect across multiple energy sectors.
Whilst hydrogen is a promising solution to reducing CO2 emissions, it is not without issues, such as how to store this gas safely and efficiently without compromising quality. Hydrogen can be stored chemically or physically. Chemical storage uses compounds which bind or react with hydrogen such as hydrides (e.g., metal, complex, chemical and interstitial metal hydrides) [7,8], liquid organic hydrogen carriers (e.g., C6H6/C6H12) [9,10], reformed organic fuels (e.g., ammonia) [11], hydrolysis (e.g., NaBH4) and adsorption (e.g., metal organic frameworks (MOFs)) [11,12,13,14,15]. Physical storage is achieved by compression (>30 MPa) [16], slush (combination of liquid and solid hydrogen at triple point) [17], cryo-compression (>35 MPa at −253 °C) and liquefaction (0.10 MPa at −253 °C) [2,11,16,18].
Chemical storage methods such as metal hydrides, liquid organic or ammonia allow for higher energy densities to be achieved. Chemical storage allows for easier and larger quantities of hydrogen to be transported in comparison with its gaseous phase. The chemical methods have varying levels of hydrogen density, with ammonia storage providing the highest, with 120.3 kg-H2 m−3 [2]. Several issues with chemical storage methods persist due to high energy requirements from heat management/cooling during adsorption, the synthesis of reagents and heating during retrieval of the hydrogen gas. These issues impact the cost as a potential purification requirement after storage.
Physical storage methods, on the other hand, require energy for compression or cooling, with no energy required to release hydrogen for use. The gas released from physical storage methods will not need further purification when clean and dedicated containers are used. The purity in most cases is reliant on the inlet gas. Physical methods are reliant on the ability to store hydrogen under specific conditions (e.g., high pressures and low temperatures). Maintaining these conditions using bespoke containers can limit the widespread use of such technologies.
The liquefaction of hydrogen is of particular interest as a storage method. It is widely used in the US aerospace industry for rocket fuel [19]. Liquefied hydrogen has a high hydrogen density of 70.9 kg-H2 m−3, comparable with storage in ammonia. It is considered as a viable storage method [2,20].
The liquefaction of hydrogen requires low temperatures (−253 °C) at atmospheric pressure. Several parameters affect the storage efficiency such as the levels of ortho- and para-hydrogen isomers [20,21,22]. The heat released during the conversion from ortho- to para-hydrogen reaches 100% at temperatures below −120 °C. It causes the hydrogen to vaporise as boil-off, thus reducing storage efficiency [21,22]. The liquid hydrogen vessel is designed to mitigate the boil-off by minimising surface volume ratios, by cryo-cooling and by capturing any boil-off with hydrides. This allows for the storage and transport of large volumes of liquid hydrogen (e.g., Kawasaki Liquid Hydrogen Tanker) to locations where high-purity hydrogen cannot be generated on site. Another interesting point is the resulting quality of gas produced from liquid hydrogen. It is thought to be of higher purity than the inlet gas, whereby the liquefaction process removes impurities. Whilst the enhanced purity of liquid hydrogen is widely expected, there is currently no published data to support this — something this paper aims to address.
The purity of hydrogen gas is crucial for applications using fuel cell technologies where stringent guidelines have been set in ISO-14687:2019 (Table 1) [23]. Other methods of producing or storing hydrogen (e.g., electrolysis and steam methane reforming [24]) have been purity-checked against ISO-14687:2019, whereas gas from liquified hydrogen has yet to be reported.
Therefore, the aim of this work is to review the likelihood of impurities being present after liquefaction, acting as a barrier to impurities using BS EN 17124:2022 [25]. The hydrogen gas quality after liquefaction is measured for impurities outlined in ISO-14687:2019 to provide evidence for any changes in the likelihood assessment.

2. Materials and Methods

2.1. Liquified Hydrogen Production Method

Hydrogen samples were taken from three locations within the liquefaction unit and sampled from the same facility on the same day. The hydrogen liquefaction facility operates using a network of hydrogen delivered by pipeline from steam methane reforming. Sample 1 was taken from the network gas. The network gas was directed to a series of brazed aluminium heat exchangers (BAHX), where the hydrogen was liquefied via indirect heat exchange with a cooling medium. After the first step in the liquefaction unit (a nitrogen thermosiphon in which the hydrogen feed stream is cooled by nitrogen vaporisation close to atmospheric pressure), the gaseous hydrogen was at temperature of −193 °C. Sample 2 was collected at this point of the process, called the “feed gas”. Finally, the hydrogen was cooled at hydrogen liquefaction temperature (−253 °C) and directed toward a liquefied hydrogen tank. Sample 3 was taken from the boil-off of the liquified hydrogen tank. The boil-off gas was considered representative of the hydrogen quality after liquefaction and referred to as “LH2 tank sample”.

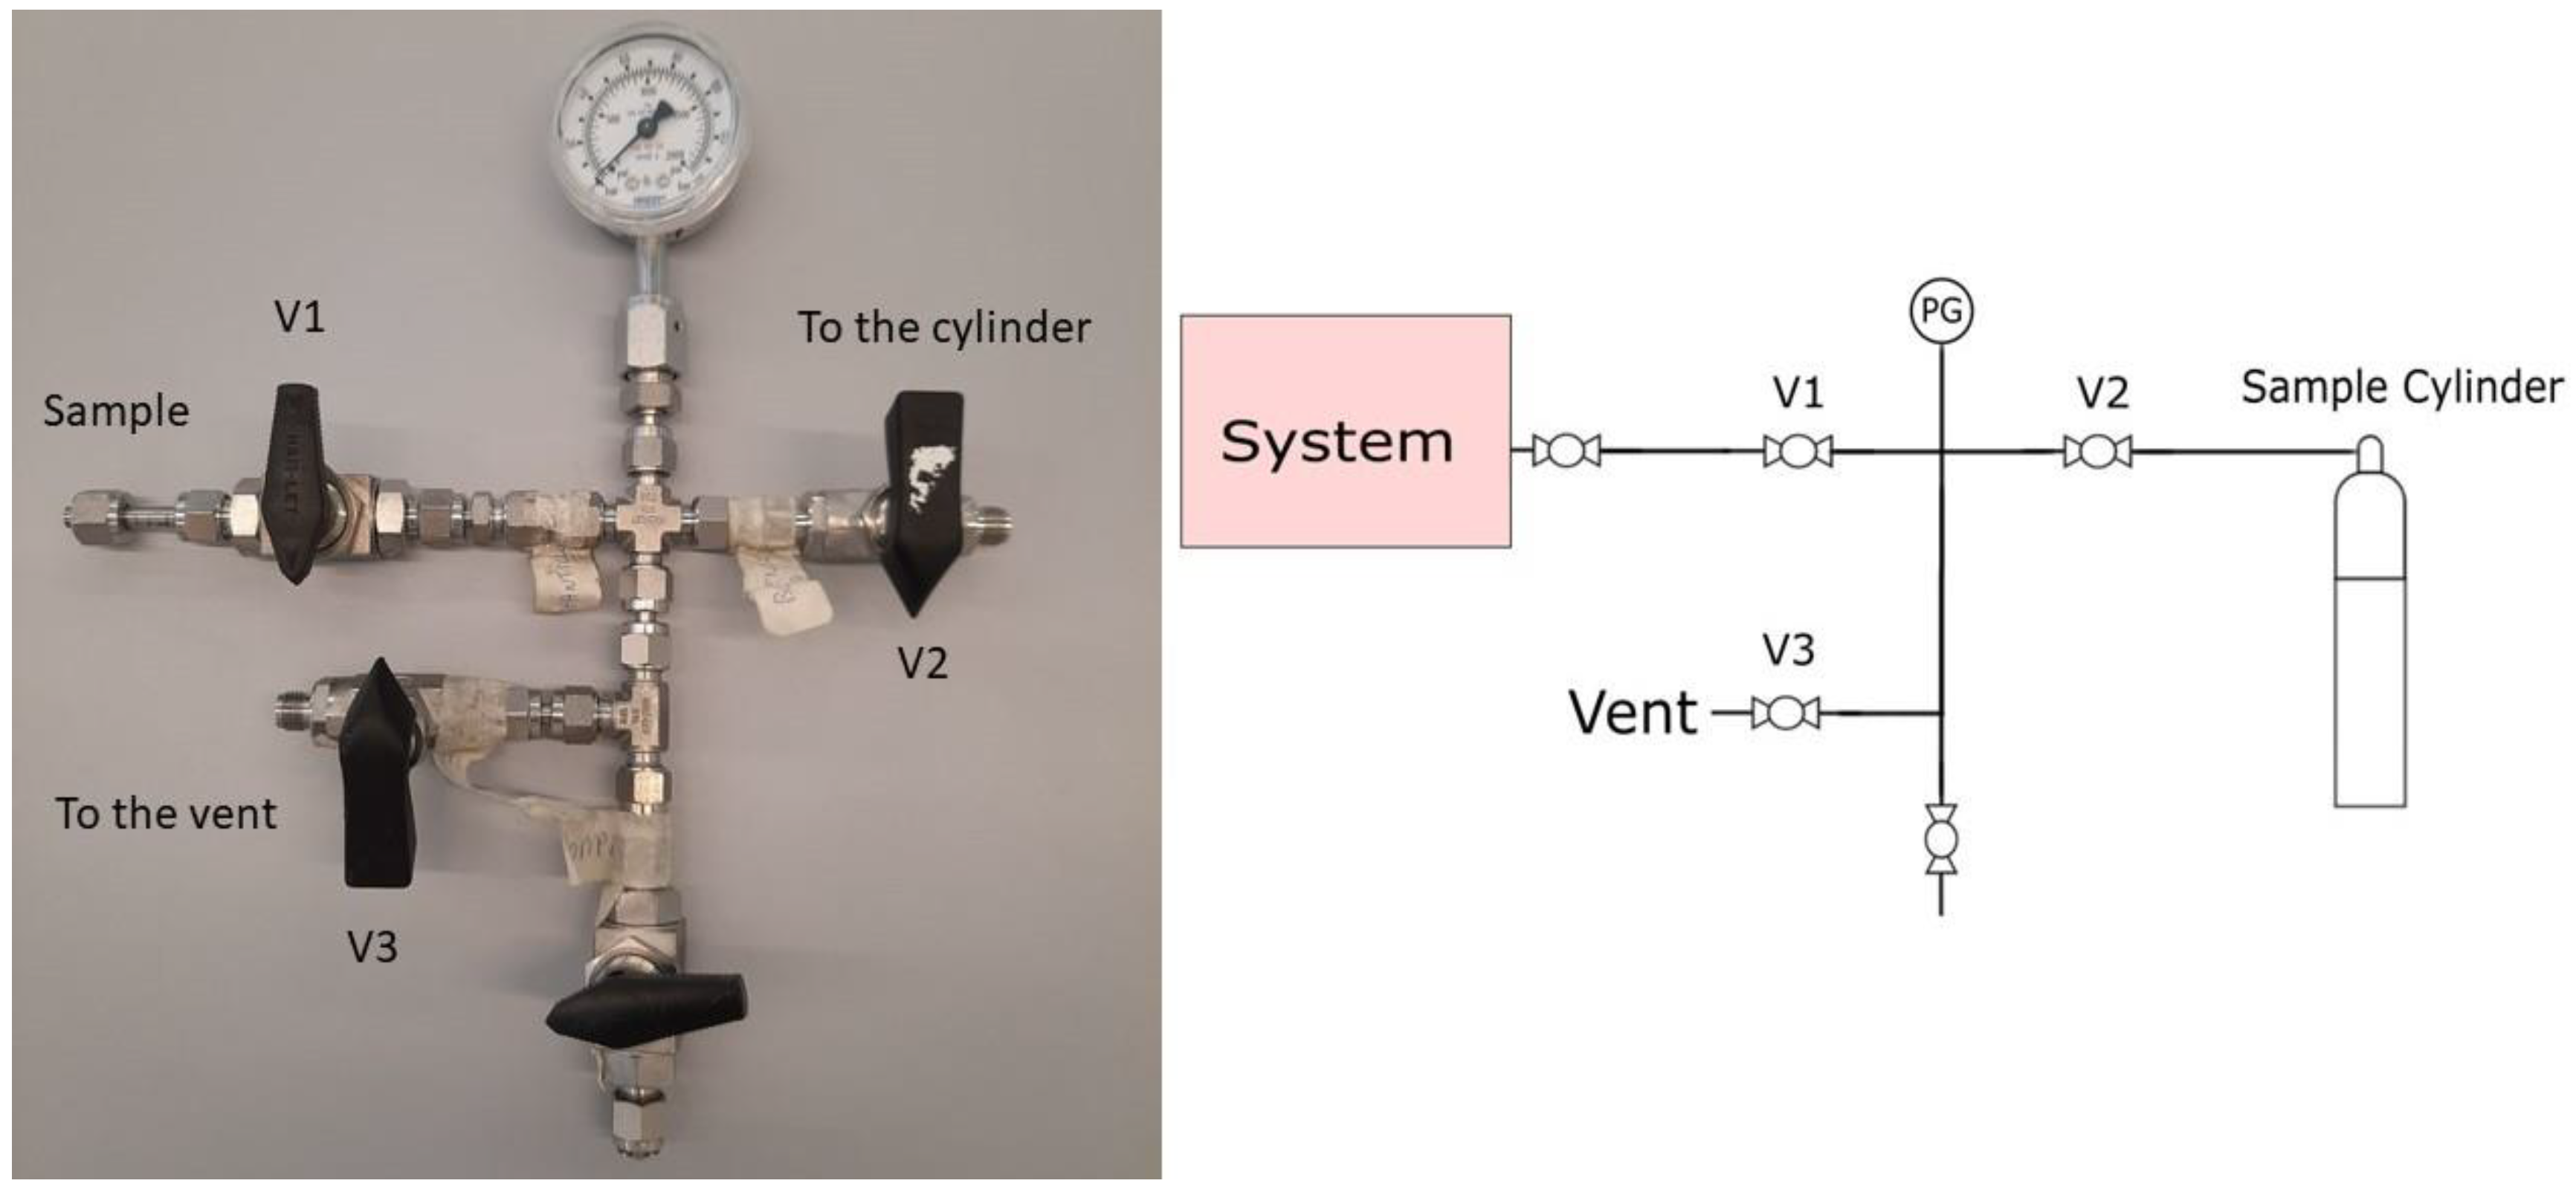
2.2. Sampling Methodology

Nine 5-litre aluminium cylinders (B5 ALU L6X, Luxfer, UK), each equipped with a stainless-steel valve AFNOR E type, were used to sample the hydrogen. At each location (network (sample 1), feed gas (sample 2) and LH2 tank (sample 3)) 2 or 3 samples were taken into 2 or 3 cylinders. Cylinders were provided and prepared by Air Liquide based on the internal manufacturing process for low concentration reactive gas mixtures. The cylinders were transported with a residual of 7 bars of hydrogen (AlphaGaz 1 Quality), decreasing the risk of contamination and allowing the purge of the gas sampling device. Each sample was collected using the same procedure and sampling system (Figure 1), defined below. First, the sample system was purged using the hydrogen gas (7 bars) from the cylinder using the following method: close V1 and V3, and open V2 to let the gas inside the cylinder pressurise the sampling system; then, close V2 and release the gas by opening V3. This process was repeated 10 times. Second, the sampling system was purged using the sample hydrogen by opening V1 and V3 for 3 min (V2 was closed). Third, the sample was taken following 10 pressurisation and depressurisation cycles using the following method: V1 and V2 were opened to pressurise the sampling system and the cylinder. The system was isolated by closing V1 and then depressurised until 2 bars by opening V3. This process was repeated 10 times. Finally, the cylinder was filled with the hydrogen sample until the maximum pressure allowed by the process. Overall, the sampling protocol took around 20 min. After the cylinder was filled, the cylinder valves were closed, and the sampling system was isolated from the process to allow for system depressurisation.

2.3. Analytical Methods

The National Physical Laboratory (NPL, Teddington, UK) is a national metrology laboratory and has developed analytical methods to measure the hydrogen fuel contaminant listed in ISO 14687:2019. The analyses were performed for the following compounds: nitrogen, oxygen, argon, carbon monoxide, carbon dioxide, methane, non-methane hydrocarbons (NMHC), total sulphur, halogenated compounds, ammonia, formaldehyde, formic acid, water and helium. The analytical methods used were NPL internal methods and accredited ISO 17025 methods for the following contaminants (nitrogen, oxygen, argon, carbon monoxide, carbon dioxide, methane, non-methane hydrocarbons (NMHC), total sulphur, water and helium) [26]. The analytical methods used were gas chromatography with pulse discharged helium ionisation detector (GC-PDHID), gas chromatography with methaniser and flame ionisation detector (GC-meth-FID), gas chromatography with sulphur chemiluminescence detector (GC-SCD), selected ion flow tube mass spectrometry (SIFT-MS), gas chromatography thermal conductivity detector (GC-TCD), thermal desorption gas chromatography mass spectrometry (TD-GC-MS) and quartz crystal microbalance. Further details on the specific analysis methods is provided in the Supplementary Materials. All analyses were calibrated using NPL gravimetric gas standards in hydrogen matrix gas. Gravimetric standards and/or dynamic standards (prepared by dilution using mass flow controller systems (Bronkhorst, Ruurlo, The Netherlands)) were used to generate calibration curves covering the BS EN 17124:2022 and ISO 14687:2019 threshold and the measured values (if it was above the limit of detection). The data were scrutinised, with no result being discarded without a technical reason. The calibration curve, results of the analyses and associated uncertainties were determined using NPL software XLGENline [27]. An expanded uncertainty was provided with 95% confidence level. In some cases, a more conservative uncertainty was derived from scientific experience. Detailed information about the analytical methods is provided in the Supplementary Materials.

2.4. Impurity Likelihood Assessment Methodology

The evaluation of the likelihood of impurities being present in the hydrogen gas in different parts of the process should be based on scientific and technical knowledge and ultimately linked to protecting the end user during application. The approach used in this study followed the principles of BS EN 17124:2022 [25] and an example from the literature [24]. To clearly define the probability of occurrence, two questions were asked. (i) Possible failures: which event can cause the impurities to be above the threshold value? (ii) What is the likelihood that impurities can be above the threshold value?
In this study, the likelihood of impurities’ presence in the hydrogen gas was considered before and after liquefaction. The consequences (severity) for end user application were not considered as it requires the identification of all the potential end user’s applications. This study focused on the most stringent requirements in ISO 14687 grade D. The objective was to identify the likelihood of the presence of each impurity in hydrogen gas above the threshold values specified in ISO 14687 [23] in the hydrogen gas before and after liquefaction. The possible causes of contamination were established on a compound-by-compound basis and are based on technical knowledge of the process and on the existing barriers in the process.
For the probability of the event occurring: impurities in hydrogen exceeded the threshold value, with Table 2 summarising the five levels of occurrence classes defined in the study [24] using updated nomenclature from BS EN 17124:2022 [25].
The aim of the assessment is to evaluate the coherence between process knowledge and the results of analysis. The comparison provides information on the robustness of the data set and knowledge of the process (barriers included). Revealing any assumptions and reasonable sources of uncertainty will enhance confidence in this output and/or help identify its limitations. The output of the contaminant probability of its presence is a qualitative description of a range of occurrences.

3. Results and Discussion

3.1. Likelihood of Contaminants from Liquid Hydrogen

During this exercise, the objective was to realise any changes in the probability of occurrence of impurities between the hydrogen feed gas before and after the liquefaction process. From the process expert in Table 3, we clearly see that the liquefaction process may be considered as an impurity’s barrier with all compounds’ occurrences set to very unlikely.

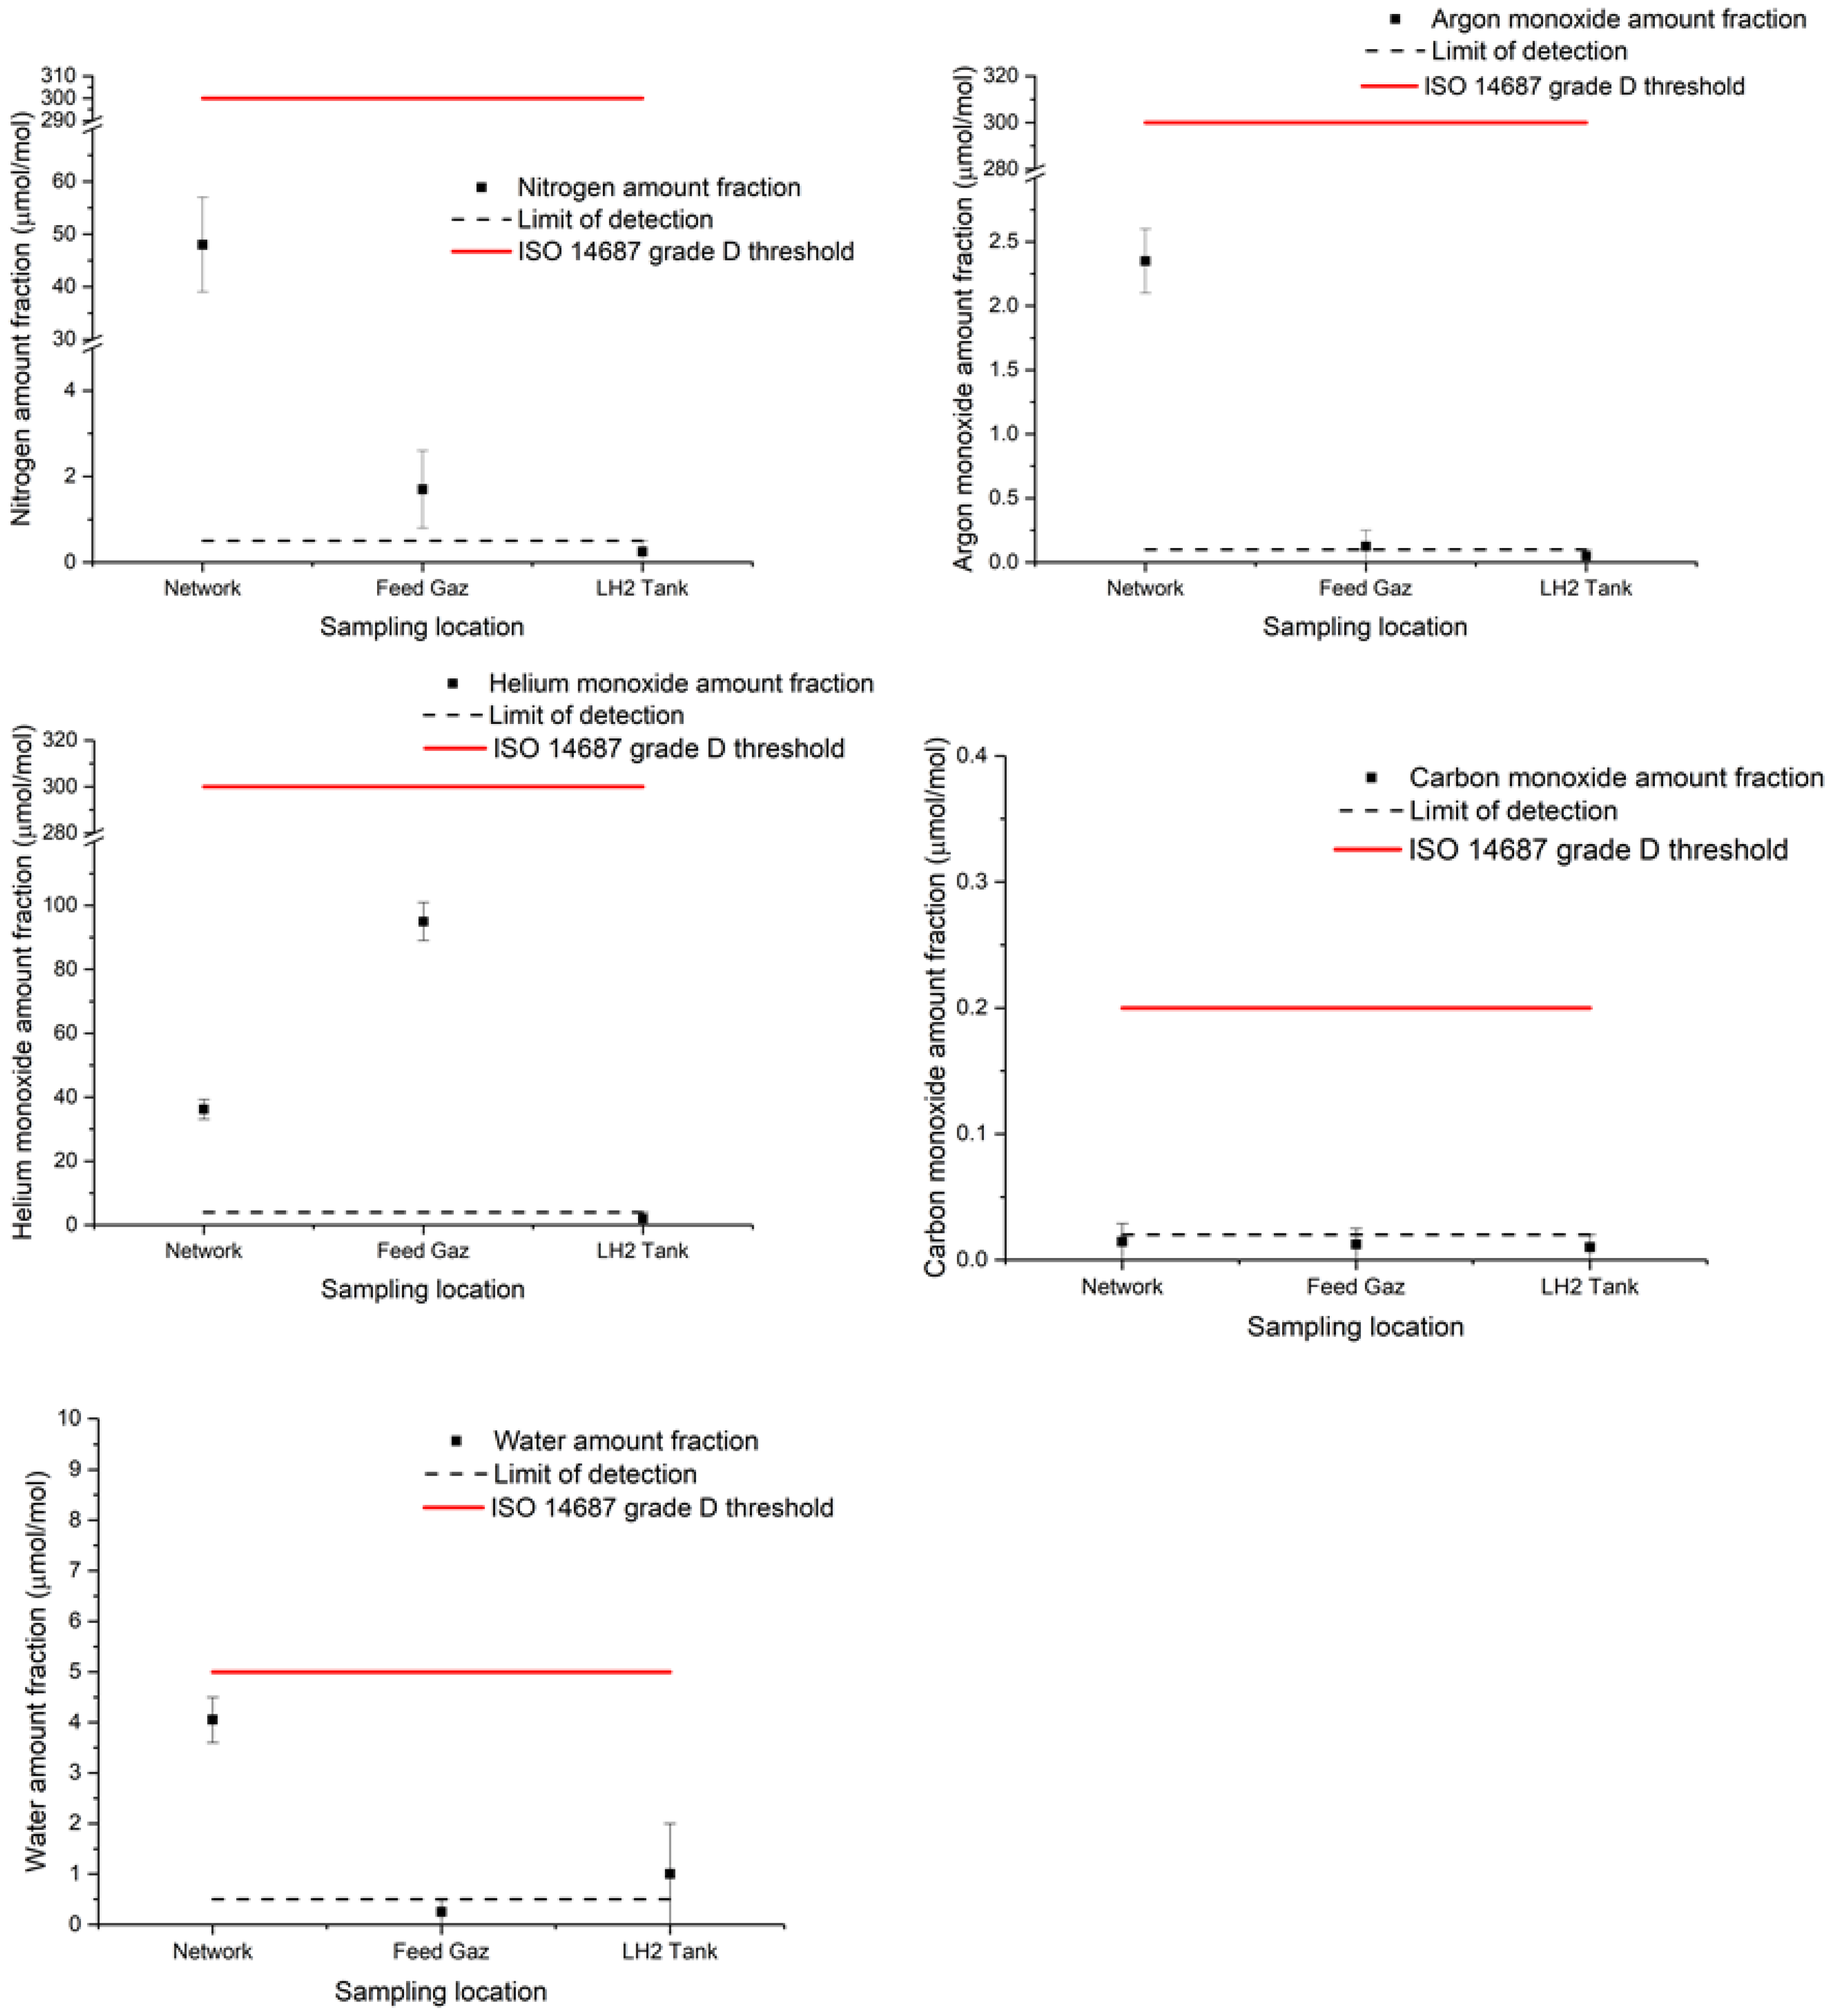
3.2. Hydrogen Quality

Hydrogen samples were analysed from three points of the process of liquefaction, namely network (inlet of the liquefaction of liquefaction process), feed gas (just after the first step of the liquefaction process) and LH2 tank (outlet of the liquefaction process) for contaminants detailed in ISO-14687:2019.
The results are summarised in Table 4 and visually represented in Figure 2 with the technical specification ISO 14687:2019 for reference. All individual results are reported in the Supplementary Materials.
In the network, the presence of nitrogen, helium, argon, water and carbon dioxide was found. Traces of non-methane hydrocarbons, carbon monoxide and ammonia were visible but close to the limit of quantification. In the feed gas, the presence of nitrogen and helium was also detected. Traces of argon, carbon dioxide, carbon monoxide and oxygen were visible but close to the limit of quantification of NPL analytical methods. All the other impurities were reported below the limit of detection of the analytical methods and much lower than the ISO 14687:2019 threshold values.
Even if the hydrogen network and feed gas were compliant with the ISO 14687:2019 requirements, few impurities were observed at quantifiable levels before the liquefaction process.
The results of analysis at the LH2 tank showed the presence of only one quantifiable compound: water. All the other impurities were below the limit of detection of the analytical methods and much lower than the ISO 14687:2019 reference values.
The results showed that, after the liquefaction process, the hydrogen gas presented less quantifiable impurities (Figure 2). The results seem coherent with the assumption that the liquefaction process has a purification effect on the hydrogen gas boil-off.

3.3. Likelihood of Contaminant Presence in Correlation with Measurement Results

Based on the feedstock gas (from steam methane reforming [24]; Table 3), the very unlikely parameters will not be discussed as already absent. Due to the change in formaldehyde amount fraction specified in ISO 14687:2019, the likelihood has been changed to very unlikely for the feedstock gas. Therefore, the focus of the study will be around the following impurities: methane, helium, nitrogen, argon and carbon monoxide.
Clearly, the liquefaction process has a strong impact on the amount fraction of nitrogen and helium. The amount fraction of nitrogen and helium significantly reduced; therefore, liquefaction can be considered as a barrier decreasing the likelihood of the presence of these two contaminants to very unlikely.
For methane, argon and carbon monoxide, the feedstock gas had low amount fractions; therefore, the results showed a small decrease, probably due to the limit of detection of the analytical method used. Even though the argon and carbon monoxide reduction was small, this hints to the fact that liquefaction had a positive impact on the impurity likelihood.
The changes in probability of occurrence to very unlikely (Table 3) for methane, carbon monoxide, argon, nitrogen and helium are specific to the site studied and the hydrogen production by steam methane reforming. The change in probability of occurrence is supported by the measurements in Table 4. The liquefaction of hydrogen from other sources (e.g., electrolysers) will contain impurities which are more probable (e.g., water). Therefore, the results obtained here cannot be used to support a change in impurity likelihood of occurrence for different liquefaction configurations or hydrogen production methods. Cases which differ from the case outlined here should collect technical evidence to support the reduction in the probability of occurrence for that specific impurity, as in this paper. Further data are needed to guarantee hydrogen quality; therefore, hydrogen purity monitoring should continue.

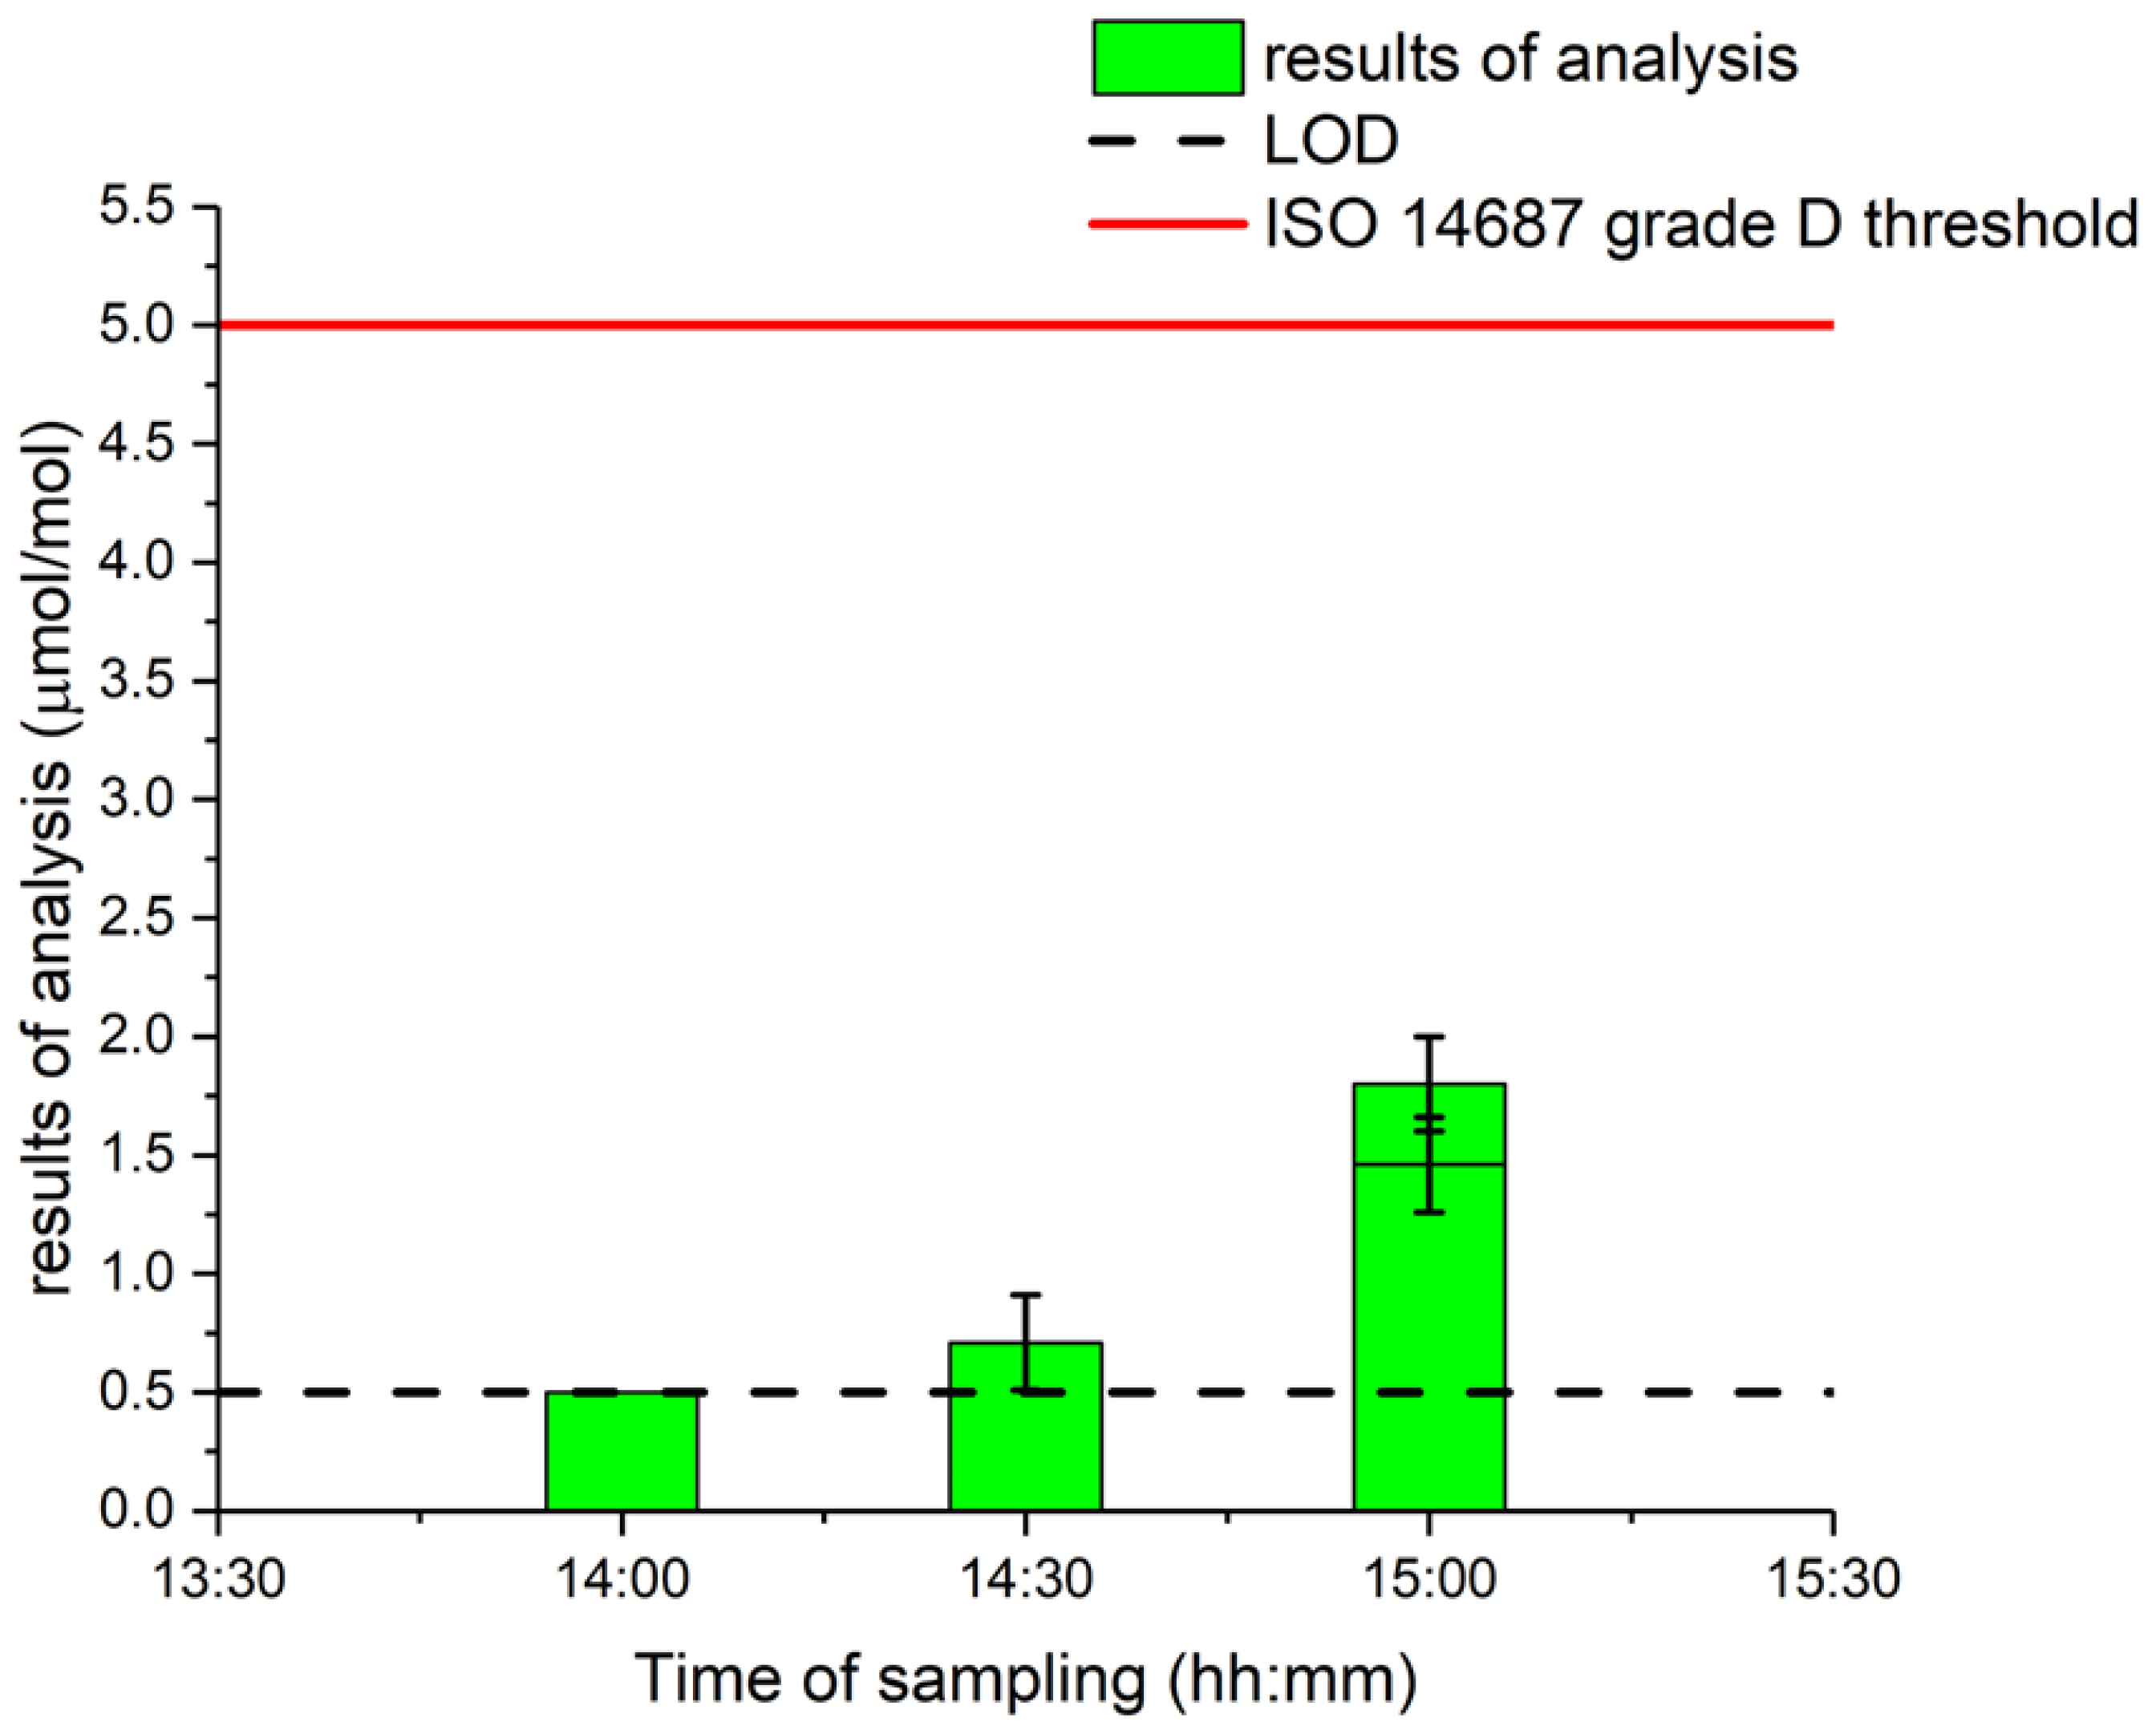
3.4. Water Amount Fraction Measurement Challenge

It should be noted that, at this step of the process (“LH2 Tank”, T = −253 °C, p = 1 bara), any trace of solid water would automatically clog the piping and cause failure of the whole industrial process. Thus, it seems very unlikely that the water comes from the liquid hydrogen itself but more likely to come from the sampling method.
Interestingly, the measured value of water increased with time sampled, as shown in Figure 3. The lowest water content value of the LH2 tank was at the first sampling. Therefore, it can be assumed that the impact of sampling from the LH2 tank may have impacted the representativity of the water amount fraction in the hydrogen sample. The challenges of gas sampling for water amount fraction are multiple due to (i) changes in ambient conditions during sampling (i.e., rain, humidity relative and temperature); (ii) changes in the sampling point after repetitive sampling, indeed, with the appearance of ice or water droplets on the sampling manifold due to the very low temperature of hydrogen possibly impacting and polluting future sampling despite a rigorous purging methodology; and (iii) changes in boil-off conditions after several samplings where humidity may appear.
It would be interesting to study more water sampling from liquid hydrogen to determine if the increase is related to the process (boil-off) itself or to the sampling and purging procedures when taking multiple samples from the same location.

4. Conclusions

This study confirms for the first time the high purity of hydrogen gas after liquefaction. Indeed, this highlights that the level of impurity after liquefaction is below the detection limit for all the contaminants. Hydrogen gas at the output of the liquefaction process is very unlikely to exceed the threshold outlined in the ISO 14687.
Comparing the different results across the liquefaction process shows that hydrogen gas from liquified hydrogen is of higher purity than the feedstock gases used. For instance, the amount fraction of nitrogen, helium, argon and water has been significantly reduced to below the limit of detection. The data confirm for the first time the high purity of hydrogen gas after liquefaction. However, it has been identified that liquefaction can be considered a barrier in the impurity likelihood evaluation when defining the hydrogen quality monitoring plan (ISO 19880-8) for erasing upstream contamination risks, while the downstream part of the LH2 plant still needs to be considered.
Interestingly, the water amount fraction increased with the number of samplings from the liquified hydrogen tank, likely caused by the sampling system rather than the process of liquefaction. This highlighted the challenges around water amount fraction sampling and analysis, supporting onsite or online measurements for better accuracy.
The confirmed high purity of hydrogen gas after liquefaction shows its applicability as an energy storage medium. This would not only allow for easier transportation of hydrogen as a fuel (e.g., to fuel stations without the need for pipelines) but also allow for shipping to other locations as a commodity in trade.

Supplementary Materials

The following supporting information can be downloaded at https://www.mdpi.com/article/10.3390/pr10091697/s1: additional information on the methodology used—Table S1: Individual results of each hydrogen sample taken from the hydrogen liquefication process.

Author Contributions

Conceptualisation, T.B., M.C. and E.L.G.; methodology, T.B. and M.J.F.H.; sampling, E.L.G. and C.C.; formal analysis, M.J.F.H., A.S.O.M., N.M., Y.H. and T.B.; investigation, M.J.F.H. and T.B.; writing—original draft preparation, writing—review and editing, M.J.F.H., T.B. and E.L.G.; supervision, T.B.; project administration, T.B.; funding acquisition, T.B. All authors have read and agreed to the published version of the manuscript.

Funding

This work: performed as part of the project HYDRAITE, has received funding from the Fuel Cells and Hydrogen 2 Joint Undertaking under grant agreement No 779475. This joint undertaking receives support from the European Union’s Horizon 2020 research and innovation programme and Hydrogen Europe and Hydrogen Europe Research.

Institutional Review Board Statement

Not applicable.

Informed Consent Statement

Not applicable.

Data Availability Statement

The original data are found in the Supplementary Materials.

Acknowledgments

We acknowledge the funding provided by the HYDRAITE project to allow for this work to be carried out.

Conflicts of Interest

The authors declare no conflict of interest.

Nomenclature

ISO—International Organisation of Standardisation, COP26—Conference of Parties 26, MOFS—metal organic frameworks, BS EN—British standard, LH2 Tank—liquified hydrogen tank, NPL—National Physical Laboratory, PEM—proton exchange membrane, BAHX—brazed aluminium heat exchangers, T—temperature, P—pressure, NMHC—non-methane hydrocarbon, GC-PDHID—gas chromatography pulse-discharged helium ionisation detector, GC-meth-FID, gas chromatography methaniser flame ionisation detector, GC-SCD—gas chromatography sulphur chemiluminescence detector, GC-TCD—gas chromatography thermal conductivity detector, TD-GC-MS—thermal desorption gas chromatography mass spectroscopy, SIFT-MS—selected ion flow tube mass spectroscopy.

References

  1. International Energy Agency (IEA). Global CO2 Emissions in 2019. Available online: https://www.iea.org/data-and-statistics/data-browser?country=WORLD&fuel=CO2emissions&indicator=CO2BySector (accessed on 1 April 2022).
  2. Aziz, M. Liquid Hydrogen: A Review on Liquefaction, Storage, Transportation, and Safety. Energies 2021, 14, 5917. [Google Scholar] [CrossRef]
  3. United Nations Report of the Conference of the Parties on Its Twenty-First Session, Held in Paris from 30 November to 13 December 2015. Available online: https://cop23.unfccc.int/resource/docs/2015/cop21/eng/10a01.pdf (accessed on 26 January 2022).
  4. United Nations Climate Change. Conference of parties 26 COP26—The Glasgow Climate Pact. Available online: https://ukcop26.org/wp-content/uploads/2021/11/COP26-Presidency-Outcomes-The-Climate-Pact.pdf (accessed on 28 March 2022).
  5. Antonelli, M.; Barsali, S.; Desideri, U.; Giglioli, R.; Paganucci, F.; Pasini, G. Liquid air energy storage: Potential and challenges of hybrid power plants. Appl. Energy 2017, 194, 522–529. [Google Scholar] [CrossRef]
  6. Kharel, S.; Shabani, B. Hydrogen as a Long-Term Large-Scale Energy Storage Solution to Support Renewables. Energies 2018, 11, 2825. [Google Scholar] [CrossRef]
  7. Sakintuna, B.; Lamari-Darkrim, F.; Hirscher, M. Metal hydride materials for solid hydrogen storage: A review. Int. J. Hydrogen Energy 2007, 32, 1121–1140. [Google Scholar] [CrossRef]
  8. He, T.; Cao, H.; Chen, P. Complex Hydrides for Energy Storage, Conversion, and Utilization. Adv. Mater. 2019, 31, 1902757. [Google Scholar] [CrossRef] [PubMed]
  9. Aakko-Saksa, P.T.; Cook, C.; Kiviaho, J.; Repo, T. Liquid organic hydrogen carriers for transportation and storing of renewable energy–Review and discussion. J. Power Sour. 2018, 396, 803–823. [Google Scholar] [CrossRef]
  10. Rao, P.C.; Yoon, M. Potential Liquid-Organic Hydrogen Carrier (LOHC) Systems: A Review on Recent Progress. Energies 2020, 13, 6040. [Google Scholar] [CrossRef]
  11. Aziz, M.; TriWijayanta, A.; Nandiyanto, A.B.D. Ammonia as Effective Hydrogen Storage: A Review on Production, Storage and Utilization. Energies 2020, 13, 3062. [Google Scholar] [CrossRef]
  12. Andersson, J.; Grönkvist, S. Large-scale storage of hydrogen. Int. J. Hydrogen Energy 2019, 44, 11901–11919. [Google Scholar] [CrossRef]
  13. Valenti, G. Hydrogen liquefaction and liquid hydrogen storage. Compend. Hydrogen Energy 2016, 2, 27–51. [Google Scholar] [CrossRef]
  14. Sun, Z.; Lu, X.; Nyahuma, F.M.; Yan, N.; Xiao, J.; Su, S.; Zhang, L. Enhancing Hydrogen Storage Properties of MgH2 by Transition Metals and Carbon Materials: A Brief Review. Front. Chem. 2020, 8, 552. [Google Scholar] [CrossRef] [PubMed]
  15. Suh, M.P.; Park, H.J.; Prasad, T.K.; Lim, D.W. Hydrogen Storage in Metal–Organic Frameworks. Chem. Rev. 2011, 112, 782–835. [Google Scholar] [CrossRef] [PubMed]
  16. Yanxing, Z.; Maoqiong, G.; Yuan, Z.; Xueqiang, D.; Jun, S. Thermodynamics analysis of hydrogen storage based on compressed gaseous hydrogen, liquid hydrogen and cryo-compressed hydrogen. Int. J. Hydrogen Energy 2019, 44, 16833–16840. [Google Scholar] [CrossRef]
  17. Park, Y.M. Literature research on the production, loading, flow, and heat transfer of slush hydrogen. Int. J. Hydrogen Energy 2010, 35, 12993–13003. [Google Scholar] [CrossRef]
  18. Gürsu, S.; Sheriff, S.A.; Vezirocǧlu, T.N.; Sheffield, J.W. Review of slush hydrogen production and utilization technologies. Int. J. Hydrogen Energy 1994, 19, 491–496. [Google Scholar] [CrossRef]
  19. Kurtz, J.; Sprik, S.; Bradley, T.H. Review of transportation hydrogen infrastructure performance and reliability. Int. J. Hydrogen Energy 2019, 44, 12010–12023. [Google Scholar] [CrossRef]
  20. Wijayanta, A.T.; Oda, T.; Purnomo, C.W.; Kashiwagi, T.; Aziz, M. Liquid hydrogen, methylcyclohexane, and ammonia as potential hydrogen storage: Comparison review. Int. J. Hydrogen Energy 2019, 44, 15026–15044. [Google Scholar] [CrossRef]
  21. Brickwedde, F.G.; Scott, R.B.; Taylor, H.S. The Difference in Vapor Pressures of Ortho and Para Deuterium. J. Chem. Phys. 2004, 3, 653. [Google Scholar] [CrossRef]
  22. Giauque, W.F.; Johnston, H.L. Symmetrical and antisymmetrical hydrogen and the third law of thermodynamics. thermal equilibrium and the triple point pressure. J. Am. Chem. Soc. 2002, 50, 3221–3228. [Google Scholar] [CrossRef]
  23. ISO 14687:2019; Hydrogen Fuel Quality—Product Specification. International Organization for Standardization: Vernier, Geneva, 2019.
  24. Bacquart, T.; Arrhenius, K.; Persijn, S.; Rojo, A.; Auprêtre, M.; Carré, F.; Gozlan, B.; Moore, N.; Morris, A.; Fischer, A.; et al. Hydrogen fuel quality from two main production processes: Steam methane reforming and proton exchange membrane water electrolysis. J. Power Sour. 2019, 444, 227170. [Google Scholar] [CrossRef]
  25. BS EN 17124:2022; Hydrogen Fuel—Product Specification and Quality Assurance for Hydrogen Refuelling Points Dispensing Gaseous Hydrogen—Proton Exchange Membrane (PEM) Fuel Cell Applications for Vehicles. British Standards Institution: London, UK, 2022.
  26. Aarhaug, T.A.; Kjos, O.; Bacquart, T.; Valter, V.; Optenhostert, T. Assessment of hydrogen quality dispensed for hydrogen refuelling stations in Europe. Int. J. Hydrogen Energy 2021, 46, 29501–29511. [Google Scholar] [CrossRef]
  27. Smith, I.M.; Onakunle, F.O. SSfM-3 1.6.1—XLGENLINE, Software for Generalised Least-Squares Fitting; Developed by the (NPL), NPL Document Reference: CMSC/M/06/657 2007; National Physical Laboratory: Teddington, UK, 2007. [Google Scholar]
Figure 1. Schematic of sampling system used in this study.
Processes 10 01697 g001
Figure 2. Graphical representation of hydrogen gas contaminant results for nitrogen, argon, helium, carbon monoxide and water during the liquefaction process (network, feed gas and LH2 tank).
Processes 10 01697 g002
Figure 3. Liquid hydrogen gas water measurements in order of sampling.
Processes 10 01697 g003
Table 1. Hydrogen fuel quality ISO14687:2019 for a proton exchange membrane (PEM) fuel cell road vehicle.
CompoundISO-14687:2019 [23]
Amount Fraction
(µmol mol−1)
Nitrogen300
Helium300
Argon300
Methane100
Oxygen5
Water5
Non-methane hydrocarbons2
Carbon dioxide2
Carbon monoxide0.2
Formic acid0.2
Ammonia0.1
Formaldehyde0.2
Individual organo halogenated compoundsn.a.
Total halogenated compounds0.05
Total sulphur compounds0.004
n.a = Not applicable
Table 2. Definition of the occurrence or frequency for the probability of contaminant occurrence.
Occurrence ClassClass NameOccurrence or Frequency
0Very unlikely (Practically impossible)Contaminant above threshold never been observed for this source/supply chain/station
1UnlikelyKnown to occur at least once for this source/supply chain/station
2PossibleHas happened once a year for this source/supply chain/station
3LikelyHas happened more than once a year for this source/supply chain/station
4Very likelyHappens on a regular basis for this source/supply chain/station
Table 3. Impact of the liquefaction on the contaminant occurrence.
CompoundsISO 14687-2019 Threshold (µmol mol−1)Probability of Occurrence from Network Gas
Produced by Steam
Methane Reforming [24] **
Probability of
Occurrence after Liquefaction
Water5Very unlikely (0)Very unlikely (0)
Methane100Possible (2)Very unlikely (0) *
Non-methane hydrocarbons2Very unlikely (0)Very unlikely (0)
Oxygen5Very unlikely (0)Very unlikely (0)
Helium300Unlikely (1)Very unlikely (0) *
Nitrogen300Likely (3)Very unlikely (0) *
Argon300Possible (2)Very unlikely (0) *
Carbon dioxide2Very Unlikely (0)Very unlikely (0)
Carbon monoxide0.2Very likely (4)Very unlikely (0) *
Total sulphur compounds0.004Very unlikely (0)Very unlikely (0)
Formaldehyde0.2Very unlikely (0)Very unlikely (0)
Formic acid0.2Very unlikely (0)Very unlikely (0)
Ammonia0.1Very unlikely (0)Very unlikely (0)
Total halogenated0.05Very unlikely (0)Very unlikely (0)
* The probability of occurrence presented in this study is valid for the specific liquefaction plant studied based on the measurements realised. For other liquefaction systems, the probability of occurrence needs more technical evidence to confirm the very unlikely probability of occurrence. ** Updated in accordance with occurrence class nomenclature in BS EN 17124:2022 [25].
Table 4. Results of hydrogen gas quality at different points of the liquefaction process according to the ISO-14687:2019 list of contaminants. Where possible, minimum–maximum values are shown considering expanded uncertainties. Measurements below the limit of detection denoted by <symbol.
CompoundSample 1
Network
Measured Value (µmol mol−1)
Sample 2
Feed Gas
Measured Value (µmol mol−1)
Sample 3
LH2 Tank
Measured Value (µmol mol−1)
ISO-14687:2019
(µmol mol−1)
Nitrogen **39–570.8–2.6<0.5300
Helium *33.1–39.389–101<4.0300
Argon **2.1–2.6<0.10–0.25<0.10300
Methane **<0.005<0.005<0.005100
Oxygen **<0.20<0.20–0.30<0.205
Water **3.5–4.6<0.5<0.5–2.05
Non-methane hydrocarbons **0.033–0.035<0.020<0.0202
Carbon dioxide **0.039–0.058<0.010–0.028<0.010–0.0182
Carbon monoxide **<0.020–0.029<0.020–0.030<0.0200.2
Formic acid *<0.005<0.005<0.0050.2
Ammonia *0.017–0.045<0 030<0 0300.1
Formaldehyde *<0.005<0.005<0.0050.2
Individual organo halogenated compounds *<0.0030<0.0032<0.0036n.a.
Total halogenated compounds *<0.032<0.034<0.0380.05
Total sulphur compounds *<0.0010<0.0010<0.00100.004
*: Results from one sample, where the range reported corresponds to the average value minus the expanded uncertainty (k = 2) up to the average value plus the expanded uncertainty (k = 2). **: Results from two or three independent samples, where the range reported corresponds to the lowest measured sample value minus its expanded uncertainty (k = 2) up to the highest measured sample value plus its expanded uncertainty (k = 2). n.a. = Not applicable.
Publisher’s Note: MDPI stays neutral with regard to jurisdictional claims in published maps and institutional affiliations.

