Article

Hydrogen-Enriched Compressed Natural Gas Network Simulation for Consuming Green Hydrogen Considering the Hydrogen Diffusion Process

1
School of Electrical Engineering, Southeast University, Nanjing 210096, China
2
Department of Electronic and Electrical Engineering, University of Strathclyde, Glasgow G1 1RD, UK
*
Author to whom correspondence should be addressed.
Processes 2022, 10(9), 1757; https://doi.org/10.3390/pr10091757
Submission received: 28 July 2022 / Revised: 24 August 2022 / Accepted: 26 August 2022 / Published: 2 September 2022

Abstract

:
Transporting green hydrogen by existing natural gas networks has become a practical means to accommodate curtailed wind and solar power. Restricted by pipe materials and pressure levels, there is an upper limit on the hydrogen blending ratio of hydrogen-enriched compressed natural gas (HCNG) that can be transported by natural gas pipelines, which affects whether the natural gas network can supply energy safely and reliably. To this end, this paper investigates the effects of the intermittent and fluctuating green hydrogen produced by different types of renewable energy on the dynamic distribution of hydrogen concentration after it is blended into natural gas pipelines. Based on the isothermal steady-state simulation results of the natural gas network, two convection–diffusion models for the dynamic simulation of hydrogen injections are proposed. Finally, the dynamic changes of hydrogen concentration in the pipelines under scenarios of multiple green hydrogen types and multiple injection nodes are simulated on a seven-node natural gas network. The simulation results indicate that, compared with the solar-power-dominated hydrogen production-blending scenario, the hydrogen concentrations in the natural gas pipelines are more uniformly distributed in the wind-power-dominated scenario and the solar–wind power balance scenario. To be specific, in the solar-power-dominated scenario, the hydrogen concentration exceeds the limit for more time whilst the overall hydrogen production is low, and the local hydrogen concentration in the natural gas network exceeds the limit for nearly 50% of the time in a day. By comparison, in the wind-power-dominated scenario, all pipelines can work under safe conditions. The hydrogen concentration overrun time in the solar–wind power balance scenario is also improved compared with the solar-power-dominated scenario, and the limit-exceeding time of the hydrogen concentration in Pipe 5 and Pipe 6 is reduced to 91.24% and 91.99% of the solar-power-dominated scenario. This work can help verify the day-ahead scheduling strategy of the electricity-HCNG integrated energy system (IES) and provide a reference for the design of local hydrogen production-blending systems.

1. Introduction

Injecting hydrogen into the natural gas pipeline network can make full use of the existing natural gas infrastructure to achieve long-distance, large-scale transportation and the utilization of hydrogen energy [1,2]. It is widely believed that after a certain degree of hydrogen resistance transformation, or even without any modification, existing natural gas pipelines can withstand the transportation of hydrogen-enriched compressed natural gas (HCNG) within a certain level of hydrogen blending ratio [3]. Certainly, the upper limit of the hydrogen blending ratio is determined by actual conditions.
In terms of hydrogen production methods, the current mainstream one in the world is still the production of gray hydrogen by fossil fuels such as coal and natural gas. Additionally, blue hydrogen, a relatively clean type of hydrogen, can be obtained if adopting the CCUS technology [4]. Nevertheless, to achieve the social targets of promoting high proportional renewable energy and carbon emission reduction, producing green hydrogen by renewable energy will become a crucial approach to utilizing secondary energy in the future [5]. However, the renewable energy output is significantly intermittent and fluctuating. If the hydrogen produced by water electrolysis with the surplus electricity generated by the renewable energy is directly injected into the natural gas network, the hydrogen concentration in the natural gas network will also show substantial uncertainty. The operating condition of pipelines is closely related to the hydrogen concentration. Hence, if the hydrogen concentration of HCNG in the pipeline exceeds the permitted limit for a long time and at a high frequency, it might lead to problems like serious gas leakage, hydrogen embrittlement, and even explosion, posing threats to the reliability of the system’s energy supply as well as the safety of the surroundings.
There are distinctive differences in physicochemical properties between hydrogen and natural gas, so blending hydrogen into natural gas has implications for the operating condition of natural gas pipelines. Broad engineering experiments and simulation studies have been carried out worldwide to explore the influence of hydrogen blending on the natural gas infrastructure and its potential safety risks. Several representative international HCNG demonstration projects are presented in Figure 1 [6], in which the horizontal axis represents time, and the histogram height represents the upper limit of the allowable hydrogen blending ratio (in volume fraction) in these projects. It can be seen that the value of hydrogen blending ratio ranges from 2% to 50%, and there are also projects for pure hydrogen. As shown in Figure 1, the European Union conducted a demonstration project named NaturalHy in 2004 which studied the conditions of blending hydrogen into the natural gas network without affecting the integrity, safety, and combustion properties of the natural gas network. After that, countries including the Netherlands, France, the UK, and China carried out demonstration projects and trials targeting different links of the HCNG supply chain and studied the maturity, reliability, and stability of HCNG-related technologies [7,8,9,10,11].
Those demonstration projects mentioned above are preparing the standard-setting and popularization of HCNG technology throughout society. Meanwhile, scholars in different countries have carried out modeling and simulating investigations aimed at the HCNG network and other core equipment, including the establishment of simulation models and methods, a power flow analysis with the help of professional software such as ANSYS Fluent, SPS, Pipeline Studio and so forth, conducting experiments in real environments, and so on. For natural gas pipelines with multiple hydrogen blending nodes, Ref. [12] proposed a calculating method for the transient gas flow of HCNG to trace gas component changes. This method verified the inaccuracy of the traditional steady-state method and revealed the degradation effect of hydrogen blending on the line-pack capacity of natural gas pipelines. Ref. [13] investigated the steady-state gas flow distribution in the low-pressure natural gas distribution network under the condition of constant hydrogen injection, and the simulation results indicated that the selection of the hydrogen blending nodes had a distinctive impact on the distribution of the hydrogen component in pipelines and determined whether it would exceed the limit. Using the COMSOL Multiphysics software, Ref. [14] performed steady-state and transient simulations on a single natural gas pipeline and a three-node loop network successively under the condition of constant hydrogen injection. This work revealed the potential risks of hydrogen blending to the embrittlement of the pipeline’s material from the angle of a steady-state pressure drop and transient-state pressure fluctuation network. The authors of Ref. [15] proposed a mathematical optimization framework for modeling and evaluating the conditions of hydrogen blending into the existing natural gas network without any modification. The optimizing content includes minimizing the consumption of compressor fuel, maximizing hydrogen blending amount and transportation capacity, as well as finding the greatest degree of transportation pressure increase. In Ref. [16], the effects of different hydrogen blending ratios on the pressure, flow rate, and transportation loss of the natural gas network were compared. The simulation results showed that the upstream hydrogen injection was better than the downstream hydrogen injection of the pipeline network and centralized hydrogen blending performed better than distributed hydrogen blending.
When the blended hydrogen is green hydrogen produced by renewable energy, the intermittency and fluctuation of the renewable energy will pass down to the natural gas network. For example, a PV power station reaches its power generation peak at noon and does not generate any at night. Wind power has the typical characteristics of daily fluctuation and seasonal fluctuation. Even the controllable hydropower with relatively stable working conditions has dry seasons and wet periods. The simulation results in Ref. [17] indicated that blending the hydrogen produced by surplus wind power into the natural gas network from multiple nodes might lead to the hydrogen concentration exceeding the upper limit. Therefore, it is necessary to conduct gas and power system modeling and simulation before carrying out practical hydrogen blending. Ref. [18] studied the influence of blending green gases, including hydrogen, into natural gas pipelines on the qualities of gases, including parameters like Wobbe index, gas gravity, and higher heating value; it also evaluated the maximum amount of hydrogen blending in each node. Certainly, energy storage technologies will hopefully help to alleviate the above problems. In terms of hydrogen storage, technologies such as pressurized storage vessels [19], metal hydride [20], and underground hydrogen storage (UHS) [21] can realize the decoupling of hydrogen production and utilization on different time scales. In particular, affected by complex geological conditions, hydrogen in UHS will be converted into methane and hydrogen sulfide under bacterial catalysis [22]. If the gas stored in UHS is injected into the natural gas network, the gas composition in the pipelines will be more complicated.
In addition to the above simulation studies, some scholars investigated the designing of hydrogen blending schemes as well as the evaluation of related economic and environmental benefits from the planning, operation, and techno-economic analysis of hydrogen penetrated energy systems. Regarding the planning and operation of the electricity–gas integrated energy system (IES) with hydrogen injection, Ref. [23] put forward a calculating method of probabilistic multi-energy flow analysis that considered the uncertainty, reducing the computation time while guaranteeing the computation accuracy at the same time. To make use of Ireland’s surplus wind power, Ref. [24] established a wind–hydrogen system that contained hydrogen production by water electrolysis, hydrogen compression, tube trailer transportation to hydrogen blending nodes, etc., and studied the equipment configuration and techno-economic analysis of this system. The result indicated that 76% of wind farms with a capacity higher than 1 MW were located within 100 km around the hydrogen blending nodes. To reduce carbon dioxide emission, authors of Ref. [25] investigated the economy and reliability of using hydrogen as the alternative fuel in places with coal as their main fuel. Thereby, a mixed integer linear programming model for the regional natural gas supply chain was established to optimize the hydrogen blending scheme.
Based on the above studies, hydrogen blending into the natural gas network has become a hot topic of current green hydrogen utilization, but research about the dynamic change of gas component in the natural gas network after hydrogen injection is still insufficient. Additionally, there is a lack of attention to the adaptation degree between different renewable energy hydrogen production methods and pipeline hydrogen blending. Therefore, for injecting green hydrogen into the natural gas network, it is necessary to study the dynamic change of hydrogen concentration in different scenarios of varying hydrogen blending ratios so as to provide instructive suggestions for the planning of equipment in the electricity-HCHG-IES, the retrofitting of pipelines, and the designing of injecting nodes.
Thus, this paper carried out the modeling and simulation research on the natural gas network with multiple green hydrogen types and multiple injection nodes, discussing the dynamic change of the hydrogen concentration in the pipelines in different scenarios. The main contributions of this paper are as follows.
(1)
A power flow calculation model for the isothermal steady-state natural gas network is established and solved by the finite element node method, which provides initial calculation values of gas pressure and flow rate for the hydrogen diffusion dynamic simulation of hydrogen injection in the natural gas network.
(2)
For three types of renewable energy power production scenarios of hydropower stations, wind farms, and PV power stations, the mathematical model of the surplus electric power that can be used for hydrogen production by water electrolysis for each type is established. Among them, hydropower output is related to the head, water flow rate, and unit efficiency, and the output can be considered stable within a dispatching day; wind power output considers the superposition of four velocities of base wind velocity, gust wind velocity, ramp wind velocity, and noise wind velocity; PV power output considers the superposition of the two components of the intraday light component and the random weakening component.
(3)
The effects of two factors, convection, and diffusion, on the dynamic change process of hydrogen concentration are analyzed. The convection–diffusion model with variable diffusion coefficient considering the change of diffusion coefficient and the convection–diffusion model with constant diffusion coefficient suitable for convection-dominated scenarios are established; solving methods based on the central difference and upwind difference scheme are proposed.
(4)
The dynamic distribution of hydrogen concentration in pipelines under different hydrogen injection modes is simulated on a seven-node natural gas network. Based on the simulation analysis, the hydrogen blending simulation of the studied natural gas network belongs to the convection-dominated problem, so the convection–diffusion model with constant diffusion coefficient is adopted to solve it. In addition, the upwind difference scheme is chosen to solve the simulation model. Although the truncation error is high, the negative hydrogen concentration caused by the central difference scheme can be avoided.
(5)
To compare the influence of different renewable energy output characteristics on the distribution of hydrogen concentration and the safety of pipeline operation, hydrogen blending stations using hydropower, wind power, and solar power to produce hydrogen are set up at three nodes in the natural gas network. Furthermore, three scenarios of “high penetration of solar power”, “high penetration of wind power”, and “balanced penetration of solar power and wind power” are set up, respectively. The simulation results show that in the solar-power-dominated scenario, the hydrogen concentration exceeds the limit for more time and the overall hydrogen production is low. In contrast, hydropower and wind power are more compatible with hydrogen production by water electrolysis, and the hydrogen concentration in natural gas pipelines is more evenly distributed.

2. Steady-State Simulation of Natural Gas Network

2.1. Modeling of Isothermal Steady-State Natural Gas Network

First, for a loop-free natural gas network, the network state can be described by two matrices: node-pipeline matrix A and loop-pipeline matrix B [26].
As shown in (1), the element aij of the node-pipe matrix A can be deduced according to Kirchhoff’s first law. The pressure of the reference node is set as known.
a i j = { 0 ,   pipe   j   is   not   connected   to   node   i 1 ,   pipe   j   flows   to   node   i   1 ,   pipe   j   flows   out   of   node   i
Assuming that the clockwise direction is the reference direction of the loop, the element bnj of the loop-pipe matrix B can be deduced according to Kirchhoff’s second law, as shown in (2).
b n j = { 0 ,   pipe   j   does   not   belong   to   loop   n   1 ,   pipe   j   belongs   to   loop   n   and   gas   flows   counterclockwise   in   pipe   j 1 ,   pipe   j   belongs   to   loop   n   and   gas   flows   clockwise   in   pipe   j
According to the graph theory, matrix A is orthogonal to matrix B, that is, the inner product of any vector of A and any vector of B is equal to zero, as shown in (3):
A × B T = B × A T = 0
Matrix A and B describe the relationship between nodes, pipes, and loops, and also serve as the link to connect loop pressure drop, pipeline pressure drop, and node pressure. Analogous to the power flow model, the natural gas network state can be described by these two matrices.
For any natural gas network: set the number of nodes (including the reference node) as i, the number of loops as n, and the number of pipelines as j. The relationship among the three is shown in (4):
j = n + i 1
For any node, the flow into the node is equal to the flow out of the node (Kirchhoff’s first law). Accordingly, the nodal flow equation is shown in (5):
A ( i 1 ) × j Q j × 1 = q ( i 1 ) × 1
where q is the gas load vector, m3/s; Q is the branch flow vector, m3/s.
For any closed loop, its pressure drop is zero (Kirchhoff’s second law), and the loop pressure drop equation is obtained, as shown in (6).
B n × j Δ p j × 1 = 0 n × 1
where Δp denotes the vector of pipeline pressure drop, Pa.
The pipeline pressure drop equation is shown in (7), where the pipeline pressure drop is equal to the pressure difference between the inlet and the outlet of the pipeline.
Δ p j × 1 = A j × ( i 1 ) T p ( i 1 ) × 1
where p is the node pressure vector relative to the reference node, Pa.
When the inner diameter of the pipeline is known, the unknowns of each pipeline are its pressure drop and pressure. So far, there are 2j unknowns, and the number of equations that can be listed is j + (i − 1) + n = 2j, so the linear equation system has a unique solution.
Secondly, there is a relationship between the pipeline flow rate and the pipeline pressure drop as shown in (8), which is called the pipeline flow rate pressure drop equation.
Δ p = S | Q | Q
where S represents the pipeline flow resistance coefficient matrix.
For low pressure networks (0–0.01 MPa), the pipeline pressure drop and pipeline flow resistance coefficient can be calculated according to (9) [27]:
{ Δ p a b = p a p b S = κ 1 λ d 5 ρ T T n L
where Δpab represents the pressure drop between node a and node b, Pa; pa and pb represent the pressure at nodes a and b, Pa, respectively; λ represents the friction resistance coefficient of the pipeline and is dimensionless, and its relationship with the Reynolds number Re is related to the gas flow mode; d represents the inner diameter of the pipe, mm. ρ represents gas density, kg/m3. Tn represents the absolute temperature under standard conditions, 273.15 K; T is the actual temperature, K; L represents the length of the pipe, m; κ1 represents the empirical constant for low pressure networks, 6.26 × 10⁷.
For medium and high pressure networks (>0.01 MPa), the pipeline pressure drop and pipeline flow resistance coefficient can be calculated according to (10) [27]:
{ Δ p a b = p a 2 p b 2 = ( p a + p b ) ( p a p b ) = 2 p 0 ( p a p b ) S = κ 2 λ d 5 ρ T T n Z L
where Z represents the compressibility factor, dimensionless; κ2 represents the empirical constant for medium and high pressure networks, 1.27 × 10¹⁰.
Define the j × j diagonal admittance matrix G, and its element gij is shown in (11):
{ g i j = 1 S j | Q j | ,   i = j g i j = 0 ,   i j
Combining the above Equations (5)–(8) and (11), the matrix form of the relationship between the pipeline flow rate and the node pressure is obtained, as shown in (12) and (13).
Q j = Δ p j S j | Q j |     Q j × 1 = G j × j Δ p j × 1
A ( i 1 ) × j G j × j A j × ( i 1 ) T p ( i 1 ) × 1 = q ( i 1 ) × 1
Let Y = AGA, (13) can be rewritten as (14):
Y ( i 1 ) × ( i 1 ) p ( i 1 ) × 1 = q ( i 1 ) × 1

2.2. Solving Method

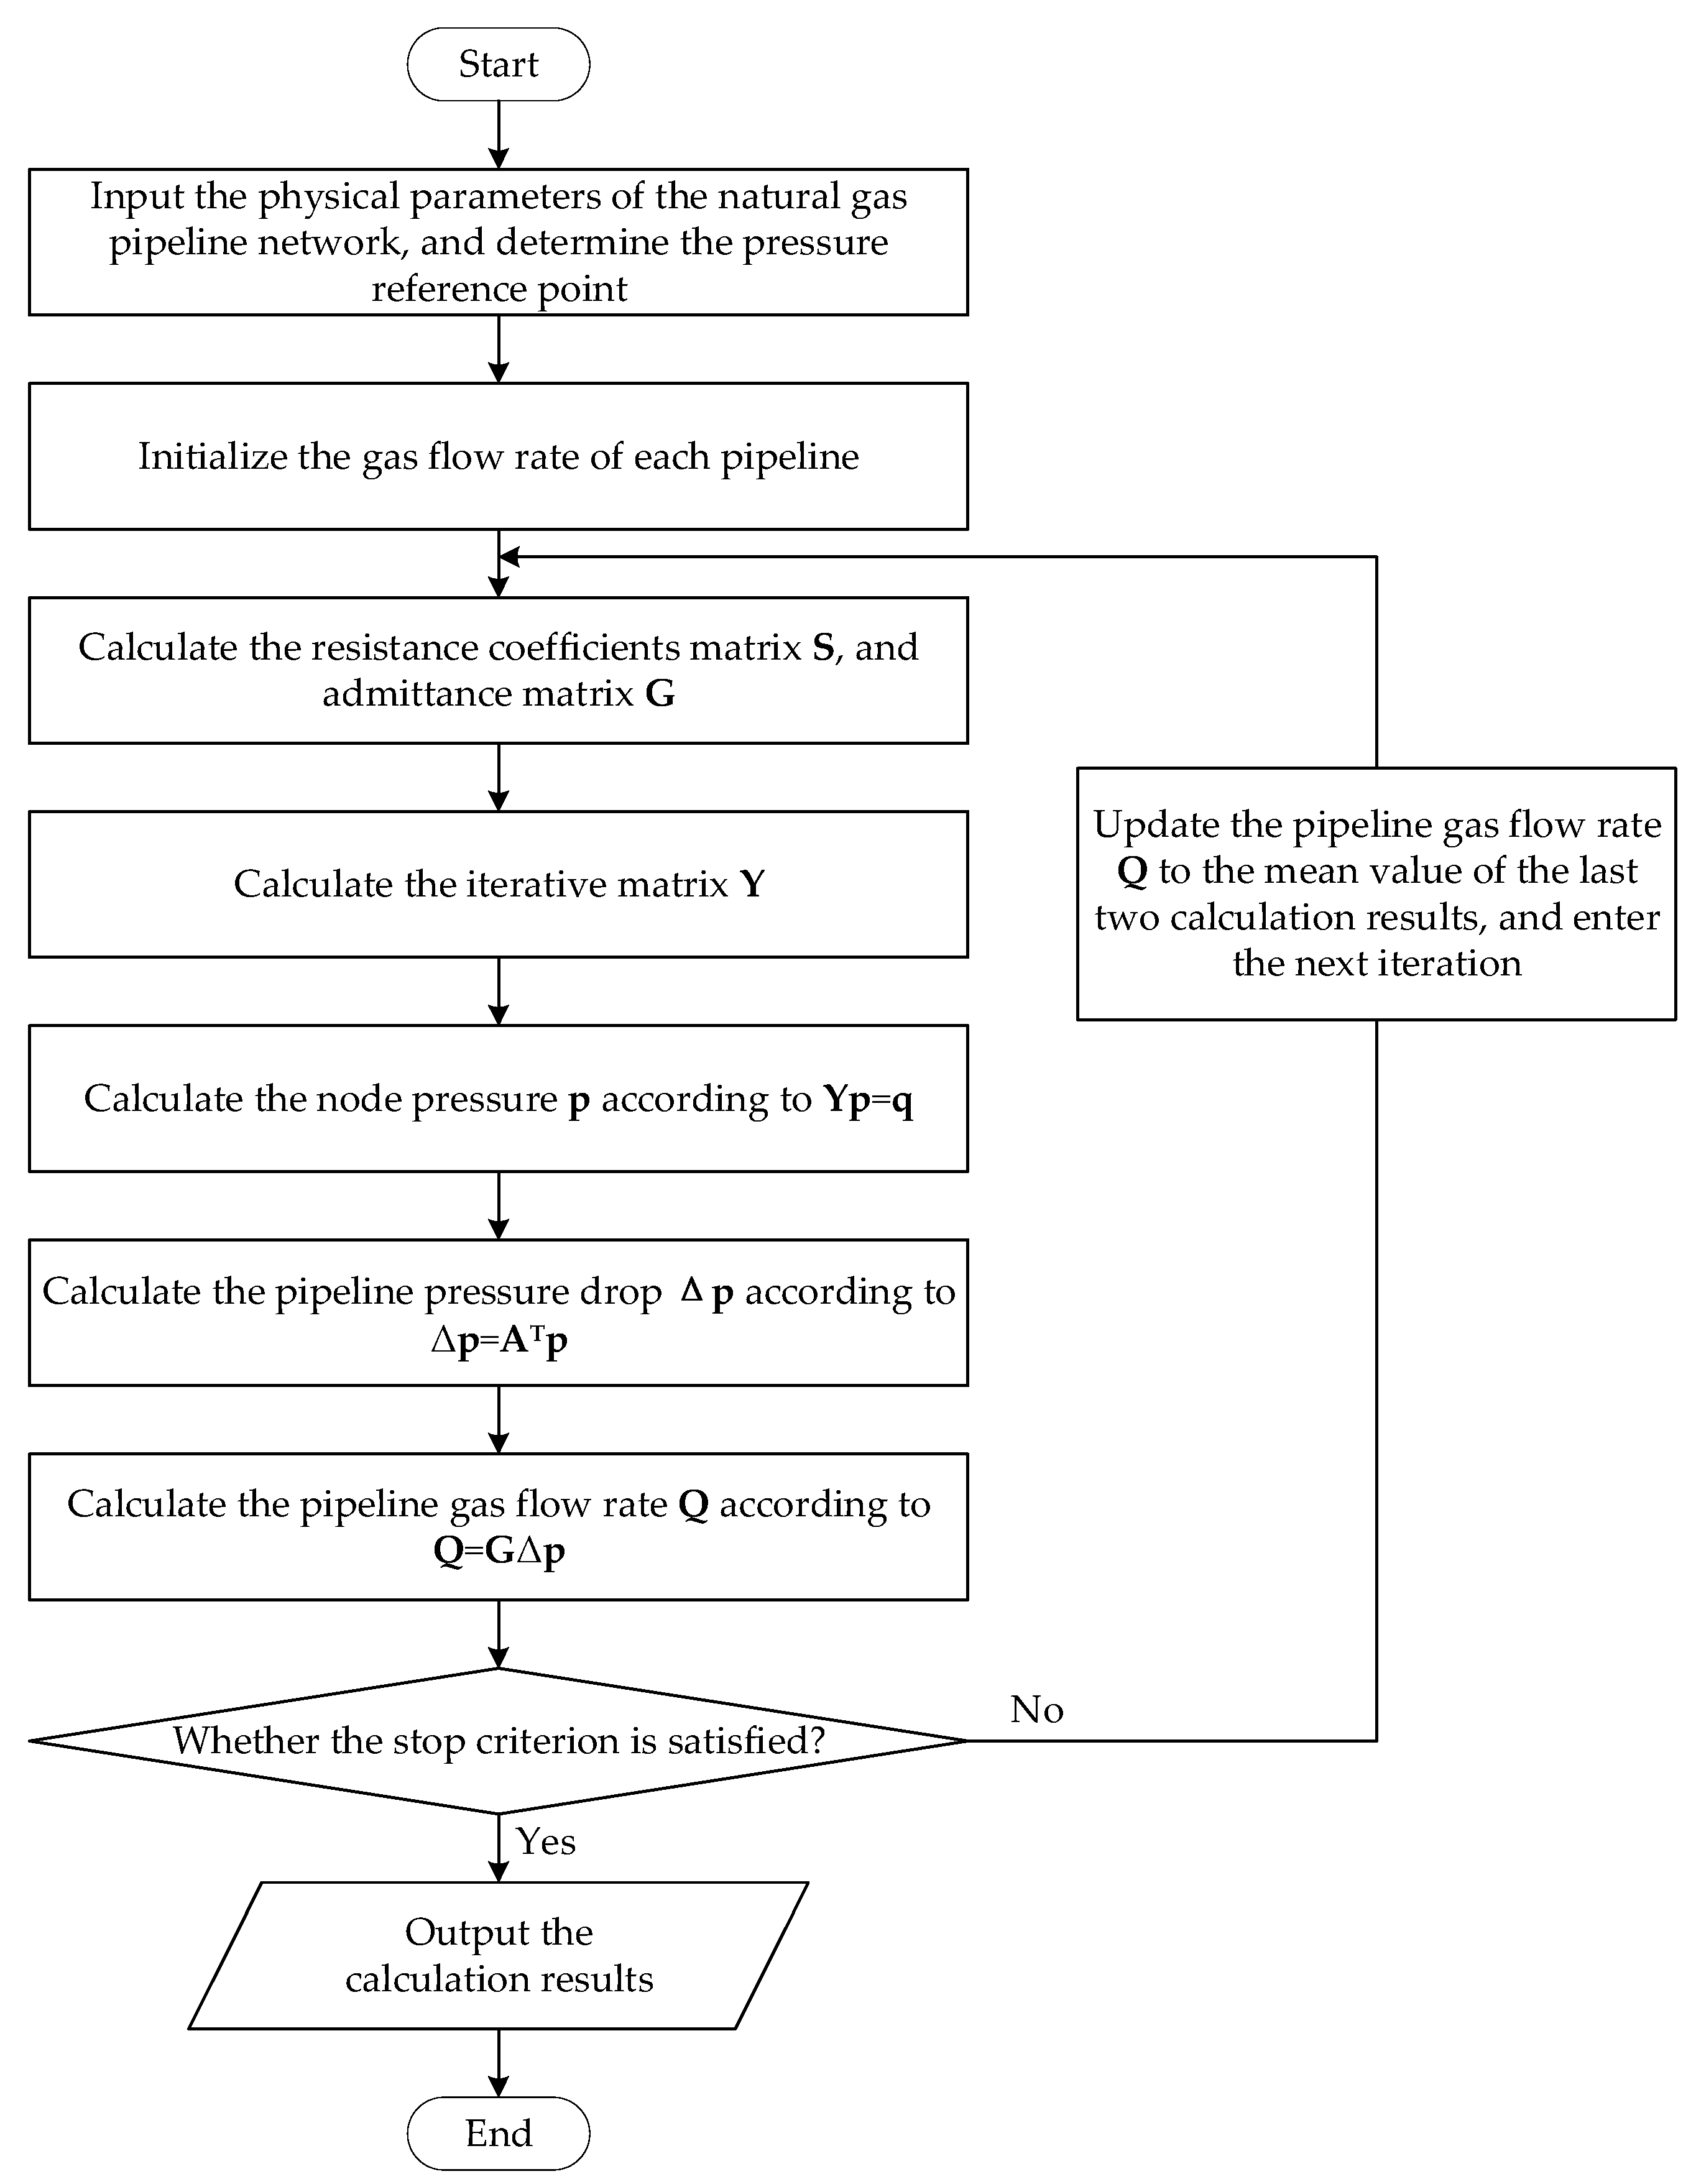
In this section, the widely used method of solving nodal equations is used to solve the isothermal steady-state model of the natural gas pipeline network [28]. Specifically, the finite element node method is adopted, which does not have high requirements for the initial value of pipeline flow rates. Meanwhile, the rate of convergence and calculation accuracy is relatively satisfactory. The procedure of the iterative solution is shown in Figure 2.
To use the finite element node method to solve the problem, it is necessary to set the initial value of the flow rate of each pipeline as its estimated value, and then correct the value of flow rate through continuous iteration to obtain the final accurate value.
The steady-state simulation model and solution method of the natural gas network presented in this section can provide the initial value of the gas flow rate and pressure for the subsequent dynamic simulation of hydrogen diffusion in the natural gas network.

3. Modeling of Hydrogen Production in Different Scenarios

At present, the technology of hydrogen production by water electrolysis is relatively mature and can be applied to industrial production. Since the research focus of this paper is the influence of the injection of green hydrogen on the hydrogen concentration distribution in natural gas pipelines, the technology of hydrogen production by water electrolysis will not be explained here.
Ideally, about 3.55 kWh of electricity is needed to produce 1 m3 of hydrogen [29,30]. Then, by integrating the surplus renewable power input into the electrolyzer, the amount of produced hydrogen can be obtained by converting the power consumption coefficient. Therefore, for the three renewable energy hydrogen production scenarios of hydropower, wind power, and solar power, the electric power output directly affects the amount of hydrogen production and the gas mixture. This section presents the calculation methods of three types of renewable energy power output from hydropower stations, wind farms, and PV power stations.

3.1. Power Output of Hydropower Station

The power output of the hydropower station can be calculated by (15) [31]:
P h y d r o , o u t = γ H Q w a t e r η h y d r o × 10 - 6
where Phydro,out is the power output of the hydropower station, MW; γ is the specific weight of water, 9810 N/m3; H is the effective head, m; Qwater is the water flow rate, m3/s; ηhydro is the efficiency of the power station unit, including the turbine efficiency and the generator efficiency, dimensionless.
The power output of the hydropower station can be divided into two parts: one part is integrated into the upper power grid, and the other part cannot be integrated into the grid but can be used for hydrogen production. The hydropower output that can be used to produce hydrogen is expressed as (16):
P h y d r o - H = { 0 ,   P h y d r o , o u t < P h y d r o , g r i d max P h y d r o , o u t P h y d r o , g r i d max ,   P h y d r o , o u t > P h y d r o , g r i d max
where Phydro-H is the hydropower output that can be used to produce hydrogen, MW; P h y d r o , g r i d max is the maximum output of the hydropower station integrated into the grid, MW.
According to (15), the hydropower output is proportional to the water flow rate. Since the water flow rate is relatively stable, the hydropower output can be considered to be unchanged on the time scale of 24 h. Therefore, after the hydrogen produced in the hydropower station is mixed with natural gas in the gas mixing station, the hydrogen concentration of the HCNG in the gas mixing station does not change, which can be regarded as a constant.

3.2. Power Output of Wind Farm

This section adopts the widely used four-component model of wind, and the wind velocity, Vwind, acting on the wind turbine is shown in (17) [32]:
V w i n d = V A + V B + V C + V D
where VA, VB, VC, and VD represent the base wind velocity, the gust wind velocity, the ramp wind velocity, and the noise wind velocity, respectively, m/s.
The calculation method for each wind velocity is given below.
  • The base wind velocity VA can be approximated by the Weibull distribution parameter, which is derived from the wind measurement data of the wind farm.
It is determined by the mathematical expectation of the Weibull distribution, that is, (18):
V A = A w b · Γ ( 1 + 1 K w b )
where Awb and Kwb are the scale parameter and shape parameter of Weibull distribution, respectively, dimensionless; Γ is the gamma function, dimensionless.
b.
For the gust wind velocity VB, the abrupt change of wind velocity can be expressed by (19):
V B = { 0 ,   t < T 1 G ( max G / 2 ) { 1 cos 2 π [ ( t / T G ) ( T 1 G / T G ) ] } ,   T 1 G t < T 1 G + T G 0 ,   t T 1 G + T G
where T1G is the time when the abrupt change starts, min; TG is the change period, min; max G is the maximum value of gust wind velocity, m/s.
c.
For the gust wind velocity VB, the abrupt change of wind velocity can be expressed by (19):
V C = { 0 ,   t < T 1 R max R [ 1 ( t / T 2 R ) / ( T 1 R T 2 R ) ] ,   T 1 R < t < T 2 R max R ,   T 2 R t < T R + T 2 R 0 ,   t T R + T 2 R
where max R is the maximum ramp wind velocity, m/s; T1R is the start time of the gradual change, min; T2R is the end time of the gradual change, min; TR is the holding time after the gradual change, min.
d.
For the noise wind velocity VD, the randomness is generally represented by random noise, as shown in (21):
V D = 2 i = 1 N s a m [ S V ( ω i ) Δ ω ] 1 / 2 cos ( ω i + φ i ) ω i = ( i 1 2 ) Δ ω S V ( ω i ) = 2 K N F 2 | ω i | π 2 [ 1 + ( F ω i / μ π ) 2 ] 4 / 3
where Nsam is the number of spectral sampling points, dimensionless; i is the index to the sampling point, and i ∈ [1, …, Nsam]; ωi denotes the angular frequency of sampling point i, rad/s; Δω is the sampling step size, rad/s; φi is a random variable obeying a uniform distribution between [0, 2π], rad/s; KN is the surface roughness coefficient, 0.004, dimensionless; F is the turbulent scale, m; μ is the average wind velocity at the relative height, m/s.
For a wind power station whose parameters are determined, its power output is proportional to the cube of the wind velocity, as shown in (22) [33]:
P w i n d , o u t = 0.5 C w i n d ρ a i r A w t V w i n d 3 × 10 - 6
where Pwind,out is the power output of the wind farm, MW; Cwind is the dimensionless wind energy utilization coefficient, which depends on the type and operating conditions of the wind turbine; ρair is the air density, kg/m3; Awt is the area swept by the wind turbine blades, m2.
Similar to hydropower stations, the output of wind farms can be divided into two parts: one part is integrated into the upper power grid, and the other part is used for hydrogen production. Therefore, the wind power output that can be used to produce hydrogen is expressed by (23):
P w i n d - H = { 0 ,   P w i n d , o u t < P w i n d , g r i d max P w i n d , o u t P w i n d , g r i d max ,   P w i n d , o u t > P w i n d , g r i d max
where Pwind-H is the wind power output that can be used to produce hydrogen, MW; P w i n d , g r i d max is the maximum output of the wind farm integrated into the grid, MW.

3.3. Power Output of PV Power Station

Photovoltaic (PV) cells utilize the photovoltaic effect, capable of converting solar energy into direct current [34]. The energy source of solar power output is light intensity. In this section, the light intensity, Ssolar, is divided into two components: the light component SA, W/m2, and the random weakening component SB, W/m2. The latter reflects the attenuation effect of uncertain cloud cover on solar irradiance [35].
  • The intraday light component SA describes the process of the light intensity changing from weak to strong and then weak again in a day, which can be expressed by (24):
S A = { 0 ,   t < T r S w max sin [ π ( t T r ) / ( T d T r ) ] ,   T r < t < T d 0 ,   t > T d
where S w max is the maximum light intensity statistical value under certain local weather, which can be obtained from the local light intensity statistics, W/m2; Tr and Td represent the sunrise time and sunset time, respectively, min.
b.
The random weakening component SB describes the change of light intensity caused by the meteorological factor of dark clouds and is simulated using random number generation. Divide the time from sunrise to sunset into equal parts, and generate random numbers for each part to simulate whether dark clouds appear. Then, the light intensity of part i can be calculated by (25):
S B i = λ l S A X i
where Xi obeys the Bernoulli distribution, dimensionless; λl represents the weakening degree of the cloud to the light intensity, and its mean value can be obtained from the simple experimental measurement in the field, dimensionless.
In conclusion, the total light intensity is shown in (26):
S s o l a r = S A + S B
According to the Ref. [36], under the condition of constant temperature, for a photovoltaic array with various parameters determined, the maximum power point has a strong positive correlation with lighting conditions, as shown in (27):
P s o l a r , o u t = S s o l a r × cos θ × η m × A p v × η p v × 10 - 6
where Psolar,out is the power output of the PV power station, MW; θ is angle of incidence of PV panels, °; ηm and ηpv are the efficiency of MPPT and PV panels, respectively, dimensionless; Apv is the area of PV panels, m2.
Similar to hydropower stations and wind farms, the output of PV power stations can be divided into two parts, and the part that can be used for hydrogen production is described by (28):
P s o l a r - H = { 0 ,   P s o l a r , o u t < P s o l a r , g r i d max P s o l a r , o u t P s o l a r , g r i d max ,   P s o l a r , o u t > P s o l a r , g r i d max
where Psolar-H is the solar power output that can be used to produce hydrogen, MW; P s o l a r , g r i d max is the maximum output of the PV power station integrated into the grid, MW.

4. Dynamic Simulation of Hydrogen Concentration in Natural Gas Network

Based on the knowledge of fluid mechanics, this section considers the effects of convection and diffusion on the transportation of natural gas and hydrogen component, establishing a hydrogen dynamic diffusion model based on the convection–diffusion equation [37]. It should be noted that the following modeling of hydrogen diffusion in natural gas pipelines is still based on the isothermal assumption.

4.1. Fundamental of Fluid Dynamics

4.1.1. Convection

Convection is the concentration transfer due to the whole directional motion of the fluid. For example, when gas B is dissolved in gas A, gas B will also flow with the flow of gas A. In other words, when the low-concentration species is in the high-concentration species and the high-concentration species dominates the momentum of the system, the whole directional motion of the fluid makes a flux contribution to the low-concentration species. Assuming that the reference velocity is that of the high-concentration species, the convection flux N can be in the following form:
N = C α
where C is the mass concentration of the gas, kg/m3; α is the fluid velocity, m/s.
Combined with the continuity equation (30), the concentration change due to convection at a certain position can be obtained, as shown in (31):
ρ t + ( ρ v ) x = 0
C t = N x = α C x C u x
where t is the index to time, min; x is the index to pipeline length, m; ρ in (30) is the fluid density, kg/m3; v in (30) is the gas flow rate, m/s; u in (31) denotes the fluid velocity variable that varies along the pipeline.
In a natural gas pipeline, assuming that natural gas flows continuously and uniformly, then C u x = 0 , and the mass of the entire fluid is conserved. The one-dimensional convection equation can be obtained, as shown in (32):
C t + α C x = 0
This equation has an analytical solution and describes the process of the concentration C propagating in a certain direction with velocity α.

4.1.2. Diffusion

According to Fick’s first law, the molar flux due to diffusion is proportional to the concentration gradient, as shown in (33):
J + D C x = 0
where J is the diffusion flux, defined as the ratio of the amount of molecules passing through a unit cross-sectional area in a very short time to time, kg/m2·s; D is the diffusion coefficient which is related to temperature, fluid viscosity, and molecular size, m2/s.
The empirical formula of D is shown in (34) and (35):
D = ξ p
ξ = 1 × 10 3 T 1.75 1 M A + 1 M B [ ( V A ) 1 3 + ( V B ) 1 3 ] 2
where T is the fluid temperature, K; p is the total pressure, Pa; MA, MB are the molecular weights of components A and B, g/mol; ΣVA, ΣVB are the molecular diffusion volumes, cm3/mol; ξ is only related to temperature and gas species, and it can be considered as a constant when the temperature is constant.
Fick’s first law applies only to steady-state calculations, while the diffusion of hydrogen component in HCNG should be considered from a dynamic perspective. Therefore, combining the continuity equation (36), Fick’s second law is derived, as shown in (37):
C t + J x = 0
C t = x ( D x C )

4.2. Hydrogen Diffusion Model Based on Convective–Diffusion Equation

4.2.1. Convective–Diffusion Model with Variable Diffusion Coefficient

Considering the convection and diffusion described in Section 4.1, and without external power input, the convective–diffusion equation with variable diffusion coefficient can be obtained, as shown in (38):
C t + α C x = x ( D C x )
In a natural gas pipeline, when the fluid velocity is much less than Mach 0.3, the fluid can be regarded as incompressible. According to the Fanning formula, the pipeline pressure loss is expressed as (39):
Δ p x = λ L x D ρ u 2 2 = k L x
For a section of the pipeline, based on its upstream pipeline calculation results of hydrogen concentration, the density in (39) is updated according to (44), which will be explained later. Then, the relationship between the pressure at a point in the pipeline and its position can be expressed as (40):
p x = p k L x
It is assumed that the initial hydrogen concentration in the pipeline is zero, and the hydrogen concentration at the injection node of the pipeline is known. Combining these boundary conditions and initial values, the convective–diffusion model with variable diffusion coefficients is obtained, as shown in (41):
{ C t + α C x = x ( D C x ) d p d x = k D = ξ p C ( 0 ,   t ) = C H 2 ,   t ( 0 ,   T ) C ( x ,   0 ) = 0 ,   x ( 0 ,   L ) p ( 0 ) = p i n l e t
where T is the time boundary, considering that the dispatch time of natural gas generally takes several hours, this paper takes 1440 min (24 h); L is the overall length of the pipeline, m.

4.2.2. Convective–Diffusion Model with Constant Diffusion Coefficient

If the diffusion coefficient is constant, (38) can be transformed into (42):
C t + α C x = D 2 C x 2
The equation is a linear Burgers equation, and in some cases, there is an analytical solution. Since solving the analytical solution requires relatively rich mathematical knowledge, this paper only seeks its numerical solution.
Similar to Section 4.2.1, the convective–diffusion model with constant diffusion coefficient can be obtained after considering the boundary conditions and initial values, as shown in (43):
{ C t + α C x = D 2 C x 2 C ( 0 ,   t ) = C H 2 ,   t ( 0 ,   T ) C ( x ,   0 ) = 0 ,   x ( 0 ,   L ) C ( L ,   T ) = C H 2
This model is suitable for the case where the inner diameter of the natural gas pipeline is large, the pressure difference is small, and the coefficient of the convection term is much larger than the coefficient of the diffusion term (that is, the convection-dominated scenario).

4.3. Changes of Diffusion Coefficient in HCNG

It can be seen from (34) and (35) that the diffusion coefficient D has a certain proportional relationship with the pressure p. Assuming that hydrogen is fully mixed with natural gas after being injected into the hydrogen blending station, the concentration of HCNG injected into the natural gas network by the hydrogen blending station is uniform.
In this paper, a fixed-volume gas blending method is adopted, that is, the volume of the blending zone is determined. To be specific, the upstream pipeline at the hydrogen blending station injects HCNG into the gas blending zone, and the produced green hydrogen near the hydrogen blending station is also injected into the gas blending zone. In the hydrogen blending station, the gas temperature and volume remain unchanged, and the density of the gas increases due to the filling of hydrogen. When the mass concentration of the hydrogen component is Cm, the fluid density after blending can be calculated according to (44):
ρ = 1 1 C m ρ
where ρ is the density before blending and ρ′ is the density after blending, kg/m3.
The compressibility factor Z is related to both the gas composition Cm and the pressure p [38]. When the HCNG gas composition is determined and the hydrogen concentration is relatively low, the relationship between Z and p can be linearly fitted, which can be simply expressed as (45):
Z = a p + b
where a = a(Cm, T) and b = b(Cm, T) are the fitting coefficients. The unit of a is Pa−1 and b is dimensionless. The detailed calculation process of a and b can be seen in [38,39].
The equation of state of real gas is shown in (46):
p M = ρ Z R T
where M is the molecular mass, kg/mol; R is the general gas constant, J/(mol·K); T is the temperature, K.
According to (46), when the molecular mass M and pressure ρ of upstream pipelines are known, the relationship between Z and p can also be determined. Therefore, the values of Z and p can be determined according to the intersection of the line segments drawn by (45) and (46), and then the diffusion coefficient D can be updated.

4.4. Solving Method

For the partial differential hydrogen diffusion model presented in Section 4.2, this section proposes two solution schemes of central difference and upwind difference successively.

4.4.1. Central Difference

Divide the solution domain Ω = {(x, t)|0 < x < L, 0 < t < T} equidistantly, assuming m, nN+, so the space step size is x = L m , and the time step size is t = T n . Then, denote xi = iΔx (0 < i < m), tj = jΔt (0 < j < n), and C i j = C(xi, tj).
Substituting the relationship between diffusion coefficient and pipeline length in (34) and (39) into (38), the explicit central difference scheme is shown in (47):
C i j + 1 C i j Δ t + ( α + ξ k x i 2 ) C i + 1 j C i 1 j 2 Δ x = ξ k x i C i + 1 j 2 C i j + C i 1 j Δ x 2
The explicit central difference scheme of (42) is shown in (48):
C i j + 1 C i j Δ t + α C i + 1 j C i 1 j 2 Δ x = D C i + 1 j 2 C i j + C i 1 j Δ x 2
The truncation error of the central difference is Ox2 + Δt), and the accuracy is high. However, in some cases, the central difference method overestimates the convective flow rate, so that there are negative values of the hydrogen concentration in the nearby meshes, which is inconsistent with the actual physical meaning.

4.4.2. Upwind Difference

The solution domain division of the upwind difference scheme is the same as in Section 4.4.1. Substitute the relationship between the diffusion coefficient and pipeline length in (34) and (39) into (38), and the explicit upwind center difference scheme is obtained, as shown in (49):
C i j + 1 C i j Δ t + ( α + ξ k x i 2 ) C i j C i 1 j Δ x = ξ k x i C i + 1 j 2 C i j + C i 1 j Δ x 2
The explicit central difference scheme of (42) is shown in (50):
C i j + 1 C i j Δ t + α C i j C i 1 j Δ x = D C i + 1 j 2 C i j + C i 1 j Δ x 2
The truncation error of the upwind difference scheme is Ox + Δt), which is slightly higher than that of the central difference scheme. Since the problem to be solved in this section is about the hydrogen concentration, the upwind difference scheme is a more suitable choice, which can overcome the negative value of the concentration in the central difference method.

4.5. Overall Simulation Process

So far, the distribution of hydrogen concentration Cm in natural gas pipelines can be obtained. To facilitate the judgment of whether the hydrogen concentration exceeds the permitted limit, hydrogen concentration needs to be converted into the mass fraction, as shown in (51).
f m = C m ρ
where fm is the mass fraction, which is dimensionless and varies between 0 and 1.
It is assumed that the natural gas pipeline in this paper can withstand the transport of HCNG with an upper hydrogen volume fraction of 20%. The relationship between the hydrogen mass fraction and the volume fraction is given by (52):
f v ρ h f v ρ h + ( 1 f v ) ρ n g = f m
where fv is the volume fraction, which is also dimensionless and varies between 0 and 1.
According to (52), the corresponding upper limit of the hydrogen mass fraction is 3.03%. Then, when the mass fraction of hydrogen in the pipeline exceeds 3.03%, it is considered that the hydrogen concentration exceeds the limit.
Based on the above analysis, the detailed simulation process of the hydrogen diffusion in natural gas pipelines is presented in Figure 3.
As shown in Figure 3, inputs to the hydrogen diffusion model include natural gas network parameters, isothermal steady-state simulation results (pipeline flow rates and node pressures), and green hydrogen production information near the hydrogen blending point.
According to the network parameters and isothermal steady-state simulation results of the studied case, the type of convection–diffusion equation to be adopted is determined. Then, the hydrogen diffusion model is built based on the selected convective–diffusion equation.
Before solving the hydrogen concentration, the initial value of each node is set to be the value of the outlet of the upstream pipe connected to it. If the node is a hydrogen injection node, the concentration change caused by hydrogen injection needs to be superimposed.
If the convective–diffusion model with variable diffusion coefficient is adopted, the value of fluid density, pipeline pressure and diffusion coefficient of each pipeline will be updated based on its upstream pipeline calculation results. Otherwise, the spatial and temporal calculation step sizes are determined, and the hydrogen diffusion model is solved with certain difference scheme.
Based on the hydrogen concentration of all pipelines at each time and each position, the mass fraction is calculated to determine whether the hydrogen concentration exceeds the permitted limit.
The following case study is performed on a computer with an i7-9700KF CPU and 32 GB of memory. The programs are developed and solved using MATLAB R2021b.

5. Case Study

5.1. Case Description

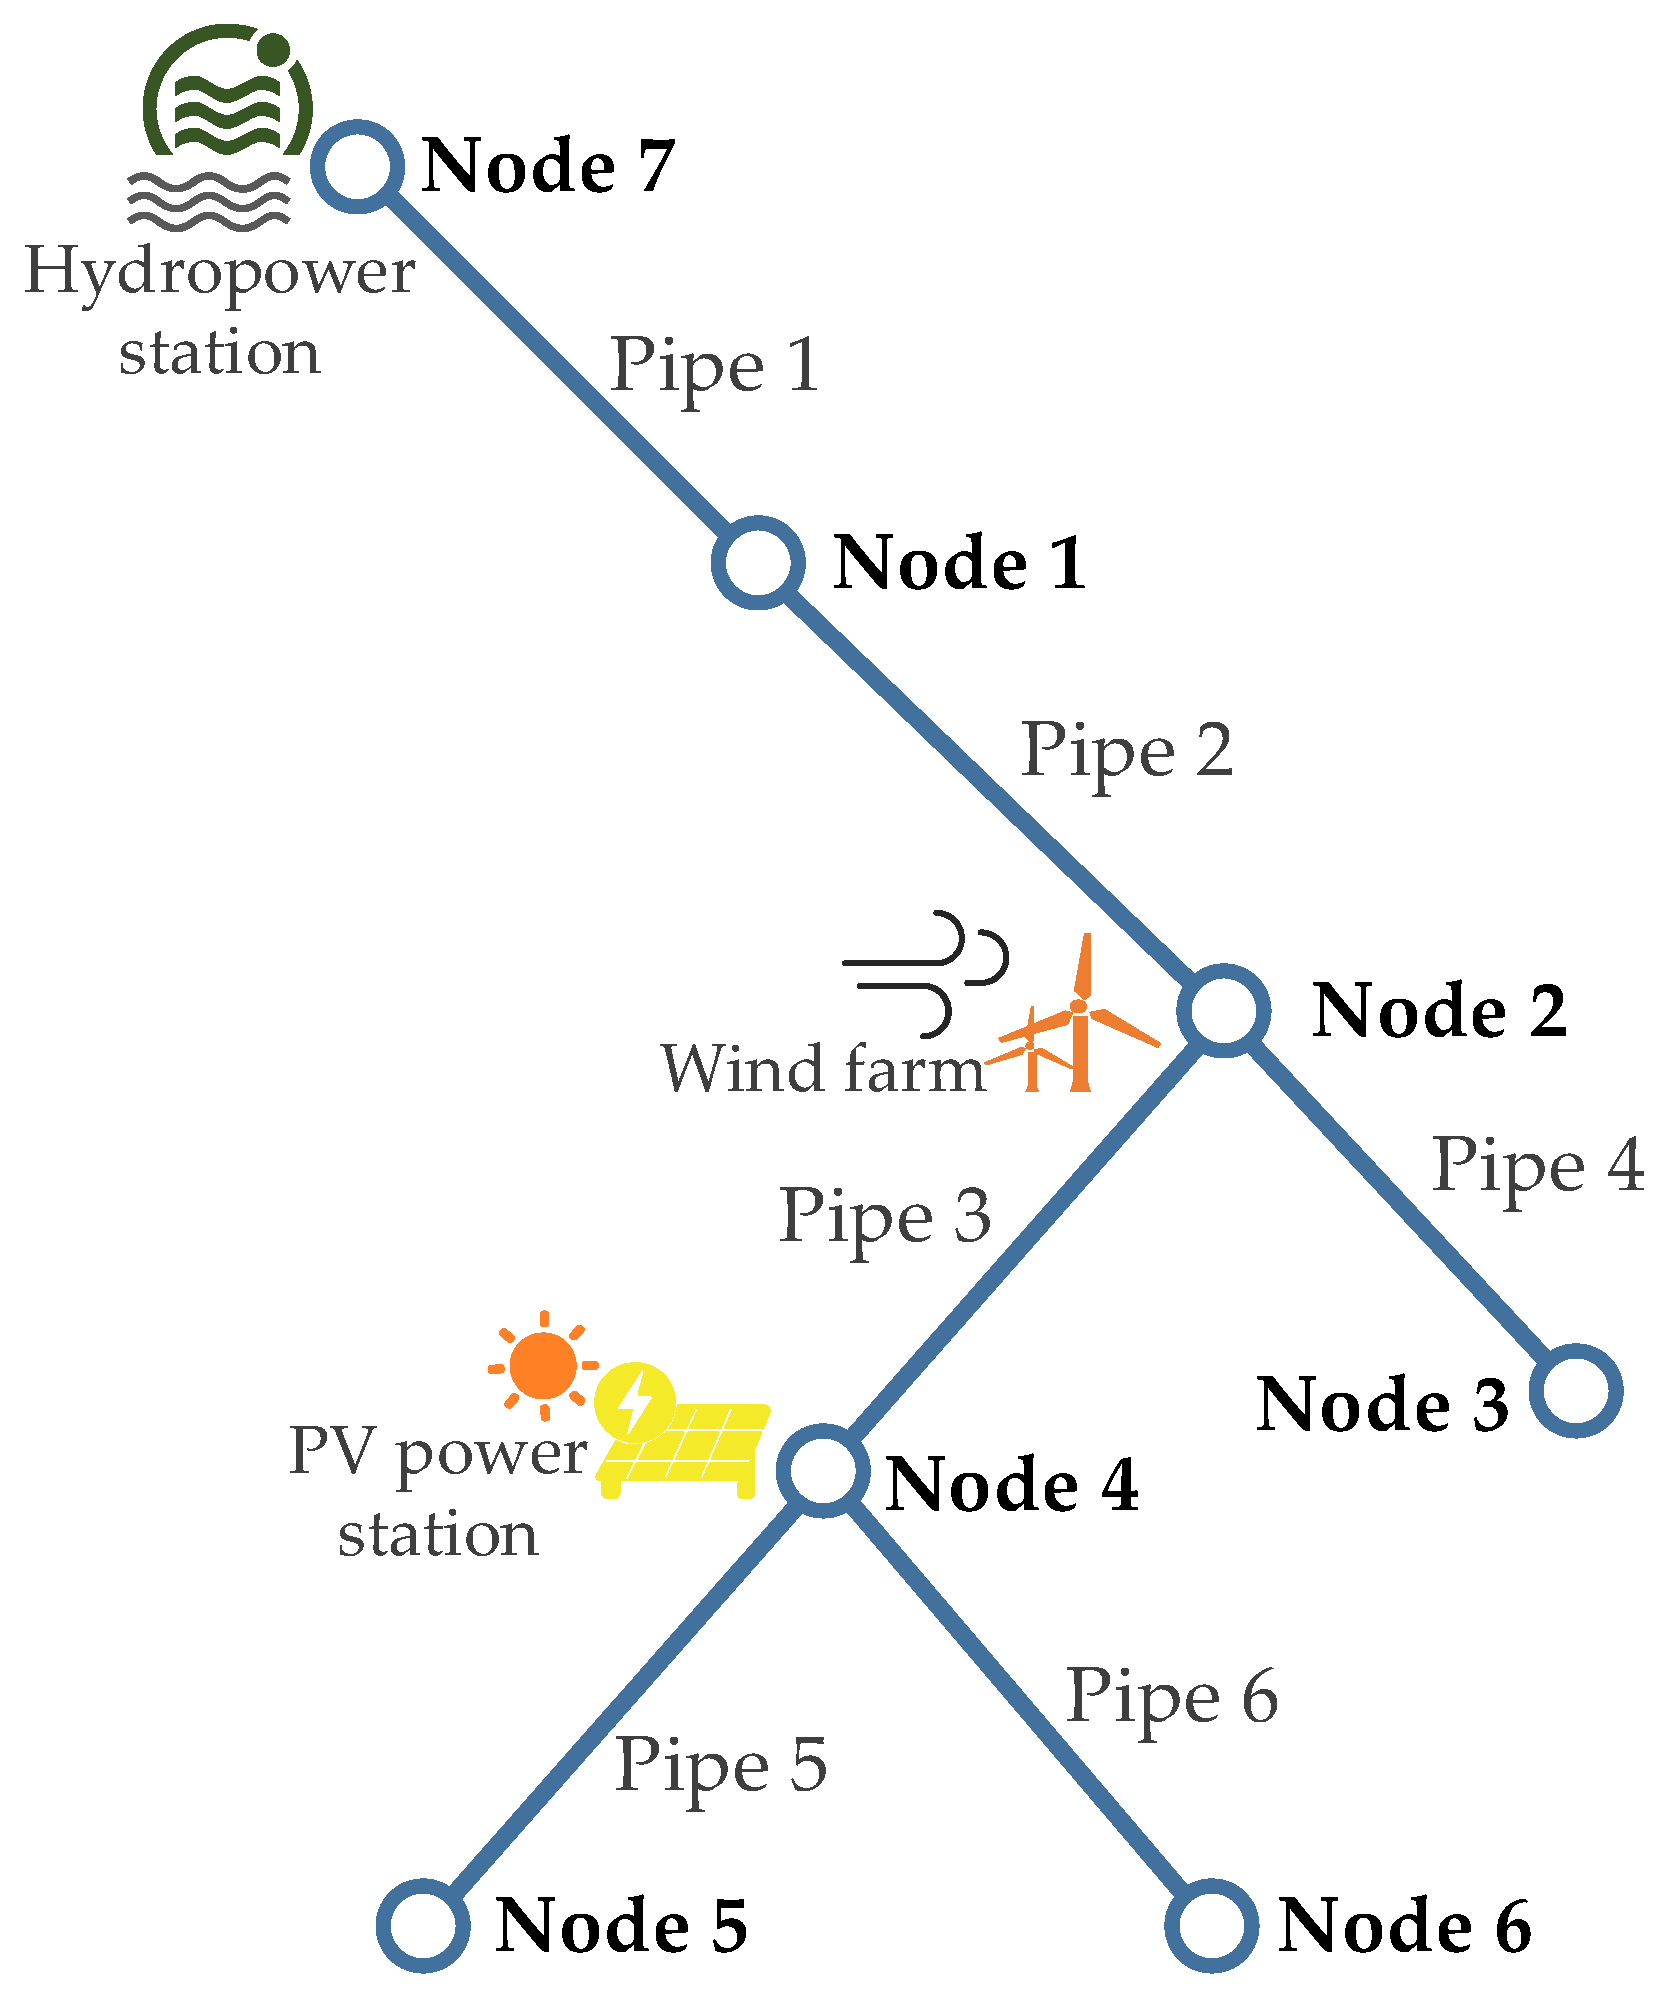
The case study in this paper was carried out on the natural gas pipeline network shown in Figure 4. The data of each pipeline is given in Appendix A, Node 7 was set as the reference node, and the pressure level was 0.8 MPa.
It was assumed that there is a hydropower station near Node 7, and the hydrogen produced by the surplus hydropower is allowed to be mixed and injected. Similarly, it was assumed that Node 2 is the hydrogen production node of the wind farm, and Node 4 is the hydrogen production node of the PV power station.
It should be pointed out that the natural gas topology in Figure 4 was artificially designed. In fact, it is rare in reality that a small-scale natural gas network has the conditions for hydropower, solar power, and wind power development at the same time. The seven-node natural gas pipeline network in this paper was constructed to carry out scenario analysis and draw some qualitative and quantitative conclusions, which can provide a reference for the hydrogen blending work on natural gas pipelines.
The calculation method in Section 3 was used to calculate the changes of the blended hydrogen flow rate at these three nodes.

5.2. Steady State Simulation of the Natural Gas Network

First, the isothermal steady-state simulation of the natural gas network was modeled and solved according to Section 2. The simulation results of the pipeline flow rate and node pressure, as well as the annotation in the natural gas network, are shown in Figure 5, providing initial calculation values for the hydrogen diffusion dynamic simulation of hydrogen injection.

5.3. Simulation Model Validation—Single Pipe Example

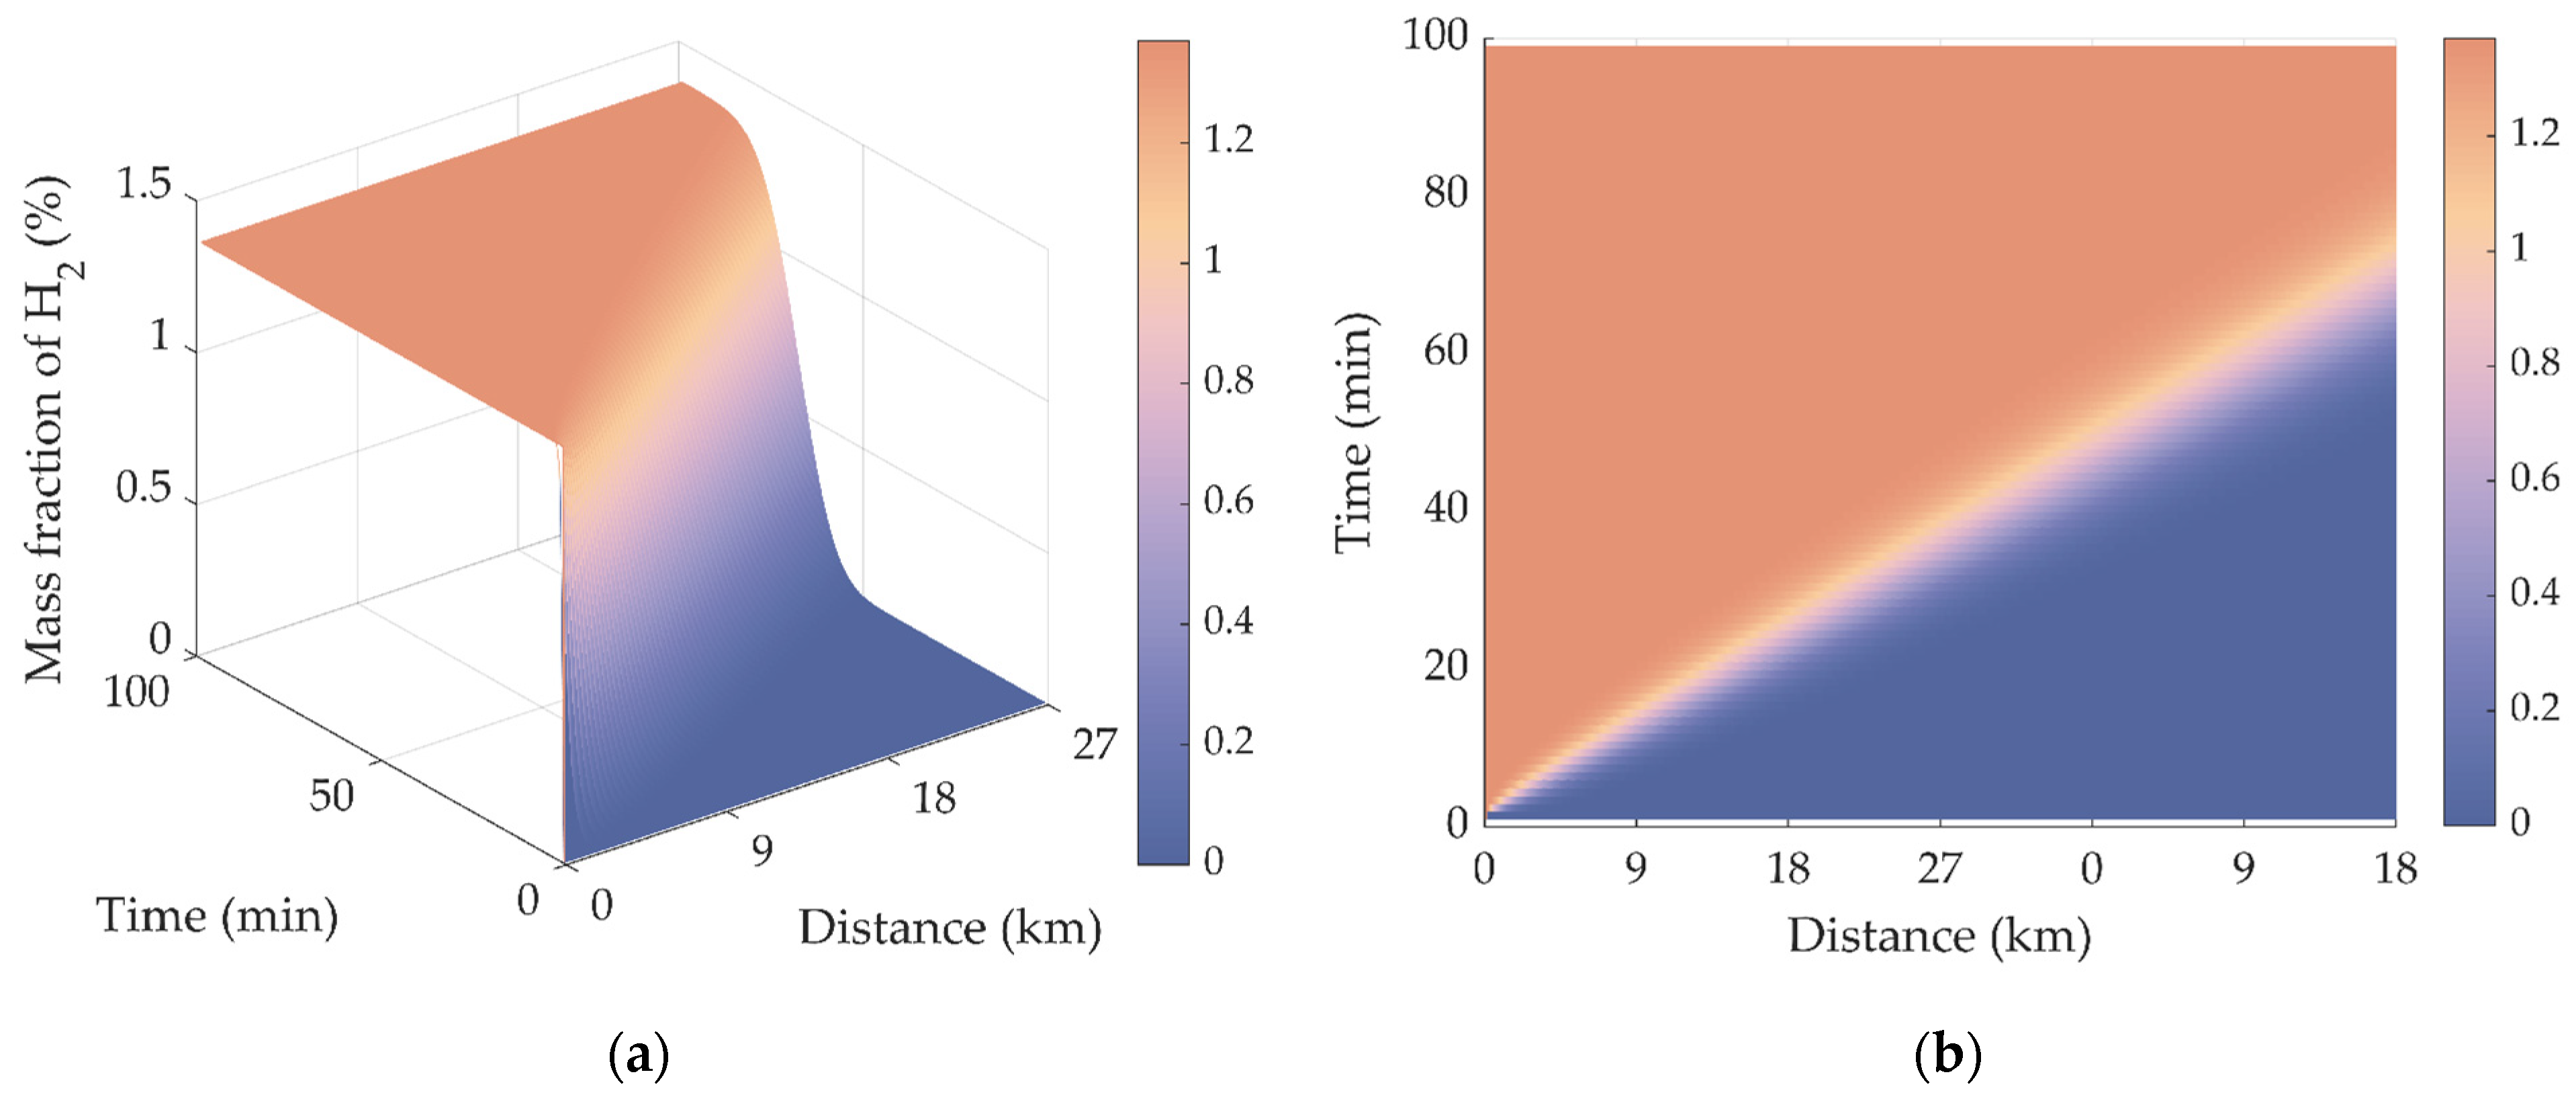
In this section, the pipeline data adopted the data of Pipe 1 in Section 5.2. According to the calculation results, the diffusion coefficient was 0.0805 and the convection term coefficient was 5. This case was an extremely obvious convection-dominated problem. In addition, according to the pipeline parameters and the pressure results in Figure 5, this problem met the two conditions of the large inner diameter of the pipeline and small pressure difference. Therefore, the convective–diffusion model with constant diffusion coefficient, (43), was used to model the hydrogen concentration of each pipeline, and the difference solution method used (50). The simulation results are shown in Figure 6.
In Figure 6, by observing the top view, we can find a color band with gradual color change. The central slope of this color band was approximately the convective velocity of the fluid, that is, the convection term coefficient, and the color gradient was caused by the diffusion. The simulation results were consistent with the actual situation in which the convection dominates, and it can be considered that the simulation effect was good.

5.4. Simulation Results of Differernt Hydrogen Production-Blending Scenarios

In this section, the proposed method is extended to the entire natural gas network in Figure 4, and the electricity–gas coupled simulation is carried out while considering the output characteristics of solar power, hydropower, and wind power.
A total of 3 hydrogen production-blending scenarios were set: Scenario I is a scenario with high penetration of solar power, Scenario II is a scenario with high penetration of wind power, and Scenario III is a scenario with balanced penetration of solar power and wind power. It should be pointed out that the hydropower output at Node 7 was the same in the three scenarios.

5.4.1. Scenario I: High Penetration of Solar Power

In Scenario I, it was assumed that the regional light resources were more abundant than the wind resources. The parameters of the PV power station and wind farm are given in Appendix B. The simulation results of the electric power of the wind farms and photovoltaic power stations at Node 2 and Node 4 that could be used for hydrogen production are shown in Figure 7.
According to the dynamic simulation results, the changes of hydrogen concentration in each pipeline are shown in Figure 8, Figure 9, Figure 10, Figure 11, Figure 12 and Figure 13.
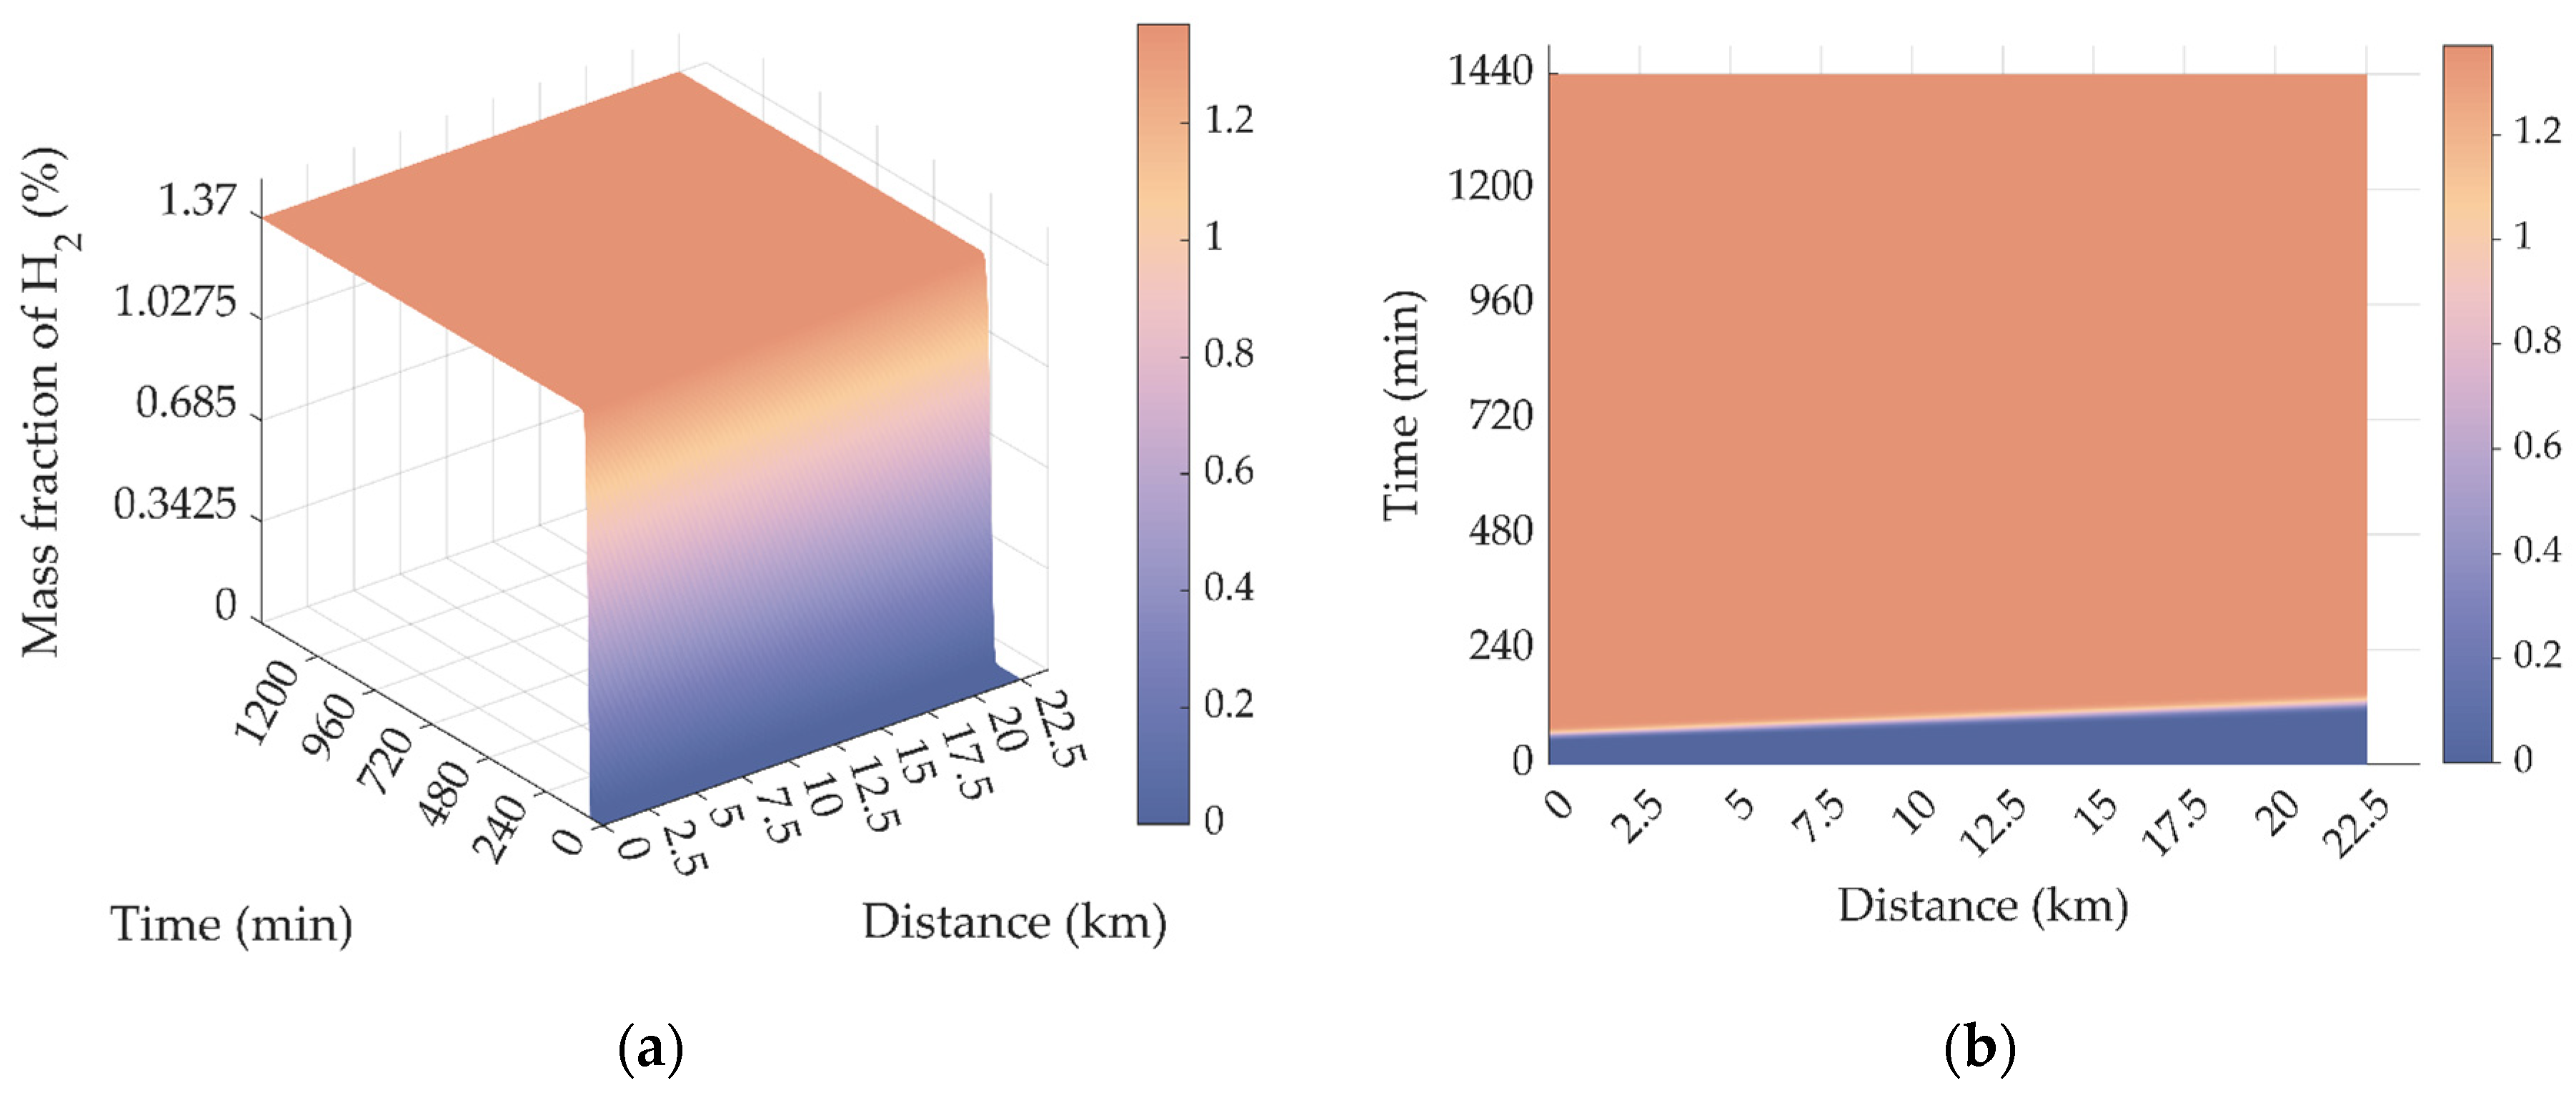
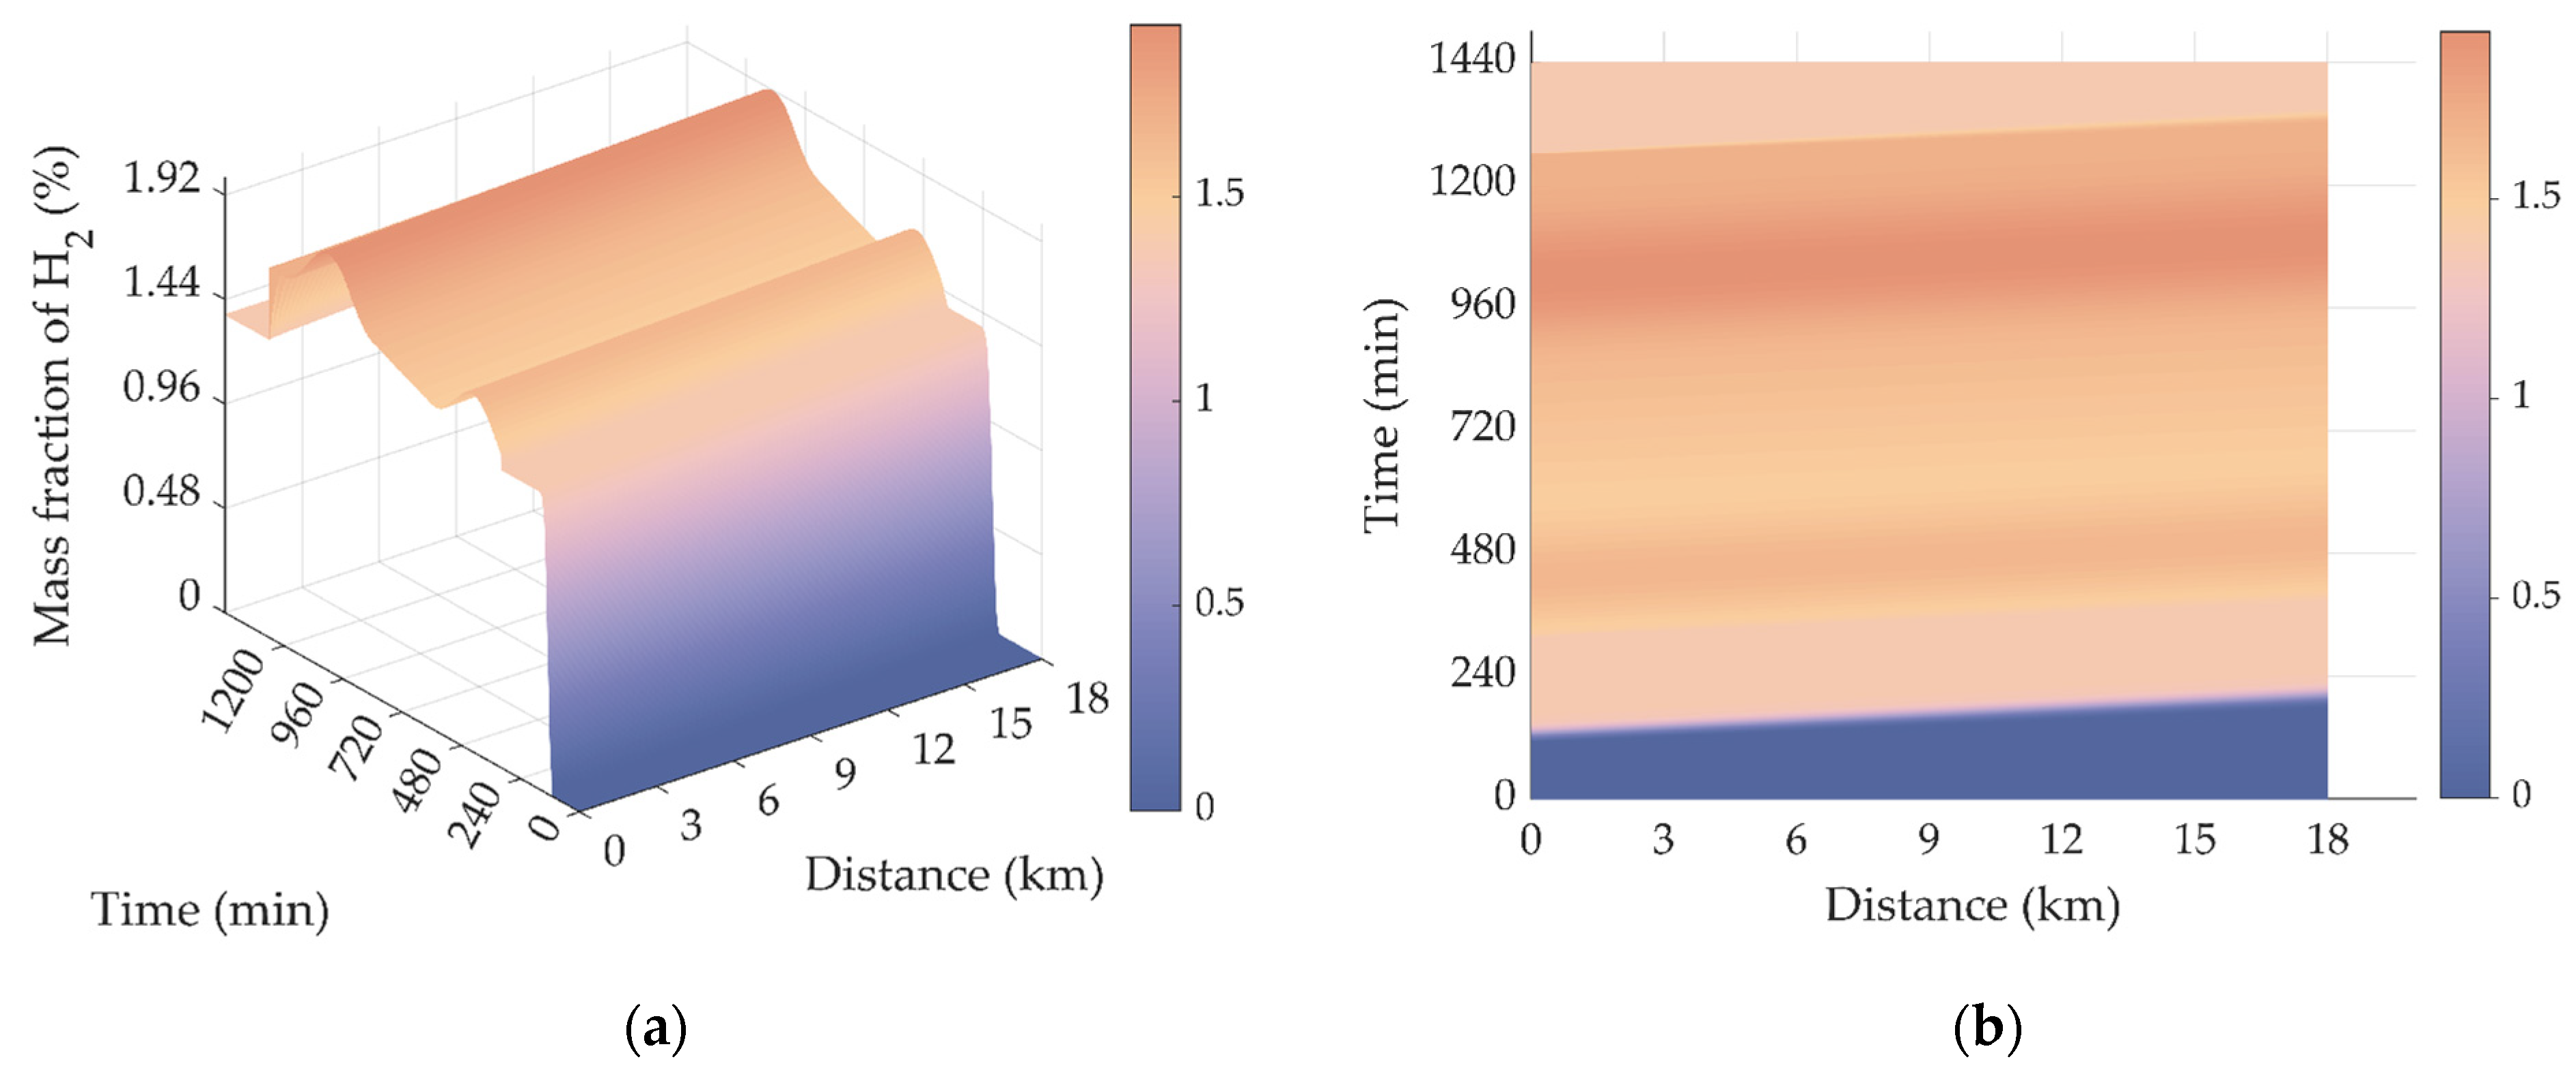
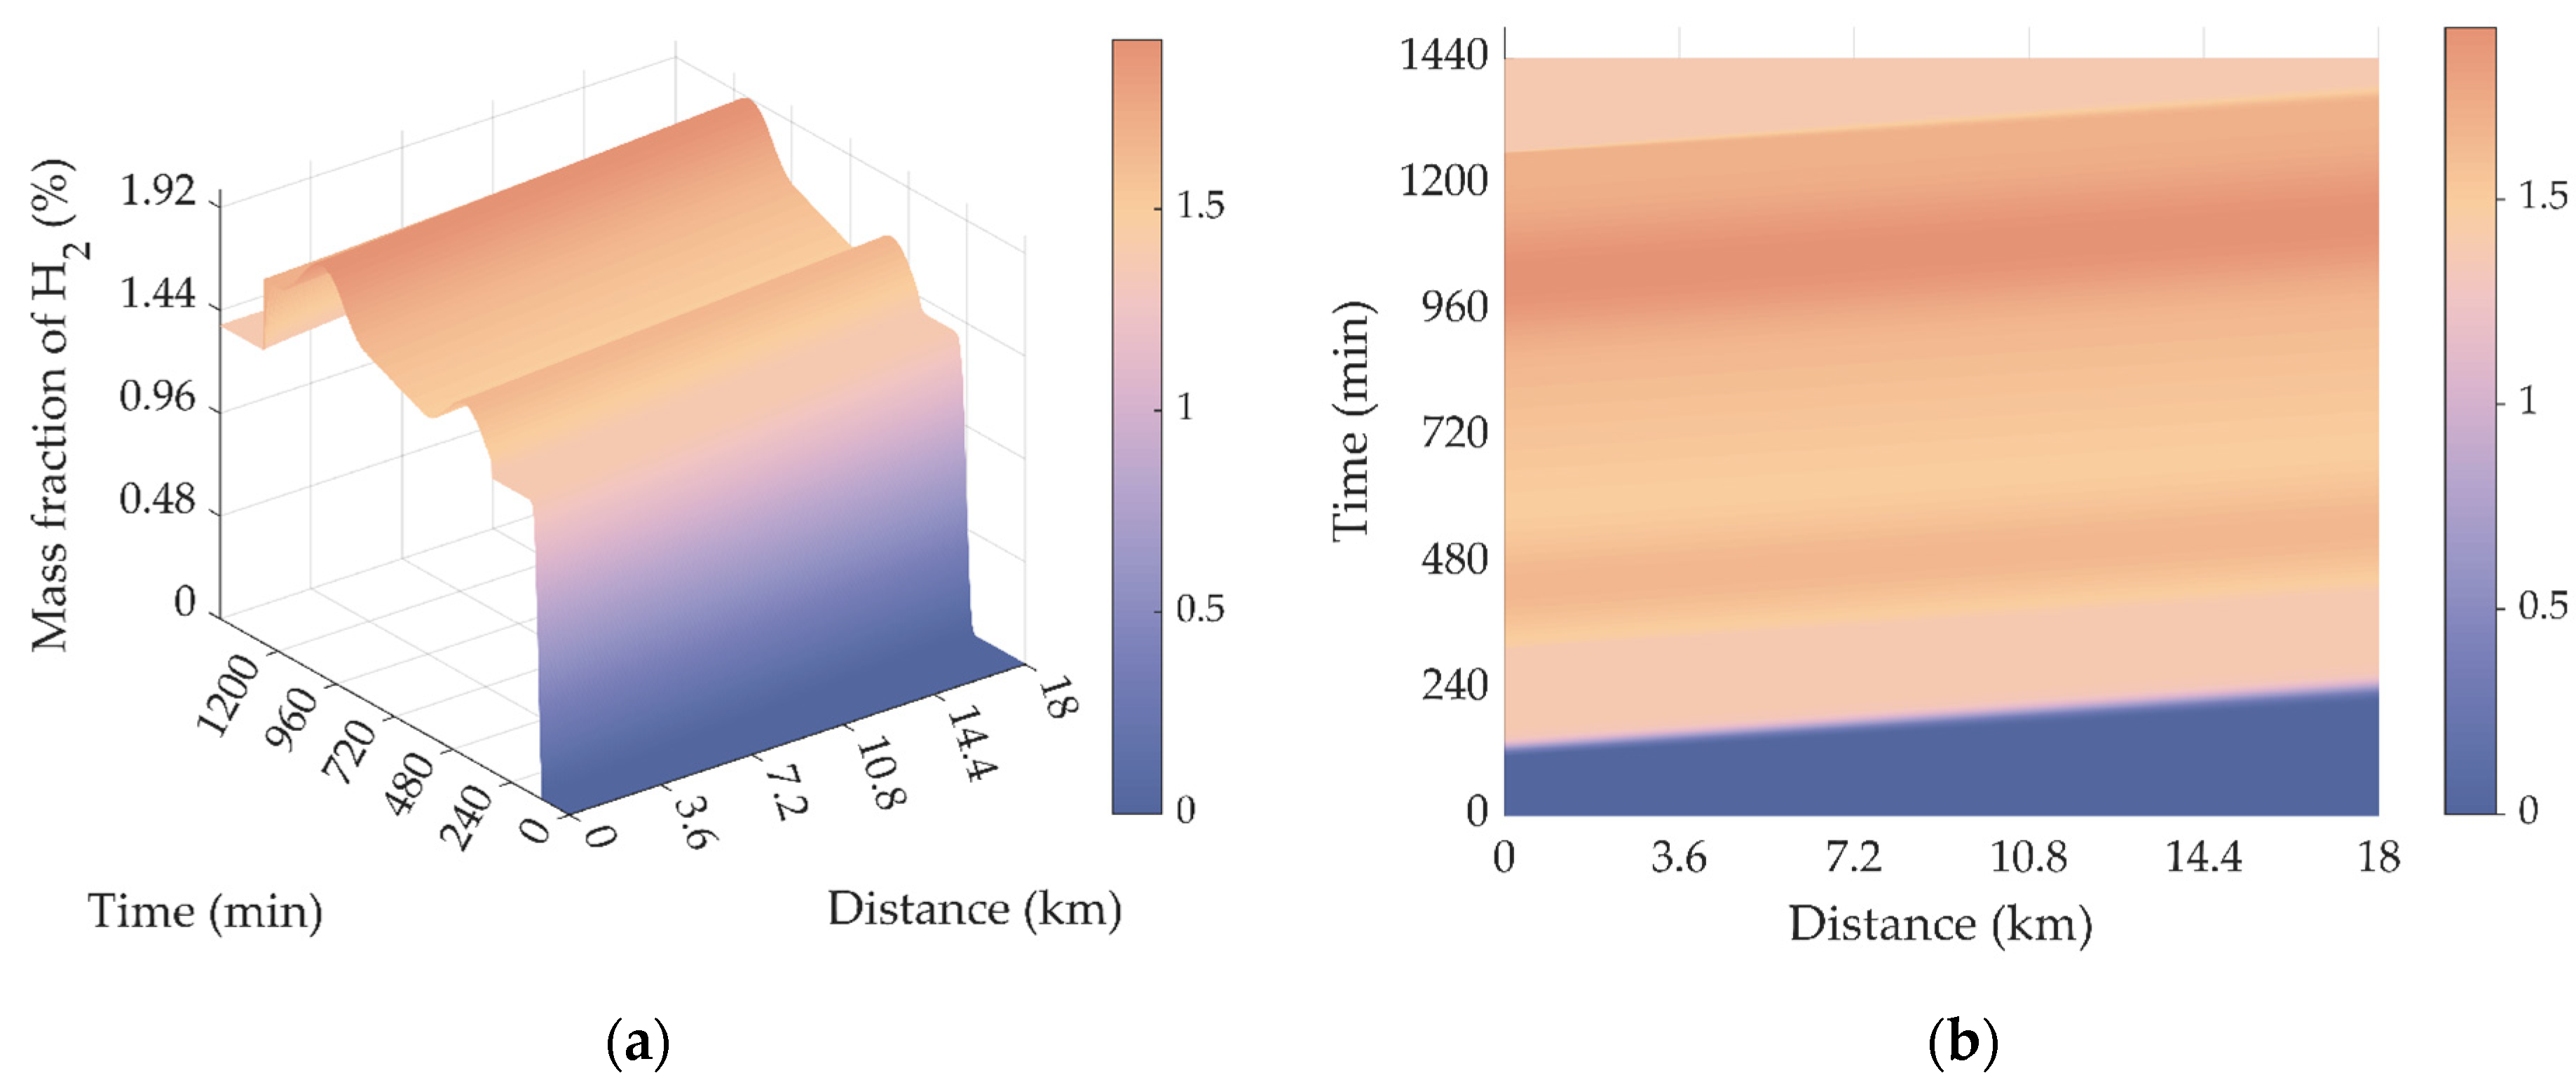
Since Pipe 1 and Pipe 2 were located upstream of the whole natural gas network, their hydrogen concentrations were only influenced by the hydropower station at Node 7. It can be seen in Figure 8 and Figure 9 that, the hydrogen mass fractions in Pipe 1 and Pipe 2 were zero at the initial stage and remained at 1.37% after about 96 and 173 min, respectively.
The distributions of hydrogen mass fraction in Pipe 3 and Pipe 4 were both affected by the generation of the hydropower station at Node 7 and the wind farm at Node 2. Since the hydropower output was assumed to be constant, the trend of hydrogen concentration over time is similar to that of the wind power curve. The detailed difference between Figure 10 and Figure 11 is related to the pipeline parameters.
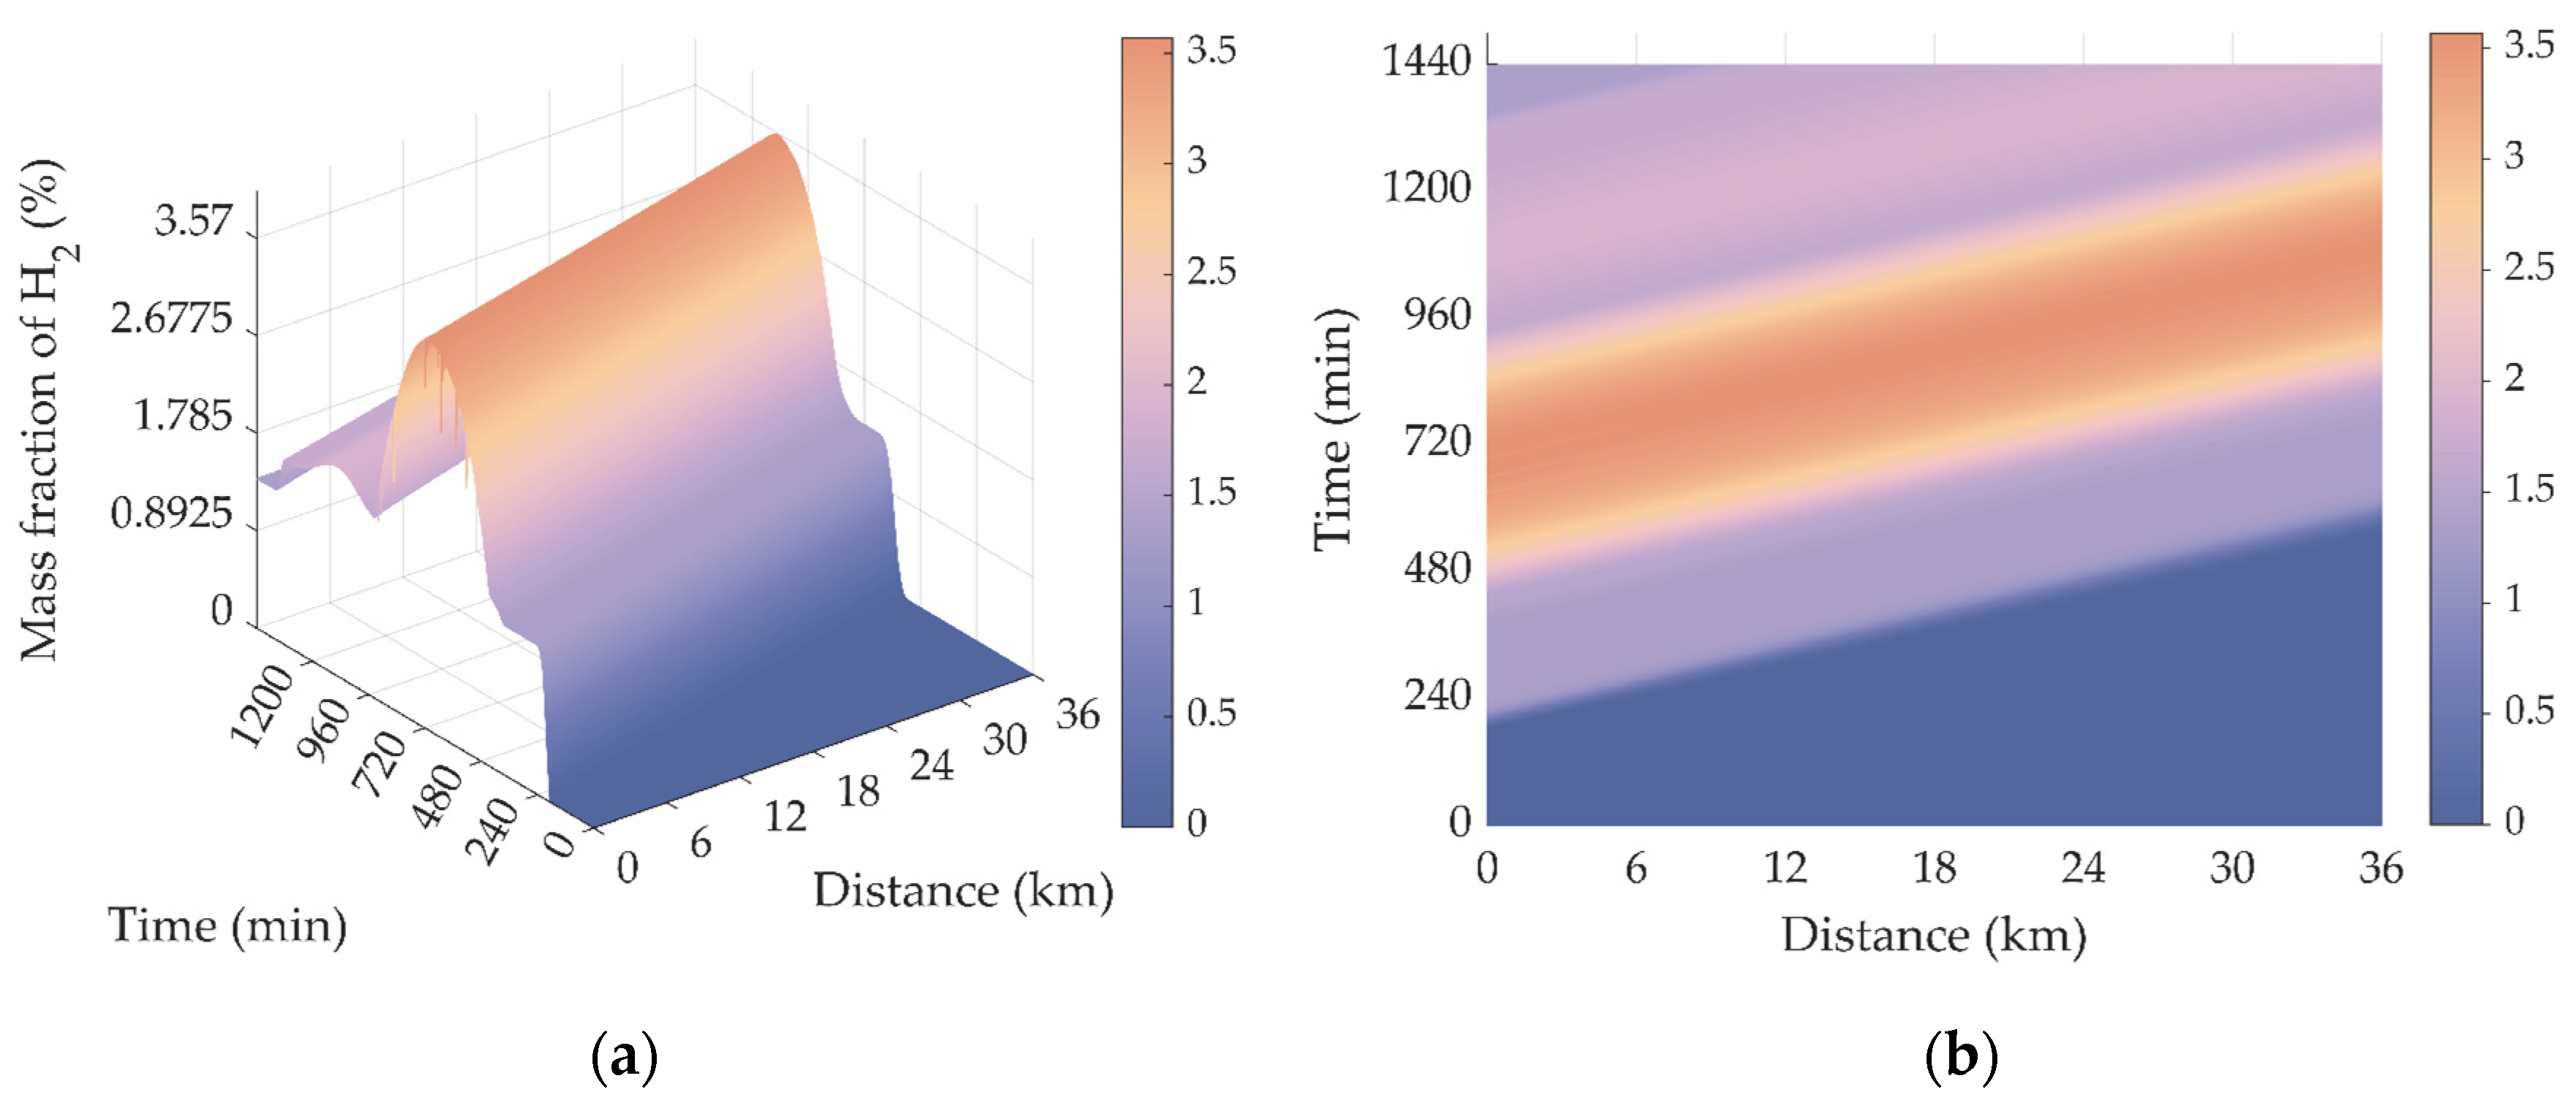
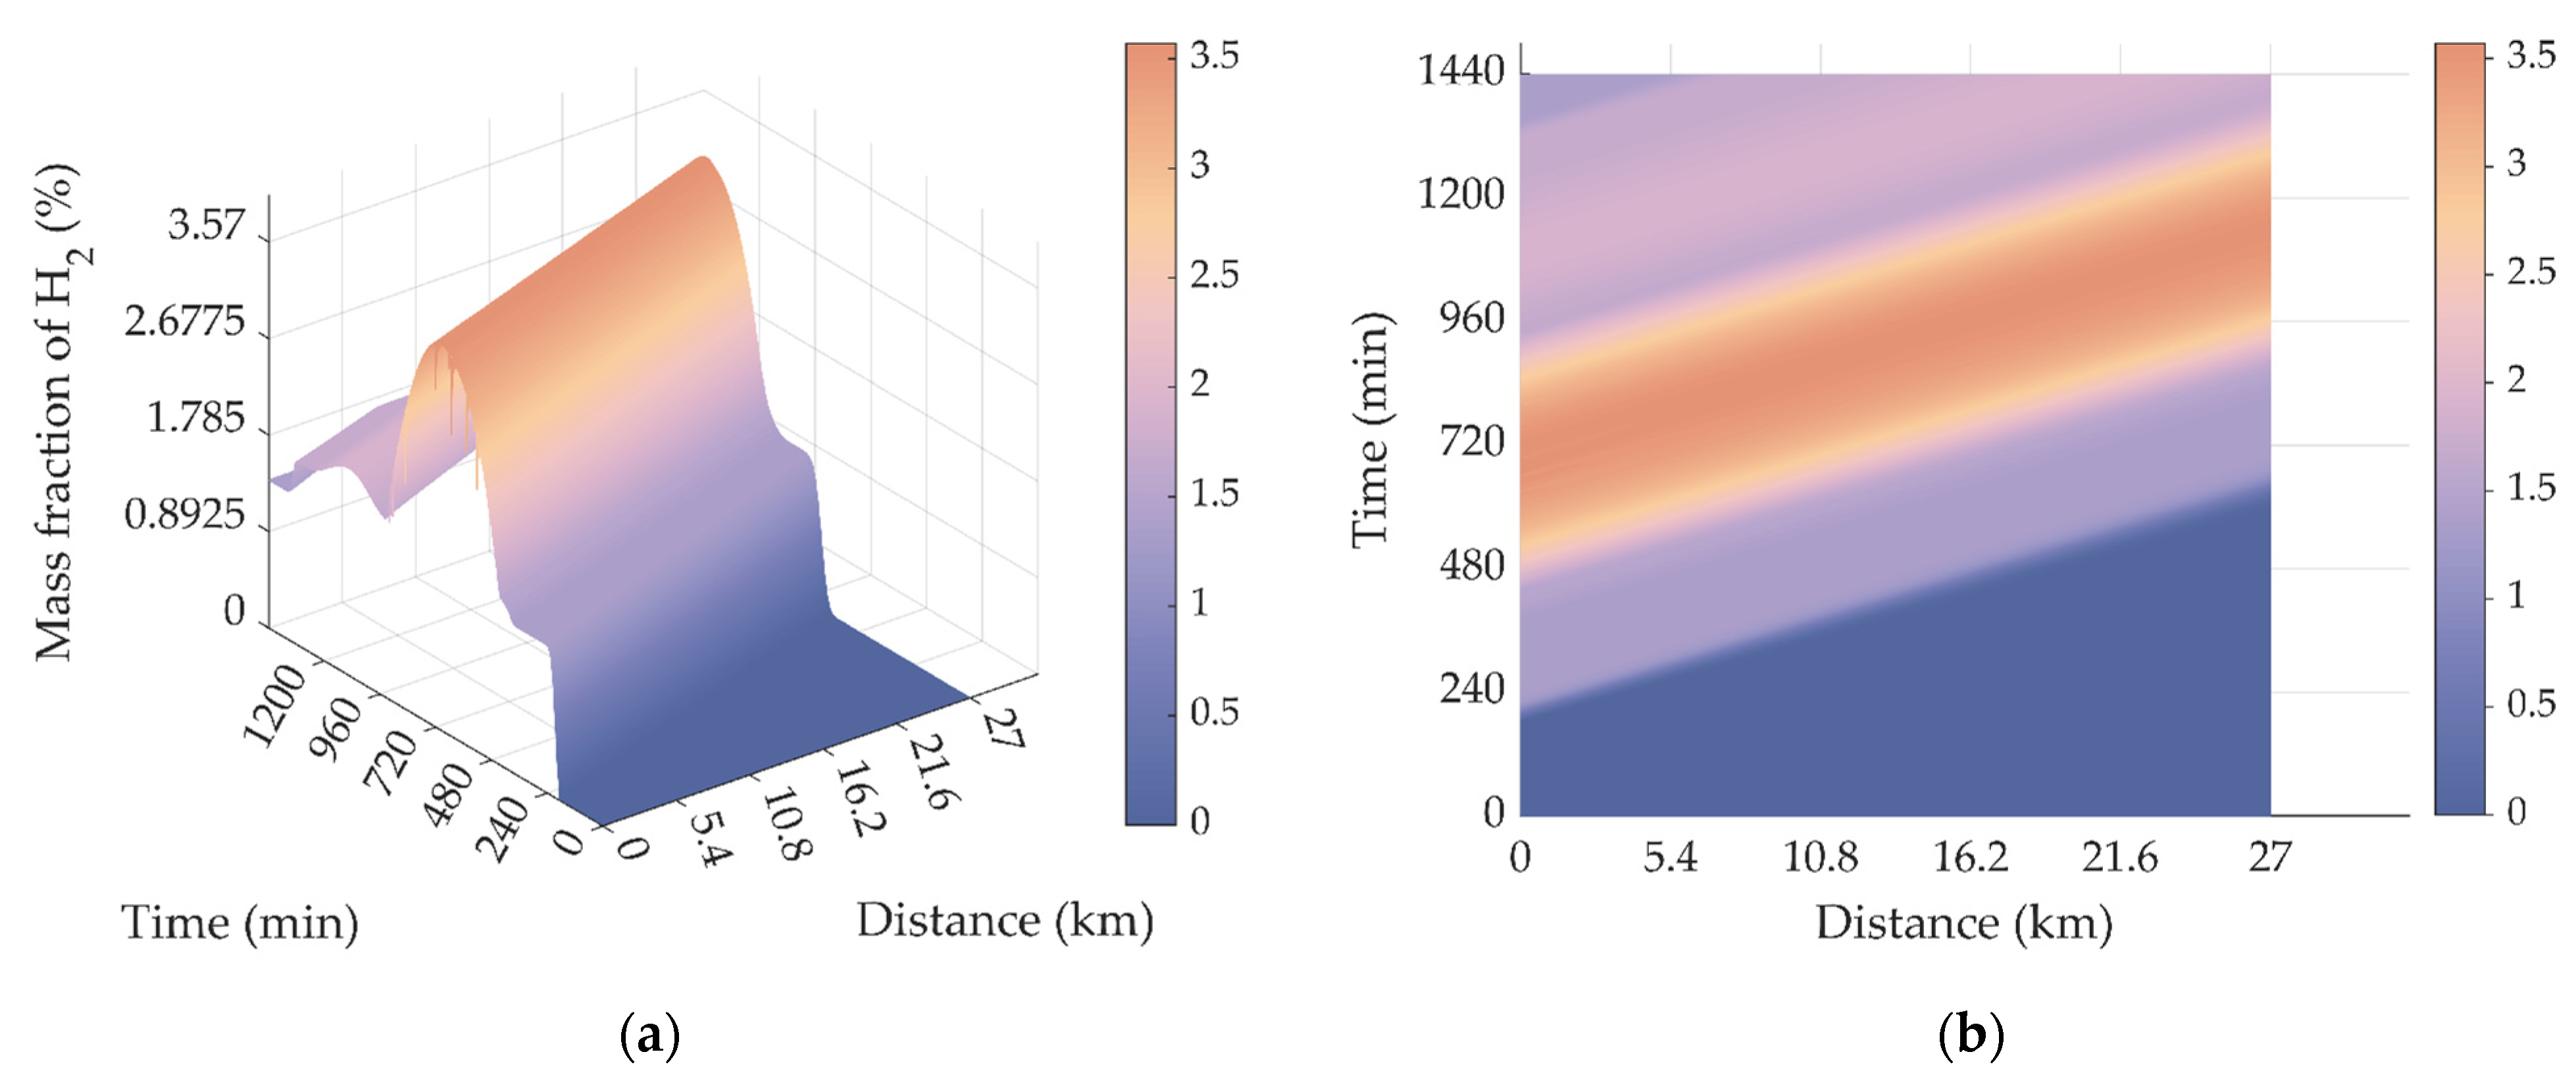
In terms of Pipe 5 and Pipe 6 shown in Figure 12 and Figure 13, the changes of hydrogen concentration were the most complex, because the hydrogen injections at Node 7, Node 2, and Node 4 all influenced their hydrogen mass fraction distributions. The maximum value of the hydrogen mass fraction in Pipe 5 and Pipe 6 was 3.57%, which appeared near the peak of PV output at noon.
In addition, the inconsistency between the simulation results in Figure 10 to Figure 13 and the renewable power output for hydrogen production in Figure 7 also reveals the slow dynamic characteristics of the natural gas network.
The results of hydrogen concentration violation of each pipe in Scenario I are presented in Table 1. It can be seen that in Scenario I there was no limit exceeding from Pipe 1 to Pipe 4 within 24 h. In contrast, Pipe 5 and Pipe 6 exceeded the limit for 655 and 703 min, respectively.

5.4.2. Scenario II: High Penetration of Wind Power

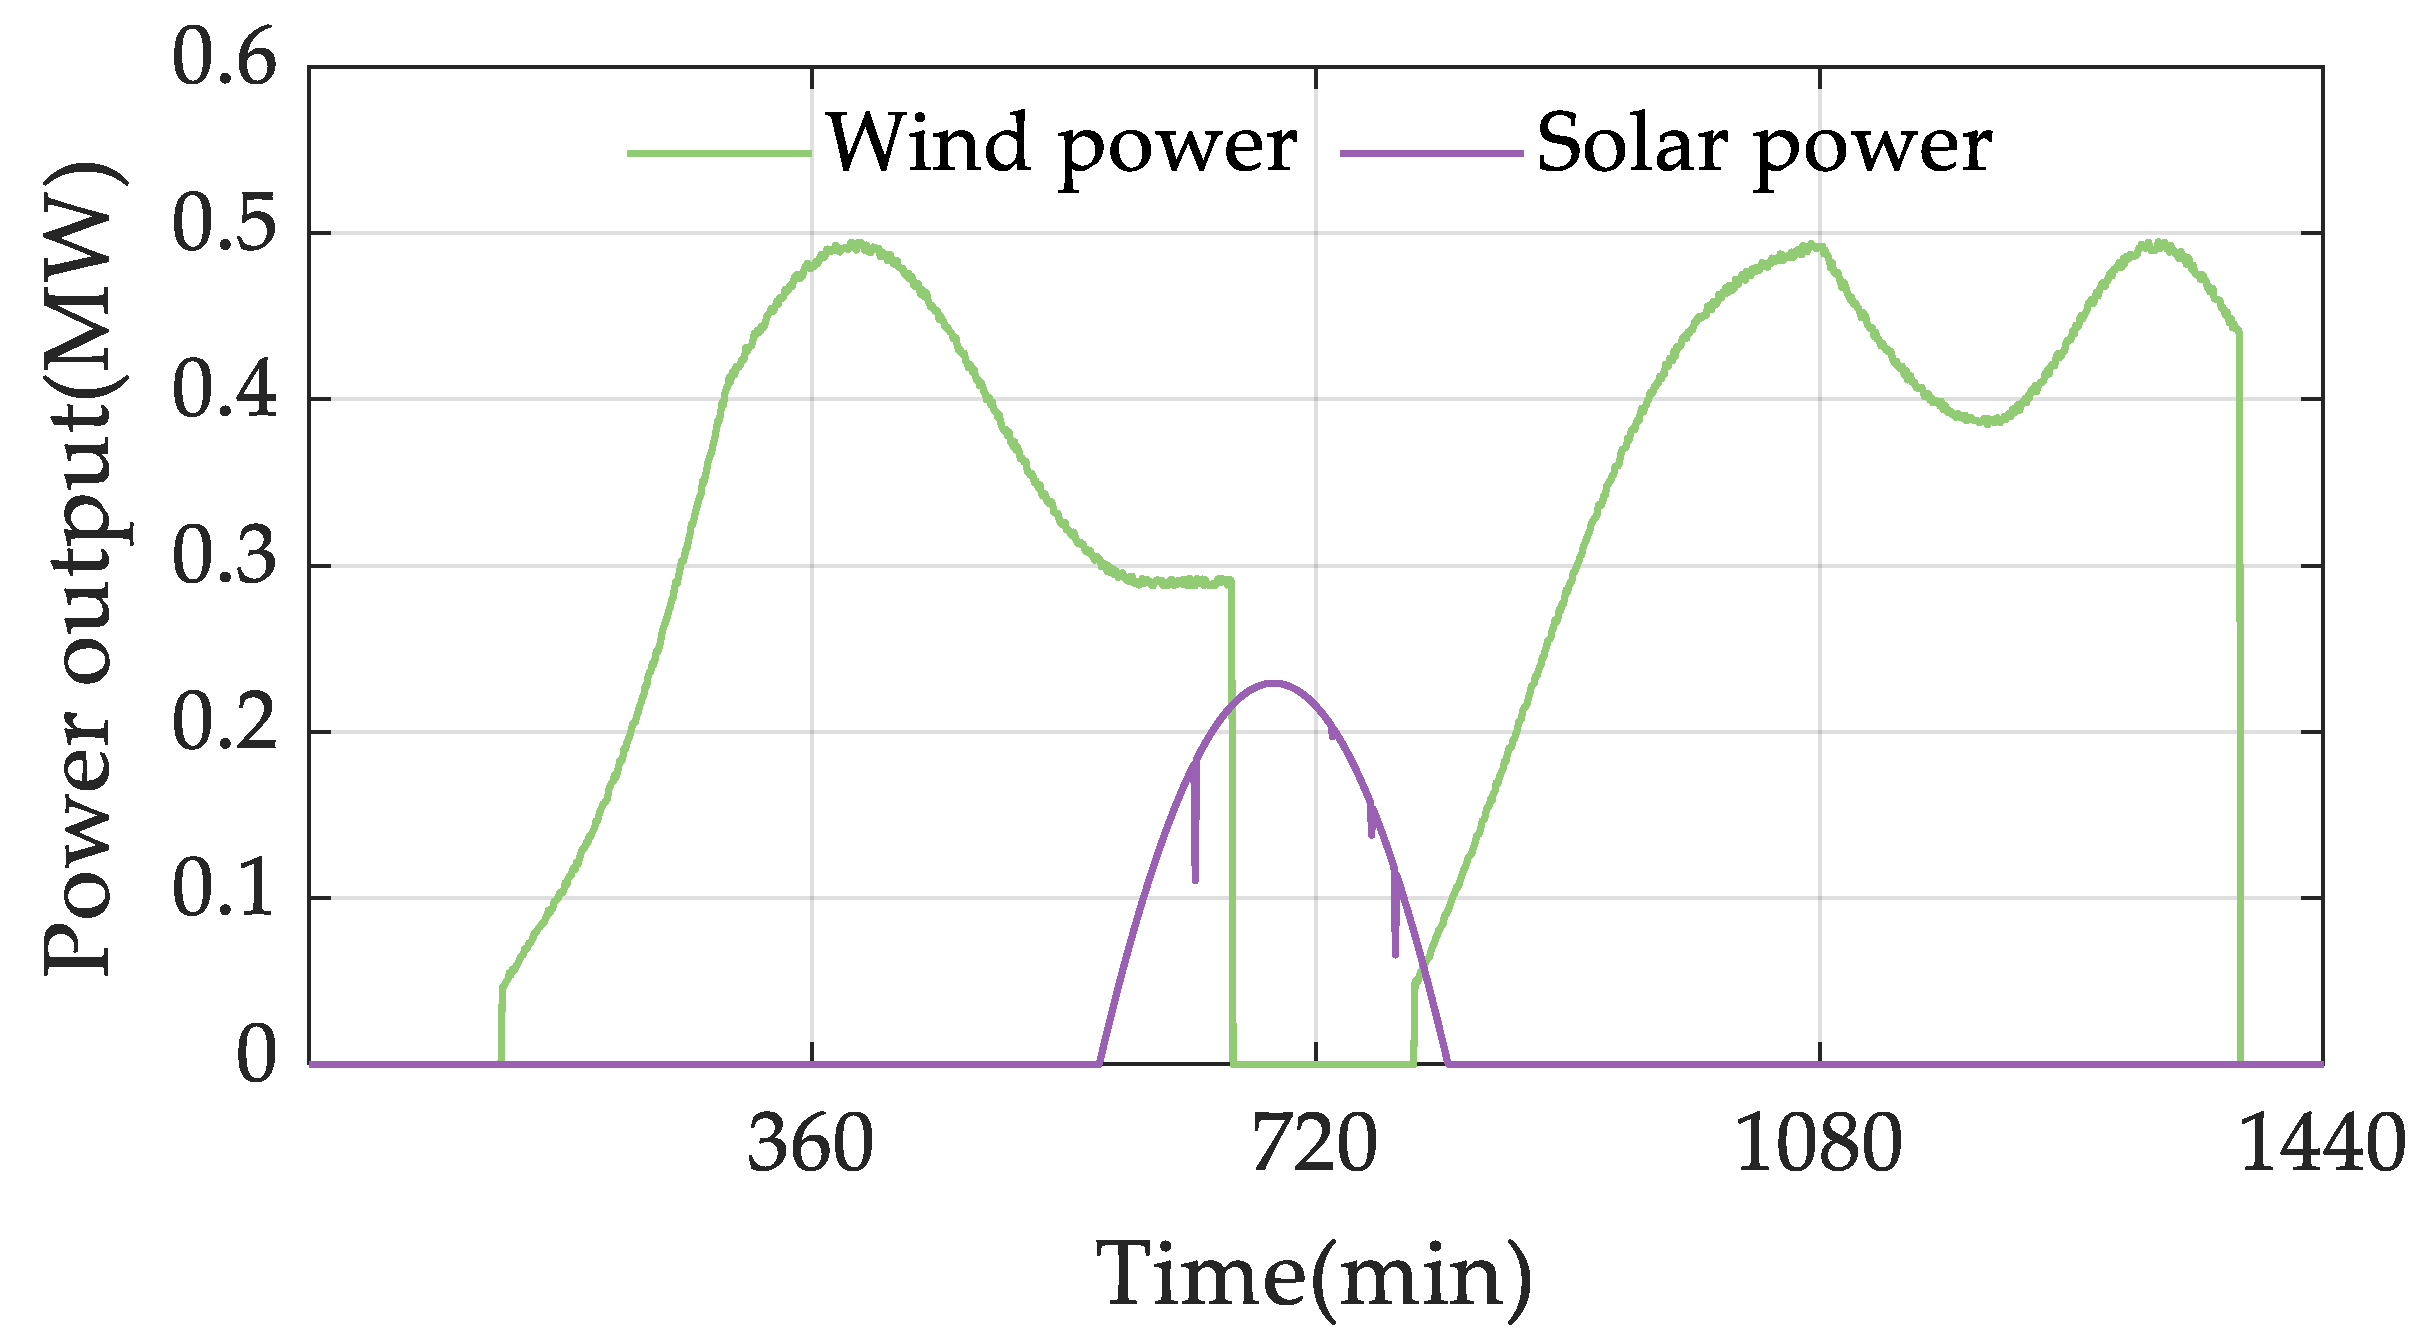
In Scenario II, it was assumed that the regional wind resources were more abundant than the light resources. The parameters of the PV power station and wind farm are given in Appendix C. The simulation results of the electric power of the wind farm and PV power station at Node 2 and Node 4 that can be used for hydrogen production are shown in Figure 14.
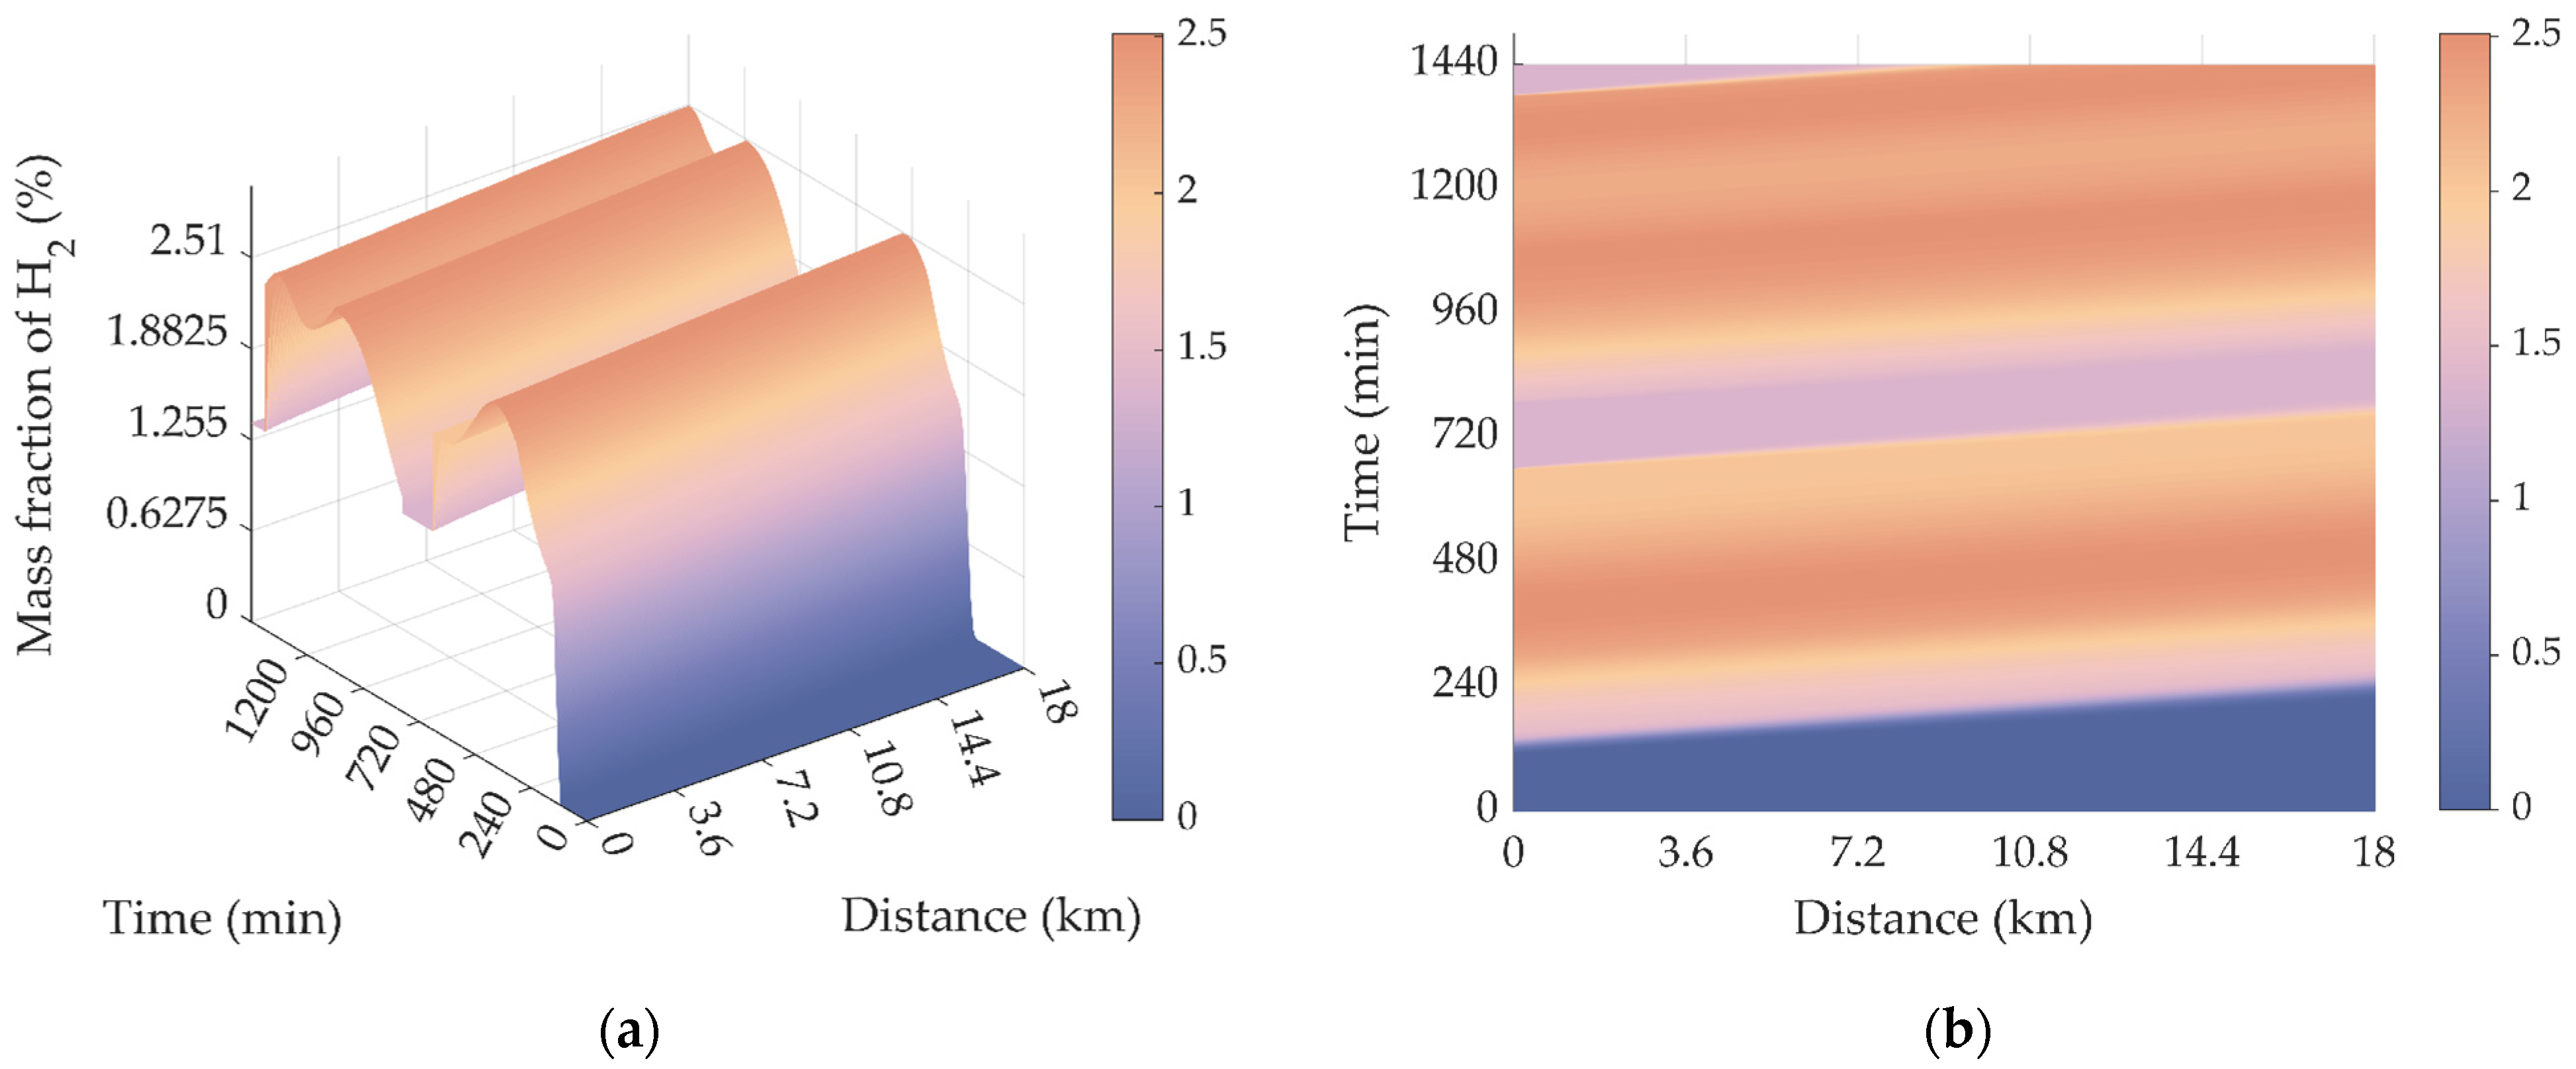
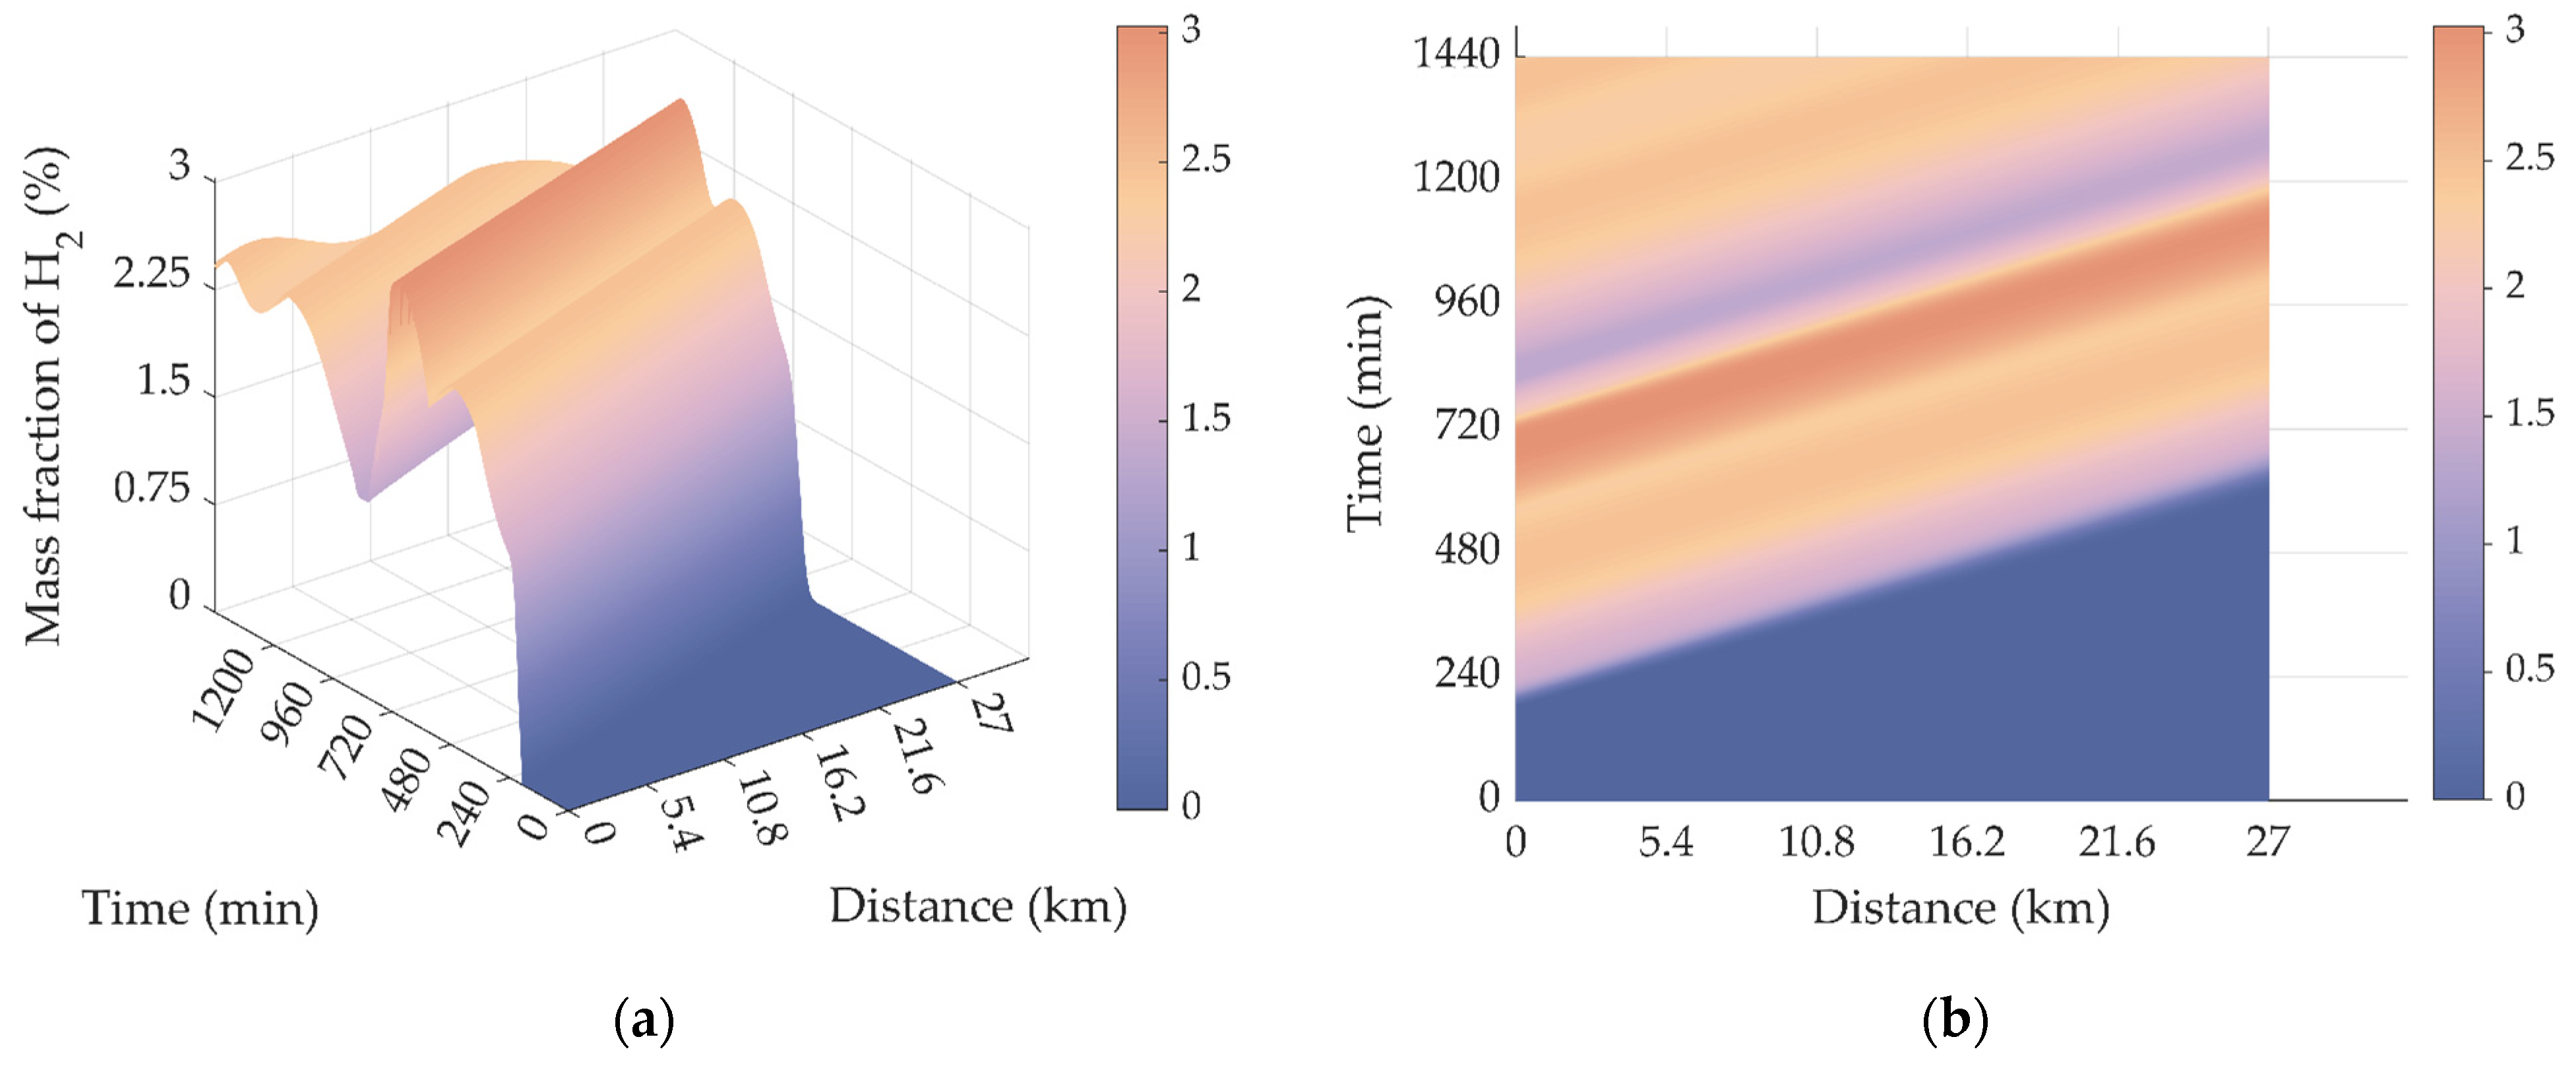
The concentration changes of Pipe 1 and Pipe 2 are the same as in Section 5.4.1. The dynamic changes of the hydrogen concentration in Pipe 3 and Pipe 4, Pipe 5, and Pipe 6 are similar. Hence, only the simulation results of the dynamic changes of the hydrogen concentration in Pipe 4 and Pipe 6 are given in Figure 15 and Figure 16.
Compared with the solar-power-dominated scenario, the average value of the hydrogen mass fraction of Pipe 4 in Figure 15 was obviously greater, representing more consumption of hydrogen energy. Meanwhile, the peak-to-valley difference of hydrogen concentration in Pipe 6 was reduced.
As shown in Table 2, in Scenario II, the hydrogen concentration from Pipe 1 to Pipe 6 did not exceed the limit within 24 h.

5.4.3. Scenario III: Balanced Penetration of Solar Power and Wind Power

In Scenario III, it was assumed that the regional wind resources and light resources were relatively balanced. The parameters of the PV power station and wind farm are given in Appendix D. The simulation results of the electric power of the wind farm and PV power stations at Node 2 and Node 4 that can be used for hydrogen production are presented in Figure 17.
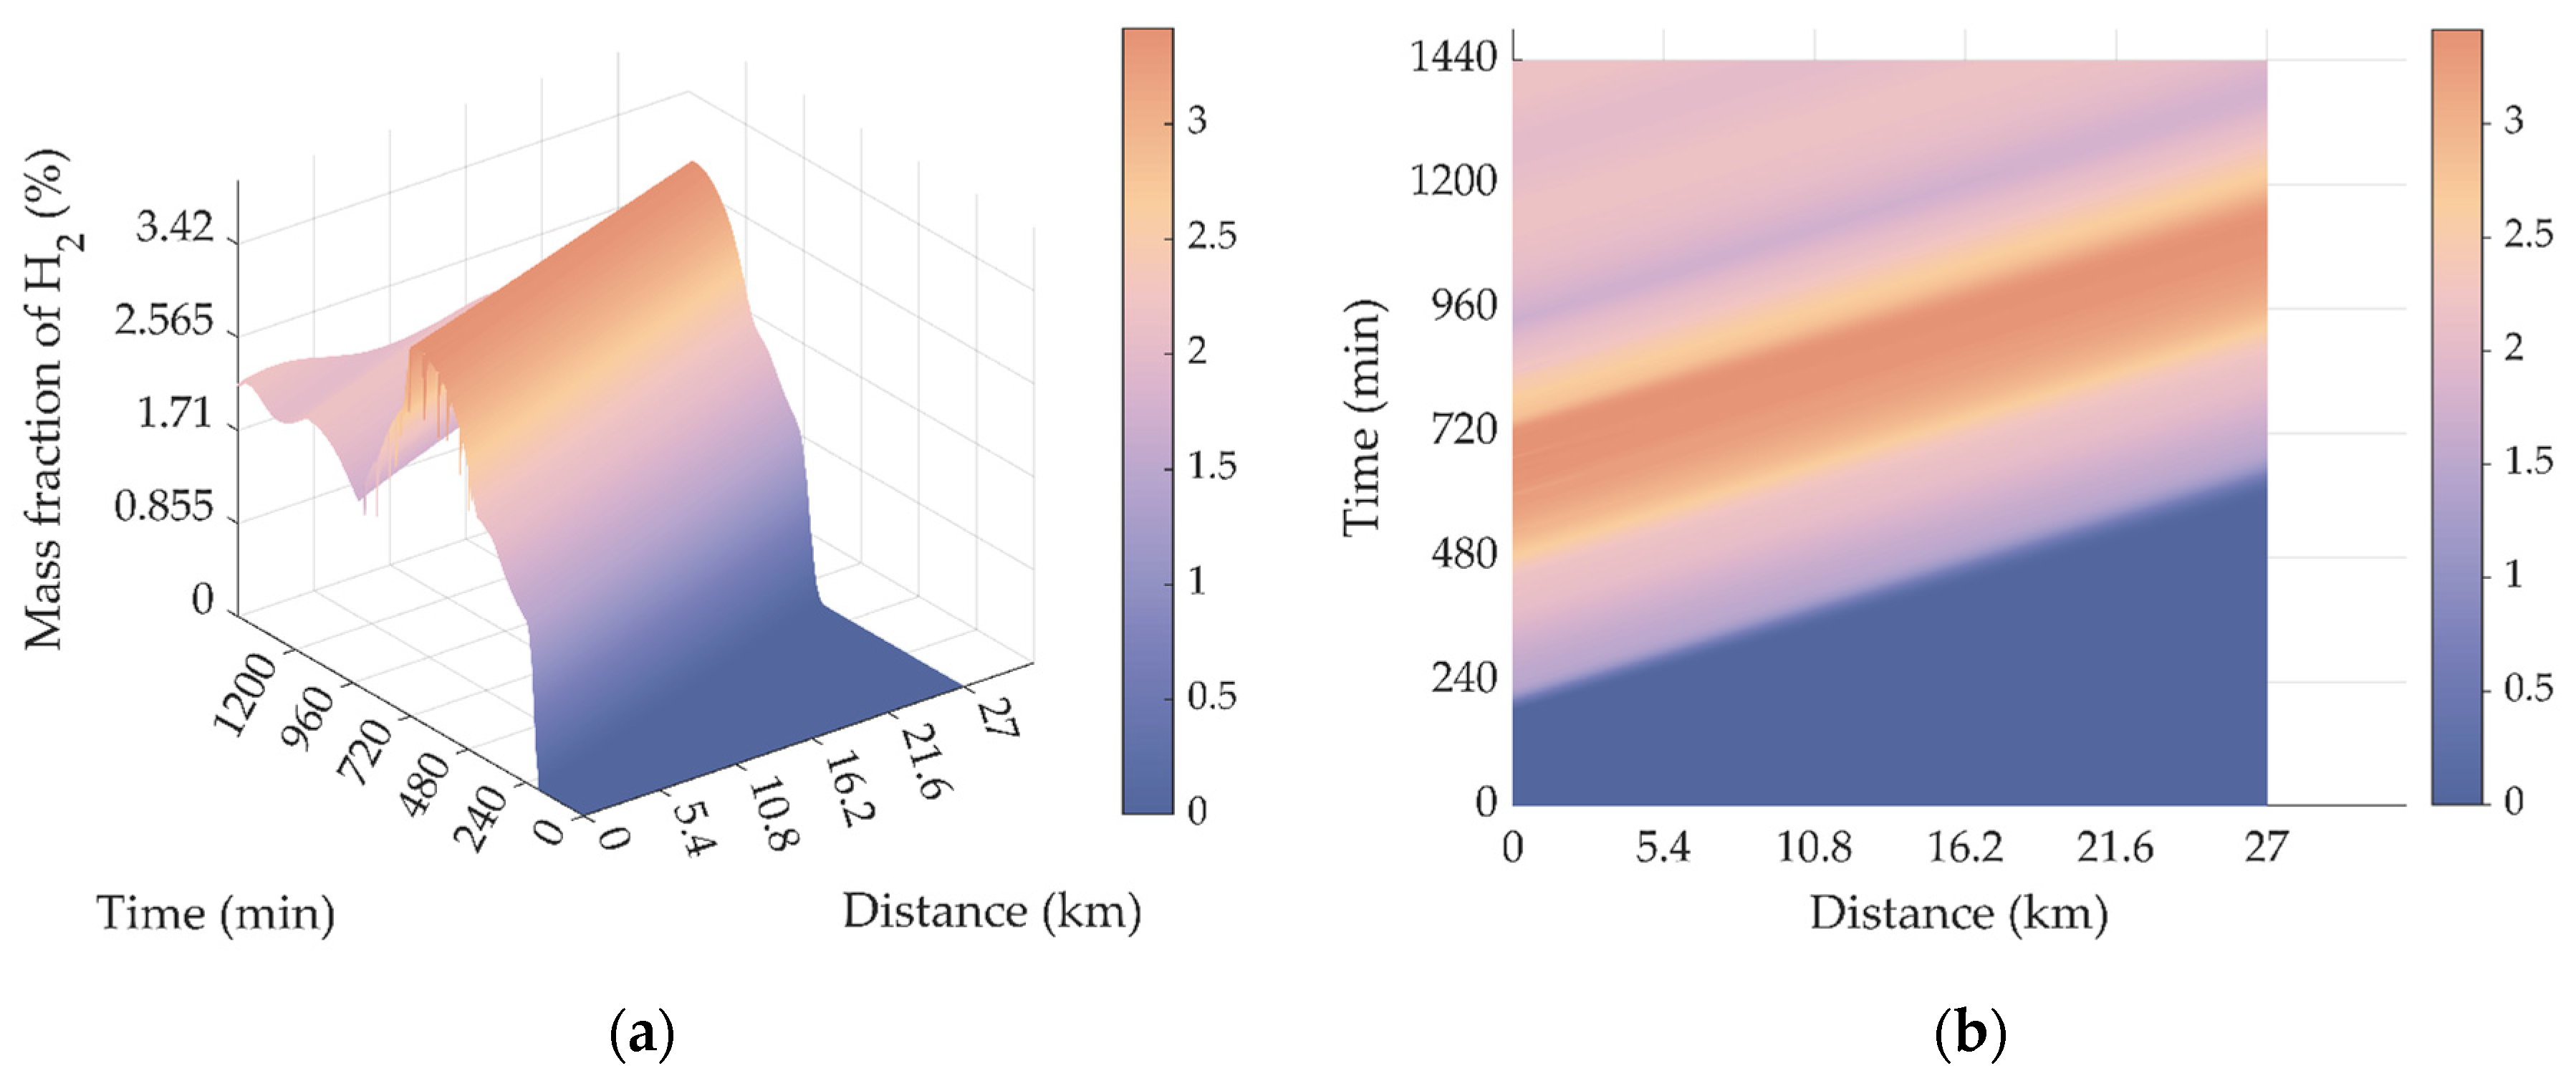
The concentration changes of Pipe 1 and Pipe 2 are still the same as in Section 5.4.1. Similar to Section 5.4.2, only the simulation results of Pipe 4 and Pipe 6 are given in Figure 18 and Figure 19.
It can be seen that the performance of hydrogen diffusion of Pipe 4 and Pipe 6 in Scenario III is between that of Scenario I and Scenario II. The solar–wind balance improves the uniformity of the hydrogen distribution to a certain extent.
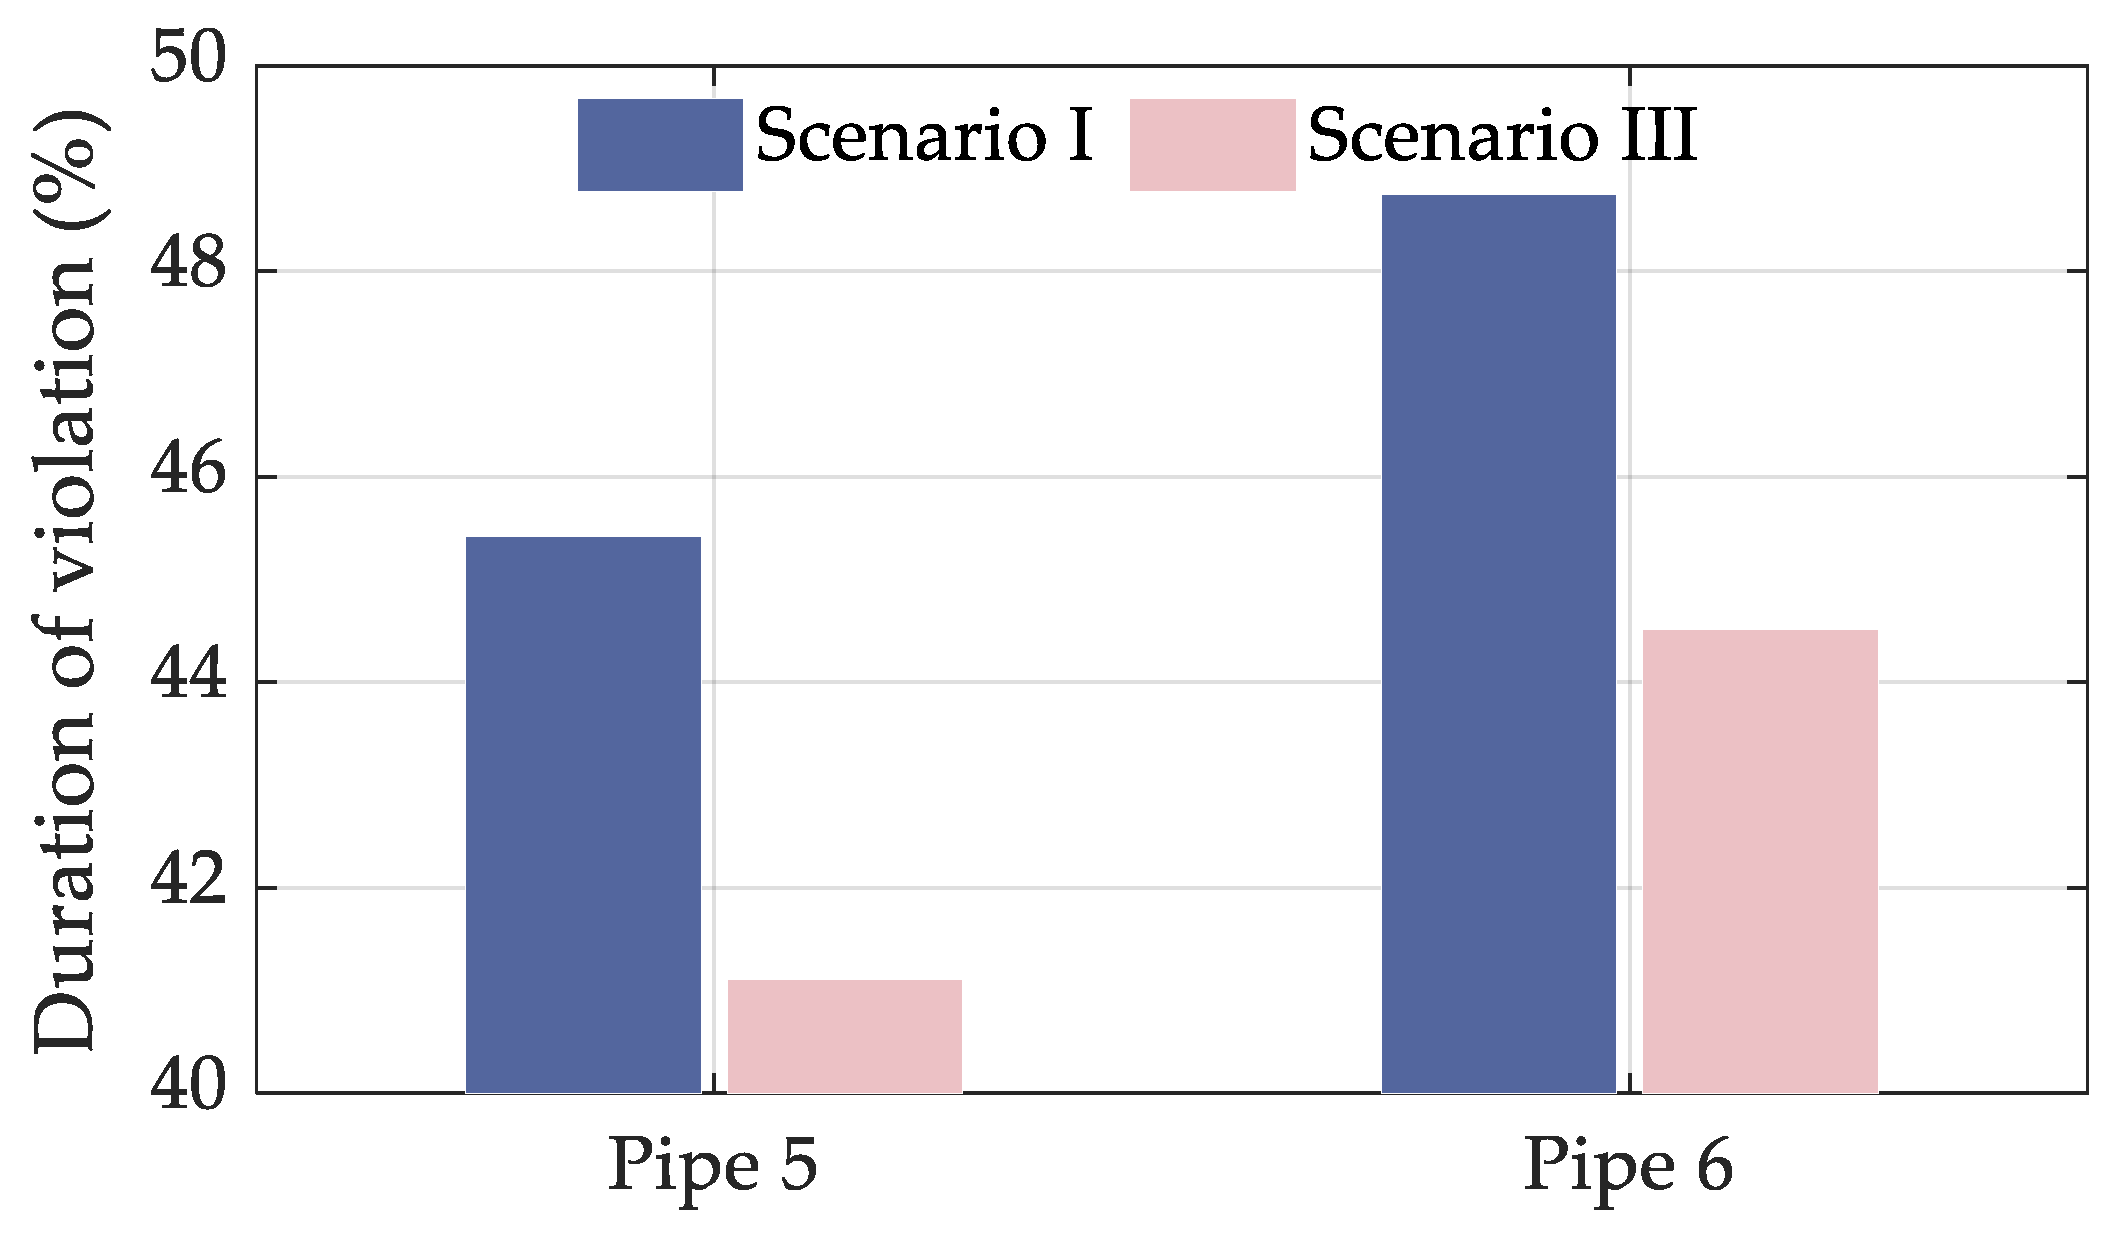
As shown in Table 3, in this scenario, the hydrogen concentration from Pipe 1 to Pipe 4 did not exceed the limit within 24 h, while the hydrogen concentrations in Pipe 5 and Pipe 6 exceeded the limit in some time periods. Compared with Scenario I, in Scenario III, the hydrogen concentration in Pipe 5 and Pipe 6 exceeded the limit for a shorter period of time, which was 91.24% and 91.99% of Scenario I, respectively.

5.4.4. Comparison and Analysis of the Three Scenarios

As mentioned above, when the volume fraction of hydrogen in the pipeline exceeds 20% or the mass fraction exceeded 3.03%, the pipeline could be considered to be in an unsafe state. In the studied topology, Pipe 1 and Pipe 2 were in the upstream of the network, and the hydrogen was produced by hydropower, so the hydrogen concentration was stable and no overrun occurred.
Figure 20 shows the average hydrogen concentration of the six pipelines in three scenarios. Figure 21 presents the violation duration when the hydrogen concentration in Pipe 5 and Pipe 6 exceeded the limit in Scenario I and Scenario III, described by the proportion of violation time relative to the entire simulation period.
Combining the results shown in Figure 20 and Figure 21, the analysis is as follows:
(1)
Scenario I: The light resources were relatively sufficient and the wind resources were relatively poor. The hydrogen concentration of Pipe 3 and Pipe 4 did not exceed the limit, but the hydrogen concentration of Pipe 5 and Pipe 6 exceeded the limit to a certain extent due to the light intensity at noon, and it happened nearly 50% of the time in a day. In addition, the problem of the hydrogen concentration violation was most serious in Scenario I, while the average hydrogen concentration level of the whole network was the lowest throughout the simulation period.
(2)
Scenario II: The wind resource was relatively sufficient, and the light resource was relatively poor. When the hydrogen concentration in the system was at its highest, it was close to the upper limit but did not exceed the limit, and the system was in a safe operation state all the time.
(3)
Scenario III: Lighting resources and wind resources were relatively balanced, and the hydrogen concentrations of Pipe 3 and Pipe 4 still did not exceed the limit. Similar to Scenario I, the hydrogen concentration in Pipe 5 and Pipe 6 exceeded the limit at noon and partly during periods in the afternoon. However, the hydrogen concentration in Pipe 5 and Pipe 6 exceeded the limit for a significantly shorter period of time than in Scenario I.
Based on the above analysis, the following conclusions can be drawn:
(1)
Solar power was greatly affected by the light intensity in the day, and too much hydrogen production near the peak of light intensity could easily lead to the hydrogen concentration violation. Meanwhile, the overall hydrogen production by solar power was relatively low, which classifies the hydrogen production mode into an uneven one. When the surplus renewable energy was mainly solar power, absorbing it with hydrogen production by water electrolysis showed certain limitations, which may bring risks to the safe and stable operation of natural gas pipelines.
(2)
Compared with hydrogen production by solar power, hydrogen production by hydropower and wind power were relatively stable hydrogen production modes. Among them, hydropower was the most stable and adjustable, and the output could even be considered unchanged within a dispatching day. Compared with solar power, wind power could produce a higher overall hydrogen amount in one day, and the difference between the wind peak and the wind valley was not that large. It was a relatively even hydrogen production mode. In conclusion, it is highly feasible to absorb surplus wind power using hydrogen production by water electrolysis.
(3)
By virtue of the instinctive complementary characteristics of solar and wind power, the solar–wind power balance scenario can improve the problem of hydrogen concentration exceeding the limit in the solar-power-dominated scenario. In addition, the renewable energy that can be used for hydrogen production is also related to the characteristics of local electricity demand. The design and dispatch of local hydrogen production-blending systems need to comprehensively consider the complementary characteristics of solar and wind power, as well as the matching between the renewable energy generation and local electricity load.
(4)
The simulation research in this paper did not consider the energy storage technology. If equipped with the electricity storage and gas storage technologies, the problems of power to hydrogen (P2H) and pipeline transportation of HCNG could be better matched. From another perspective, the simulation work in this paper also demonstrated the necessity of planning and designing energy storage facilities when carrying out hydrogen blending of natural gas pipelines in areas where solar power is dominant.

6. Conclusions

For the natural gas network under the scenarios of multiple green hydrogen types and multiple hydrogen blending nodes, this paper carried out the modeling and simulation research on the dynamic distribution of hydrogen concentration in the natural gas network after hydrogen blending.
A seven-node natural gas network was selected to validate the effectiveness of the proposed method, on which a simulation study of the dynamic distribution of hydrogen concentration in the pipelines under different hydrogen injection scenarios was carried out. The simulation results reveal the potential of natural gas pipelines in consuming different types of green hydrogen. In particular:
Quantitative findings:
  • under the solar-power-dominated hydrogen production-blending scenario, the overall hydrogen production is low while the hydrogen concentration exceeds the permitted limit for nearly 50% of the time in a day;
  • the hydrogen concentration in each pipeline of the natural gas network does not exceed the limit in the wind-power-dominated scenario;
  • in the solar–wind power balance scenario, the overrun time of the hydrogen concentration in Pipe 5 and Pipe 6 decreases to 91.24% and 91.99% of the solar-power-dominated scenario.
Qualitative conclusions:
  • hydrogen production by hydropower and wind power are relatively stable hydrogen production modes compared with that by solar power;
  • the instinctive complementary characteristics of solar and wind power as well as the local electrical load curve deserve attention to smooth the hydrogen concentration distribution in natural gas pipelines.
It should be pointed out that, due to the limitation of insufficient experimental conditions, this paper only starts from numerical simulation and draws some reference conclusions. Experiments in the real environment can further verify the numerical simulation results in this paper. Furthermore, the role of energy storage facilities in mitigating the intrinsic intermittence and fluctuation of renewable energy and maintaining the stable distribution of hydrogen concentration in pipelines is worth exploring. Therefore, the joint modeling and simulation research of hydrogen storage technologies (such as UHS) and HCNG network will be our next research topic.

Author Contributions

Conceptualization, Y.Q. and S.Z.; methodology, Y.Q. and J.C.; software, Y.Q. and J.C.; validation, Z.W. and Q.H.; writing—original draft preparation, Y.Q. and S.Z. All authors have read and agreed to the published version of the manuscript.

Funding

This research was funded by the National Natural Science Foundation of China with grant number 52177076.

Institutional Review Board Statement

Not applicable.

Informed Consent Statement

Not applicable.

Data Availability Statement

The data presented in this study are available on request from the corresponding author. The data are not publicly available due to privacy.

Acknowledgments

We gratefully acknowledge the support of the Postgraduate Research and Practice Innovation Program of Jiangsu Province with grant number KYCX21_0097.

Conflicts of Interest

The authors declare no conflict of interest.

Nomenclature

ANode-pipeline matrix, dimensionless
aijElement of A
AwtArea swept by the wind turbine blades, m2
ApvArea of PV panels, m2
AwbScale parameter of Weibull distribution, dimensionless
BLoop-pipeline matrix, dimensionless
bnjElement of B
CmHydrogen concentration, kg/m3
CwindWind energy utilization coefficient, dimensionless
DDiffusion coefficient, m2/s
dInner diameter of the pipe, mm
FTurbulent scale, m
fmMass fraction which varies between 0 and 1, dimensionless
fvVolume fraction which varies between 0 and 1, dimensionless
GDiagonal admittance matrix, dimensionless
gijElement of G
HEffective head, m
JDiffusion flux, kg/m2·s
KNSurface roughness coefficient, 0.004, dimensionless
KwbShape parameter of Weibull distribution, dimensionless
LLength of the pipe, m
MA, MBMolecular weights of components A and B, g/mol
NConvection flux, kg/(m2·s)
NsamNumber of spectral sampling points, dimensionless
pTotal pressure, Pa
Phydro,outPower output of the hydropower station, MW
Phydro-HHydropower output that can be used to produce hydrogen, MW
P h y d r o , g r i d max Maximum output of the hydropower station integrated into the grid, MW
Psolar,outPower output of the PV power station, MW
Psolar-HSolar power output that can be used to produce hydrogen, MW
P s o l a r , g r i d max Maximum output of the PV power station integrated into the grid, MW
Pwind,outPower output of the wind farm, MW
Pwind-HWind power output that can be used to produce hydrogen, MW
P w i n d , g r i d max Maximum output of the wind farm integrated into the grid, MW
QBranch flow vector, m3/s
QwaterWater flow rate, m3/s
SPipeline flow resistance coefficient matrix, dimensionless
SAThe light component of light intensity, W/m2
SBThe random weakening component of light intensity, W/m2
SsolarLight intensity, W/m2
S w max Maximum light intensity statistical value under certain local weather, W/m2
TFluid Temperature, K
tIndex to time, min
TnAbsolute temperature under standard conditions, 273.15 K
T1GThe time when the abrupt change starts, min
TGThe change period, min
T1RStart time of the gradual change, min
T2REnd time of the gradual change, min
TRHolding time after the gradual change, min
TrSunrise time, min
TdSunset time, min
uFluid velocity variable that varies along the pipeline, m/s
VABase wind velocity, m/s
VBGust wind velocity, m/s
VCRamp wind velocity, m/s
VDNoise wind velocity, m/s
VwindWind velocity acting on the wind turbine, m/s
xIndex to pipeline length, m
XiA parameter that obeys the Bernoulli distribution, dimensionless
ZCompressibility factor, dimensionless
ηhydroEfficiency of the power station unit, dimensionless
ηmEfficiency of MPPT, dimensionless
ηpvEfficiency of PV panels, dimensionless
γSpecific weight of water, 9810 N/m3
ΓGamma function, dimensionless
ωiAngular frequency of sampling point i, rad/s
φiA random variable obeying a uniform distribution between [0, 2π], rad/s
μAverage wind velocity at the relative height, m/s
ρfluid density, kg/m3
ρairAir density, kg/m3
λFriction resistance coefficient of pipelines, dimensionless
λlWeakening degree of the cloud to the light intensity, dimensionless
θAngle of incidence of PV panels, °
αFluid velocity, m/s
vGas flow rate, m/s
ξA parameter that is only related to temperature and gas species, Pa·m2/s
κ1The empirical constant for low pressure networks, dimensionless
κ2The empirical constant for medium and high pressure networks, dimensionless
Δω Sampling step size, rad/s
Δpab Pressure drop between node a and node b, Pa
ΣVA, ΣVBMolecular diffusion volumes of components A and B, cm3/mol

Appendix A

Table A1. Parameters of the seven-node natural gas network in the case study.
Pipe No.Start NodeEnd NodeLength (m)Diameter (mm)Pipeline Flow
Resistance Coefficient
17127,0006600.01
21222,5006600.015
32418,0005000.005
42318,0005000.01
54536,0003300.02
64627,0003300.015
Table A2. Gas load of the seven-node natural gas network in the case study.
Node No.Gas Load (m3/s)
10
20
30
40.18
50.13
60.09
70

Appendix B

Table A3. Parameters of the gust wind velocity in Scenario I in the case study.
Gust Wind
Velocity No.
Start Time DurationMaximum Wind
Velocity (m/s)
14:006 h0.4
214:006 h0.3
322:001.5 h0.2
Table A4. Parameters of the ramp wind velocity in Scenario I in the case study.
Ramp Wind Velocity No.Start Time End TimeHold Time after RampMaximum Wind Velocity (m/s)
13:0016:005 h0.7
Table A5. Parameters of the interday light components in Scenario I in the case study.
Sunrise TimeSunset Time Maximum Light Intensity Statistical Value (Lux)
5:3017:3027,000

Appendix C

Table A6. Parameters of the gust wind velocity in Scenario II in the case study.
Gust Wind
Velocity No.
Start Time DurationMaximum Wind
Velocity (m/s)
13:007 h0.4
212:008 h0.4
320:004 h0.2
Table A7. Parameters of the ramp wind velocity in Scenario II in the case study.
Ramp Wind Velocity No.Start Time End TimeHold Time after RampMaximum Wind Velocity (m/s)
11:005:006 h0.9
212:0018:005 h1.1
Table A8. Parameters of the interday light components in Scenario II in the case study.
Sunrise TimeSunset Time Maximum Light Intensity Statistical Value (Lux)
5:3017:3015,000

Appendix D

Table A9. Parameters of the gust wind velocity in Scenario III in the case study.
Gust Wind
Velocity No.
Start Time DurationMaximum Wind
Velocity (m/s)
13:007 h0.4
212:008 h0.35
320:004 h0.2
Table A10. Parameters of the ramp wind velocity in Scenario III in the case study.
Ramp Wind Velocity No.Start Time End TimeHold Time after RampMaximum Wind Velocity (m/s)
11:005:006 h0.8
212:0018:005 h1
Table A11. Parameters of the interday light components in Scenario III in the case study.
Sunrise TimeSunset Time Maximum Light Intensity Statistical Value (Lux)
5:3017:3021,000

References

  1. Ogden, J.; Jaffe, A.M.; Scheitrum, D.; McDonald, Z.; Miller, M. Natural Gas as a Bridge to Hydrogen Transportation Fuel: Insights from the Literature. Energy Policy 2018, 115, 317–329. [Google Scholar] [CrossRef]
  2. Sorgulu, F.; Dincer, I. Analysis and Techno-Economic Assessment of Renewable Hydrogen Production and Blending into Natural Gas for Better Sustainability. Int. J. Hydrogen Energy 2022, 47, 19977–19988. [Google Scholar] [CrossRef]
  3. Quarton, C.J.; Samsatli, S. Should We Inject Hydrogen into Gas Grids? Practicalities and Whole-System Value Chain Optimisation. Appl. Energy 2020, 275, 115172. [Google Scholar] [CrossRef]
  4. Ishaq, H.; Dincer, I.; Crawford, C. A Review on Hydrogen Production and Utilization: Challenges and Opportunities. Int. J. Hydrogen Energy 2021, 47, 26238–26264. [Google Scholar] [CrossRef]
  5. Velazquez Abad, A.; Dodds, P.E. Green Hydrogen Characterisation Initiatives: Definitions, Standards, Guarantees of Origin, and Challenges. Energy Policy 2020, 138, 111300. [Google Scholar] [CrossRef]
  6. Qiu, Y.; Zhou, S.; Gu, W.; Pan, G.; Chen, X. Application Prospect Analysis of Hydrogen Enriched Compressed Natural Gas Technologies Under the Target of Carbon Emission Peak and Carbon Neutrality. Zhongguo Dianji Gongcheng Xuebao/Proc. Chin. Soc. Electr. Eng. 2022, 42, 1301–1320. [Google Scholar] [CrossRef]
  7. Nederlandse Gasunie, N.V. Using the Existing Natural Gas System for Hydrogen—[PDF Document]. In Naturalhy; European Union: Brussels, Belgium, 2009. [Google Scholar]
  8. Kippers, M.J.; De Laat, J.C.; Hermkens, R.J.M. Pilot Project on Hydrogen Injection in Natural Gas on Island of Ameland in the Netherlands. In Proceedings of the International Gas Research Conference, Seoul, Korea, 19–21 October 2011. [Google Scholar]
  9. GRHYD Project Inaugurates First P2G Demonstrator in France. Fuel Cells Bull. 2018, 2018, 9–10. [CrossRef]
  10. Northern Gas Networks. H21 Leeds City Gate; Wales and West Utilities: Newport, UK, 2016. [Google Scholar]
  11. Western Sydney Green Gas Project. Available online: https://research.csiro.au/hyresearch/western-sydney-green-gas-project/ (accessed on 14 June 2022).
  12. Zhang, Z.; Saedi, I.; Mhanna, S.; Wu, K.; Mancarella, P. Modelling of Gas Network Transient Flows with Multiple Hydrogen Injections and Gas Composition Tracking. Int. J. Hydrogen Energy 2022, 47, 2220–2233. [Google Scholar] [CrossRef]
  13. Cheli, L.; Guzzo, G.; Adolfo, D.; Carcasci, C. Steady-State Analysis of a Natural Gas Distribution Network with Hydrogen Injection to Absorb Excess Renewable Electricity. Int. J. Hydrogen Energy 2021, 46, 25562–25577. [Google Scholar] [CrossRef]
  14. Hafsi, Z.; Elaoud, S.; Mishra, M. A Computational Modelling of Natural Gas Flow in Looped Network: Effect of Upstream Hydrogen Injection on the Structural Integrity of Gas Pipelines. J. Nat. Gas Sci. Eng. 2019, 64, 107–117. [Google Scholar] [CrossRef]
  15. Tabkhi, F.; Azzaropantel, C.; Pibouleau, L.; Domenech, S. A Mathematical Framework for Modelling and Evaluating Natural Gas Pipeline Networks under Hydrogen Injection. Int. J. Hydrogen Energy 2008, 33, 6222–6231. [Google Scholar] [CrossRef]
  16. Zhou, D.; Yan, S.; Huang, D.; Shao, T.; Xiao, W.; Hao, J.; Wang, C.; Yu, T. Modeling and Simulation of the Hydrogen Blended Gas-Electricity Integrated Energy System and Influence Analysis of Hydrogen Blending Modes. Energy 2022, 239, 121629. [Google Scholar] [CrossRef]
  17. Ekhtiari, A.; Flynn, D.; Syron, E. Investigation of the Multi-Point Injection of Green Hydrogen from Curtailed Renewable Power into a Gas Network. Energies 2020, 13, 6047. [Google Scholar] [CrossRef]
  18. Pellegrino, S.; Lanzini, A.; Leone, P. Greening the Gas Network—The Need for Modelling the Distributed Injection of Alternative Fuels. Renew. Sustain. Energy Rev. 2017, 70, 266–286. [Google Scholar] [CrossRef]
  19. Li, L.; Manier, H.; Manier, M.-A. Hydrogen Supply Chain Network Design: An Optimization-Oriented Review. Renew. Sustain. Energy Rev. 2019, 103, 342–360. [Google Scholar] [CrossRef]
  20. Tarasov, B.P.; Fursikov, P.V.; Volodin, A.A.; Bocharnikov, M.S.; Shimkus, Y.Y.; Kashin, A.M.; Yartys, V.A.; Chidziva, S.; Pasupathi, S.; Lototskyy, M.V. Metal Hydride Hydrogen Storage and Compression Systems for Energy Storage Technologies. Int. J. Hydrogen Energy 2021, 46, 13647–13657. [Google Scholar] [CrossRef]
  21. Qiu, Y.; Zhou, S.; Wang, J.; Chou, J.; Fang, Y.; Pan, G.; Gu, W. Feasibility Analysis of Utilising Underground Hydrogen Storage Facilities in Integrated Energy System: Case Studies in China. Appl. Energy 2020, 269, 115140. [Google Scholar] [CrossRef]
  22. Portarapillo, M.; Di Benedetto, A. Risk Assessment of the Large-Scale Hydrogen Storage in Salt Caverns. Energies 2021, 14, 2856. [Google Scholar] [CrossRef]
  23. Zhang, S.; Wang, S.; Zhang, Z.; Lyu, J.; Cheng, H.; Huang, M.; Zhang, Q. Probabilistic Multi-Energy Flow Calculation of Electricity–Gas Integrated Energy Systems With Hydrogen Injection. IEEE Trans. Ind. Appl. 2022, 58, 2740–2750. [Google Scholar] [CrossRef]
  24. Gunawan, T.A.; Singlitico, A.; Blount, P.; Monaghan, R.F.D. Towards Techno-Economic Evaluation of Renewable Hydrogen Production from Wind Curtailment and Injection into the Irish Gas Network. In Proceedings of the Proceedings of ECOS 2019; Wroclaw, Poland, 23–28 June 2019.
  25. Wang, B.; Klemeš, J.J.; Liang, Y.; Yuan, M.; Zhang, H.; Liu, J. Implementing Hydrogen Injection in Coal-Dominated Regions: Supply Chain Optimisation and Reliability Analysis. Energy 2020, 201, 117565. [Google Scholar] [CrossRef]
  26. Ma, T.; Wu, J.; Hao, L. Energy Flow Calculation and Integrated Simulation of Micro Energy Grid with Combined Cooling, Heating and Power. Dianli Xitong Zidonghua/Autom. Electr. Power Syst. 2016, 40, 22–27. [Google Scholar] [CrossRef]
  27. Ministry of Housing and Urban-Rural Development of the People’s Republic of China. General Administration of Quality Supervision, Inspection and Quarantine of the People’s Republic of China Code for Design of City Gas Engineering; Ministry of Housing and Urban-Rural Development of the People’s Republic of China: Beijing, China, 2006.
  28. Osiadacz, A. Simulation and Analysis of Gas Networks; Gulf Publishing Company: Houston, TX, USA, 1987. [Google Scholar]
  29. Fatih Birol. The Future of Hydrogen: Seizing Today’s Opportunities; International Energy Agency: Tokyo, Japan, 2019. [Google Scholar]
  30. Wang, J.; Xu, F.; Jin, H.; Chen, Y.; Wang, Y. Non-Noble Metal-Based Carbon Composites in Hydrogen Evolution Reaction: Fundamentals to Applications. Adv. Mater. 2017, 29, 1605838. [Google Scholar] [CrossRef] [PubMed]
  31. Lopes, V.S.; Borges, C.L.T. Impact of the Combined Integration of Wind Generation and Small Hydropower Plants on the System Reliability. IEEE Trans. Sustain. Energy 2015, 6, 1169–1177. [Google Scholar] [CrossRef]
  32. Anderson, P.M.; Bose, A. Stability Simulation Of Wind Turbine Systems. IEEE Trans. Power Appar. Syst. 1983, PAS-102, 3791–3795. [Google Scholar] [CrossRef]
  33. Raiambal, K.; Chellamuthu, C. Modeling and Simulation of Grid Connected Wind Electric Generating System. In Proceedings of the 2002 IEEE Region 10 Conference on Computers, Communications, Control and Power Engineering, Beijing, China, 28–31 October 2002; Volume 3, pp. 1847–1852. [Google Scholar]
  34. Shinong, W.; Qianlong, M.; Jie, X.; Yuan, G.; Shilin, L. An Improved Mathematical Model of Photovoltaic Cells Based on Datasheet Information. Solar Energy 2020, 199, 437–446. [Google Scholar] [CrossRef]
  35. Ding, M.; Xu, Z.; Zhao, B.; Bi, R. Solar Irradiance Model for Large-Scale Photovoltaic Generation Considering Passing Cloud Shadow Effect. Zhongguo Dianji Gongcheng Xuebao/Proc. Chin. Soc. Electr. Eng. 2015, 35, 4291–4299. [Google Scholar] [CrossRef]
  36. Rahman, M.H.; Yamashiro, S. Novel Distributed Power Generating System of PV-ECaSS Using Solar Energy Estimation. IEEE Trans. Energy Convers. 2007, 22, 358–367. [Google Scholar] [CrossRef]
  37. Batchelor, C.K.; Batchelor, G.K. An Introduction to Fluid Dynamics; Cambridge University Press: Cambridge, UK, 2000. [Google Scholar]
  38. Dell’Isola, M.; Ficco, G.; Moretti, L.; Jaworski, J.; Kułaga, P.; Kukulska–Zając, E. Impact of Hydrogen Injection on Natural Gas Measurement. Energies 2021, 14, 8461. [Google Scholar] [CrossRef]
  39. Hafsi, Z.; Elaoud, S.; Akrout, M.; Hadj-Taïeb, E. Numerical Approach for Steady State Analysis of Hydrogen–Natural Gas Mixtures Flows in Looped Network. Arab. J. Sci. Eng. 2017, 42, 1941–1950. [Google Scholar] [CrossRef]
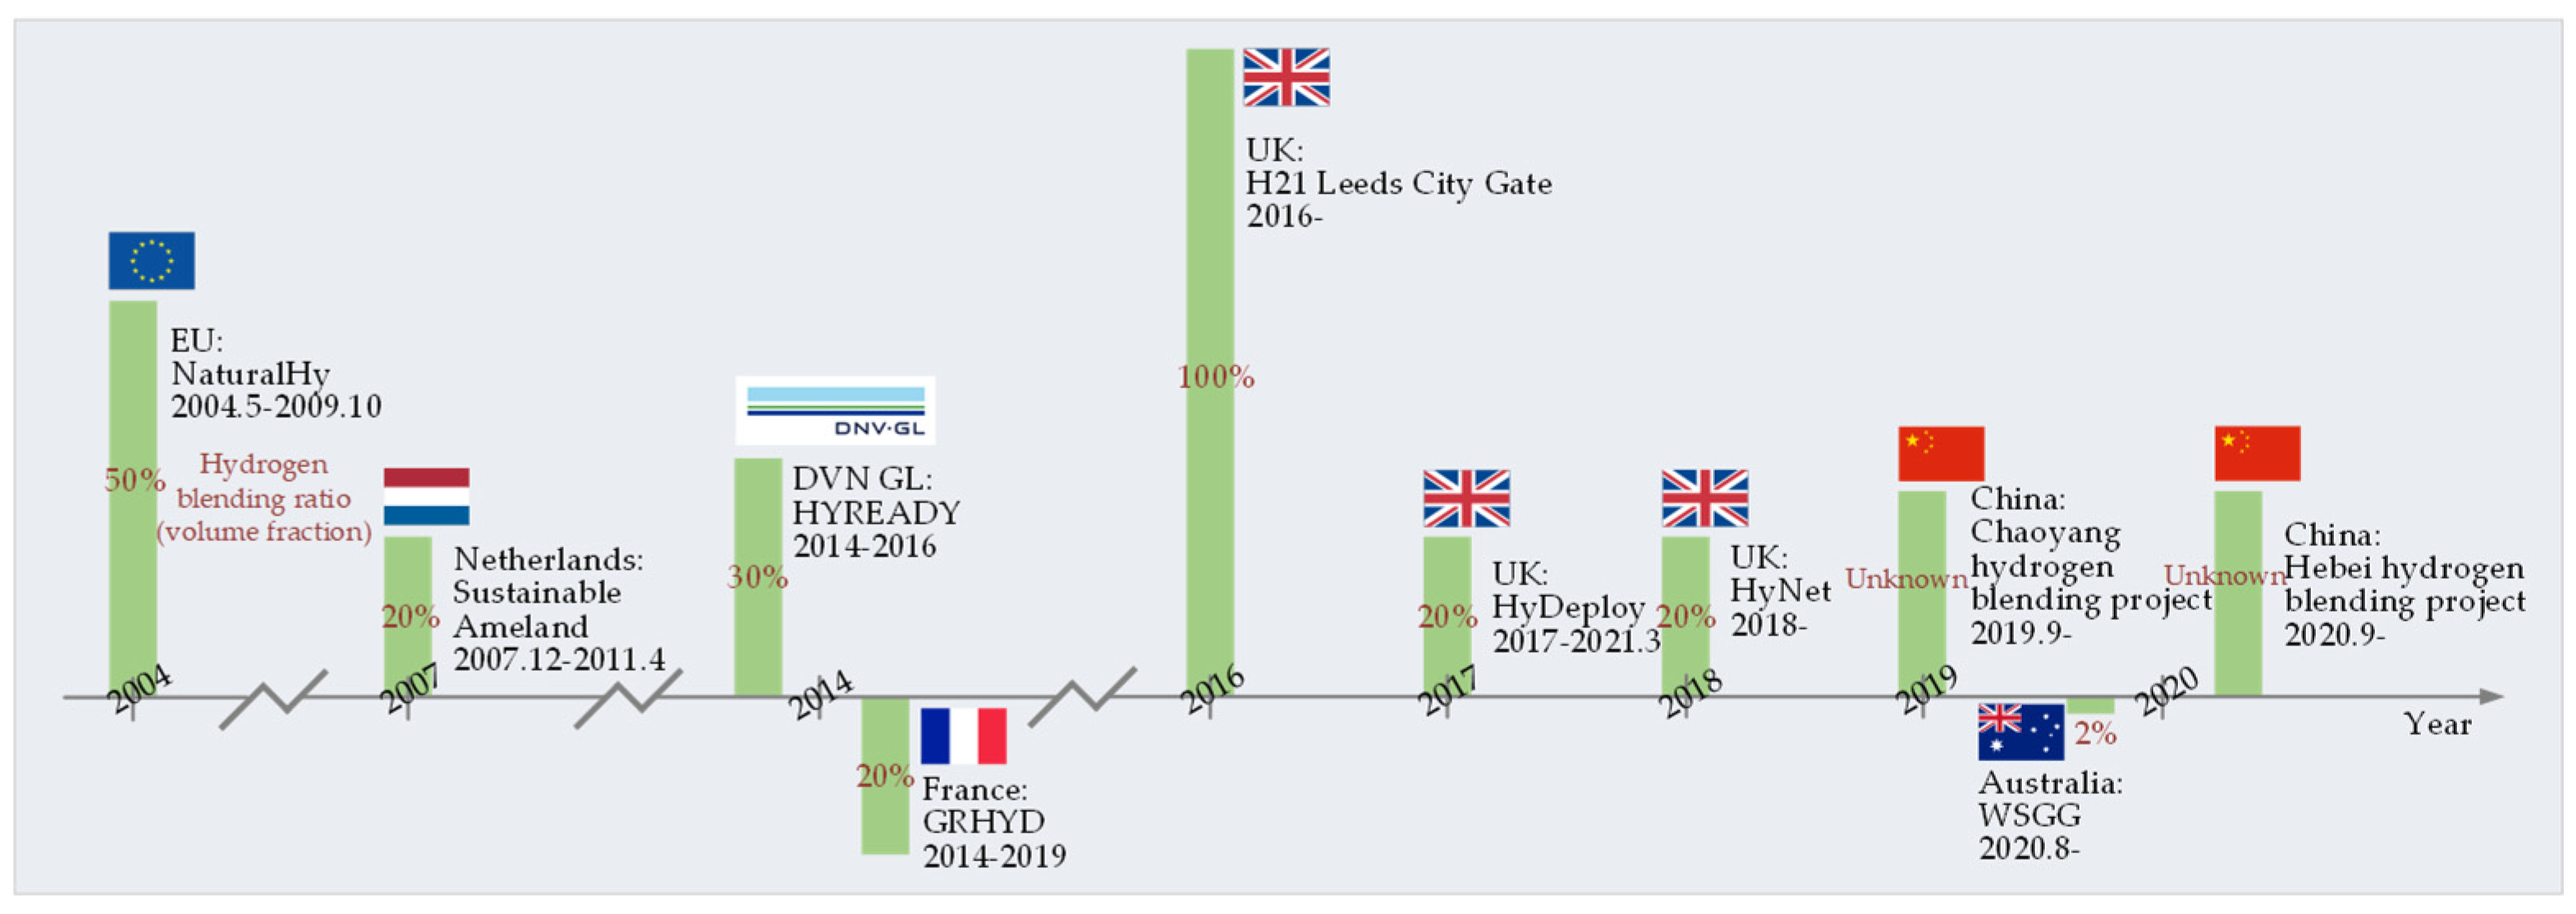
Figure 1. Status of HCNG-related projects worldwide.
Processes 10 01757 g001
Figure 2. Algorithm flowchart of natural gas steady flow calculation.
Processes 10 01757 g002
Figure 3. Overall simulation process of hydrogen diffusion in natural gas network.
Processes 10 01757 g003
Figure 4. Schematic diagram of the studied seven-node natural gas network structure.
Processes 10 01757 g004
Figure 5. The simulation results of the isothermal steady-state natural gas network: (a) Gas flow rate; (b) node pressure; (c) annotation in the natural gas network.
Processes 10 01757 g005
Figure 6. The distribution of hydrogen mass fraction in Pipe 1: (a) Three-dimensional diagram; (b) top view.
Processes 10 01757 g006
Figure 7. Renewable power output for hydrogen production in Scenario I.
Processes 10 01757 g007
Figure 8. The distribution of hydrogen mass fraction in Pipe 1 in Scenario I: (a) Three-dimensional diagram; (b) top view.
Processes 10 01757 g008
Figure 9. The distribution of hydrogen mass fraction in Pipe 2 in Scenario I: (a) Three-dimensional diagram; (b) top view.
Processes 10 01757 g009
Figure 10. The distribution of hydrogen mass fraction in Pipe 3 in Scenario I: (a) Three-dimensional diagram; (b) top view.
Processes 10 01757 g010
Figure 11. The distribution of hydrogen mass fraction in Pipe 4 in Scenario I: (a) Three-dimensional diagram; (b) top view.
Processes 10 01757 g011
Figure 12. The distribution of hydrogen mass fraction in Pipe 5 in Scenario I: (a) Three-dimensional diagram; (b) top view.
Processes 10 01757 g012
Figure 13. The distribution of hydrogen mass fraction in Pipe 6 in Scenario I: (a) Three-dimensional diagram; (b) top view.
Processes 10 01757 g013
Figure 14. Renewable power output for hydrogen production in Scenario II.
Processes 10 01757 g014
Figure 15. The distribution of hydrogen mass fraction in Pipe 4 in Scenario II: (a) Three-dimensional diagram; (b) top view.
Processes 10 01757 g015
Figure 16. The distribution of hydrogen mass fraction in Pipe 6 in Scenario II: (a) Three-dimensional diagram; (b) top view.
Processes 10 01757 g016
Figure 17. Renewable power output for hydrogen production in Scenario III.
Processes 10 01757 g017
Figure 18. The distribution of hydrogen mass fraction in Pipe 4 in Scenario III: (a) Three-dimensional diagram; (b) top view.
Processes 10 01757 g018
Figure 19. The distribution of hydrogen mass fraction in Pipe 6 in Scenario III: (a) Three-dimensional diagram; (b) top view.
Processes 10 01757 g019
Figure 20. The average mass fraction of hydrogen in the six pipelines under 3 scenarios.
Processes 10 01757 g020
Figure 21. The duration of hydrogen concentration violation in Scenario I and Scenario III.
Processes 10 01757 g021
Table 1. The results of hydrogen concentration violation of each pipe in Scenario I.
Pipe No.Maximum Mass
Concentration of H2 (%)
Start Time of
Violation
End Time of
Violation
11.37--
21.37--
31.92--
41.92--
53.57556 min/09:161210 min/20:10
63.57556 min/09:161258 min/20:58
Table 2. The results of hydrogen concentration violation of each pipe in Scenario II.
Pipe No.Maximum Mass
Concentration of H2(%)
Start Time of
Violation
End Time of
Violation
11.37--
21.37--
32.51--
42.51--
53.03--
63.03--
Table 3. The results of hydrogen concentration violation of each pipe in Scenario III.
Pipe No.Maximum Mass
Concentration of H2(%)
Start Time of
Violation
End Time of
Violation
11.37--
21.37--
32.20--
42.20--
53.42537 min/08:571131 min/18:51
63.42537 min/08:571180 min/19:40
Publisher’s Note: MDPI stays neutral with regard to jurisdictional claims in published maps and institutional affiliations.