Article

Impact of Subsidy Policy on Remanufacturing Industry’s Donation Strategy

1
School of Management, Nanjing University of Posts and Telecommunications, Nanjing 210003, China
2
School of Politics and Public Administration, Soochow University, Suzhou 510632, China
3
School of Maritime Economics and Management, Dalian Maritime University, Dalian 116026, China
*
Author to whom correspondence should be addressed.
Processes 2023, 11(1), 118; https://doi.org/10.3390/pr11010118
Submission received: 21 November 2022 / Revised: 27 December 2022 / Accepted: 28 December 2022 / Published: 1 January 2023
(This article belongs to the Special Issue Sustainable Supply Chains in Industrial Engineering and Management)

Abstract

:
Motivated by the donation subsidy policy, this paper studies a supply chain consisting of a manufacturer and a remanufacturer. The manufacturer sells new and remanufactured products and can also donate two products. The remanufacturer can only sell and donate remanufactured products. Using the Stackelberg game model, we investigate the optimal production and donation strategies of two competing firms and discuss how the subsidy policy affects these strategies. Our main results include the following: First, the donation strategies of the two firms are not only affected by the subsidies but could also be influenced by the competitor’s donation decision, especially when the subsidy is high. Second, the subsidized products for sale in the market will decline as the subsidy increases. Therefore, a high subsidy always causes insufficient market supply. Third, the first-mover advantage may not make the manufacturer avoid a dilemma; however, when the remanufacturer becomes the leader in the market, the first-mover advantage will help the remanufacturer prevent any competitor donation threats. Lastly, the scenario where the manufacturer donates nothing and the remanufacturer donates seems to be a Pareto improvement for two firms, but this scenario is not stable, and the last equilibrium is that both firms decide to donate remanufactured products.

1. Introduction

Market competition is becoming fierce, and while companies are trying to make more money, they are also paying more and more attention to improving environmental benefits and social concerns. As an example, the Chinese smartphone manufacturer Meizu created a special website called “Aihuishou” to collect end-of-life smartphones (such as iPhone, Meizu, and Samsung) from consumers [1]. By collecting used phones, there will be less pollution in our environment. In 2020, the Meizu company donated some “Meizu X8” smartphones to students living in poverty in the Zhuhai High-tech Zone, so that these students could gain knowledge through online courses in today’s epidemic age. This donation mainly solved the problem for students in poverty who could not access online material without phones. Through this donation, the Meizu company not only fulfilled its corporate social responsibility but also aroused social attention, which enhanced its brand awareness and reputation. Apart from the Meizu company, many other manufacturers are doing similar things, such as Apple, Samsung, Home Depot, and so on.
Remanufacturing is regarded as an environmentally friendly and energy-saving way to cope with end-of-life products by many companies [2,3]. Moreover, through remanufacturing, manufacturers (such as IBM, and Xerox) could produce remanufactured products for resale, though remanufactured products with low prices may compete with the new ones [4]. This huge profit cake not only makes manufacturers engage in remanufacturing but also attracts competition from many other enterprises (remanufacturers). Remanufacturing has brought huge benefits to manufacturers and remanufacturers, but at the same time, these companies have to face an inevitable problem [5]. The problem comes from consumers who always value less remanufactured products and have a low willingness to pay. To solve this, some companies try to donate remanufactured products to make them easier for consumers to accept. Meanwhile, a donation strategy could grasp the attention of consumers and recover the value of remanufactured products [6,7]. For example, in 2013, the “Beijing Tibet Trip” was held by the National Development and Reform Commission (NDRC, China). Plenty of remanufactured products were donated by remanufacturers to the Tibet Autonomous Region [8]. Therefore, in addition to sales, donations seem to be a way for enterprises to make full use of their remanufactured products. In this paper, we consider this point and start a further discussion on donating new or remanufactured products.
Since donations can help solve part of the market’s demand problems, ease the relationship between supply and demand, and realize the secondary allocation of resources, the government usually offers subsidies or incentives to the companies that make donations [9]. For instance, the Congress of the United States set a series of tax reduction policies to encourage companies to donate [10]. However, the manufacturer, who sells new and remanufactured products at the same time, may encounter a selection issue, namely, which product is better for donation. Donating new products may have higher consumer acceptance and be good for promoting product brands. While the cost of remanufactured products is low, donating remanufactured products can save money and avoid resource waste. From the remanufacturer’s perspective, selling remanufactured products is his main business, but as a competitor, the donations could be another way to market a competition strategy that would attract consumers’ attention, especially when the manufacturer donates first. Thus, the second objective of this paper is to study the impact of donation subsidy on the remanufacturing industries and outline the optimal coping strategy for the remanufacturer.
The first-mover advantage and the second-mover advantage have different effects on decision-making. In a competitive market, if the leader of the market changes, the optimal strategies for the two parties always differ. The subsidy policy may lead manufacturers or remanufacturers to adopt different strategies. So, under the subsidy policy, whether one party’s donation strategy will promote the other party to donate or will prevent the other party from donating is the third objective of this paper.
To solve the objectives above, we try to answer the following research questions: (1) What are the effects of government subsidies on the donation supply chain (price, production, and environmental impact)? (2) When the manufacturer chooses to donate, should the remanufacturer also choose to donate as a competitive strategy? (3) Under government subsidies, will the manufacturer and the remanufacturer have a prisoner’s dilemma (lose-lose) or a Pareto improvement (win-win) in their donation strategies? (4) In the case of government subsidies, do the manufacturer and the remanufacturer have the first-mover advantage or the second-mover advantage?
To make the research questions above clear, we consider a manufacturer and a remanufacturer who are competing with each other in a market and where the government provides subsidies for donations. According to the real cases in practice and the previous literature, we conclude that the manufacturer may have three donation strategies: no-donation, donating new products, and donating remanufactured products. However, the remanufacturer only has two donation strategies: no-donation and donating remanufactured products. Therefore, there are six donation scenarios in total. At first, we characterize each scenario’s optimal equilibrium and clarify the necessary conditions under each donation strategy. Next, we analyze the impact of the donation subsidy on the willingness of the two firms to donate and whether production and prices change when the subsidy increases. Further, we investigate the dilemma and the Pareto situations that the manufacturer and the remanufacturer may meet. Lastly, we discuss the situation where the remanufacturer moves first, and compare the findings with the results in the previous section.
This paper studies the donation strategy of the remanufacturing industry under a subsidy policy. As such, the conclusions bear strategic practical implications, such as suggestions to the remanufacturer on whether it is necessary to donate remanufactured products to cope with the manufacturer’s donation strategy. Second, this paper provides policy insights on how to set donation subsidies to encourage the remanufacturing industry to donate. Third, this paper is the first to study the first-mover advantage of donations and the second-mover advantage of donations for remanufacturing industries.
The remainder of the paper proceeds as follows: Section 2 introduces the related literature and points out the research gaps. Section 3 presents the model and notions used in this paper. Section 4 outlines the optimal donation strategy for the manufacturer and remanufacturer and points out the dilemma where the two parties may encounter a lose-lose. Section 5 includes an extensive discussion concerning the scenario where the remanufacturer moves first and shows the first-mover’s advantage. The last section concludes the paper and proposes managerial insights.

2. Literature Review

2.1. Remanufacturing

In practice, after collecting or recycling end-of-life products, enterprises always choose to make full use of them, for example through remanufacturing [11]. As the U.S. remanufacturing market value has reached USD 43 billion [12], there has been a lot of literature that focuses on remanufacturing [13,14,15,16,17,18,19,20,21,22,23,24,25]. For example, Chai et al. (2018) studied a monopoly market where a manufacturer sold new and remanufactured products at the same time. They found that remanufacturing could be environmentally friendly and profitable, and meanwhile, carbon cap and trade could be valuable for remanufacturing. However, green consumers also had great effects on remanufacturing, and excessive green consumers might not benefit the manufacturer, especially when the carbon trading price is high. Huang and Wang (2019) investigated a two-tier closed-loop supply chain in which the manufacturer granted the third-party remanufacturer a brand license. By discussing three remanufacturing scenarios: no-remanufacturing, partial-remanufacturing, and full- remanufacturing, they analyzed the impact of strategic consumer behavior and the remanufacturing cost of the third-party remanufacturer on the remanufacturing market. The results showed that, if the consumer became more strategic, the demand for new products would decline and the demand for remanufactured products would increase. Moreover, the manufacturer and a third-party remanufacturer could experience a win-win when the cost of the third-party remanufacturer is quite low. At this time, the manufacturer preferred the third-party remanufacturer to remanufacture rather than himself. Ma et al. (2020) discussed two options for consumers: buying new products or trading in for remanufactured products when there is only one manufacturer selling products in the market. Considering consumers’ double reference effects, they also put the remanufacturing subsidy and consumer rebate ratio into the model. The results showed that the remanufacturing subsidy could improve the profits of the manufacturer. The consumer’s rebate ratio only affected and increased the price of remanufactured products, but did not change the manufacturer’s profit. McKie et al. (2018) studied when there are multiple conditions and generations of products available, how consumers would evaluate remanufactured products, and the risks that remanufactured products brought to the new products. By analyzing the real data from the iPad on eBay, they found that the production, conditions, and attributes of the product all had great influences on shaping consumers’ purchasing decisions. The remanufactured products posed the same threat to new products as do used ones. The results provided insights on how to achieve more profitable remanufacturing for remanufacturing industries.
The remanufacturing literature suggests that more and more enterprises are engaging in remanufacturing to achieve a huge profit. Based on the previous studies, our paper focuses on the remanufacturing industries: the manufacturer sells new and remanufactured products together, and the remanufacturer only produces remanufactured products. To reflect the real market situation, except the product differentiation, this paper also considers the competition relationship between the manufacturer and the remanufacturer.

2.2. Donation

A donation usually seems to be a way for enterprises to achieve corporate social responsibility [26]. However, its social and practical significance is far-reaching. Many scholars have made great contributions to this topic [7,10,27,28,29,30,31,32,33,34,35,36,37]. For example, Arya and Mittendorf (2015) studied a firm’s donation inventory strategy, and they found that incentives from the government could help the firm achieve societal objectives. While the firm donated inventory by forgoing potential profit, they would be sensitive to the wholesale price, which might make the retail price higher. The results showed that incentives from the government not only promoted the firm’s donation but also had notable effects on supply chain members in the market. Modak et al. (2019) explored two corporate social responsibility tools consisting of donations and recycled investment. Considering the donation amount, recycling investment, pricing, and order quantity, they proposed a model for profit maximization under a carbon tax policy. The results showed that the consumer’s social work donation elasticity had a positive effect on recycling and that it could help reduce the carbon tax. Heydari and Mosanna (2018) investigated a cause-related market where the manufacturer contributed to the market by donating a sum per sold product. They developed two models to analyze the two-echelon supply chain coordination problem. One was the donation size as a portion of the retail price, and the other was that the retail price was a decision parameter. In their discussion, they concluded that developed models could help the manufacturer make the correct decisions on the donation size. Song et al. (2020) set profit donations as a corporate social responsibility investment and analyzed three donation models: the centralized model, the manufacturer’s donation model, and the retailer’s donation model. They found that subsidies from the government could not only improve market demand but could also increase the recycling rate. If the manufacturer chose to make a corporate social responsibility investment, it would benefit many parties, such as the government, the environment, the economy, and society.
Our paper also studies the donation strategies that the manufacturer and the remanufacturer may adopt in operating. In particular, we focus on the changing of donation strategies under the subsidy policy.

2.3. Subsidy

A subsidy is an incentive method that the government always uses to encourage enterprises to engage in producing, donating, selling, or other actions. When the government needs the market to reach a certain state or needs companies to complete certain tasks, subsidy policies are usually useful. The literature contains many subsidy models to help the government regulate the behavior of the market [6,8,38,39,40,41,42,43,44,45,46,47,48,49,50,51,52,53]. For instance, Cao et al. (2020) studied the optimal production and pricing decisions of two firms in a dual-channel supply chain under a remanufacturing subsidy policy and a carbon tax policy. Through discussing which policy was better for firms, they found that the output of remanufactured products would increase with the subsidy rate of the remanufacturing subsidy and that the output of new products would decrease with the subsidy rate of the carbon tax. The remanufacturing subsidy policy was more effective in terms of its carbon emissions. Gu et al. (2021) used the battery industry as their research objective and assumed that the government would provide subsidies for secondary users. The results showed that, if the remanufacturing rate was low or the battery’s remaining power was high, the government would begin to provide subsidies. Their findings helped firms manage closed-loop supply with secondary battery use and made the supply chain more efficient. Their study also contributed to the government improving the social economy and sustainability. Qiao and Su (2021) investigated how the subsidy affects remanufacturing activity and market competition. By building a game model, they discussed the impact of the government subsidy on production, profit, consumer surplus, and environmental benefits. They concluded that the profits of manufacturers and remanufacturers might decrease with the subsidy, so providing subsidies to improve environmental benefit and social surplus was not always a good choice. The government should make the competitive market and environmental impact of the per unit product clear before increasing the subsidy. Wang et al. (2018) have made a great contribution to the field of subsidy research, as they introduced donation subsidies for remanufactured products, which made the recovery of product value more meaningful. They studied the conditions under which a subsidy policy could improve environmental and economic performance. They found that the donation subsidy for remanufactured products could expand the demand for new and remanufactured products, and the subsidy could create a win-win situation, especially when the cost of the new product was low.
The literature on subsidies appears to focus on remanufactured and donated products, as the government always encourages firms to do this. Further, most of the prior work did not pay attention to donation strategies that the manufacturer may have in a competitive market when his competitor donates. Moreover, whether there could be a win-win donation strategy or a dilemma is still unclear. Thus, our paper tries to apply a Stackelberg game model to discuss two firms’ donation strategies under the donation subsidies.

2.4. Research Gap

Table 1 contains the work to date on this problem. From the literature, donation subsidies could benefit firms, consumers, and society [8]. However, most of the literature focused on remanufacturing subsidies and treated donations as a form of corporate social responsibility. Only a few papers studied the donation subsidy. Extending the work of Wang et al. (2018), we consider the donation strategy as a competition method that could be affected by donation subsidies. Six donation scenarios are discussed in this paper to address the remanufacturing industries’ optimal donation strategies, involving the Pareto improvement situation, where two firms could achieve a win-win; the single-win situation, where only one firm could achieve high profit; and the lose-lose situation, where both parties may lose advantages. While Qiao and Su (2021) examined the impact of subsidies on remanufacturing activity and market competition, they did not include the donation strategy, which can also serve as an effective means of competition. Wang et al. (2019) analyzed a manufacturer–retailer supply chain in which both the manufacturer and retailer may donate. Based on this, we extend this thinking and mainly explore the competition between a manufacturer and a remanufacturer. However, they marginalize the fact that the donation strategies of two firms may have different scenarios, and they did not distinguish between the first-mover advantage and the second-mover advantage. Thus, recognizing the difference that may be brought by different first-movers, we investigate two situations where the manufacturer acts as a first-mover and a second-mover, to show where the first-mover advantages and the second-mover advantages are, which could provide some useful managerial insights to firms.

3. Model Overview

Consider a manufacturer selling new and remanufactured products at the same time and a remanufacturer who only sells remanufactured products. There is a government that provides donation subsidies to encourage companies to donate, as highlighted in Figure 1.

3.1. Notation

We first introduce our demand functions and two chain members’ response and discuss the assumptions used. We frame the optimization problems of the manufacturer and the remanufacturer using the following notation: M and R denoting the manufacturer and the remanufacturer, respectively, subscripts n and r to denote new and remanufactured products, respectively, and subscript d to denote donation behavior. Table 2 contains the parameters, decision variables, and objectives used.
We assume that the product demand is for one cycle, that the product price and output are known, and that the donation subsidies (subsidy for donated new product and subsidy for donated remanufactured product) are unchanged. These assumptions are widely used in the recent remanufacturing and subsidy literature [27,32]. The manufacturer decides on how many new ( q n ) and remanufactured ( q M r ) products to make, and how many new ( q M d n ) or remanufactured ( q M d r ) products to donate. The remanufacturer needs to decide how many remanufactured products ( q R r ) to produce, and how many products ( q R d r ) to donate. The government will provide one or two kinds of subsidies, one ( s n ) for donated new products and one ( s r ) for donated remanufactured products.
According to previous research, consumers could choose to buy new or remanufactured products or not at all to maximize their utility [54,55]. Consumers have a perceived value v of a new product at price p n . We normalize this perception to [ 0 , 1 ] obtain the consumer’s utility for a new product as U n = v p n . Further, we assume that consumers set different perceived values for new and remanufactured products. When a consumer buys a remanufactured product, the consumer will value that product less, at price pr [56,57,58]. Suppose a consumer is willing to pay α v , α ( 0 , 1 ) , for a remanufactured product, this yields a utility of U r = α v p r . Thus, based on the two utility functions, we can derive two products’ price functions: p n = 1 q n α q M r + q R r , p r = α 1 q n q M r q R r , which are generally used in the literature [59,60].

3.2. Problem

We now state the problems that the manufacturer and the remanufacturer face separately. For the manufacturer, we denote the unit manufacturing cost by c n , the unit remanufacturing cost c M r . We assume that the total manufacturing and remanufacturing costs are non-linear in the quantity produced, which is widely used in the previous literature [61,62,63,64]. While we separately consider the manufacturer’s problem under different donation strategies, we present here only the problem formulation under donation strategies. Formulations for no donation, donating new products, and donating remanufactured products follow by setting (1) q d n = 0 , q M d r = 0 ; (2) q d n 0 , q M d r = 0 ; (3) q d n = 0 , q M d r 0 accordingly.
Π M = p n q n + p r q M r c n q n + q M d n 2 c M r q M r + q M d r 2 + s n q M d n + θ n q M d n + s r q M d r + θ r q M d r
The manufacturer maximizes profit by selling new and remanufactured products, receiving donation subsidies from the government, and earning a reputation through donations, rather than through manufacturing and remanufacturing costs.
Next, we define the remanufacturer’s problem. Let c R r denote the unit cost of remanufacturing. While the remanufacturer has two donation options, the formulation for no donation follows by setting q R d r to zero.
Π R = p r q R r c R r q R r + q R d r 2 + s r q R d r + θ r q R d r
The remanufacturer maximizes profit by selling remanufactured products, receiving donation subsidies from the government, and earning a reputation through donations, rather than through the remanufacturing cost. Finally, because the remanufacturer should collect end-of-life products first, the remanufacturer can be seen as a second-mover in the market, as shown in Figure 2.
To reveal different donation scenarios, we use Table 3 to show the manufacturer’s and the remanufacturer’s donation strategies. Let <0,0> denote the scenario where there is no donation, <n,0> only the manufacturer denoting new products, <r,0> only the manufacturer denoting remanufactured products, <0,r> only the remanufacturer denoting remanufactured products, <n,r> the manufacturer denoting new products and the remanufacturer denoting remanufactured products, <r,r> both the manufacturer the remanufacturer denoting remanufactured products.
We derive the Nash equilibrium of the Stackelberg game between the manufacturer and the remanufacturer by solving the first-order conditions.

4. Analysis

In this section, we first characterize the manufacturer’s and the remanufacturer’s optimal decisions in equilibrium under different donation scenarios. We then discuss the impact of a subsidy on products, prices, profits, and donation strategies for the two parties.

4.1. Characterization of Equilibrium

We summarize each donation scenario’s optimal decisions in Table 4 (the related proofs can be found in Appendix A).
Where T 1 = c M r ( 2 c R r + ( 2 α ) α ) , T 2 = 2 c M r α 2 2 α T 3 ( 1 + c n α ) , T 3 = 2 c R r + α , T 4 = c M r 2 c R r 1 + Δ n + α 2 + 2 Δ n + α , T 5 = α Δ r α 2 2 c n + α c n , T 6 = Δ r + α , T 7 = c M r 2 c R r 1 + Δ n + α 2 + 2 Δ n α , T 8 = α / c R r + α , T 9 = α 1 + c n α , T 10 = c M r 2 c R r 1 + c n + α 2 + 2 c n α , T 11 = α Δ r α 2 2 c n + α c n , T 12 = 1 + Δ n + α , T 13 = c M r Δ r + c n Δ r c n α , T 14 = 2 + 2 Δ n Δ r + α , T 15 = c M r α Δ r 4 Δ r + α 2 + 2 Δ n α , T 16 = c M r 2 α + 1 α α , T 17 = 2 2 α α Δ r , T 18 = T 17 + c R r 4 Δ r + α T 14 , T 19 = c M r 2 α Δ r 2 + 2 c n α + η 1 c R r , T 20 = 2 α Δ r + c R r 3 Δ r α , T 21 = c M r 2 + 2 c n α .

4.2. Impact of Subsidies on Donation Willingness

Comparing the equilibrium of the different donation scenarios, we can derive some insights regarding how the donation subsidies affect the manufacturer’s and the remanufacturer’s donation willingness, which are summarized in Proposition 1–3 (the related proofs can be found in Appendix B).
Proposition 1.
If the remanufacturer adopts no donation strategy.
1.
Under the <n,0> scenario, only when the subsidy is satisfied: s n > s n < n , 0 > , the manufacturer will choose to donate new products;
2.
Under the <r,0> scenario, only when the subsidy is satisfied: s r > s r < r , 0 > , the manufacturer will choose to donate remanufactured products.
Proposition 1 shows the situation where the remanufacturer will not donate and the necessary conditions that encourage the manufacturer to donate. Proposition 1 (1) and (2) indicate that the donation subsidies could affect the manufacturer’s donation willingness. Low subsidies will not make the manufacturer adopt a donation strategy, but high subsidies will. However, from Proposition 1 (2), we also notice that a high subsidy for donated remanufactured products could influence the manufacturer’s donation decision. However, at this time, it is reasonable for the remanufacturer to change his donation strategy, especially when the high subsidy could bring more benefits. Next, we will discuss when the remanufacturer’s willingness changes with an increasing subsidy.
Proposition 2.
The necessary condition for the remanufacturer to adopt a donation strategy is that the subsidy should meet: s r > m i n s r < 0 , r > , s r < n , r > , s R r < r , r > .
Proposition 2 reveals that there are three situations where the remanufacturer chooses to donate remanufactured products. Depending on the donation subsidy, the remanufacturer’s willingness to donate may differ, while the manufacturer may have different donation strategies. From Proposition 2, we conclude the necessary condition for the remanufacturer to donate. As long as the subsidy is higher than m i n s r < 0 , r > , s r < n , r > , s R r < r , r > , the remanufacturer can choose a donation strategy. If the subsidy is higher than m a x s r < 0 , r > , s r < n , r > , s R r < r , r > , we find that the remanufacturer will donate products, regardless of whether the manufacturer donates or not. However, when the subsidy is higher than m i n s r < 0 , r > , s r < n , r > , s R r < r , r > , but lower than m a x s r < 0 , r > , s r < n , r > , s R r < r , r > , the donation decision for the remanufacturer may be complicated. In this situation, the manufacturer and the remanufacturer will compete in the donation field, and their donation strategies will interact with each other. We will explore this deeply in Section 4.3 and Section 4.4. Because of their competitive donating relationship, we must make it clear when the manufacturer will donate new products and when he will donate remanufactured ones to cope with the remanufacturer’s donation strategies.
Proposition 3.
If the remanufacturer adopts a donation strategy.
1.
The necessary condition for the manufacturer to donate new products (<n,r> scenario) is that the subsidy should meet: s n > s n < n , r > .
2.
The necessary condition for the manufacturer to donate remanufactured products (<r,r> scenario) is that the subsidy should meet: s r > s M r < r , r > .
Proposition 3 answers the question of what the manufacturer will do to compete with the remanufacturer under the different subsidy situations. Compared with the results from Proposition 1, we find that the manufacturer’s willingness to donate changes (the thresholds of subsidy for the manufacturer to donate are different) when the remanufacturer participates in the donation. Further, we notice that s n < n , r > > s n < n , 0 > and s M r < r , r > > s M r < r , 0 > , which means that, when the remanufacturer chooses to donate, only higher subsidies for the manufacturer will encourage him to donate.

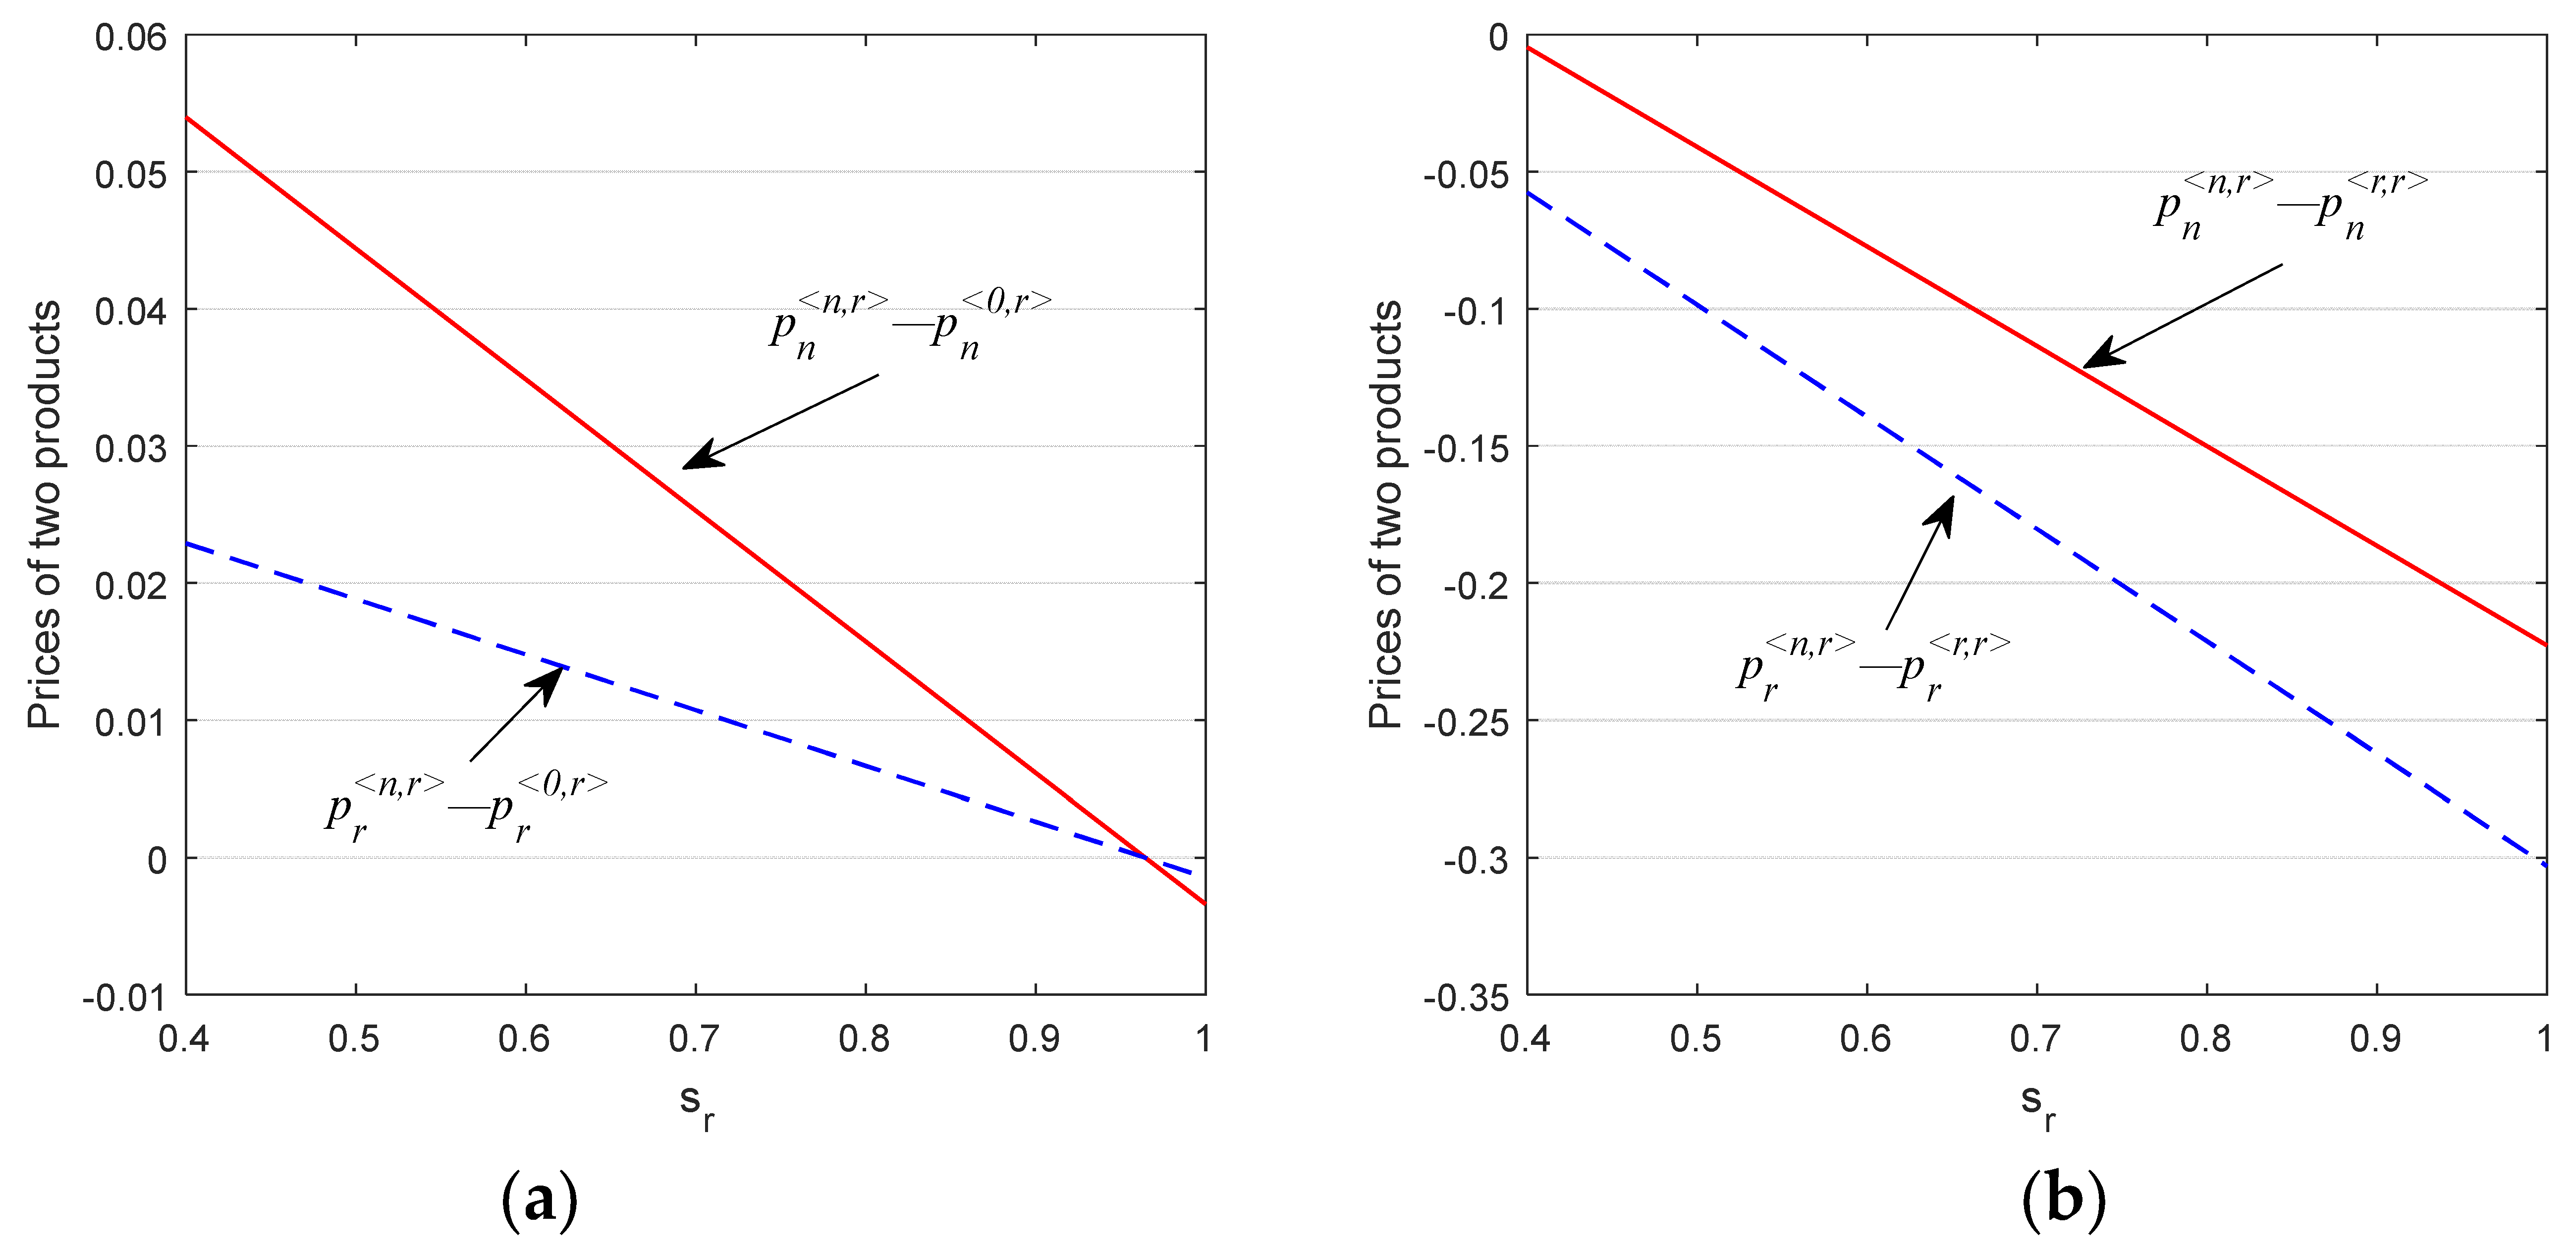
4.3. Impact of Subsidies on Products and Prices

In Section 4.2, we have discussed the willingness of the manufacturer and the remanufacturer to donate, and we also notice that different donation strategies will bring different results in production decisions and pricing decisions, which deeply influence the market supply. Therefore, in this section, we will continue to investigate how the subsidies affect products and prices (the related proofs can be found in Appendix B).
Proposition 4.
The donation decisions of the manufacturer and the remanufacturer are affected by donation subsidies.
1.
The sales share of subsidized products (such as when the manufacturer donates new products and also sells new products) in the market will decrease with the increase in the subsidy;
2.
However, other products’ output will increase;
3.
When two subsidies exist, the donated products will be negatively affected by the other subsidy’s increase.
Proposition 4 reveals the relationships between subsidies and products. Except for the common sense that high subsidy leads to high donated products, the back effect of the subsidy is that the subsidized products for sale in the market will decline as the subsidy increases. From this, the management insight for policymakers is that products with a large demand in the market should not be given high donation subsidies to avoid insufficient market supply. However, from Proposition 4 (2), we also notice that products that compete with donated products will become highly productive (such as in the <n,0> scenario, new products for sale in the market decline, but the remanufactured products become more). The management insight here indicates that if policymakers prefer to encourage competing products to be put on the market, a high subsidy for original products may be a good choice. Finally, Proposition 4 (3) shows the donation competition situation where the manufacturer donates new products and the remanufacturer donates remanufactured products. A typical subsidy dilemma has happened, and it becomes complicated for policymakers to decide how to set two subsidies because one subsidy may hurt another product’s output. For this reason, we know that higher subsidies are not always better and that they are usually accompanied by negative effects. Policymakers should be aware of the duality of subsidies and set them properly.
Corollary 1.
When the government adopts subsidies strategies for new products (or remanufactured products), the total amount of new products (or remanufactured products), including for sale and donation, will increase, which means that donation subsidies have a positive stimulating effect on this product.
Serving as a complementary conclusion of Proposition 4, Corollary 1 shows the impact of the subsidies policy on the total subsidized products. Taking scenario <n,0> as an example, we can see that despite the new products for sale will decrease with the subsidy, the increase in donated new products could offset the decline in the former. This increases the total amount of new products by the manufacturer.
Due to the shortage of global chip supply, some automakers have been unable to guarantee the supply of cars on time and in quantity (such as the Tesla Model 3 and the BYD Song Plus DM-i). Sundar Kamak (Head of Manufacturing Solutions at Ivalua) suggested taking used chips back and remanufacturing key components. The management insight of Corollary 1 here is that the policymakers could provide subsidies for donated remanufactured products to achieve high production. For example, providing a subsidy on donated used chips may lead to chip remanufacturing, which could ease the woes of chip shortages in the market. The fundamental reason is that donation subsidies stimulate donation behavior. To enjoy such subsidies, firms are willing to donate products in their hands or collect used products in advance. In this way, the market demand for the product increases, which further stimulates the production of the manufacturer and the remanufacturer. This also indicates that the government tries to use the invisible power of donation subsidies to stimulate end-demand and drive upstream supply.
Proposition 5.
In scenario <0,r>, if and only if s r s r < 0 , r > , s r * , both new and remanufactured products have price disadvantages, however, when s r  is increasing, the price advantages of the two products will gradually appear. In other donation scenarios, the new products and the remanufactured products always have price advantages.
Proposition 5 shows the relationship between donation subsidies and product prices. In most cases, the products’ prices are higher than those in scenario <0,0> and prices will increase with the subsidies. This is because high subsidies make the donated products more expensive (as mentioned in Proposition 4). However, donation is a non-profit strategy, so to offset this, the manufacturer or the remanufacturer needs to set high sale prices. However, if only the remanufacturer chooses to donate, the prices of two products could be lower than those in scenario <0,0>. The reason for this is that the remanufacturer (a follower in the market) tries to use the donation strategy as a competing method to gain market share. In the beginning, the subsidy for the remanufactured products improves the new products’ output, and at the same time, the remanufacturer could gain more consumer traction with a low price. However, with the increase in the subsidy, the manufacturer and the remanufacturer will raise their prices to achieve more profits (as explained above).
Proposition 5 has compared prices in the <0,0> scenario with prices in other scenarios. Next, we will discuss the prices in each scenario and see what the difference in prices is and what the impact of the subsidies is on them. Figure 3 depicts the impacts of the subsidies on the prices of new and remanufactured products in scenario <n,0> and scenario <n,r>. Based on Figure 3, first, without considering that the manufacturer will change his donation strategy, the prices of two products in the market are always raised as the remanufacturer participates in donation, even if the donation strategy will make the remanufacturer’s products for sale decline. It means that the remanufacturer could expand the price (remanufactured products’ price) advantage through a donation strategy. This may help explain why the remanufacturer will follow the manufacturer’s donation strategy. Second, as stated in Proposition 5, increasing subsidies can drive price advantages to appear. Figure 3 implies that both subsidies (the subsidy for new products and the subsidy for remanufactured products) have incentives for price advantages. It also shows that the subsidy for donated remanufactured products increases the price advantages of remanufactured products even more. Third, Figure 3 also tells us that adopting two subsidies’ policies is more conducive to stimulating the prices of products. Consumers need to pay more in the market while receiving donations. One reason is that, after subsidizing the donated products, consumers have a high surplus value when they purchase the products, and meanwhile, consumers will achieve a high reserve price for the products, which leads to a high price for sale in the market.
However, things are changed when <n,r> scenario compares with <0,r> and <r,r> scenarios. Figure 4a reveals that, compared with the <0,r> scenario, new products and remanufactured products have price advantages when the <n,r> scenario is the two parties’ donation strategy. However, with the increase in the subsidy for donated remanufactured products, the price advantages of the two products will decline until the advantages disappear. Figure 4b shows that compared with the <r,r> scenario, new and remanufactured products have price disadvantages when the <n,r> scenario is the two parties’ donation strategy. With the increase in subsidy for donated remanufactured products, the price disadvantages of the two products will continue to expand. This means that consumers can pay less for new and remanufactured products while receiving donations.
This seems to be a paradox that conflicts with what Figure 3 shows. However, we notice that the obvious difference between Figure 3 and Figure 4 is that the members of the new donation strategy are different. Figure 4a indicates that, when the manufacturer changes its donation strategy from no donation to donating new products, slight advantages can be found in both products. Figure 4b shows that, when the manufacturer changes its donation strategy from donating remanufactured products to donating new products, price disadvantages will appear. However, what the two figures have in common is that increasing the subsidy for remanufactured products will make the donation of new products not an ideal choice, especially when the remanufacturer adopts a donation strategy as a competing method in the market. This may explain why the manufacturer always loses his first-mover advantage when the subsidy for remanufactured products is very high and the remanufacturer is willing to donate.
Moreover, Figure 5a,b gives out price comparisons among the <r,r>, <r,0>, and <0,r> scenarios. Even though the manufacturer’s donating remanufactured products strategy could make products on the market have price advantages, we notice that an increase in the subsidy for remanufactured products will result in the price of new products having the same price advantage as the price of the remanufactured products, significantly when the remanufacturer changes his strategy from no donation to donating, as shown in Figure 5a. Figure 5b indicates that, compared with the <0,r> scenario, both new and remanufactured products have price advantages, and the price advantage of remanufactured products is higher than that of new products in the <r,r> scenario. Different from what is shown in Figure 4, in Figure 5, the manufacturer adopts a donating remanufactured products strategy and seizes the first-mover advantage of donating remanufactured products. As a result, the remanufacturer’s donation strategy no longer has a second-mover advantage. This implies that the decision-making sequence of the donation strategy determines the changes in products’ prices in the market and also affects the decisions and advantages of the manufacturer and the remanufacturer. This will be further discussed in Section 5.

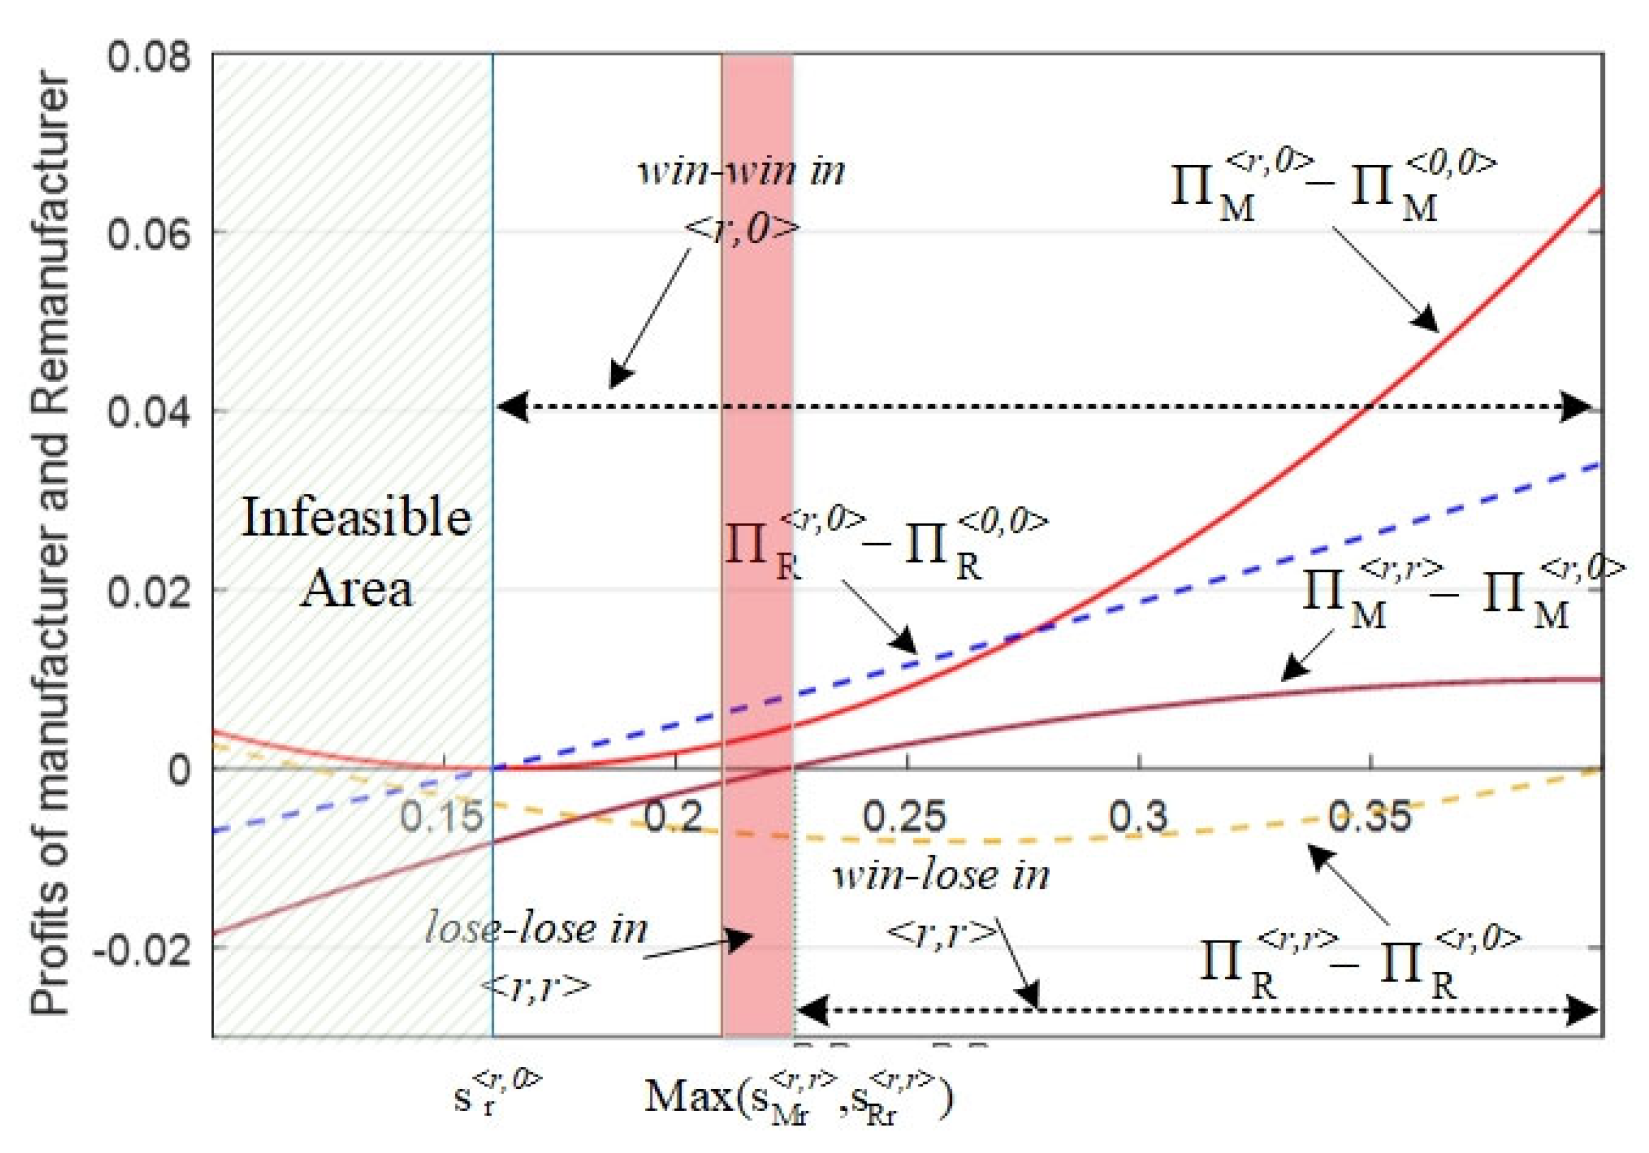
4.4. Dilemma and Pareto Improvement

Different subsidies could lead to different product output and prices and could also change the profits of the manufacturer and the remanufacturer. To make the two parties’ preferences on subsidy policy clear, this section will investigate whether the manufacturer and the remanufacturer may have a dilemma or Pareto improvement conditions under donation subsidies.
As stated in Section 4.1, the manufacturer is the leader in the market, and he has the first-mover advantage. Once the manufacturer decides to donate, the remanufacturer’s decision will make the manufacturer’s profit change. Proposition 6 below reveals the situation where the manufacturer may have a dilemma in the <n,0> scenario.
Proposition 6.
For the manufacturer in the <n,0> scenario, the manufacturer has a prisoner dilemma when there are two donation subsidies.
Proposition 6 tells us that a low subsidy for the remanufactured products can incentivize the remanufacturer to engage in donating, which results in the manufacturer failing to achieve more profit. Especially when the manufacturer prefers to donate the new products and the subsidy for the new products is very high, the remanufacturer decides to donate. Therefore, the remanufacturer would choose to donate the remanufactured products to maximize his profit when s r < n , r > < s r * * < s r < s r < r , 0 > , as shown in Figure 6 where Π R < n , 0 > < Π R < n , r > . This will indirectly cause the donation strategy of both parties in the market to change from <n,0> to <n,r>, which also indicates that the <n,0> scenario has become a prisoner dilemma for the manufacturer.
At this time, because of the changes in the remanufacturer’s donation strategy, whether the manufacturer will gain or lose benefits is related to the government subsidies. We can see that, as the first-mover in the market, the manufacturer takes the lead in choosing the strategy of donating new products, that is, <n,0> is supposed to be a single-win situation for the manufacturer. However, with the remanufacturer’s second-move choice, the donation equilibrium scenario turns out to be <n,r>. This also means that the manufacturer’s benefits are affected by the remanufacturer’s donation strategy, while the government’s subsidy policy has a significant impact on the manufacturer’s profits. Based on Figure 6, Figure 7 reveals a situation where the manufacturer is usually at a disadvantage in the market, especially when Π R < n , 0 > < Π R < n , r > . For example, the area “lose-win in <n,r>” is shown in Figure 7, Π M < n , 0 > > Π M < n , r > . This shows that the benefits of the manufacturer in <n,0> are due to the change in the remanufacturer’s donation strategy, which leads to the decline of the manufacturer’s profits in the <n,r> scenario. What’s more, Figure 7 also verifies the result in Proposition 6 and tells us when s n > s n < n , 0 > and s r < n , r > < s r * * < s r < s r < r , 0 > , the manufacturer’s first-mover advantage does not work. Instead, he will be subject to the remanufacturer’s second-mover advantage.
However, we also find that when the government sets the two donation subsidies very high, it can often achieve a win-win situation for the manufacturer and the remanufacturer, as shown in “win-win in <n,0>” and “win-win in <n,r>” in Figure 7. From Figure 8 below, we notice that when the manufacturer chooses to donate new products, it does not mean that the higher the donation subsidy for the remanufactured products, the more incentive the remanufacturer will have to donate. As the area “lose-win in <n,0>” is shown in Figure 7, the remanufacturer could achieve a single-win situation, as long as he keeps his no-donation strategy. When the manufacturer realizes that the remanufacturer could benefit more without donating, this will weaken the manufacturer’s incentives to donate. The management implication here is that when the government provides two subsidies for different donated products, it should scientifically and reasonably control the relationship between the subsidy for new products and the subsidy for remanufactured products to avoid the situation backfiring. In addition, with two subsidies existing in the market, both the manufacturer and the remanufacturer could not receive more benefits from donating, which indicates that the government should lower the subsidy for donated remanufactured products while keeping the subsidy for donated new products. In this way, a “win-win in <n,0>” equilibrium will appear instead of a “lose-win in <n,0>” situation. Or the government can increase the subsidy for donated new products while keeping the subsidy for donated remanufactured products unchanged, which also achieves the same effect.
The comparison of the manufacturer’s profits between <n,0> and <n,r> scenarios has already proved that the remanufacturer’s donation strategy may bring the manufacturer into a dilemma. Next, we will analyze the profits of the manufacturer and the remanufacturer between the <r,0> and <r,r> scenarios.
Figure 8 shows that when the manufacturer adopts a strategy of donating remanufactured products, it is the wisest choice for the remanufacturer to choose the no-donation strategy. Because in the <r,0> scenario, both of them could meet a win-win equilibrium. With an increase in the government subsidy for donated remanufactured products, the benefits to the manufacturer and the remanufacturer will gradually increase. If the remanufacturer also chooses to donate remanufactured products, that is, in the <r,r> scenario, when the subsidy for donated remanufactured products is low, there is a lose-lose ending, which makes the benefits of the manufacturer and the remanufacturer lower than those in the <r,0> scenario. When the subsidy for donated remanufactured products is set slightly higher, the manufacturer will gradually benefit from the <r,r> scenario. However, the remanufacturer will still be losing, which leads to a win-lose situation. Knowing that a win-win situation <r,r> only exists if the subsidy for donated remanufactured products is very high, our suggestions for the remanufacturer are as follows: (1) Suppose the subsidy for donated remanufactured products has met the prerequisites for donation. In that case, the remanufacturer should not immediately adopt the donation strategy and keep the no-donation strategy, as this may result in a lose-lose ending with the manufacturer or a situation where the remanufacturer loses but the manufacturer wins. (2) When the subsidy improves a lot, the remanufacturer can try to donate remanufactured products to achieve a win-win situation with the manufacturer. That is, conservative remanufacturers should adopt a non-donation strategy to benefit from the manufacturers’ donation strategy; risky remanufacturers can choose to adopt the donation strategy to achieve more benefits when the subsidy for donated remanufactured products is high.
Proposition 7.
For the remanufacturer, when the government only provides the subsidy for donated remanufactured products, since the remanufacturer has a second-mover disadvantage, the <0,r> scenario will not be the optimal ending and this scenario is not stable. With the subsidy increasing, <r,r> will become the Nash equilibrium.
Proposition 7 claims that the remanufacturer could achieve more benefits from donating remanufactured products because he is a follower in the market with a second-move disadvantage. However, meanwhile, the manufacturer will inevitably choose to donate to increase its profits. Therefore, the <0,r> scenario is a Pareto improvement for both the manufacturer and the remanufacturer, but it is also a feasible strategy for the remanufacturer. However, the <0,r> scenario is not stable. The reason for this is that the profits in the <r,r> scenario will be higher than those in the <0,r> scenario, and this can be predicted by the manufacturer, which will make the manufacturer decide to donate remanufactured products at the beginning to improve his benefits. As expected, this strategy will hurt the remanufacturer’s benefits. However, there is nothing that the remanufacturer can do about this, and he can only choose to donate remanufactured products to prevent himself from losing more because his benefits in the <r,r> scenario are always higher than those in the <r,0> scenario.
Figure 9 indicates that when the government’s subsidy for donated remanufactured products is low, it is unwise for the remanufacturer to donate because this will lead to a lose-lose ending for both the manufacturer and the remanufacturer in the <0,r> scenario. When the subsidy for donated remanufactured products is slightly increased, the manufacturer will benefit from the donation behavior of the remanufacturer. At this time, the remanufacturer still cannot achieve additional benefits from donating, and his donation strategy benefits the competitor (the manufacturer), which results in a win-lose ending. Only when the subsidy is high enough can the manufacturer and the remanufacturer achieve a win-win in the <0,r> scenario. From this, we know that the remanufacturer’s willingness to donate would be affected by the donation subsidy policy. If the government wants to encourage the remanufacturer to donate, it needs to fully consider how to set up a subsidy to increase the remanufacturer’s willingness to donate.
We also find that when the remanufacturer adopts a donation strategy, the manufacturer will inevitably choose to donate remanufactured products because Π M < r , r > > Π M < 0 , r > . Figure 9 shows that the manufacturer and the remanufacturer may reach a win-win situation in the <r,r> scenario. However, when the subsidy for donated remanufactured products increases, we unexpectedly see that the manufacturer could still receive benefits but that the remanufacturer’s benefits decline, and the final result is Π R < r , r > < Π R < 0 , r > . This shows that a high subsidy for donated remanufactured products will stimulate the manufacturer to participate in donating remanufactured products, but it will weaken the market competitiveness of the remanufacturer. Therefore, when the manufacturer and the remanufacturer adopt donation strategies at the same time, the government should pay attention to the subsidy to avoid a market imbalance. In the area of the “win-lose in <r,r>” scenario, the remanufacturer would realize Π R < r , r > < Π R < 0 , r > , and also know that Π R < r , r > > Π R < r , 0 > (as mentioned in Proposition 5). This means that the high subsidy for donated remanufactured products has effectively stimulated the manufacturer to donate. Under the first-mover advantage of the manufacturer, it is wise for the remanufacturer to donate too, otherwise, the remanufacturer will lose more benefits. Two management insights here are: (1) For the government, scientific and reasonable subsidy setting is of great significance. The too low subsidy will cause both the manufacturer and the remanufacturer to face a lose-lose ending and inhibit their enthusiasm for donation unexpectedly; however, the too-high subsidy will benefit the manufacturer but will weaken the remanufacturer’s market position. (2) For the remanufacturer, <0,r> is an optimal scenario lacking stability, and <r,r> could be his Nash equilibrium. Thus, if the subsidy for donated remanufactured products is high and there is a threat from the manufacturer’s donation strategy, the remanufacturer should donate products to protect himself from losing too much.

5. Extended Discussion and Managerial Implications

In this section, we discuss an extended situation where the remanufacturer moves first to decide whether to donate or not, and then the manufacturer chooses his donation strategy. To investigate and compare the impacts of the decision sequence on donation strategies, the strategy decision sequence and the product decision sequence are different from those in Figure 2. For the extended analysis, Proposition 8 highlights a new conclusion when the remanufacturer moves first. Compared with the results shown in Proposition 7, we can see a conclusion in favor of the remanufacturer. All the related proofs are given in Appendix C.
Proposition 8.
If the remanufacturer is the first-mover in the market, adopting a donation strategy in advance can improve his benefits.
From Proposition 8, we can see that when the remanufacturer is the leader in the market, he will choose the donation strategy to maximize his profits because he could receive more in the <0,r> scenario. Compared with Proposition 7, it can be seen that unlike the situation where the manufacturer is the leader in the market, the remanufacturer could avoid a lose-lose ending in the <0,r> scenario, as in the <0,r> scenario, the remanufacturer can still reach a single-win (lose-win) ending in the worst case. This is because, the first-mover advantage of the remanufacturer changes the former strategy decision-making sequence, thereby indirectly changing the former follower position of the remanufacturer, making him have the priority of donation. The remanufacturer could control the products’ output and donation to reach his own optimal goals.
Figure 10a,b depict the profits of the manufacturer in the <0,r>, <n,r>, and <r,r> scenarios. They illustrate that in the case of the remanufacturer as the market leader, there is no lose-lose ending in the <0,r> scenario and a win-win situation may exist. Besides this, we notice that Π M < 0 , r > > Π M < r , r > when the subsidy for donated remanufactured products is low and Π M < 0 , r > > Π M < n , r > when the subsidy for donated new products is also low. This implies that <0,r> is an optimal scenario for the manufacturer (adopting a no-donation strategy), no matter whether the government implements one or two subsidies for the donated products. This also shows that when the subsidy is low, the <0,r> scenario is a stable win-win situation, which achieves the Pareto improvement. That is the biggest difference from the conclusion of Proposition 7. Furthermore, only under the condition of a win-win in <0,r> scenario, it can be said that the remanufacturer’s first-mover donation strategy can prevent the manufacturer’s donation behavior. In other cases, the remanufacturer cannot prevent the manufacturer’s donation.
The analysis above has proved that when the manufacturer decides to donate nothing, the remanufacturer can receive greater benefits from donating. Next, we will discuss the situation where the manufacturer tries to donate new or remanufactured products and how will remanufacturer’s the donation strategy change.
Proposition 9.
If the remanufacturer is the leader in the market, the donating remanufactured strategy of the manufacturer could not affect the remanufacturer’s donation strategy.
Proposition 9 indicates that when the remanufacturer has the first-mover advantage, the manufacturer’s copycat strategy (donating remanufactured products) will not change (or threaten) the remanufacturer’s donation behavior. First, this is because the government’s subsidy policy has an incentive effect on the remanufacturer, which has prompted the remanufacturer to donate. Second, the remanufacturer has the first-mover advantage, which means he can predict the donation behavior of the manufacturer and make the optimal production and donation decisions for himself. Lastly, the amount of donated products by the manufacturer in the <r,r> scenario is lower than that in the <r,0> scenario, while the total output of remanufactured products in the market declines, which indirectly makes the prices of two products increase and expand the margin profit of the unit production of the remanufacturer. The management implication here is that if the remanufacturer is the leader in the market, the manufacturer cannot prevent the remanufacturer from adopting the donation strategy by donating remanufactured products. When comparing the <n,r> scenario and the <n,0> scenario, we find a similar conclusion, namely, that it is difficult for the manufacturer to prevent the remanufacturer’s donation decision by donating new products, as shown in Figure 11.
In addition to the proof of Proposition 9, we can see that the donation strategy of the remanufacturer cannot bring more market share or enhance his market advantage, but it can increase his benefits. This shows that with the government subsidies, the donation is economical and can be an important method to enhance his brand awareness.
From the previous discussion, it can be seen that the profits of the remanufacturer in the <r,r> scenario are higher than those in the <r,0> scenario, and the profits in the <n,r> scenario are higher than those in the <n,0> scenario. Therefore, there are three main optimal scenarios for the remanufacturer: <0,r>, <n,r>, and <r,r>. Figure 12 characterizes the optimal scenario distribution of the remanufacturer when he is the leader in the market. In Figure 12, there is an interesting area, where the optimal scenario is <r,0> for the remanufacturer when the subsidies for new and remanufactured products are both high. This could be a counter-intuition phenomenon. In theory, if the government’s donation subsidies are very high, the remanufacturer should be highly motivated to donate, but at this time, the remanufacturer chooses to give up the donation strategy to receive more benefits. The main reason for this is that, as the remanufacturer acts in a leading role in the market, he has the first-mover advantage and can predict the manufacturer’s donation strategy when the subsidy is high. Therefore, after the manufacturer adopts the donation strategy under the stimulus of donation subsidies, the manufacturer’s market investment will decrease, which will increase the prices of the products on the market and make the remanufacturer’s benefits higher. This implies that the more the manufacturer donates, the more the remanufacturer will receive. This free-riding can also be predicted by the remanufacturer, which results in no donation from the remanufacturer. The management implication here is that the government’s subsidies for donated products are not as high as possible. Too high donation subsidies will only lead some enterprises in the market to take “free-rider” behavior.

6. Conclusions and Remarks

In this paper, we have investigated how the subsidy policy affects the remanufacturing industry’s donation strategy, which has not been discussed in the early literature. Specifically, we modelled a supply chain consisting of a manufacturer (M) and a remanufacturer (R). The manufacturer sells new and remanufactured products, but the remanufacturer only sells remanufactured products. In addition to the market competition for selling products, the two parties also compete in the donation field when the government provides subsidies for donated products. Our models for different scenarios are based on the Stackelberg game, which requires that strategic decisions and product decisions be made sequentially by the two parties.
To answer the research questions in Section 1, we summarize our main results and managerial insights as follows:
1.
The sales share of subsidized products (such as when the manufacturer donates new products and also sells them) in the market will decrease with an increase in the subsidy. However, other products’ output will increase. When two subsidies exist, the donated products will be negatively affected by the other subsidy’s increase. Moreover, when the government adopts subsidy strategies for new products (or remanufactured products), the total amount of new products (or remanufactured products), including for sale and for donation, will increase, which means that donation subsidies have a positive stimulating effect on this product. For the prices, both new and remanufactured products may have price disadvantages; however, when the subsidy for donated remanufactured products is increasing, the price advantages of the two products will gradually appear. In other donation scenarios, the new products and the remanufactured products always have price advantages.
2.
When the subsidies are high, the manufacturer and the remanufacturer will adopt a donation strategy in most cases. However, depending on the donation subsidy, the remanufacturer’s willingness to donate may differ, while the manufacturer may have different donation strategies. The manufacturer and the remanufacturer will compete in the donation field. and their donation strategies will interact with each other. The manufacturer’s willingness to donate also changes (the thresholds of subsidy for the manufacturer to donate are different) while the remanufacturer participates in the donation.
3.
For the manufacturer in the <n,0> scenario, the manufacturer has a prisoner dilemma when there are two donation subsidies. The low subsidy for donated remanufactured products can incentivize the remanufacturer to engage in donating, which results in the manufacturer failing to achieve more profit. Especially when the manufacturer prefers to donate the new product and when the subsidy for the new product is very high, the remanufacturer decides to donate. This will indirectly cause the donation strategy of both parties in the market to change from <n,0> to <n,r>, which also indicates that the <n,0> scenario has become a prisoner dilemma for the manufacturer. However, for the remanufacturer, when the government only provides the subsidy for donated remanufactured products, since the remanufacturer has a second-mover disadvantage, the <0,r> scenario will not be the optimal ending, and this scenario is not stable. With an increasing subsidy, <r,r> will become the Nash equilibrium finally. Thus, if the subsidy for donated remanufactured products is high and there is a threat to the manufacturer’s donation strategy, the remanufacturer should donate products to protect himself from losing too much.
4.
If the remanufacturer is the first-mover in the market, adopting a donation strategy in advance can improve his benefits. Especially when the manufacturer decides to donate nothing, the remanufacturer can achieve many more benefits from donating. However, the remanufactured strategy of the manufacturer could not affect the remanufacturer’s donation strategy. Finally, the more the manufacturer donates, the more the remanufacturer will receive. This free-riding can also be predicted by the remanufacturer, which results in no donation from the remanufacturer.
There are some potential limitations to this study. First, we assume the manufacturer and the remanufacturer are in the same market. Thus, it is worthwhile to discuss whether the remanufacturer could encroach on the market where only the manufacturer exists by donating. Second, we examine donations as a competitive strategy for two parties. Future work can analyze donations as a cooperation strategy for the manufacturer to fulfill his extended producer responsibility with his partner remanufacturer. For example, the remanufacturer helps the manufacturer collect end-of-life products on the market and send them back to the manufacturer. The manufacturer then donates some remanufactured products to the remanufacturer for sale.

Author Contributions

Methodology, X.C.; software, J.W.; validation, X.C., Z.L. and J.W.; formal analysis, X.C.; investigation, Z.L.; resources, X.C.; data curation, J.W.; writing—original draft preparation, X.C.; writing—review and editing, X.C.; visualization, J.W.; supervision, Z.L.; project administration, J.W. All authors have read and agreed to the published version of the manuscript.

Funding

This research was funded by National Natural Science Foundation of China, grant number 72202103 and the Philosophy and Social Science Foundation of Jiangsu Higher Education Institutions of China, grant number 2020SJA0342.

Data Availability Statement

Data is unavailable due to privacy or ethical restrictions.

Conflicts of Interest

The authors declare no conflict of interest.

Appendix A

  • Scenario <0,0>
In this benchmark scenario, both the manufacturer and the remanufacturer choose no donation strategies. First, the manufacturer sets the output of new q n and remanufactured products q M r , then the remanufacturer determines the output of remanufactured products q R r . According to Stackelberg game solving way, we can obtain Proposition A1.
Proposition A1.
Under scenario <0,0>, the equilibrium solutions are as follows:
q n < 0 , 0 > = α 1 α α + 2 c R r + c M r 2 c R r + 2 α α 4 c M r 1 + c n c R r + α 2 c M r α 2 + 2 α 1 + c n α α + 2 c R r ;
q M r < 0 , 0 > = c n α 2 c R r + α 4 c M r 1 + c n c R r + α 2 c M r α 2 + 2 α 1 + c n α α + 2 c R r ;
q R r < 0 , 0 > = 1 4 α c R r + α + 2 c n c M r α α 1 + c n α α + 2 c R r + c M r 2 c R r 1 + c n + α 2 + 2 c n α .
Since no one would donate products to society, there will be no subsidy offering to enterprises and product outputs are mainly affected by companies’ manufacturing costs and remanufacturing costs. Thus, as shown in Proposition A1, higher costs always decrease the profits of two firms.
Proof of Proposition A1.
In <0,0> scenario, the manufacturer and remanufacturer will not choose to donate, which means q M d n = 0 , q M d r = 0 , q R d r = 0 . To verify the existence of extreme value of (1), the Hessian matrix of (1) is obtain as follows:
H Π M < 0 , 0 > = 2 Π M < 0 , 0 > q n 2 2 Π M < 0 , 0 > q n q M r 2 Π M < 0 , 0 > q M r q n 2 Π M < 0 , 0 > q M r 2 = 2 2 c n 2 α 2 α 2 α 2 c M r
From the Hessian matrix above, it is easy to find that H 1 Π M < 0 , 0 > = 2 2 c n < 0 , H 2 Π M < 0 , 0 > = 4   ( ( 1 + c n )   c M r + ( 1 + c n α ) α ) > 0 . Therefore, the Hessian matrix is negative, indicating that formula (1) is a concave function about q n and q M r , and there is a maximum value. Besides, from formula (2), we can know 2 Π R < 0 , 0 > / q R r 2 = 2 c R r 2 α < 0 , which indicates that formula (2) is a concave function about q R r , and there is a maximum value. Using the reverse order solution method, we first solve the formula (2) and let Π R < 0 , 0 > / q R r = 0 . We can have q R r = 1 q n q M r α / 2 α + c R r . And then we bring the value of q R r into formula (1), and make Π M < 0 , 0 > / q n = 0 and Π M < 0 , 0 > / q M r = 0 . We can get
q n < 0 , 0 > = α 1 α α + 2 c R r + c M r 2 c R r + 2 α α 4 c M r 1 + c n c R r + α 2 c M r α 2 + 2 α 1 + c n α α + 2 c R r
q M r < 0 , 0 > = c n α 2 c R r + α 4 c M r 1 + c n c R r + α 2 c M r α 2 + 2 α 1 + c n α α + 2 c R r
At last, we take (A1) and (A2) into q R r and we can have
q R r < 0 , 0 > = 1 4 α c R r + α + 2 c n c M r α α 1 + c n α α + 2 c R r + c M r 2 c R r 1 + c n + α 2 + 2 c n α
  • Scenario <n,0>
In this scenario, the manufacturer decides to donate new products to society, while the government would provide a new products donation subsidy. Hence, the remanufacturer needs to set the output of remanufactured products q R r after the manufacturer determines the output of new q n and remanufactured products q M r , and the number of donated ones q d n . By solving the problems, we can obtain Proposition A2.
Proposition A2.
Under scenario <n,0>, the equilibrium solutions are as follows:
q n < n , 0 > = α 2 c R r + α 1 + Δ n + α + c M r 2 c R r 1 + Δ n + α 2 + 2 Δ n + α 2 α 1 α 2 c R r + α + c M r 2 c R r + 2 α α ;
q M r < n , 0 > = α 2 c R r + α Δ n 2 α 1 α 2 c R r + α + c M r 4 c R r + 2 α 2 α ;
q M d n < n , 0 > = Δ n 2 c n + c n α 2 c R r + α 1 + Δ n + α + c M r 2 c R r 1 + Δ n + α 2 + 2 Δ n + α 2 c n α 1 α 2 c R r + α + c M r 2 c R r + 2 α α ;
q R r < n , 0 > = α α α 1 2 c R r + α c M r 2 c R r 1 + Δ n + α 2 + 2 Δ n α 4 c R r + α α 1 α 2 c R r + α c M r 2 c r R + 2 α α .
where Δ n = s n + θ n .
Proposition A2 shows that, once the manufacturer chooses to donate new products, the donation subsidy not only affects the manufacturer’s donation decision on how much to donate but also has an impact on the output of remanufactured products from two firms.
Proof of Proposition A2.
In <n,0> scenario, only the manufacturer donates the new products, which means q M d n 0 , q M d r = 0 , q R d r = 0 . To verify the existence of extreme value of (1), the Hessian matrix of (1) is obtain as follows:
H Π M < n , 0 > = 2 Π M < n , 0 > q n 2 2 Π M < n , 0 > q n q M r 2 Π M < n , 0 > q n q M d n 2 Π M < n , 0 > q n q M r 2 Π M < n , 0 > q M r 2 2 Π M < n , 0 > q M d n q M r 2 Π M < n , 0 > q n q M d n 2 Π M < n , 0 > q M d n q M r 2 Π M < n , 0 > q M d n 2 = 2 2 c n 2 α 2 c n 2 α 2 α 2 c M r 0 2 c n 0 2 c n
From the Hessian matrix above, it is easy to find that H 1 Π M < n , 0 > = 2 2 c n < 0 , H 2 Π M < n , 0 > = 4   ( ( 1 + c n )   c M r + ( 1 + c n α ) α ) > 0 , H 3 Π M < n , 0 > = 8 c M r c n 8 c n α 1 α < 0 . Thus, the Hessian matrix is negative, indicating that formula (1) is a concave function and there is a maximum value. Besides, from formula (2), we can know 2 Π R < n , 0 > / q R r 2 = 2 c R r 2 α < 0 . This shows that formula (2) is a concave function, and there is a maximum value. Using the reverse order solution method to solve the production decision of the remanufacturer, we let Π R < n , 0 > / q R r = 0 and we can have q R r = α 1 q n q M r / 2 α + c R r . Then we take q R r into formula (1) and set Π M < n , 0 > / q n = 0 , Π M < n , 0 > / q M r = 0 , and Π M < n , 0 > / q M d n = 0 . And we can get
q n < n , 0 > = α 2 c R r + α 1 + Δ n + α + c M r 2 c R r 1 + Δ n + α 2 + 2 Δ n + α 2 α 1 α 2 c R r + α + c M r 2 c R r + 2 α α
q M r < n , 0 > = α 2 c R r + α Δ n 2 α 1 α 2 c R r + α + c M r 4 c R r + 2 α 2 α
q M d n < n , 0 > = Δ n 2 c n + c n α 2 c R r + α 1 + Δ n + α + c M r 2 c R r 1 + Δ n + α 2 + 2 Δ n + α 2 c n α 1 α 2 c R r + α + c M r 2 c R r + 2 α α
At last, we take (A4), (A5) and (A6) into q R r and we can have
q R r < n , 0 > = α α α 1 2 c R r + α c M r 2 c R r 1 + Δ n + α 2 + 2 Δ n α 4 c R r + α α 1 α 2 c R r + α c M r 2 c r R + 2 α α
  • Scenario <r,0>
In this scenario, the manufacturer decides to donate remanufactured products to society, while the government would provide remanufactured products donation subsidy. Hence, the remanufacturer needs to set the output of remanufactured products q R r after the manufacturer determines the output of new q n and remanufactured products q M r , and the number of donated ones q M d r . By solving the problems, we can obtain Proposition A3.
Proposition A3.
Under scenario <r,0>, the equilibrium solutions are as follows:
q n < r , 0 > = 1 + Δ r α 2 1 + c n α ;
q M r < r , 0 > = 2 c R r ( Δ r + c n Δ r c n α ) α ( Δ r ( α 2 2 c n ) + α c n ) 2 α ( α 1 c n ) ( 2 c R r + α ) ;
q M d r < r , 0 > = 1 2 Δ r c M r + η 2 + α Δ r α 2 2 c n + α c n α α 1 c n 2 c R r + α ;
q R r < r , 0 > = 2 c R r Δ r + α + α 2 Δ r + α 4 c R r + α 2 c R r + α ,
where Δ r = s r + θ r .
Proposition A3 extends the conclusion of Proposition A2, revealing the situation where the manufacturer tries to donate remanufactured products and the government provides the remanufactured products donation subsidy. Similar to Proposition A2, the donation subsidy for remanufactured products also shows its impact on all products existing in the market.
Proof of Proposition A3.
In <r,0> scenario, only the manufacturer donates the remanufactured products, which means q M d n = 0 , q M d r 0 , q R d r = 0 . To verify the existence of extreme value of (1), the Hessian matrix of (1) is obtain as follows:
H Π M < r , 0 > = 2 Π M < r , 0 > q n 2 2 Π M < r , 0 > q n q M r 2 Π M < r , 0 > q n q M d r 2 Π M < r , 0 > q n q M r 2 Π M < r , 0 > q M r 2 2 Π M < r , 0 > q M d r q M r 2 Π M < r , 0 > q n q M d r 2 Π M < r , 0 > q M d r q M r 2 Π M < r , 0 > q M d r 2 = 2 2 c n 2 α 0 2 α 2 α 2 c M r 2 c M r 0 2 c M r 2 c M r
From the Hessian matrix above, it is easy to find that H 1 Π M < r , 0 > = 2 2 c n < 0 , H 2 Π M < r , 0 > = 4   ( ( 1 + c n )   c M r + ( 1 + c n α ) α ) > 0 , H 3 Π M < r , 0 > = 8 c M r c n α 8 c M r α 1 α < 0 . Thus, the Hessian matrix is negative, indicating that formula (1) is a concave function and there is a maximum value. Besides, from formula (2), we can know 2 Π R < r , 0 > / q R r 2 = 2 c R r 2 α < 0 . This shows that formula (2) is a concave function, and there is a maximum value. Using the reverse order solution method to solve the production decision of the remanufacturer, we let Π R < r , 0 > / q R r = 0 and we can have q R r = 1 q n q M r α / 2 α + c R r . Then we take q R r into formula (1) and set Π M < r , 0 > / q n = 0 , Π M < r , 0 > / q M r = 0 , and Π M < r , 0 > / q M d r = 0 . And we can get
q n < r , 0 > = 1 + s r α + θ r 2 1 + c n α
q M r < r , 0 > = 2 c R r s r + c n s r c n α + θ r + c n θ r α s r α 2 2 c n + c n α 2 θ r + θ r α 2 2 α α 1 c n 2 c R r + α
q M d r < r , 0 > = 1 2 s r + θ r c M r + η 1 + α s r α 2 2 c n + c n α 2 θ r + α 2 θ r α α 1 c n 2 c R r + α
where η 1 = 2 c R r s r + c n s r α + θ r + θ r . At last, we take (A8), (A9) and (A10) into q R r and we can have
q R r < r , 0 > = 2 c R r s r + α + θ r + α 2 s r + α + 2 θ r 4 c R r + α 2 c R r + α
  • Scenario <0,r>
In this scenario, the manufacturer decides not to donate any products, though the government would provide remanufactured products donation subsidy. However, the remanufacturer prefers to donate to society and gain his reputation. Thus, the remanufacturer needs to set the output of remanufactured products q R r and his donating quantity q R d r after the manufacturer determines the output of new q n and remanufactured products q M r . By solving the problems, we can obtain Proposition A4.
Proposition A4.
Under scenario <0,r>, the equilibrium solutions are as follows:
q n < 0 , r > = α 1 α + c M r 2 + Δ r α 2 c M r 2 + 2 c n α + α 1 + c n α ;
q M r < 0 , r > = Δ r 1 + c n α + α c n 2 c M r 2 + 2 c n α + α 1 + c n α ;
q R r < 0 , r > = α 1 + c n α 3 Δ r α + c M r η 1 4 α c M r 2 2 c n + α + α 1 c n + α ;
q R d r < 0 , r > = α 1 + c n α 2 α Δ r + c R r 3 Δ r α + c M r 2 α Δ r 2 + 2 c n α + η 1 c R r 4 α c R r c M r 2 + 2 c n α + α 1 + c n α ,
where η 1 = Δ r 4 + 4 c n α + α 2 α 2 + 4 c n .
Proposition A4 complements Proposition A3 from the perspective of only the manufacturer donating. As the same as Proposition A3 states, the donation subsidy for remanufactured products will affect two firms’ product decisions.
Proof of Proposition A4.
In <0,r> scenario, only the remanufacturer donates the remanufactured products, which means q M d n = 0 , q M d r = 0 , q R d r 0 . To verify the existence of extreme value of (1), the Hessian matrix of (1) is obtain as follows:
H Π M < 0 , r > = 2 Π M < 0 , r > q n 2 2 Π M < 0 , r > q n q M r 2 Π M < 0 , r > q M r q n 2 Π M < 0 , r > q M r 2 = 2 2 c n 2 α 2 α 2 α 2 c M r
From the Hessian matrix above, it is easy to find that H 1 Π M < 0 , r > = 2 2 c n < 0 , H 2 Π M < 0 , r > = 4   ( ( 1 + c n )   c M r + ( 1 + c n α ) α ) > 0 . Thus, the Hessian matrix is negative, indicating that formula (1) is a concave function and there is a maximum value. And the Hessian matrix of formula (2) is as follows:
H Π R < 0 , r > = 2 Π R < 0 , r > q R r 2 2 Π R < 0 , r > q R r q R d r 2 Π R < 0 , r > q R d r q R r 2 Π R < 0 , r > q R d r 2 = 2 α 2 c R r 2 c R r 2 c R r 2 c R r
We can see that H 1 Π R < 0 , r > = 2 α 2 c R r < 0 and H 2 Π R < 0 , r > = 4 α c R r > 0 . So, the Hessian matrix is negative, indicating that formula (2) is a concave function and there is a maximum value. Using the reverse order solution method to solve the production decision of the remanufacturer, we first let Π R < 0 , r > / q R r = 0 and Π R < 0 , r > / q R d r = 0 . Then we can have:
q R r = s r + α ( q n + q M r 1 ) + θ r 2 α
q R d r = α ( s r + θ r ) + c R r ( s r + θ r + α ( q n + q M r 1 ) ) 2 α c R r
We take (A12) and (A13) into formula (1), and set Π M < 0 , r > / q n = 0   and   Π M < 0 , r > / q M r = 0 . We can have
q n < 0 , r > = α ( 1 α ) + c M r ( 2 + s r α + θ r ) 2 ( c M r ( 2 + 2 c n α ) + α ( 1 + c n α ) )
q M r < 0 , r > = s r ( 1 + c n α ) + θ r ( 1 α ) + c n ( θ r + α ) 2 ( c M r ( 2 + 2 c n α ) + α ( 1 + c n α ) )
We bring (A14) and (A15) back to (A12) and (A13). We can get
q R r < 0 , r > = α 1 + c n α 3 Δ r α + c M r s r 4 + 4 c n α + α 2 + 4 θ r 1 + c n α 2 + 4 c n + θ r 4 α c M r 2 2 c n + α + α 1 c n + α
q R d r < 0 , r > = α ( 1 + c n α ) ( 2 α Δ r + c R r ( 3 Δ r α ) ) + c M r ( 2 α Δ r ( 2 + 2 c n α ) + η 2 c R r ) 4 α c R r ( c M r ( 2 + 2 c n α ) + α ( 1 + c n α ) )
where η 2 = s r ( 4 + 4 c n α ) + α 2 + 4 ( 1 + c n ) θ r α ( 2 + 4 c n + θ r ) .
  • Scenario <n,r>
In this scenario, both the manufacturer and the remanufacturer decide to donate products, while the manufacturer chooses to donate new products and the remanufacturer donates remanufactured products. And the government would provide two kinds of donation subsidies for firms at the same time. Thus, the remanufacturer needs to set the output of remanufactured products q R r and his donating quantity q R d r after the manufacturer determines the output of new q n and remanufactured products q M r , and the donating quantity of new products q d n . By solving the problems, we can obtain Proposition A5.
Proposition A5.
Under scenario <n,r>, the equilibrium solutions are as follows:
q n < n , r > = α 1 + Δ n + α + c M r 2 + 2 Δ n Δ r + α 2 c M r 2 + α + 1 + α α ;
q M r < n , r > = Δ r Δ r α + Δ n α 2 c M r 2 α + 1 α α ;
q M d n < n , r > = Δ n 2 c n + c n α 1 + Δ n + α + c M r 2 + 2 Δ n Δ r + α 2 c n c M r 2 α + 1 α α ;
q R r < n , r > = 1 α α α 3 Δ r + c M r α Δ r 4 Δ r + α 2 + 2 Δ n α 4 α c M r 2 α + 1 α α ;
q R d r < n , r > = η 2 + c M r 2 2 α α Δ r + c R r 4 Δ r α 2 + Δ r + 2 Δ n α 4 c R r α c M r 2 α + 1 α α ,
where η 2 = 1 α α 2 α Δ r + c R r 3 Δ r α .
From Proposition A5, we notice that the optimal product decisions are quite different from Proposition A3 and Proposition A4, while the government offers two donation subsidies at the same time. The output of each product would be affected by two donation subsidies together.
Proof of Proposition A5.
In <n,r> scenario, the manufacturer donates the new products and the remanufacturer donates the remanufactured products, which means q M d n 0 , q M d r = 0 , q R d r 0 . To verify the existence of extreme value of (1), the Hessian matrix of (1) is obtain as follows:
H Π M < n , r > = 2 Π M < n , r > q n 2 2 Π M < n , r > q n q M r 2 Π M < n , r > q n q M d n 2 Π M < n , r > q n q M r 2 Π M < n , r > q M r 2 2 Π M < n , r > q M d n q M r 2 Π M < n , r > q n q M d n 2 Π M < n , r > q M d n q M r 2 Π M < n , r > q M d n 2 = 2 2 c n 2 α 2 c n 2 α 2 α 2 c M r 0 2 c n 0 2 c n
From the Hessian matrix above, it is easy to find that H 1 Π M < n , r > = 2 2 c n < 0 , H 2 Π M < n , r > = 4   ( ( 1 + c n )   c M r + ( 1 + c n α ) α ) > 0 , H 3 Π M < n , r > = 8 c M r c n 8 c n α 1 α < 0 . Thus, the Hessian matrix is negative, indicating that formula (1) is a concave function and there is a maximum value. And the Hessian matrix of formula (2) is as follows:
H Π R < n , r > = 2 Π R < n , r > q R r 2 2 Π R < n , r > q R r q R d r 2 Π R < n , r > q R d r q R r 2 Π R < n , r > q R d r 2 = 2 α 2 c R r 2 c R r 2 c R r 2 c R r
We can see that H 1 Π R < n , r > = 2 α 2 c R r < 0 and H 2 Π R < n , r > = 4 α c R r > 0 . So, the Hessian matrix is negative, indicating that formula (2) is a concave function and there is a maximum value. Using the reverse order solution method to solve the production decision of the remanufacturer, we first let Π R < n , r > / q R r = 0 and Π R < n , r > / q R d r = 0 . Then we can have:
q R r = s r + α q n + q M r 1 + θ r 2 α
q R d r = α s r + θ r + c R r s r + α q n + q M r 1 + θ r 2 α c R r
We take (A18) and (A19) into formula (1), and set Π M < n , r > / q n = 0 , Π M < n , r > / q M d n = 0 and Π M < n , r > / q M r = 0 . We can have
q n < n , r > = α 1 + Δ n + α + c M r 2 + 2 Δ n Δ r + α 2 c M r 2 + α + 1 + α α
q M r < n , r > = Δ r s r α + α Δ n θ r 2 c M r 2 α + 1 α α
q M d n < n , r > = Δ n 2 c n + c n α 1 + Δ n + α + c M r 2 + 2 Δ n Δ r + α 2 c n c M r 2 α + 1 α α
We bring (A20), (A21) and (A22) back to (A18) and (A19). We can get
q R r < n , r > = 1 α α α 3 Δ r + c M r α Δ r 4 Δ r + α 2 + 2 Δ n α 4 α c M r 2 α + 1 α α
q R d r < n , r > = η 3 + c M r 2 2 α α Δ r + c R r 4 Δ r α 2 + Δ r + 2 Δ n α 4 c R r α c M r 2 α + 1 α α
where η 3 = 1 α α 2 α Δ r + c R r 3 Δ r α .
  • Scenario <r,r>
In this scenario, both the manufacturer and the remanufacturer decide to donate remanufactured products, and the government would provide donation subsidies for firms. Thus, the remanufacturer needs to set the output of remanufactured products q R r and his donating quantity q R d r after the manufacturer determines the output of new q n and remanufactured products q M r , and the donating quantity of remanufactured products q M d r . By solving the problems, we can obtain Proposition A6.
Proposition A6.
Under scenario <r,r>, the equilibrium solutions are as follows:
q n < r , r > = 1 + Δ r α 2 + 2 c n 2 α ;
q M r < r , r > = Δ r + c n Δ r c n α 2 α 1 c n + α ;
q M d r < r , r > = 1 + c n α α Δ r + c M r Δ r + c n Δ r c n α 2 c M r α 1 + c n α ;
q R r < r , r > = α Δ r 4 α ;
q R d r < r , r > = 2 α Δ r + c R r Δ r α 4 c R r α .
Proposition A6 reveals the situation where the manufacturer and the remanufacturer may have competition in the donation field, especially when they donate the same product. As the subsidy increases, the number of donations will increase, but the output of other products will not always increase.
Proof of Proposition A6.
In <r,r> scenario, the manufacturer and the remanufacturer both donate the remanufactured products, which means q M d n = 0 , q M d r 0 , q R d r 0 . To verify the existence of extreme value of (1), the Hessian matrix of (1) is obtain as follows:
H Π M < r , r > = 2 Π M < r , r > q n 2 2 Π M < r , r > q n q M r 2 Π M < r , r > q n q M d r 2 Π M < r , r > q n q M r 2 Π M < r , r > q M r 2 2 Π M < r , r > q M d r q M r 2 Π M < r , r > q n q M d r 2 Π M < r , r > q M d r q M r 2 Π M < r , r > q M d r 2 = 2 2 c n 2 α 0 2 α 2 α 2 c M r 2 c M r 0 2 c M r 2 c M r
From the Hessian matrix above, it is easy to find that H 1 Π M < r , r > = 2 2 c n < 0 , H 2 Π M < r , r > = 4   ( ( 1 + c n )   c M r + ( 1 + c n α ) α ) > 0 , H 3 Π M < r , r > = 8 c M r c n α 8 c M r α 1 α < 0 . Thus, the Hessian matrix is negative, indicating that formula (1) is a concave function and there is a maximum value. And the Hessian matrix of formula (2) is as follows:
H Π R < r , r > = 2 Π R < r , r > q R r 2 2 Π R < r , r > q R r q R d r 2 Π R < r , r > q R d r q R r 2 Π R < r , r > q R d r 2 = 2 α 2 c R r 2 c R r 2 c R r 2 c R r
We can see that H 1 Π R < r , r > = 2 α 2 c R r < 0 and H 2 Π R < r , r > = 4 α c R r > 0 . So, the Hessian matrix is negative, indicating that formula (2) is a concave function and there is a maximum value. Using the reverse order solution method to solve the production decision of the remanufacturer, we first let Π R < r , r > / q R r = 0 and Π R < r , r > / q R d r = 0 . Then we can have:
q R r = s r + α 1 + q n + q M r + θ r 2 α
q R d r = α ( s r + θ r ) + c R r ( s r + α ( 1 + q n + q M r ) + θ r ) 2 c R r α
We take (A25) and (A26) into formula (1), and set Π M < r , r > / q n = 0 , Π M < r , r > / q M r = 0 and Π M < r , r > / q M d r = 0 . We can have
q n < r , r > = 1 + s r α + θ r 2 + 2 c n 2 α
q M r < r , r > = s r + c n s r c n α + θ r + c n θ r 2 α 1 c n + α
q M d r < r , r > = 1 + c n α α s r + θ r + c M r s r + c n s r c n α + θ r + c n θ r 2 c M r α 1 + c n α
We bring (A27), (A28) and (A29) back to (A25) and (A26). We can get
q R r < r , r > = α s r θ r 4 α
q R d r < r , r > = 2 α s r + θ r + c R r s r α + θ r 4 c R r α

Appendix B

Proof of Proposition 1.
According to the results in Proposition A3 and A5, as long as the manufacturer prefers donation strategy, his optimal donation decisions should satisfy: q M d n < n , 0 > > 0  and  q M d r < r , 0 > > 0 . So we can have:
s n > s n < n , 0 >
s r > s r < r , 0 >
where s n < n , 0 > = α 1 α 2 c R r + α c M r A 1 θ n c n α 2 c R r + α α + θ n 1 c M r A 1 2 c R r + α θ n 1 + c n α α 2 c R r + α + c M r 2 1 + c n c R r + 2 + 2 c n α α , A 1 = 2 c R r + 2 α α and s r < r , 0 > = c n c M r α 2 c R r + α α 1 + c n α 2 c R r + α + c M r 2 c R r 1 + c n + α 2 + 2 c n α θ r .
Proof of Proposition 2.
According to the conclusions in Proposition A2, A4, and A6, the optimal product decisions of the remanufacturer should meet that q R d r < 0 , r > > 0 , q R d r < n , r > > 0 , and q R d r < r , r > > 0 , if he chooses to donate. Then we can have
s r > s r < 0 , r >
s r > s r < n , r >
s r > s R r < r , r >
where s r < n , r > = α c R r α α 1 + c M r α 2 2 s n 2 θ n α α 1 3 c R r + 2 α + c M r c R r α 4 + 2 α α 2 θ r , s R r < r , r > = α c R r c R r + 2 α θ r , s r < 0 , r > = α c R r c M r α 2 4 c n + α α 1 c n α α 1 c n 3 c R r + 2 α + c M r c R r α 4 4 c n + 2 α α 2 2 c n θ r .
Proof of Proposition 3.
According to the conclusions in Proposition A4 and A6, the optimal product decisions of the manufacturer should meet that q M d n < n , r > > 0 , and q M d r < r , r > > 0 , so we can have
s n > s n < n , r >
s r > s M r < r , r >
where s n < n , r > = θ n c M r α 2 + α α 1 + c n α α α + θ n + c M r 2 + s r < n , r > α 2 θ n + θ r c M r 2 + 2 c n α + α 1 α + c n . and s M r < r , r > = α c n c M r c M r + c n c M r + α + α c n α 2 θ r .
Proof of Proposition 4.
According to the conclusions in Proposition A2, A3, A4, A5, and A6, we analyze how each product changes with the subsidies in each scenario.
Scenario <n,0>
q n < n , 0 > s n = 2 c M r c R r + α + α 2 c R r + α 2 1 α α 2 c R r + α + c r M 4 c R r + 2 2 α α < 0
q M r < n , 0 > s n = α 2 c R r + α 2 1 α α 2 c R r + α + c M r 4 c R r + 2 2 α α > 0
q M d n < n , 0 > s n = 1 + c n α α 2 c R r + α + c M r 2 1 + c n c R r + 2 + 2 c n α α 2 c n 1 α α 2 c R r + α + c M r 2 c R r + 2 α α > 0
q R r < n , 0 > s n = c M r α 2 1 α α 2 c R r + α + c M r 4 c R r + 2 2 α α > 0
In scenario <n,0>, only new products will decline with the subsidy increasing. This indicates that the manufacturer’s new products donation strategy may conflict with new product’s marketing strategy.
  • Scenario <r,0>
q n < r , 0 > s r = 1 2 + 2 c n 2 α > 0
q M r < r , 0 > s r = 1 2 1 α + 1 1 α + c n + 1 2 c R r + α < 0
q M d r < r , 0 > s r = 1 2 1 c M r + 1 1 + c n α + 1 α + 1 2 c R r + α > 0
q R r < r , 0 > s r = 1 4 c R r + 2 α > 0
In scenario <r,0>, (A44) shows the same situation in (A39), where the remanufactured products that the manufacturer produced will decrease with the subsidy increasing, while other products will increase.
  • Scenario <0,r>
q n < 0 , r > s r = c M r 2 c M r 2 + 2 c n α + α 1 + c n α > 0
q M r < 0 , r > s r = 1 + c n α 2 c M r 2 + 2 c n α + α 1 + c n α > 0
q R d r < 0 , r > s r = 1 4 2 c R r + 2 α + 1 + c n + c M r α α 1 + c n α + c M r 2 + 2 c n α > 0
q R r < 0 , r > s r = 1 4 2 α + 1 + c n + c M r α α 1 + c n α + c M r 2 + 2 c n α < 0
Scenario <0,r> reveals that not only the manufacturer but also the remanufacturer will meet the donation problem that the subsidy will make his products (both sell and donate) in the market decline.
  • Scenario <n,r>
q n < n , r > s n = 2 c M r + α 2 c M r 2 α + 1 α α < 0
q n < n , r > s r = c M r 2 c M r 2 α + 1 α α > 0
q M r < n , r > s n = α 2 c M r 2 α + 1 α α > 0
q M r < n , r > s r = 1 α 2 c M r 2 α + 1 α α > 0
q M d n < n , r > s n = 1 2 ( 1 c n + 2 c M r + α c M r ( 2 α ) + α ( 1 α ) ) > 0
q M d n < n , r > s r = c M r 2 ( c M r ( 2 α ) + ( 1 α ) α ) < 0
q R r < n , r > s n = c M r 2 c M r 2 α + 1 α α > 0
q R r < n , r > s r = c M r 4 α + 3 1 α α 4 α c M r 2 α + 1 α α < 0
q R d r < n , r > s n = c M r 2 c M r 2 α + 1 α α < 0
q R d r < n , r > s r = 1 4 2 c R r + 2 α + 1 + c M r α c M r 2 α + 1 α α > 0
Scenario <n,r> shows a complicated situation where two subsidies exist. From (A51) and (A58), we find that two formulations here confirm the previous results. And we also notice that donated new products will decline with the increase of remanufactured products donation subsidy in (A56) and the similar situation for donated remanufactured products in (A59). This indicates that, when two subsidies exist, the donated products will be negatively affected by the other subsidy’s increase.
  • Scenario <r,r>
q n < r , r > s r = 1 2 + 2 c n 2 α > 0
q M r < r , r > s r = 1 + c n 2 α 1 + c n α < 0
q M d r < r , r > s r = 1 2 1 c M r + 1 1 + c n α + 1 α > 0
q R r < r , r > s r = 1 4 α < 0
q R d r < r , r > s r = 1 4 2 c R r + 1 α > 0
Scenario <r,r> shows the situation where the manufacturer and the remanufacturer donate the same products. (A62) and (A64) explain that, even though two parties may compete in the donation field, the subsidy still has a negative effect on remanufactured products in the market.
Proof of Corollary 1.
According to the conclusions in Proposition A2, A3, A4, A5, and A6, we analyze how each product’s total amount changes with the subsidies in each scenario.
  • Scenario <n,0>
q n < n , 0 > + q M d n < n , 0 > s n = 1 2 c n > 0
  • Scenario <r,0>
q M r < r , 0 > + q M d r < r , 0 > + q R r < r , 0 > s r = c M r + α + 2 c R r 2 α c M r + 4 c R r c M r > 0
  • Scenario <0,r>
q M r < 0 , r > + q R r < 0 , r > + q R d r < 0 , r > s r = 1 2 1 c R r + 1 + c n α c M r 2 + 2 c n α + α 1 + c n α > 0
  • Scenario <n,r>
q n < n , r > + q M d n < n , r > s n = 1 2 c n > 0
q M r < n , r > + q R d r < n , r > + q R r < n , r > s r = 1 2 1 c R r + 1 α c M r 2 α + 1 α α > 0
  • Scenario <r,r>
q M r < r , r > + q M d r < r , r > + q R r < r , r > + q R d r < r , r > s r = c M r + c R r 2 c R r c M r > 0
.
Proof of Proposition 5.
According to the conclusions in Proposition A2, A3, A4, A5, A6, and 1, we can see that, in scenario <n,0>, the new product subsidy should satisfy s n > s n < n , 0 > . Besides, we can have p n < n , 0 > > p n < 0 , 0 > and p r < n , 0 > > p r < 0 , 0 > , and at the same time we find that p n < n , 0 > p n < 0 , 0 > / s n > 0 and p r < n , 0 > p r < 0 , 0 > / s n > 0 . This indicates that, in scenario <n,0>, The prices of new products and remanufactured products in the market are higher than products in scenario <0,0>, so both products have price advantages in the market, and these advantages are more and more obvious with the increase of subsidy. Similar situations can be found in other scenarios (such as <r,0>, <n,r>, and <r,r>) and these proofs will be omitted.
However, in scenario <0,r>, the remanufactured product subsidy should satisfy s r > s r < 0 , r > . We find that there exists a s r * . When s r s r < 0 , r > , s r * , p n < 0 , r > < p n < 0 , 0 > and p r < 0 , r > < p r < 0 , 0 > , which mean that two products have price disadvantages in the market; and when s r s r * , 1 , p n < 0 , r > > p n < 0 , 0 > and p r < 0 , r > > p r < 0 , 0 > , which indicate that two products now have price advantages in the market.
Where s r * = c M r 4 + 4 c n 3 α + α 1 + c n α 4 c M r 2 + 2 c n α + α 1 + c n α .
Proof of Proposition 6.
According to the results in Proposition 1, the necessary condition for the manufacturer to choose to donate the new products is that the subsidy for donated new products should meet s n > s n < n , 0 > and s r < s r < r , 0 > . As a follower in the market, the remanufacturer has second-mover advantages. He could make his decisions after knowing that the manufacturer will adopt donating new products strategy. And then the remanufacturer makes a comparison between <n,0> and <n,r> decisions and he can find that there exists a s r * * , when s r < n , r > < s r * * < s r < s r < r , 0 > , Π R < n , 0 > < Π R < n , r > which means that he can get more profits in <n,r> scenario.
Where s r * * = c R r c M r α 2 + α α 1 2 A B 1 + B 2 + c M r 2 B 3 4 α 3 B 4 2 B 5 + B 6 B 7 B 1 + B 2 + c M r 2 B 3 ,
A 1 = c M r 2 c R r 1 + s n + θ n + α 2 + 2 s n α + 2 θ n , A 2 = α α 1 2 c R r + α + c M r α α 2 2 c R r ,
A = α 3 α α 1 2 c R r + α A 1 A 2 2 c R r + α , B 1 = α 2 1 α 2 9 c R r + 4 α ,
B 2 = 2 c M r α α 1 3 c R r α 4 + 4 α α 2 , B 3 = c M r 2 c R r 4 α 2 + 4 α 2 α 2 ,
B 4 = α α 1 + c M r 2 2 s n + α 2 θ n , B 5 = 4 α θ r c M r α 2 + α α 1 2 ,
B 6 = c R r c M r α 4 + 3 α α 1 , B 7 = c M r α α 2 2 s n 2 θ n + α α 1 α 3 θ r c M r θ r α 4 .
Proof of Proposition 7.
According to the results in Proposition A2, A3, A4, A5, A6, and 1, when the manufacturer chooses no-donation and the remanufacturer decides to denote, that is <0,r> scenario, we can get s r m a x { s r < 0 , r > , s R r < 0 , r > } , through solving Π R < 0 , r > Π R < 0 , 0 > > 0 . At the same time, under this subsidy condition, we find that Π M < 0 , r > > Π M < 0 , 0 > , Π M < r , r > > Π M < 0 , r > , and Π R < r , r > > Π R < 0 , r > . This shows that high subsidy for donated remanufactured products stimulate the enthusiasm of the manufacturer to donate. Therefore, the manufacturer has reasons to adopt the strategy of donating remanufactured products, which makes the <0,r> scenario change to the <r,r> scenario.
And then, we discuss the profit of the remanufacturer in <r,r> scenario and let ( Π R < r , r > Π R < 0 , r > ) / s r > 0 . After calculating, we know that if s r m a x { s R r 1 < r , r > , s R r 2 < r , r > } , ( Π R < r , r > Π R < 0 , r > ) / s r > 0 ; and if s r m a x { s R r 1 < r , r > , s R r 2 < r , r > } , ( Π R < r , r > Π R < 0 , r > ) / s r < 0 . This shows that with the increase of subsidy for donated remanufactured products, the profit of the remanufacturer will gradually be lower than that under the <0,r> scenario, that is, the market share of the remanufacturer will decrease slowly and his market position will be lost. This also implies that the subsidy for donated remanufactured products will widen the benefits gap between the manufacturer and the remanufacturer. However, the fundamental reason for this is that the remanufacturer is a follower in the market and has a second-move disadvantage. And, according to the conclusion of Proposition A5, it can be found that in the <r,r> scenario, if the remanufacturer gives up his donation strategy, this will make the market equilibrium scenario become <r,0>. Moreover, it will only lead the remanufacturer lose more benefits, because of Π R < 0 , r > > Π R < r , r > > Π R < r , 0 > . It can be seen that when the remanufacturer faces the manufacturer’s donation strategy, he can only follow the donation to ensure the least damage to its own benefits, that is, although donating remanufactured products is not the optimal decision of the remanufacturer, it is indeed a Nash equilibrium for two parties.
Where C 1 = ( c R r + α ) ( C 5 ( 2 c R r + α ) + c M r ( 2 c R r ( 1 + c n ) + α ( 2 + 2 c n α ) ) ) 2 ,
C 2 = α ( c M r ( 2 + 2 c n α ) + C 5 ) 2 , C 3 = α 2 ( C 5 ( 2 c R r + α ) + c M r ( c R r ( 2 + 4 c n ) + ( 2 + 4 c n α ) α ) ) 2 ,
C 4 = c M r 4 + 4 c n α , C 5 = α 1 + c n α , C 6 = c R r C 4 + 3 C 5 C 4 2 c M r α + C 5 α 3 θ r C 4 θ r ,
C 7 = α 2 + 4 θ r 1 + c n α 2 + 4 c n + θ r ,
s R r < 0 , r > = C 1 C 2 c R r 4 C 1 α 2 C 4 2 c M r + C 5 2 + C 3 4 C 2 + c R r C 4 + 3 C 5 2 + C 1 4 C 2 θ r + C 6 C 1 4 C 2 + c R r C 4 + 3 C 5 2 ,
s R r 1 < r , r > = α 3 C 5 c M r C 4 C 7 c M r C 5 α 3 θ r + C 2 θ r α + C 2 α C 7 c M r + 2 C 5 α C 4 θ r α 2 C 2 + α 3 C 5 + C 4 2 , s R r 2 < r , r > = α ( 3 C 5 c M r C 4 ) ( C 7 c M r C 5 ( α 3 θ r ) ) + C 2 ( θ r α ) + C 2 α ( C 7 c M r + 2 C 5 α C 4 ( θ r α ) ) 2 C 2 + α ( 3 C 5 + C 4 ) 2 .

Appendix C

Proof of Proposition 8.
According to the formulations (1) and (2) in Section 3.2, when the remanufacturer is the first-mover, we first solve the manufacturer’s optimal decisions and then solve the remanufacturer’s optimal decisions, by using the reverse order solution method. The proof process is similar to the proof of Proposition A1.
First, we solve the optimal solutions in <0,0> scenario.
q n < 0 , 0 > * = c M r + α α 2 c M r α 2 c M r + 2 c n c M r + C 5 4 c M r 1 + c n c R r + α 2 c M r α 2 + 2 C 5 2 c R r + α 2 c M r 1 + c n + C 5
q M r < 0 , 0 > * = α ( 4 c n c M r c R r ( 1 + c n ) + α ( 1 + c n ) D 1 + α 2 ( c n 2 1 + c M r 4 c n c R r ) + 2 α 3 α 4 ) 4 ( ( 1 + c n ) c M r + C 5 ) ( C 5 ( 2 c R r + α ) + c M r ( 2 c R r ( 1 + c n ) + α ( 2 + 2 c n α ) ) )
q R r < 0 , 0 > * = α c M r + 2 c n c M r + C 5 4 c M r 1 + c n c R r + α 2 c M r α 2 + 2 C 5 2 c R r + α
According to (A72), (A73), and (A74), we can get the remanufacturer’s maximum profit in <0,0> scenario is
Π R < 0 , 0 > * = α 2 ( c M r + 2 c n c M r + C 5 ) 8 ( ( c M r ( 1 + c n ) + C 5 ) ( C 5 ( 2 c R r + α ) + c M r ( 2 c R r ( 1 + c n ) + α ( 2 + 2 c n α ) ) ) )
Then we solve the optimal solutions in <0,r> scenario.
q n < 0 , r > * = c M r + α α 2 c M r ( C 5 ( α 2 s r 2 θ r ) + c M r ( 2 s r ( 1 + c n ) α ( 1 + 2 c n ) + 2 θ r ( 1 + c n ) ) ) 2 ( c M r ( 2 + 2 c n α ) + C 5 ) 2 ( c M r ( 1 + c n ) + C 5 )
q M r < 0 , r > * = C 5 D 2 + α α + c n 1 + c M r D 2 1 + c n + α α + c n 1 + 2 c n 2 4 c M r 1 + c n + C 5 c M r 2 + c n α + C 5
q R r < 0 , r > * = C 5 2 s r + θ r α + c M r 2 s r + θ r 1 + c n α 1 + 2 c n 2 α c M r α 2 2 c n C 5
q d R r < 0 , r > * = C 5 α s r + θ r + c R r 2 s r + θ r α c M r α s r + θ r α 2 c n 2 + c R r D 3 2 c R r α c M r 2 c n + 2 α + C 5
According to (A76), (A77), (A78), and (A79), we can get the remanufacturer’s maximum profit in <0,r> scenario is
Π R < 0 , r > * = C 5 2 c R r α 2 s r + θ r 2 + 2 α s r + θ r 2 + c M r 2 D 4 + 2 c M r C 5 D 5 + D 6 8 c R r α c M r 1 + c n C 5 c M r 2 + 2 c n α + C 5
Through comparing, we find that
Π R < 0 , R > * Π R < 0 , 0 > * = C 5 α s r + θ r + D 7 + c M r α s r + θ r α 2 2 c n + c R r D 3 2 4 c R r α c M r 2 + 2 c n α + C 5 C 5 2 c R r + α + D 8 0
where C 5 > 0 and D 8 > 0 .
Therefore, if the remanufacturer is the firs-mover in the market, adopting donation strategy is a wise choice.
Where D 1 = 2 c n 1 c M r + 4 c n c R r , D 2 = 2 s r + θ r 1 + c n α , D 3 = α + 2 c n α 2 s r + θ r 1 + c n ,
D 4 = 2 1 + c n 2 + 2 c n α s r + θ r 2 + c R r D 3 2 , D 5 = α 3 + 3 c n α s r + θ r 2 ,
D 6 = c R r 2 s r + θ r α 2 s r + θ r 1 + c n α 1 + 2 c n , D 7 = c R r 2 s r + θ r α ,
D 8 = c M r 2 c R r 1 + c n + 2 + 2 c n α α .
Proof of Proposition 9.
Based on the decision sequence mentioned in proof of Proposition 8, we first solve the optimal solutions in the <r,r> scenario.
q n < r , r > * = 1 + s r α + θ r 2 1 + c n α
q M r < r , r > * = α + s r 1 + c n + α c n + α α θ r + θ r 4 α α 1 c n
q M d r < r , r > * = 1 2 s r + θ r c M r + α + s r 1 + c n α c n + α α θ r + θ r 2 C 5
q R r < r , r > * = α s r θ r 2 α
q R d r < r , r > * = 1 2 c R r + α s r + θ r c R r α 1
According to the solutions above, we can get the remanufacturer’s profit as below:
Π R < r , r > * = 2 α s r + θ r 2 + c R r s r + θ r α 2 8 c R r α
Next, we calculate the optimal solutions in the <r,0> scenario.
q n < r , 0 > * = 1 + s r α + θ r 2 1 + c n α
q M r < r , 0 > * = 4 c R r s r + θ r 1 + c n α c n α s r + θ r α 3 3 c n + α α 1 + c n 4 C 5 2 c R r + α
q M d r < r , 0 > * = 1 2 s r + θ r c M r 1 α + 1 + c n 1 + s r + θ r α C 5 + s r + θ r + α 4 c R r + 2 α
q R r < r , 0 > * = α + s r + θ r 4 c R r + 2 α
According to the solutions above, we can get the remanufacturer’s profit as below:
Π R < r , 0 > * = s r + θ r + α 2 8 2 c R r + α
Comparing the remanufacturer’s profits in two scenarios, we can have
Π R < r , r > * Π R < r , 0 > * = c R r s r + θ r α + α s r + θ r 2 4 c R r α 2 c R r + α 0
So, we can know that when the remanufacturer is the leader in the market, the manufacturer’s donation strategy will not affect the remanufacturer’s decision.

References

  1. Xue, D.; Teunter, R.H.; Zhu, S.X.; Zhou, W. Entering the High-End Market by Collecting and Remanufacturing a Competitor’s High-End Cores. Omega 2021, 99, 102168. [Google Scholar] [CrossRef]
  2. Giuntini, R.; Gaudette, K. Remanufacturing: The next Great Opportunity for Boosting US Productivity. Bus. Horiz. 2003, 46, 41–48. [Google Scholar] [CrossRef]
  3. Ostojic, P. Pumps and Circular Economy. World Pumps 2016, 2016, 30–33. [Google Scholar] [CrossRef]
  4. Ayres, R.; Ferrer, G.; Van Leynseele, T. Eco-Efficiency, Asset Recovery and Remanufacturing. Eur. Manag. J. 1997, 15, 557–574. [Google Scholar] [CrossRef]
  5. Habibi, M.K.K.; Battaïa, O.; Cung, V.D.; Dolgui, A. Collection-Disassembly Problem in Reverse Supply Chain. Int. J. Prod. Econ. 2017, 183, 334–344. [Google Scholar] [CrossRef] [Green Version]
  6. Zhu, X.; Wang, Z.; Wang, Y.; Li, B. Incentive Policy Options for Product Remanufacturing: Subsidizing Donations or Resales? Int. J. Environ. Res. Public Health 2017, 14, 1496. [Google Scholar] [CrossRef] [Green Version]
  7. Li, B.; Wang, Z.; Wang, Y.; Tang, J.; Zhu, X.; Liu, Z. The Effect of Introducing Upgraded Remanufacturing Strategy on OEM’s Decision. Sustainability 2018, 10, 828. [Google Scholar] [CrossRef] [Green Version]
  8. Wang, Z.; Li, B.; Zhu, X.; Xin, B.; Wang, Y. The Impact of Donation Subsidy of Remanufactured Products on Manufacturer’s Pricing-Production Decisions and Performances. J. Clean. Prod. 2018, 202, 892–903. [Google Scholar] [CrossRef]
  9. Chen, S.; Yi, Y. The Manufacturer Decision Analysis for Corporate Social Responsibility under Government Subsidy. Math. Probl. Eng. 2021, 2021, 6617625. [Google Scholar] [CrossRef]
  10. Arya, A.; Mittendorf, B. Supply Chain Consequences of Subsidies for Corporate Social Responsibility. Prod. Oper. Manag. 2015, 24, 1346–1357. [Google Scholar] [CrossRef]
  11. Xintong, C.; Bangyi, L.; Zonghuo, L.; Goh, M.; Shanting, W. Take-Back Regulation Policy on Closed Loop Supply Chains: Single or Double Targets? J. Clean. Prod. 2021, 283, 124576. [Google Scholar] [CrossRef]
  12. USITC. Remanufactured Goods: An Overview of the U.S. and Global Industries, Markets, and Trade; USITC: Washington, DC, USA, 2012. [Google Scholar]
  13. Huang, Y.; Wang, Z. Pricing and Production Decisions in a Closed-Loop Supply Chain Considering Strategic Consumers and Technology Licensing. Int. J. Prod. Res. 2019, 57, 2847–2866. [Google Scholar] [CrossRef]
  14. Ma, P.; Gong, Y.; Mirchandani, P. Trade-in for Remanufactured Products: Pricing with Double Reference Effects. Int. J. Prod. Econ. 2020, 230, 107800. [Google Scholar] [CrossRef]
  15. Zheng, M.; Shi, X.; Xia, T.; Qin, W.; Pan, E. Production and Pricing Decisions for New and Remanufactured Products with Customer Prejudice and Accurate Response. Comput. Ind. Eng. 2021, 157, 107308. [Google Scholar] [CrossRef]
  16. McKie, E.C.; Ferguson, M.E.; Galbreth, M.R.; Venkataraman, S. How Do Consumers Choose between Multiple Product Generations and Conditions? An Empirical Study of IPad Sales on EBay. Prod. Oper. Manag. 2018, 27, 1574–1594. [Google Scholar] [CrossRef]
  17. Abbey, J.D.; Guide, V.D.R. A Typology of Remanufacturing in Closed-Loop Supply Chains. Int. J. Prod. Res. 2018, 56, 374–384. [Google Scholar] [CrossRef]
  18. Chai, Q.; Xiao, Z.; Lai, K.; Zhou, G. Can Carbon Cap and Trade Mechanism Be Beneficial for Remanufacturing? Int. J. Prod. Econ. 2018, 203, 311–321. [Google Scholar] [CrossRef]
  19. Subramanian, R.; Subramanyam, R. Key Factors in the Market for Remanufactured Products. Manuf. Serv. Oper. Manag. 2012, 14, 315–326. [Google Scholar] [CrossRef] [Green Version]
  20. Liu, Z.; Li, K.W.; Tang, J.; Gong, B.; Huang, J. Optimal Operations of a Closed-Loop Supply Chain under a Dual Regulation. Int. J. Prod. Econ. 2021, 233, 107991. [Google Scholar] [CrossRef]
  21. Liu, Z.; Zheng, X.X.; Li, D.F.; Liao, C.N.; Sheu, J.B. A Novel Cooperative Game-Based Method to Coordinate a Sustainable Supply Chain under Psychological Uncertainty in Fairness Concerns. Transp. Res. E Logist. Transp. Rev. 2021, 147, 102237. [Google Scholar] [CrossRef]
  22. Li, X.; Li, Y.; Saghafian, S. A Hybrid Manufacturing/Remanufacturing System with Random Remanufacturing Yield and Market-Driven Product Acquisition. IEEE Trans. Eng. Manag. 2013, 60, 424–437. [Google Scholar] [CrossRef]
  23. Raz, G.; Ovchinnikov, A.; Blass, V. Economic, Environmental, and Social Impact of Remanufacturing in a Competitive Setting. IEEE Trans. Eng. Manag. 2017, 64, 476–490. [Google Scholar] [CrossRef]
  24. Xia, X.; Zhang, C. The Impact of Authorized Remanufacturing on Sustainable Remanufacturing. Processes 2019, 7, 663. [Google Scholar] [CrossRef] [Green Version]
  25. Tan, H.; Cao, G.; He, Y.; Lu, Y. Channel Structure Choice for Remanufacturing under Green Consumerism. Processes 2021, 9, 1985. [Google Scholar] [CrossRef]
  26. Modak, N.M.; Kelle, P. Using Social Work Donation as a Tool of Corporate Social Responsibility in a Closed-Loop Supply Chain Considering Carbon Emissions Tax and Demand Uncertainty. J. Oper. Res. Soc. 2021, 72, 61–77. [Google Scholar] [CrossRef]
  27. Wang, Y.; Wang, Z.; Li, B.; Liu, Z.; Zhu, X.; Wang, Q. Closed-Loop Supply Chain Models with Product Recovery and Donation. J. Clean. Prod. 2019, 227, 861–876. [Google Scholar] [CrossRef]
  28. Haeri, A.; Hosseini-Motlagh, S.M.; Ghatreh Samani, M.R.; Rezaei, M. A Mixed Resilient-Efficient Approach toward Blood Supply Chain Network Design. Int. Trans. Oper. Res. 2020, 27, 1962–2001. [Google Scholar] [CrossRef]
  29. Heydari, J.; Mosanna, Z. Coordination of a Sustainable Supply Chain Contributing in a Cause-Related Marketing Campaign. J. Clean. Prod. 2018, 200, 524–532. [Google Scholar] [CrossRef]
  30. Modak, N.M.; Kazemi, N.; Cárdenas-Barrón, L.E. Investigating Structure of a Two-Echelon Closed-Loop Supply Chain Using Social Work Donation as a Corporate Social Responsibility Practice. Int. J. Prod. Econ. 2019, 207, 19–33. [Google Scholar] [CrossRef]
  31. Patil, A.; Shardeo, V.; Dwivedi, A.; Madaan, J.; Varma, N. Barriers to Sustainability in Humanitarian Medical Supply Chains. Sustain. Prod. Consum. 2021, 27, 1794–1807. [Google Scholar] [CrossRef]
  32. Song, L.; Yan, Y.; Yao, F. Closed-Loop Supply Chain Models Considering Government Subsidy and Corporate Social Responsibility Investment. Sustainability 2020, 12, 2045. [Google Scholar] [CrossRef] [Green Version]
  33. Tat, R.; Heydari, J.; Rabbani, M. Corporate Social Responsibility in the Pharmaceutical Supply Chain: An Optimized Medicine Donation Scheme. Comput. Ind. Eng. 2021, 152, 107022. [Google Scholar] [CrossRef]
  34. Gilani Larimi, N.; Yaghoubi, S. A Robust Mathematical Model for Platelet Supply Chain Considering Social Announcements and Blood Extraction Technologies. Comput. Ind. Eng. 2019, 137, 106014. [Google Scholar] [CrossRef]
  35. Mallidis, I.; Sariannidis, N.; Vlachos, D.; Yakavenka, V.; Aifadopoulou, G.; Zopounidis, K. Optimal Inventory Control Policies for Avoiding Food Waste. Oper. Res. 2022, 22, 685–701. [Google Scholar] [CrossRef]
  36. Zou, J.; Tang, Y.; Qing, P.; Li, H.; Razzaq, A. Donation or Discount: Effect of Promotion Mode on Green Consumption Behavior. Int. J. Environ. Res. Public Health 2021, 18, 1912. [Google Scholar] [CrossRef]
  37. Ross, A.; Khajehnezhad, M.; Otieno, W.; Aydas, O. Integrated Location-Inventory Modelling under Forward and Reverse Product Flows in the Used Merchandise Retail Sector: A Multi-Echelon Formulation. Eur. J. Oper. Res. 2017, 259, 664–676. [Google Scholar] [CrossRef]
  38. Wang, Y.; Chang, X.; Chen, Z.; Zhong, Y.; Fan, T. Impact of Subsidy Policies on Recycling and Remanufacturing Using System Dynamics Methodology: A Case of Auto Parts in China. J. Clean. Prod. 2014, 74, 161–171. [Google Scholar] [CrossRef]
  39. Qiao, H.; Su, Q. Impact of Government Subsidy on the Remanufacturing Industry. Waste Manag. 2021, 120, 433–447. [Google Scholar] [CrossRef]
  40. Mitra, S.; Webster, S. Competition in Remanufacturing and the Effects of Government Subsidies. Int. J. Prod. Econ. 2008, 111, 287–298. [Google Scholar] [CrossRef]
  41. Zhao, S.; Zhu, Q.; Cui, L. A Decision-Making Model for Remanufacturers: Considering Both Consumers’ Environmental Preference and the Government Subsidy Policy. Resour. Conserv. Recycl. 2018, 128, 176–186. [Google Scholar] [CrossRef]
  42. Cao, K.; He, P.; Liu, Z. Production and Pricing Decisions in a Dual-Channel Supply Chain under Remanufacturing Subsidy Policy and Carbon Tax Policy. J. Oper. Res. Soc. 2020, 71, 1199–1215. [Google Scholar] [CrossRef]
  43. Miao, Z.; Mao, H.; Fu, K.; Wang, Y. Remanufacturing with Trade-Ins under Carbon Regulations. Comput. Oper. Res. 2018, 89, 253–268. [Google Scholar] [CrossRef]
  44. He, P.; He, Y.; Xu, H. Channel Structure and Pricing in a Dual-Channel Closed-Loop Supply Chain with Government Subsidy. Int. J. Prod. Econ. 2019, 213, 108–123. [Google Scholar] [CrossRef]
  45. Hong, Z.; Zhang, Y.; Yu, Y.; Chu, C. Dynamic Pricing for Remanufacturing within Socially Environmental Incentives. Int. J. Prod. Res. 2020, 58, 3976–3997. [Google Scholar] [CrossRef]
  46. Han, X.; Shen, Y.; Bian, Y. Optimal Recovery Strategy of Manufacturers: Remanufacturing Products or Recycling Materials? Ann. Oper. Res. 2020, 290, 463–489. [Google Scholar] [CrossRef]
  47. Sun, J.; Xiao, Z. Channel Selection for Automotive Parts Remanufacturer under Government Replacement-Subsidy. Eur. J. Ind. Eng. 2018, 12, 808–831. [Google Scholar] [CrossRef]
  48. Zhang, Y.; Hong, Z.; Chen, Z.; Glock, C.H. Tax or Subsidy? Design and Selection of Regulatory Policies for Remanufacturing. Eur. J. Oper. Res. 2020, 287, 885–900. [Google Scholar] [CrossRef]
  49. Zhang, F.; Zhang, R. Trade-in Remanufacturing, Customer Purchasing Behavior, and Government Policy. Manuf. Serv. Oper. Manag. 2018, 20, 601–616. [Google Scholar] [CrossRef]
  50. Gu, X.; Zhou, L.; Huang, H.; Shi, X.; Ieromonachou, P. Electric Vehicle Battery Secondary Use under Government Subsidy: A Closed-Loop Supply Chain Perspective. Int. J. Prod. Econ. 2021, 234, 108035. [Google Scholar] [CrossRef]
  51. Xie, X.; Huo, J.; Qi, G.; Zhu, K.X. Green Process Innovation and Financial Performance in Emerging Economies: Moderating Effects of Absorptive Capacity and Green Subsidies. IEEE Trans. Eng. Manag. 2016, 63, 101–112. [Google Scholar] [CrossRef]
  52. Jiang, T.; He, Z.; Xiang, G.; Hu, T. The Impact of Government Subsidies on Private Pension Enterprises: A Decision-Making Model Based on Their CSR Levels. IEEE Access 2021, 9, 167190–167203. [Google Scholar] [CrossRef]
  53. Raz, G.; Ovchinnikov, A. Coordinating Pricing and Supply of Public Interest Goods Using Government Rebates and Subsidies. IEEE Trans. Eng. Manag. 2015, 62, 65–79. [Google Scholar] [CrossRef]
  54. Esenduran, G.; Kemahlioğlu-Ziya, E.; Swaminathan, J.M. Take-Back Legislation: Consequences for Remanufacturing and Environment. Decis. Sci. 2016, 47, 219–256. [Google Scholar] [CrossRef]
  55. Atasu, A.; Özdemir, Ö.; Van Wassenhove, L.N. Stakeholder Perspectives on E-Waste Take-Back Legislation. Prod. Oper. Manag. 2013, 22, 382–396. [Google Scholar] [CrossRef]
  56. Ferrer, G.; Swaminathan, J.M. Managing New and Remanufactured Products. Manag. Sci. 2006, 52, 15–26. [Google Scholar] [CrossRef] [Green Version]
  57. Ferguson, M.E.; Toktay, L.B. The Effect of Competition on Recovery Strategies. Prod. Oper. Manag. 2006, 15, 351–368. [Google Scholar] [CrossRef] [Green Version]
  58. Galbreth, M.R.; Boyac, T.; Verter, V. Product Reuse in Innovative Industries. Prod. Oper. Manag. 2013, 22, 1011–1033. [Google Scholar] [CrossRef]
  59. Esenduran, G.; Kemahlıoğlu-Ziya, E.; Swaminathan, J.M. Impact of Take-Back Regulation on the Remanufacturing Industry. Prod. Oper. Manag. 2017, 26, 924–944. [Google Scholar] [CrossRef]
  60. Atasu, A.; Sarvary, M.; Wassenhove, L.N.V. Remanufacturing as a Marketing Strategy. Manag. Sci. 2008, 54, 1731–1746. [Google Scholar] [CrossRef] [Green Version]
  61. Esenduran, G.; Kemahlıoğlu-Ziya, E.; Swaminathan, J.M. Product Take-Back Legislation and Its Impact on Recycling and Remanufacturing Industries; Springer: New York, NY, USA, 2012; Volume 174. [Google Scholar]
  62. Kovach, J.J.; Atasu, A.; Banerjee, S. Salesforce Incentives and Remanufacturing. Prod. Oper. Manag. 2018, 27, 516–530. [Google Scholar] [CrossRef]
  63. Zheng, X.; Li, D.-F.; Liu, Z.; Jia, F.; Lev, B. Willingness-to-cede behaviour in sustainable supply chain coordination. Int. J. Prod. Econ. 2021, 240, 108207. [Google Scholar] [CrossRef]
  64. Zhang, X.; Li, Q.-w.; Liu, Z.; Chang, C.-T. Optimal pricing and remanufacturing mode in a closed-loop supply chain of WEEE under government fund policy. Comput. Ind. Eng. 2021, 151, 106951. [Google Scholar] [CrossRef]
Figure 1. Model structure.
Processes 11 00118 g001
Figure 2. The game sequences.
Processes 11 00118 g002
Figure 3. Price comparison between <n,0> and <n,r>.
Processes 11 00118 g003
Figure 4. Price comparison under two subsidies policy. (a) <n,r> and <0,r>. (b) <n,r> and <r,r>.
Processes 11 00118 g004
Figure 5. Price comparison under single subsidy policy. (a) <r,r> and <r,0>. (b) <r,r> and <0,r>.
Processes 11 00118 g005
Figure 6. The manufacturer’s prisoner dilemma in <n,0> scenario.
Processes 11 00118 g006
Figure 7. “Lose/win” in <n,0> and <n,r> scenarios.
Processes 11 00118 g007
Figure 8. Comparison of profits between <r,0> and <r,r> scenarios.
Processes 11 00118 g008
Figure 9. Dilemma for the remanufacturer in <0,r> and <r,r> scenarios.
Processes 11 00118 g009
Figure 10. The profits of the manufacturer in the <0,r>, <n,r>, and <r,r> scenarios. (a) Profits in <0,r> and <r,r> scenarios. (b) Profits in <0,r> and <n,r> scenarios.
Processes 11 00118 g010
Figure 11. The profits of the remanufacturer in <n,0> and <n,r> scenarios.
Processes 11 00118 g011
Figure 12. The optimal scenario distribution of the remanufacturer.
Processes 11 00118 g012
Table 1. Overview of recent literature.
SourceDonationSubsidyRemanufacturingGame TheorySupply Chain
ManufacturerRemanufacturerNashStackelbergClosedNot Closed
[18]
[14]
[26]
[29]
[32]
[42]
[50]
[39]
[27]
[8]
This study
Table 2. Notation used.
Parameter
c n the unit cost of a new product for the manufacturer
c M r the unit cost of a remanufactured product for the manufacturer
c R r the unit cost of a remanufactured product for the remanufacturer
α consumer’s valuation of a remanufactured product as a fraction of the value of a new product
s n donation subsidy for unit new product
s r donation subsidy for unit remanufactured product
θ n reputational benefits brought by unit new product donation
θ r reputational benefits brought by unit remanufactured product donation
Decision Variable
q n amount of new products
q M r amount of collected products
q R r amount of remanufactured products
q M d n amount of donated new products
q M d r amount of donated remanufactured products from the manufacturer
q R d r amount of donated remanufactured products from the remanufacturer
p n the unit price of a new product
p r the unit price of a remanufactured product
Objective
M manufacturer’s profit
R remanufacturer’s profit
Table 3. Donation strategies.
Manufacturer
0nr
Remanufacturer q M d n = 0
q M d r = 0
q M d n 0
q M d r = 0
q M d n = 0
q M d r 0
0 q R d r = 0 <0,0><n,0><r,0>
r q R d r 0 <0,r><n,r><r,r>
Table 4. Optimal decisions in each scenario.
<0,0><n,0><r,0>
q n α 1 α T 3 + T 1 4 c M r 1 + c n c R r + α T 2 α T 3 1 + Δ n + α + T 4 2 α 1 α T 3 + 2 T 1 1 + Δ r α 2 1 + c n α
q M r c n α T 3 4 c M r 1 + c n c R r + α T 2 α T 3 Δ n 2 α 1 α T 3 + 2 T 1 2 c R r Δ r + c n Δ r c n α T 5 2 α T 3 α 1 c n
q R r 1 4 T 8 + 2 c n c M r α T 9 T 3 + T 10 α α α 1 T 3 T 7 4 c R r + α α 1 α T 3 T 1 2 c R r T 6 + α 2 Δ r + α 4 T 3 c R r + 4 T 3 α
q M d n - Δ n 2 c n + c n ( α T 3 T 12 + T 4 ) 2 c n ( α ( 1 α ) T 3 + T 1 ) -
q M d r -- Δ r 2 c M r η 2 + T 11 2 T 9 T 3
<0,r><n,r><r,r>
q n T 16 + c M r Δ r 2 ( T 21 + T 9 ) α T 12 + c M r T 14 2 ( c M r ( α 2 ) + ( 1 + α ) α ) 1 + Δ r α 2 + 2 c n 2 α
q M r Δ r ( 1 + c n α ) + α c n 2 ( T 21 + T 9 ) Δ r Δ r α + Δ n α 2 ( c M r ( 2 α ) + ( 1 α ) α ) Δ r + c n Δ r c n α 2 T 9
q R r T 9 ( 3 Δ r α ) + c M r η 1 4 α ( T 21 + T 9 ) ( 1 α ) α ( α 3 Δ r ) + T 15 4 α ( c M r ( 2 α ) + ( 1 α ) α ) α Δ r 4 α
q M d n - Δ n 2 c n + c n ( α T 12 + c M r T 14 ) 2 c n T 16 -
q M d r -- T 9 Δ r + T 13 2 c M r α ( 1 + c n α )
q R d r T 9 T 20 + T 19 4 α c R r ( T 21 + T 9 ) η 2 + c M r T 18 4 c R r α T 16 2 α Δ r + c R r ( Δ r α ) 4 c R r α
Disclaimer/Publisher’s Note: The statements, opinions and data contained in all publications are solely those of the individual author(s) and contributor(s) and not of MDPI and/or the editor(s). MDPI and/or the editor(s) disclaim responsibility for any injury to people or property resulting from any ideas, methods, instructions or products referred to in the content.

