Article

Particle Scale Insights into a KG-Pharma RoTab Tablet Press Feed-Frame System Using the Discrete Element Method (DEM) Modeling

by
Zihao Li
1,†,
Rohit Kumar
2,*,†,
Hector Rafael Guzman
2,‡ and
Renato Andrés Chiarella
2
1
Hildebrand Department of Petroleum and Geosystems Engineering and the Center for Subsurface Energy and the Environment, The University of Texas at Austin, Austin, TX 78712, USA
2
Pharmaceutical Development, Alkermes Inc., 900 Winter St, Waltham, MA 02451, USA
*
Author to whom correspondence should be addressed.
These authors have contributed equally to this article.
Current address: Lyndra Therapeutics, 60 Westview St, Lexington, MA 02421, USA.
Processes 2023, 11(1), 119; https://doi.org/10.3390/pr11010119
Submission received: 6 November 2022 / Revised: 28 December 2022 / Accepted: 29 December 2022 / Published: 1 January 2023

Abstract

:
In the pharmaceutical industry, tablets are a common dosage form. As part of the manufacturing process, powder in a tablet press passes through a feeding system called the feed-frame before reaching the die cavity. Under different manufacturing conditions (e.g., paddle speed, turret speed), issues such as segregation of powder blend components, over lubrication, and drug particle attrition often occur in the tablet press feed-frame, which affect the final drug product quality. Therefore, developing a particle-scale understanding of powder behavior in a feed-frame is essential. This paper used the discrete element method (DEM) to study powder flow in the feed-frame of a kg-pharma RoTab tablet press. Simulation results show that an increase in paddle speed has less effect on tablet mass than turret speed and that an increase in turret speed reduces tablet mass and increases variability in the tablet mass. The effect of paddle speed and turret speed on the API content in the tablet is small, but large paddle speeds exacerbate the segregation of powder blend components in the feed frame, increase particle traveled distance, particle shear work, and torque on the paddle wheel, thereby increasing particle over lubrication and attrition. However, the increase in paddle speed reduces the mean residence time of drug particles and prevents over lubrication at low turret speeds. Increasing the turret speed reduces tablet mass, particle shear work, paddle torque, and mean residence time. Although increasing turret speed can effectively prevent particle attrition and over lubrication, short residence times are not conducive to mixing excipients and API components, leading to higher tablet mass variability. This study not only gives us a particle-level insight into the process but can also be used to inform and optimize the design of experimental studies.

Graphical Abstract

1. Introduction

The flow of particulate material is encountered in many industries, such as agriculture, pharmaceutical, and chemical industries [1,2,3,4,5,6,7,8]. Of particular interest in this study is powder flow in a tablet press’s feed-frame. In the pharmaceutical industry, a tablet press compresses formulated powder into tablets of uniform size and mass [9]. Before powder reaches the die turret, it flows through a feed-frame system that usually consists of a hopper, a feeding chamber, and a paddle. The formulated powder blend is thoroughly mixed by stirring the paddle wheel in the feed-frame chamber. The powder blend that goes into the tablet press generally consists of different excipients and one or more active pharmaceutical ingredients (APIs). Excipients are additives used in tablet formulations to improve the tablet’s bulkiness, disintegration, dissolution rate, and bioavailability [10,11]. The tablet press operation is divided into two processes: filling and tableting [12]. The powder flow into the hopper and mixing in the feed-frame chamber is the filling process, and the process in which the powders enter the die and are compressed into a tablet is the tableting process [13].
There are many types of tablet presses, kg-pharma RoTab (Stockholm, Sweden) is one of the models in the instrumented multiple press rotary tablet press. The kg-pharma RoTab model uses one paddle to stir and mix the powders in the chamber, so that the powders flow into the high-speed rotating turret die. The kg-pharma RoTab has 8 D-type punch stations, and its maximum tablet output per hour (TPH) is 19,200 tablets. The kg-pharma RoTab model adopts the main compression force control. When operating a tablet press, feed-frame paddle speed and turret speed are the two most critical operating parameters that affect the quality of the tablets produced [14]. Paddle and turret speeds are generally selected using literature data, practical operating conditions, and powder properties [15]. Large paddle speeds are beneficial for lowering the relative standard deviation (RSD) of tablet mass, resulting in better tablet mass distribution but increase the potential for particle attrition and over lubrication [16]. Lubricants are powder particles added during the tableting process. Lubricant particles are sheared into pieces and coated on the surface of other particles to lubricate. Overlubrication may reduce tablet tensile strength [17] and cause slow tablet dissolution [16]. Increasing paddle speed has a negligible effect on the fill ratio (ratio of powder volume in die to die cavity volume) of the powders in the die, but if using cohesive powders, increasing paddle speed slightly increases the fill ratio [18]. Large turret speeds reduce over lubrication and particle attrition but result in a decrease in tablet quality and an increase in quality variation [15]. Large turret speeds significantly reduce the fill ratio (fill ratio < 0.8), resulting in an inclined surface of the powder in the die and a considerable variation in the total amount of powder per die [18].
In addition to paddle speed and turret speed, factors such as powder properties, paddle shape, etc., can also affect the tablet’s quality. Powders of different components will inevitably segregate because of different properties, such as weight and friction coefficient. Segregation causes smaller particles to settle in the chamber, resulting in widely variable API content across the produced tablets. The use of cohesive powders mitigates segregation [19], but these are sticky and have poor flow properties that may cause significant variations in tablet mass [15,16,19]. Small friction coefficients mitigate segregation, and powders with large friction coefficients should be avoided in tablet manufacture [14,19]. The excessive shear force between powder particles can affect tablet tensile strength, disintegration, and dissolution [14], and the coefficient of restitution of powder particles does not affect tablet quality [15].
Residence time is the time the powder particles stay in the tablet press chamber and is affected by process operating conditions, equipment design, and powder properties. Residence time is an important parameter that determines powder mixing, over lubrication, segregation, and attrition behavior in a feed frame. The large diameter hub reduces the amount of powder resident in the feed-frame for long time [16]. The distance between the chamber and the turret affects the creation of dead zones where particles cannot be pushed into the die, which results in some particles staying longer in the dead zone [16]. Particle-wall friction has a significant effect on powder flow in the feed-frame, especially on particle size segregation [14]. Large cohesion is not conducive to particle flow, which significantly affects the die filling process [16]. Dülle et al. [20] investigated the effect of scraper shape on residence time. In the die filling process, some particles flow into the die and some remain above the turret. An inner scraper is a device that aids in the recovery of particles by scraping them from the turret back into the feed-frame. The outer scraper is a device that scrapes the particles above the turret to the outside so that the particles cannot be recirculated. Dülle et al. [20] found that using inner scrapers resulted in a longer residence time for the powders. The use of a round rod paddle has no effect on the mass of the produced tablets, but the mean residence time of the powder increases slightly, and the difference in the residence time of different powders becomes more significant, which is not conducive to improving the tablet quality [21]. Ketterhagen [16] studied the effect of three different wheel shapes on tablet quality: standard wheel, angled wheel, and large hub wheel. Large hub wheels result in a more uniform tablet mass, reducing the potential for powder attrition and over lubrication. However, the choice of paddle wheel shape usually depends on experience because of the different types of tablet presses [22]. The shape and size of the powder particles can also affect the tablet quality; using large particle sizes and round particle shapes will increase the filling ratio of the powder in the die [18]. Mendez et al. [23] found that changing the paddle speed had less effect on particle size distribution in the die for small feed-frames (Manesty Beta Press, Merseyside United Kingdom) than bigger feed-frames (Fette 3090, Schwarzenbek Germany). The quality of tablets produced by different sizes and types of tablet presses differ in sensitivity to changes in a single parameter, e.g., paddle speed and turret speed. However, the literature data can only be used as a reference, and corresponding experiments and simulations are required to optimize the operating parameters for different tablet press feed-frames.
Numerical simulation techniques, such as the discrete element method (DEM), have been used in many industries, such as civil, petroleum, chemical, and pharmaceutical [24,25,26,27,28,29,30,31,32]. DEM simulations have also been used to model the mechanical behavior of granular assemblies [33]. In recent years, DEM simulations have been used in the pharmaceutical industry to simulate the flow of drug powder particles in the feed-frame of a tablet press [15,16,22,29,34,35,36,37,38]. In this study, DEM is used to simulate the powder flow in the feed-frame of a kg-pharma RoTab tablet press and to study the effect of operating conditions, e.g., paddle speed and turret speed, on particle properties, such as residence time, distance traveled, shear work, and segregation behavior, as well as tablet mass and content uniformity produced by the kg-pharma RoTab tablet press.
In this article, first, the equations of DEM are briefly introduced, followed by a discussion of the dimensions of the tablet press and the working principle of the tablet press feed-frame. The DEM is then used to model the powder flow in the feed-frame. Finally, the impact of paddle and turret speed on particle properties and tablet quality is discussed. This study only simulates powder flow, and powder compaction is out of scope.

2. The Discrete Element Method Model Development

This study uses ASPHERIX® version 5.3.0, a cutting-edge DEM simulation software based on LIGGGHTS®, to simulate the particle flow [39]. The simulation visualization and post-processing have been performed using OVITO® version 3.3.0 [40] and MATLAB® version R2019b (MATLAB®) [41]. In this study, DEM simulations treat particles as spheres of different sizes and compute the particle trajectories and rotations using Equations (1) and (2),
m i a i = F i , n + F i , t + F i , b ,
I i d ω i d t = r i , c × F i , t + T i , r ,
where the subscript i is the particle i, m is the particle mass, a is the particle acceleration, Fn is the particle-particle normal contact force, Ft is the particle-particle tangential contact force, Fb is the body force, ω is the angular velocity of the particle. The variable I is the moment of inertia, ri,c is the distance between the overlapping circular cross-section and the center of the particle, Tr is an additional moment that can be used to model non-sphericity by means of a ‘rolling friction’ model given in Equations (6) and (7) [42] and the direction of the moment is along the axis that passes through the center of the particles in contact and is perpendicular to the line joining the center of the overlapping circular cross-section to the center of the particle.

2.1. Hertz-Mindlin Contact Force Model

DEM computes the forces and moments between the particles, and particles and walls [43,44,45]. In this study, we use Hertz-Mindlin model. The DEM allows a small overlap between contacting particles, and particles and wall to calculate the movement of the particles according to Equations (3) and (4),
F n = k n δ n 3 / 2 + γ n δ ˙ n δ n 1 / 4 ,
F t = k t δ n 1 / 2 δ t + γ t δ ˙ t δ n 1 / 4 ,
where δ n is the maximum constant overlap, δ t is the relative tangential displacement, δ ˙ n is the relative velocity in the normal direction of the contact, δ ˙ t is the relative velocity in the tangential direction of the contact, k n = 4 3 E e q R e q is the normal stiffness, k t = 8 G e q R e q is the tangential stiffness, γ n = log ε 5 k n m e q log ε 2 + π 2 is the normal dissipation constant, and γ t = log ε 10 / 3 k t m e q log ε 2 + π 2 is the tangential dissipation constant. The variable ɛ is the coefficient of restitution, E e q = 1 υ i 2 E i + 1 υ j 2 E j 1 is the equivalent elastic modulus, G e q = 2 υ i G i + 2 υ j G j 1 is the equivalent shear modulus, m e q = m i m j m i + m j is the equivalent mass and R e q = R i R j R i + R j is the equivalent radius. During the simulation, a large simulation time step should be avoided, which can cause excessive particle overlaps and erroneous simulation results.

2.2. Cohesion Model

The “modified simplified JKR—Johnson-Kendall-Roberts” (SJKR2) model is used to simulate the cohesion between drug particles [46,47]. If two particles are in contact, the SJKR2 model adds an extra normal force to maintain contact,
F n = c A i j ,
where c is the cohesion energy density and A i j = 2 π δ n R e q is the particle contact area.

2.3. Rolling Friction Model

In this study, the alternative elastic-plastic spring-dashpot (EPSD2) model [48,49] is used, which adds an additional moment,
T i j r = T i j r , k = k r Δ θ r , i j ,
where T i j r , k is the moment component modeled as a mechanical spring, k r = k t R e q 2 is the rolling stiffness and Δ θ r , i j is the incremental relative rotation between the two particles. The magnitude of the moment is bounded by:
T i j r , k μ r R e q F n ,
where μr is the rolling friction coefficient.

2.4. Shear Work Done on Particles

The shear work of a particle (Wt) is calculated by
W t = m = 1 N F t , i l t , i ,
where m is the number of contacts at each time step, N is the total number of contacts of the particle, and lt,i is the tangential displacement at the contact. The tangential shear work is added after each time step to the particle. The tangential shear work is used here as an indicator for particle over lubrication and attrition behavior.

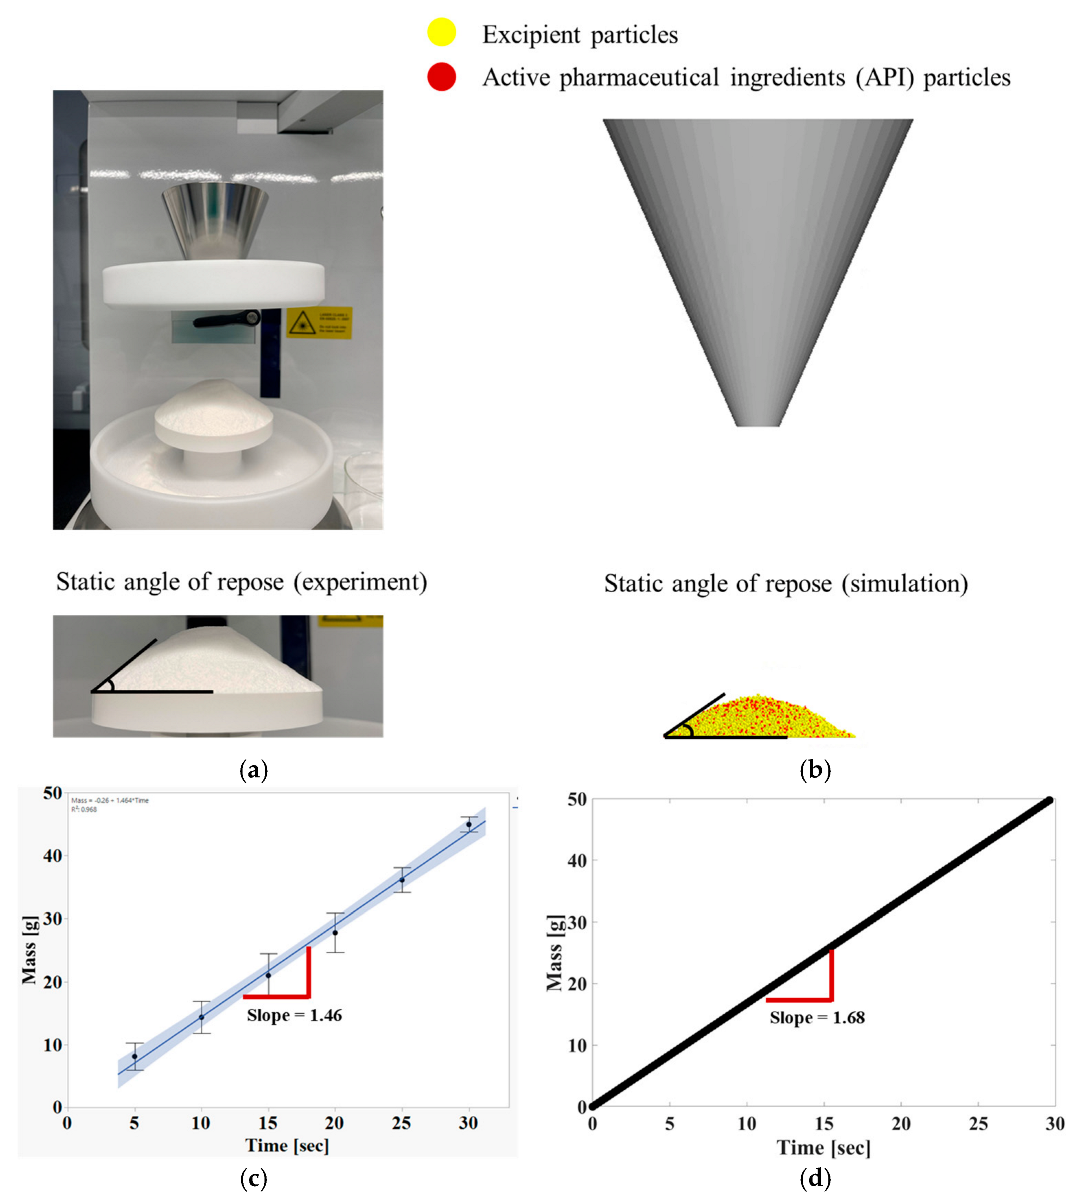
2.5. Particle Properties Calibration

In this study, a static angle of repose and mass flow rate have been used as a methodology with the same particle size distribution to calibrate powder flow properties following a previous work done by Hildebrandt et al. (2019) [26]. The experiments were done using the ERWEKA® GmbH GTB Granulate Flow Tester. A snapshot from the experiment performed on the GTB Granulate Flow Tester using Avicel® PH200, a widely used excipient in the pharmaceutical industry, is shown in Figure 1a. In this experiment, 50 g of Avicel® PH200 material was loaded into a 0.1 L hopper with an outlet hole size of 6 mm. The hopper outlet is then opened to let the powder flow out, and accurate values of the angle of repose and mass flow rate has been experimentally measured. The average angle of repose measured from five experiments was 37.2° ± 2.3° and mass flow rate was 1.46 g/s (Figure 1c). The DEM simulation was performed to mimic the angle of repose (Figure 1b) and mass flow rate (Figure 1d) experiment using the particle size distribution given in Table 1 and material properties shown in Table 2. The material properties of particles were tuned such that the resulting angle of repose (36.8° ± 3.1°) and the mass flow rate (1.68 g/s) match closely with the experimental measurements. The same material properties and particle size distribution were later used in the feed frame DEM simulations. The simulated powder heap is shown in Figure 1b. In the DEM simulation, we only created the circular base (the base in the right figure of Figure 1). A portion of the fallen particles flow out of the base from the edge of the base. In the experiments, we used the annular space to store this part of the fallen particles, while in the simulation, this part of the fallen particles flowed out of our simulation area and was thus removed to reduce the computation time. Generally, in a pharmaceutical blend, active pharmaceutical ingredients (APIs) are the smallest particle, and so in this simulation, the smallest particle with 0.55 mm diameter has been marked as API and colored in red and was monitored to understand segregation behavior and tablet quality in this study, rest of the particles are marked as excipients and colored in yellow.

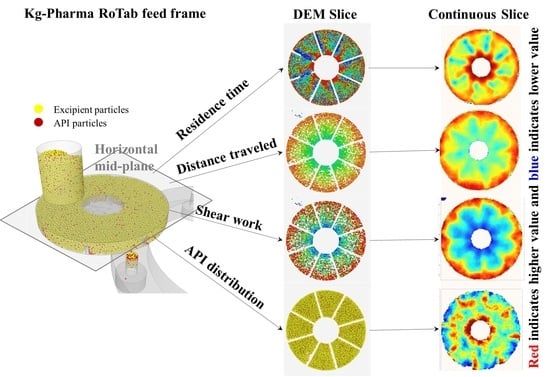
2.6. Kg-Pharma RoTab Tablet Press Feed-Frame

In this study, the flow of powder particles in the kg-pharma RoTab tablet press was simulated. Figure 2a shows a schematic of kg-pharma RoTab feed frame with the rotating die turret, the feed frame consists of a hopper and a chamber with a paddle. The hopper is cylindrical with a diameter of 50 mm and is attached to the chamber, which is an annular area with a diameter of 154 mm and has a paddle fitted in it. The clearance between the paddle and wall has not been considered due to particle size limitation. The die turret has eight circular dies in it with a 12.5 mm die cavity, such that the angle between two adjacent dies is 45 degrees. The particle-to-hole ratio for hopper opening is around 55 and for die cavity is around 14. During tablet manufacture, powder particles are put into the hopper from where they flow into the chamber and eventually to the die cavity (Figure 2b). The smallest particles were colored red and represented the API for the purpose of segregation analysis, while other particle sizes are colored yellow and represented excipients. The seal connects the opening through which, the powder flows from the feed frame chamber to the dies. As the particles flow from the feed frame chamber to the die in the turret, they first flow into the seal opening and then to the turret dies. Both the turret and the paddle rotate in a counterclockwise direction at a constant angular velocity. In this study, a total of 16 simulations were run at four different paddle and four different turret speeds. Both the paddle and turret speeds varied from 20 RPM to 80 RPM with an interval of 20 RPM. Figure 2a also shows two planes; the top view plane and the side view plane, where continuous maps of particle properties have been plotted. The top view plane is a horizontal slice passing through the center of the feed frame chamber and the side view plane is a vertical slice passing through the center of the hopper and is perpendicular to the top view plane.

3. Results and Discussion
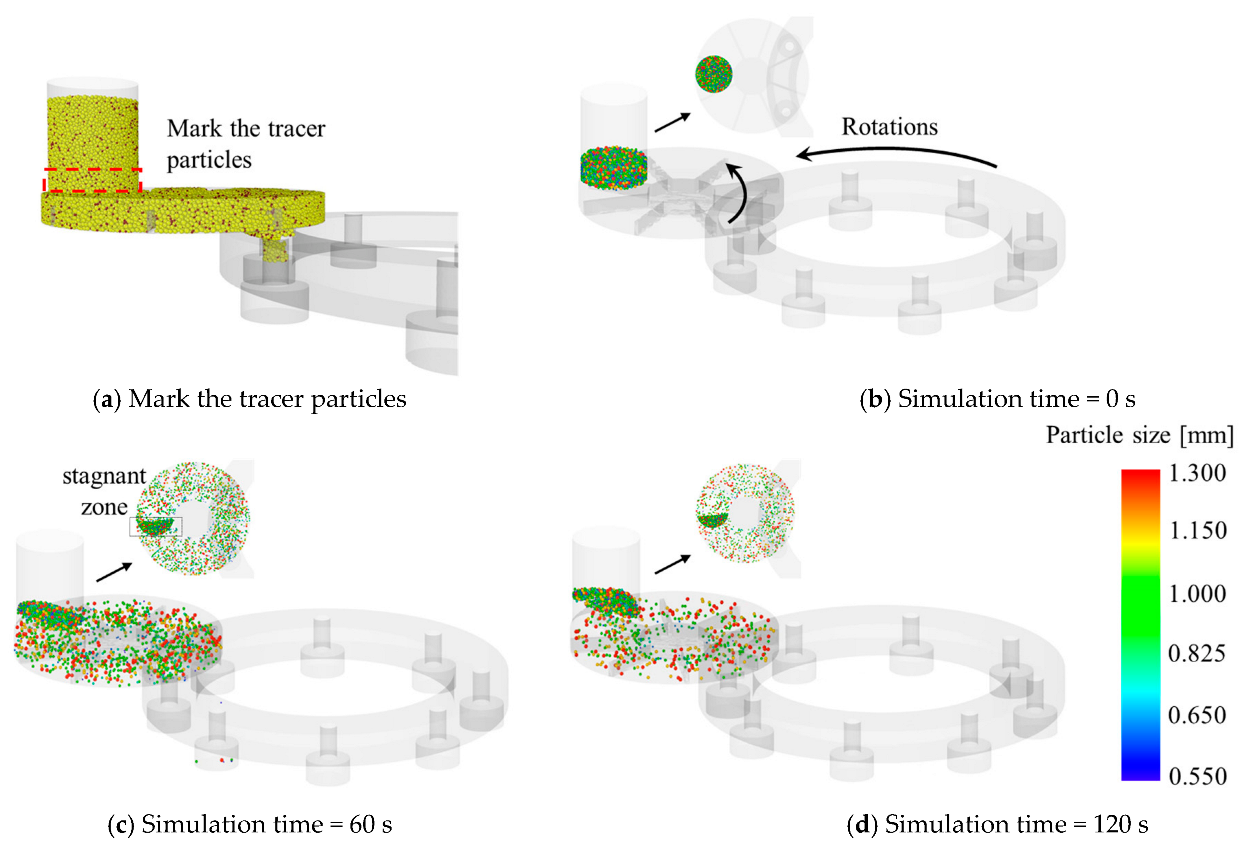
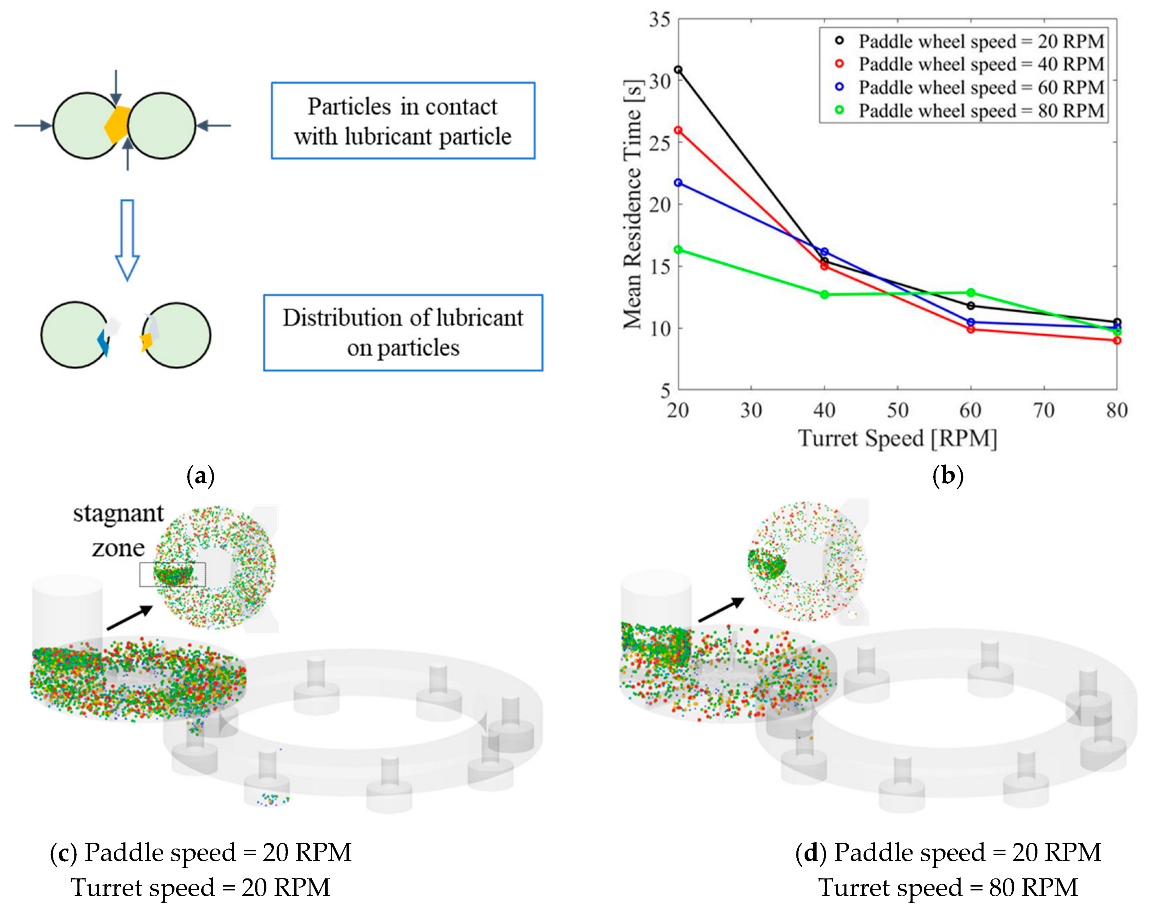
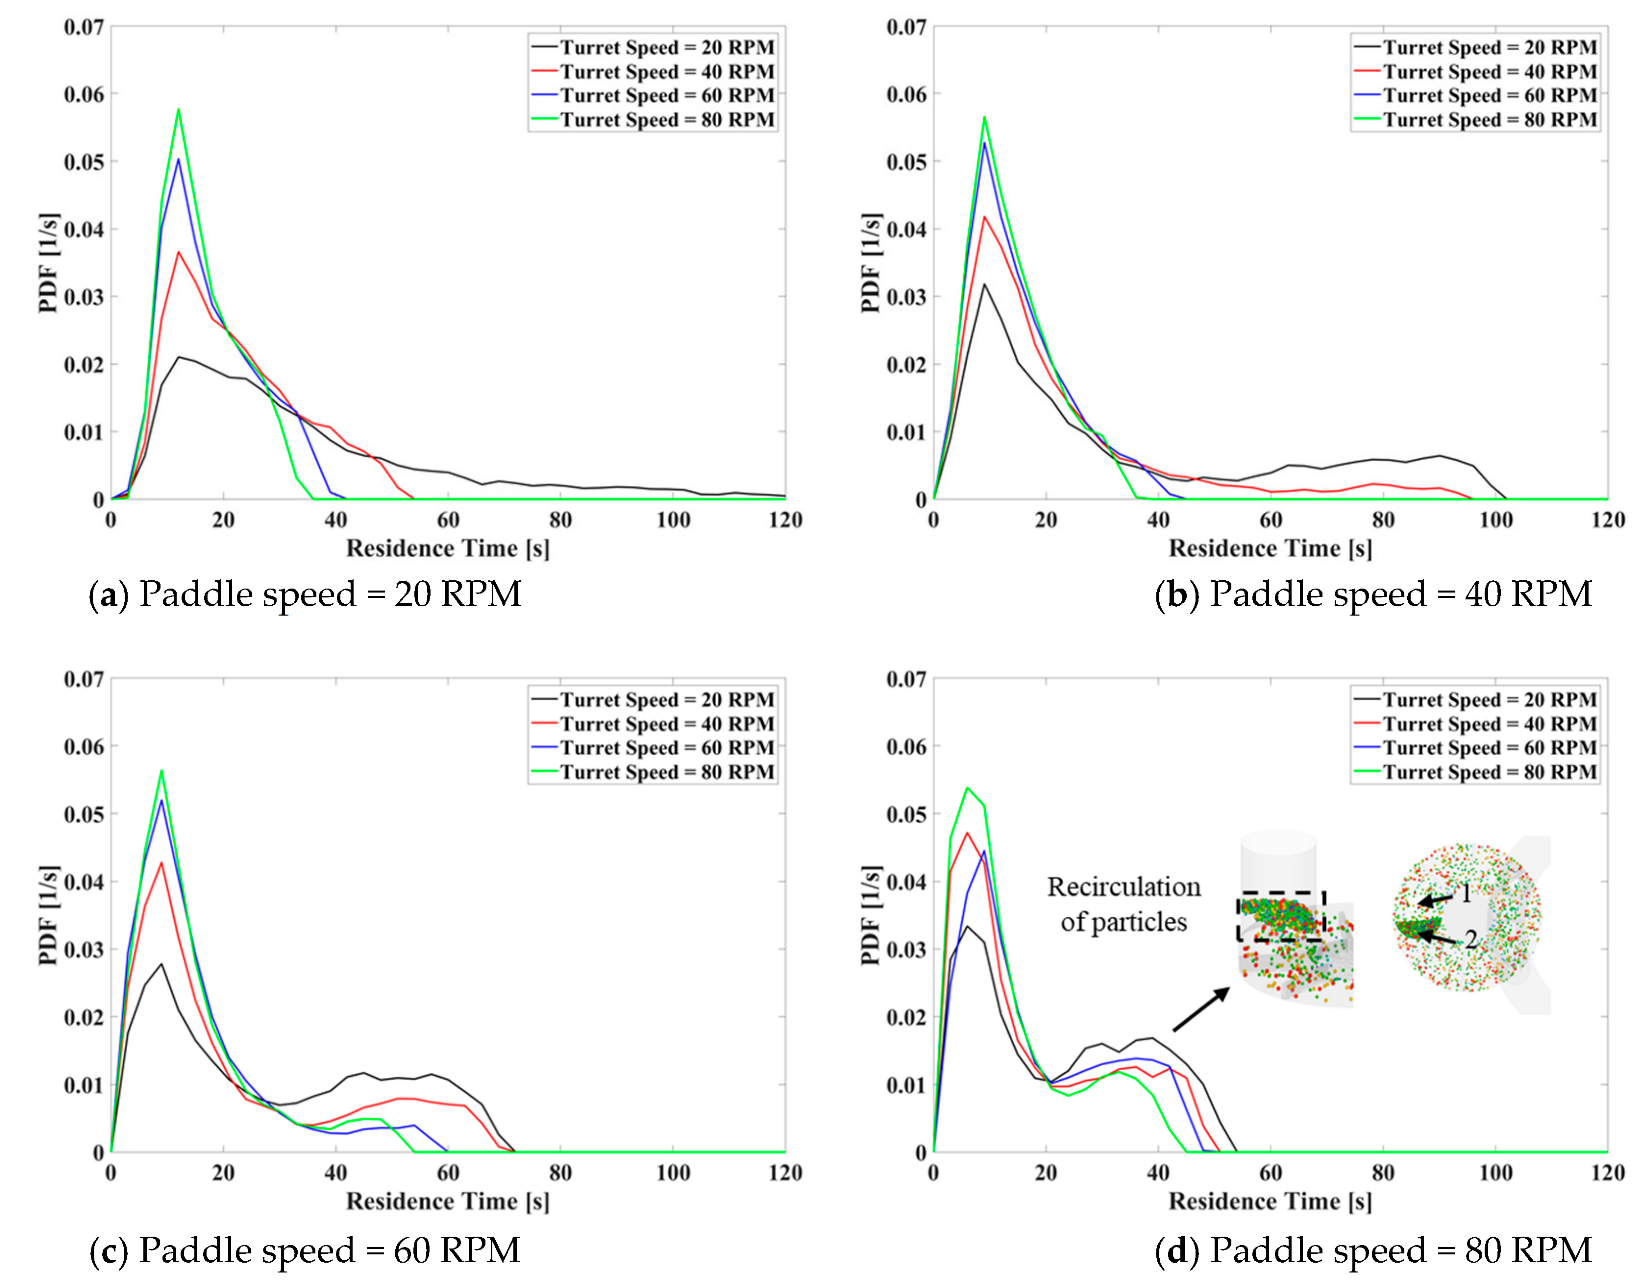
In this study, residence time distribution, particle travel distance distribution, shear work done on particles, and torque on the paddle were calculated. These parameters can be used as indicators to assess the risk of particle over lubrication and attrition. Furthermore, to evaluate the tablet quality, tablet mass distribution and API content within tablets were calculated. The results were extracted once the simulation reaches a steady state. Steady state means that the tablet weight has become stable, and the variation from the mean weight is 5–7%. In addition to the standard plots, continuous surface maps were created to provide visually intuitive images of powder flow behavior within the feed frame. Top-view surface plots are created by using the top view plane (Figure 2a) and plotting the average particle properties within spherical control volumes of diameter equal to the height of the feed-frame chamber. Similarly, the side view surface plots are created by using the side-view plane (Figure 2a) and averaging a property within spherical control volumes with a diameter equal to the feed-frame chamber height.

3.1. Residence Time

Residence time in this study is defined as the time a particle spends moving from the hopper feeder interface until it exits from the feed-frame chamber. The exit point of the simulation is when the particle enters the die. Figure 3 shows the method for marking particles and calculating residence time distributions. Particles in the lower quarter of the hopper at the hopper feeder interface are marked as tracer particles (Figure 3a), and the tracer particles of different sizes are marked with different colors based on their sizes (Figure 3b). Each tracer particle is tracked until it exits the feed frame chamber. In the simulation in Figure 3, the paddle speed and turret speed are both set at 20 RPM. A portion of the particles preferentially enter the chamber as the paddle rotates in the counterclockwise direction; additionally, the left-over portion starts to rise to form a recirculation region (Figure 3c,d). As the paddle rotates, particles from one side of the hopper, which encounter the paddle blades first, fill the space between the paddles, leaving no room for the particles on the other side and creating a preferential flow. In addition, the rotating paddle provides continuous shear to the remaining powder particles, leading to a clockwise circulation in the hopper. The recirculation of particles can be seen in Figure 3c,d, where particles in the stagnant zone start to rise as time progresses.
The effect of paddle speed and turret speed on the residence time of powder particles is shown in Figure 4. The lubricant forms a coating on the particles due to mixing under shear (Figure 4a). Over lubrication occurs due to excessive and more uniform lubricant coating on excipient or API particles. Residence time is a significant factor that impacts lubrication such that a longer residence time may result in over lubrication, while a short residence time may result in uneven mixing of excipients and APIs. Increasing the turret speed reduces mean residence time because of higher powder particle throughput as the turret rotates faster (Figure 4c,d). An increase in paddle speed reduces the mean residence time at low turret speeds, but it has less impact on the mean residence time at large turret speeds (Figure 4b), which indicates that turret speed has a more significant influence on residence time than paddle speed. Therefore, changing the turret speed can be more effective than changing the paddle speed to reduce residence time and over lubrication, mainly when the tablet press is operated at higher turret RPMs. The images shown in Figure 4c,d also show the preferential flow at the hopper feeder interface, where particles in the stagnant zone rise and recirculate into the hopper, as discussed in the previous paragraph. The magnitude of recirculation depends on the paddle and turret speed combination, higher paddle speed and lower turret speed increase recirculation and vice versa. It can also be seen that the number of particles in the feed-frame chamber reduces as the turret speed goes up from 20 RPM (Figure 4c) to 80 RPM (Figure 4d).
The effect of paddle speed and turret speed on the residence time distribution of tracer particles is shown in Figure 5a–d. Each powder particle spends a different amount of time in the chamber, depending on the spatial location of particles and operating conditions. Increasing the turret speed allows more particles to flow into the die, so more particles have a shorter residence time. The increase in paddle speed has relatively little effect on the mean residence time of particles, especially when the turret speed is large. However, at large paddle speeds, the distribution of particle residence time has two peaks (Figure 5d). When the paddle rotates, particles on one side of the hopper, which comes into contact with the paddle blade first, flow more easily into the chamber and take up the space between the paddles, while the particles on the other side stay in the hopper, creating a stagnant zone.
Furthermore, a continuous shear from the counterclockwise rotating paddle creates a clockwise circulation at the hopper feeder interface. This phenomenon leads to the creation of a preferential flow channel on one side of the hopper and a stagnant zone on the other, from where the particles recirculate and gradually enter the flow channel. Because of this phenomenon, a bimodal residence time distribution emerges at higher paddle speeds and a longer tail at lower paddle speeds. At lower paddle speeds, the longer tail becomes smaller because the rate of particle circulation increases with paddle speed. Although not included in this study, the particle circulation behavior at the hopper feeder interface will be impacted by the hopper outlet’s size and design, and the paddles’ design.
In addition to the DEM simulation graphics and residence time distribution plots, visually intuitive continuous surface plots were created on the two surface planes, the top-view plane and the side-view plane, shown in Figure 2a. A continuous surface plot is the average distribution of particle properties per unit volume. The continuous surface plot is the spatial average of all particle data, not a slice of the model. This methodology will assist in developing a visual understanding of particle residence time throughout the feed frame system. To do this, the individual particle residence time was calculated and used for coloring those particles while the particles were held at their initial spatial locations. Figure 6 shows the continuous surface maps of the top and side views of the feed frame. The calculation of residence time in this figure is different from the method in Figure 4. In this figure, at some point, we make it the initial time, at which point we track all particles throughout the feed-frame chamber and hopper. We then run the simulation over a period of time to check which part of particles is more likely to flow out of the chamber. From these figures, one can observe the preferential powder flow happening in the hopper and the dominant impact of turret speed on the residence time compared to the paddle speed. Furthermore, these images show the regions of higher and lower residence time. From the top view and side view shown in Figure 6, it is observed that the areas of higher residence time are the periphery of the paddle hub, the periphery of the feed frame chamber, and the front of the paddle blades. It also shows an impact of turret speed and paddle speed interaction, in which a higher turret speed reduces the residence time while higher paddle speeds improve the uniformity of residence time within the feed frame chamber.

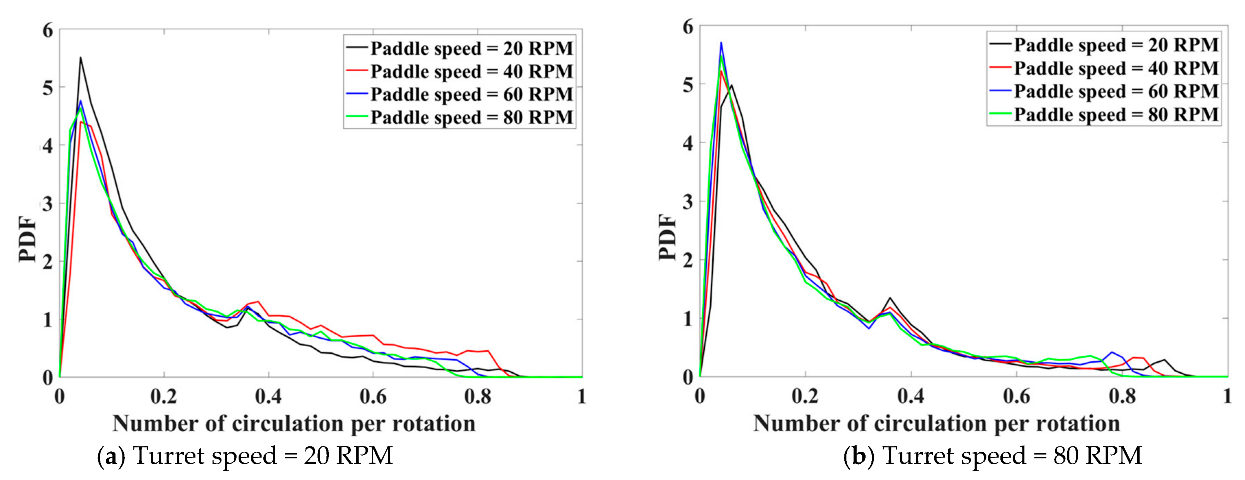
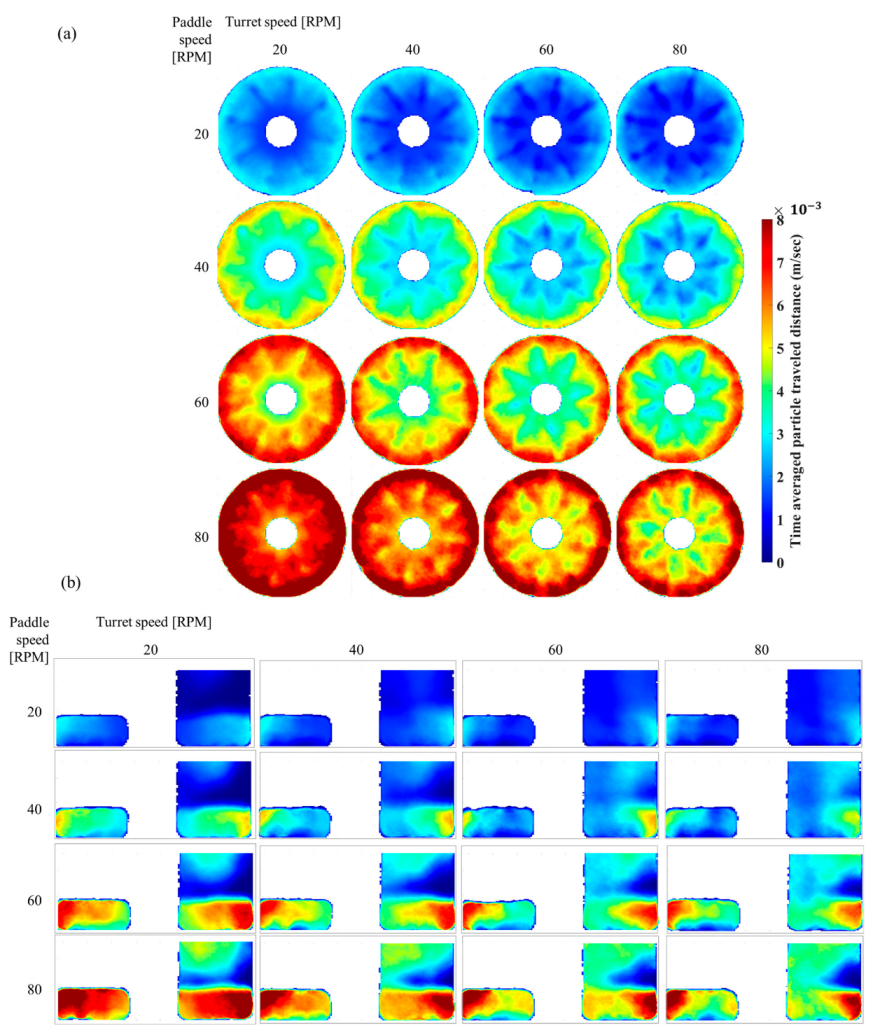
3.2. Particle Traveled Distance

The particle traveled distance is another parameter that has previously been used to predict over lubrication of particles in the feed-frame of a tablet press [16]. Like the residence time distribution, particles are tracked to calculate the particle travel distance distributions at different operating conditions. The hypothesis is that the longer the particles travel, the higher the probability that the particles will shear against each other and the wall exacerbating the over lubrication issue. However, if the powder is highly cohesive it will tend to move as a block and the relationship between the distance traveled and particle shear may not high correlation. In the DEM simulation, individual particles are tracked from the hopper feeder interface until it exits the feed-frame chamber. The particle distance traveled distribution is shown in Figure 7a, b for four different paddle speeds and two extreme turret speeds in terms of number of circulations per rotation. One circulation is defined as the ratio of particle distance traveled to the circumference of the feed frame chamber. The normalized particle distance will vary between 0 to 1, as a particle cannot travel more than the absolute distance traveled by the tip of the paddle. The normalized particle distance collapse on each other for all paddle and turret speed combinations indicating that the number of circulation per paddle rotation stays the same. Although not shown for brevity, the paddle speed is the factor driving the absolute distance traveled and higher paddle speeds also mean more circulation. The turret speed has an insignificant effect on the particle distance traveled. Additionally, the distance traveled does not account for the contact shear force, which is another factor playing a role in the lubricant particle breakage and spread. So, the distance traveled, and the contact shear force is combined into contact shear work in Section 3.3.
Similar to the residence time, continuous surface plots (Figure 8) of particles distance travelled for both top-view and side-view surfaces were plotted to get a visual understanding within the whole feed frame chamber. From these images, it can be observed that increased paddle speed increases the particle traveled distance. Increasing the turret speed reduces the particle traveled distance near the paddle wheel, and the paddle speed significantly affects the particle traveled distance. From both the top view and the side view surface plots, it is seen that the regions of higher distance traveled are always located near the periphery of the feed frame chamber. This is expected because the paddle tip has the maximum speed and hence the maximum distance traveled with time; however, at lower turret speeds, particles also have higher residence times, and the overall distance traveled becomes significantly higher for all particles in the domain. The stagnant zone in the hopper region, colored in blue, can also be seen in Figure 8.

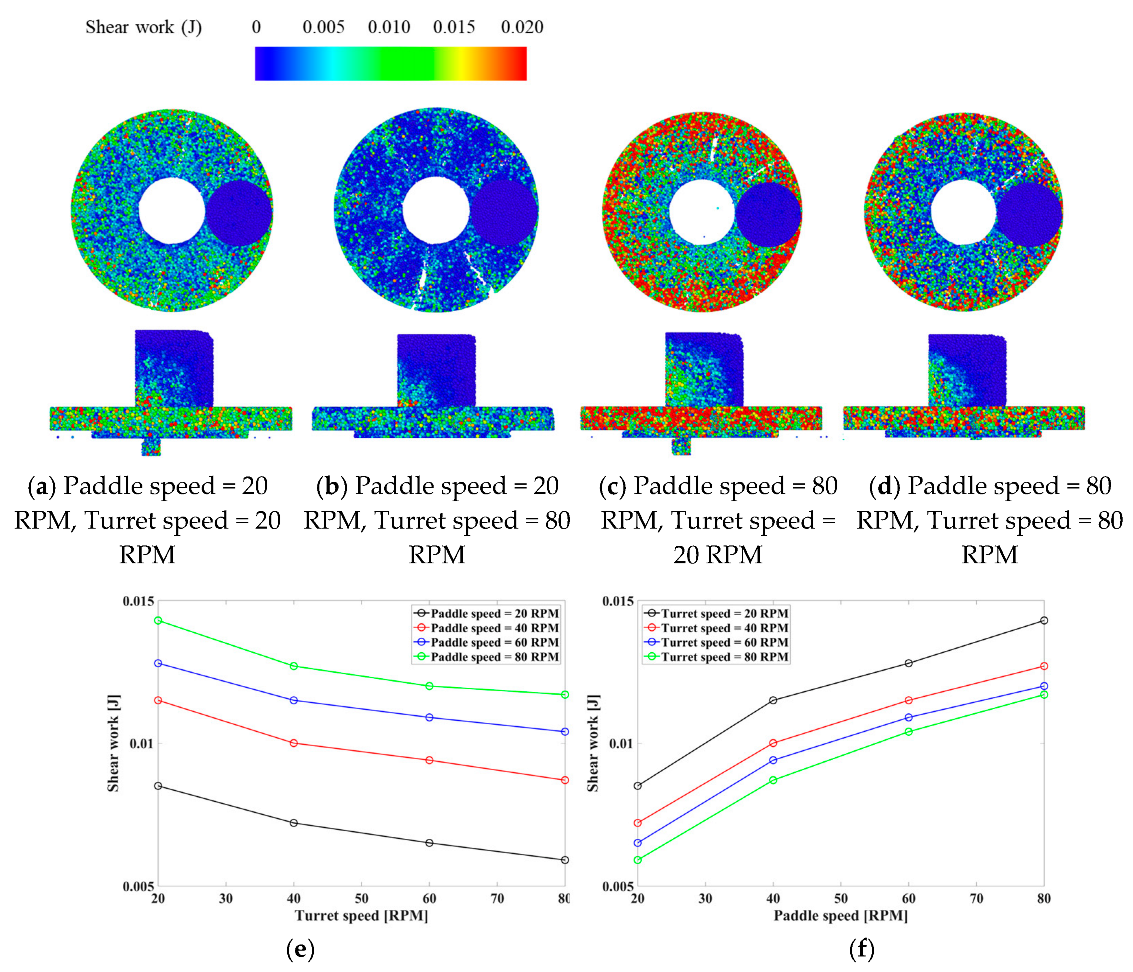
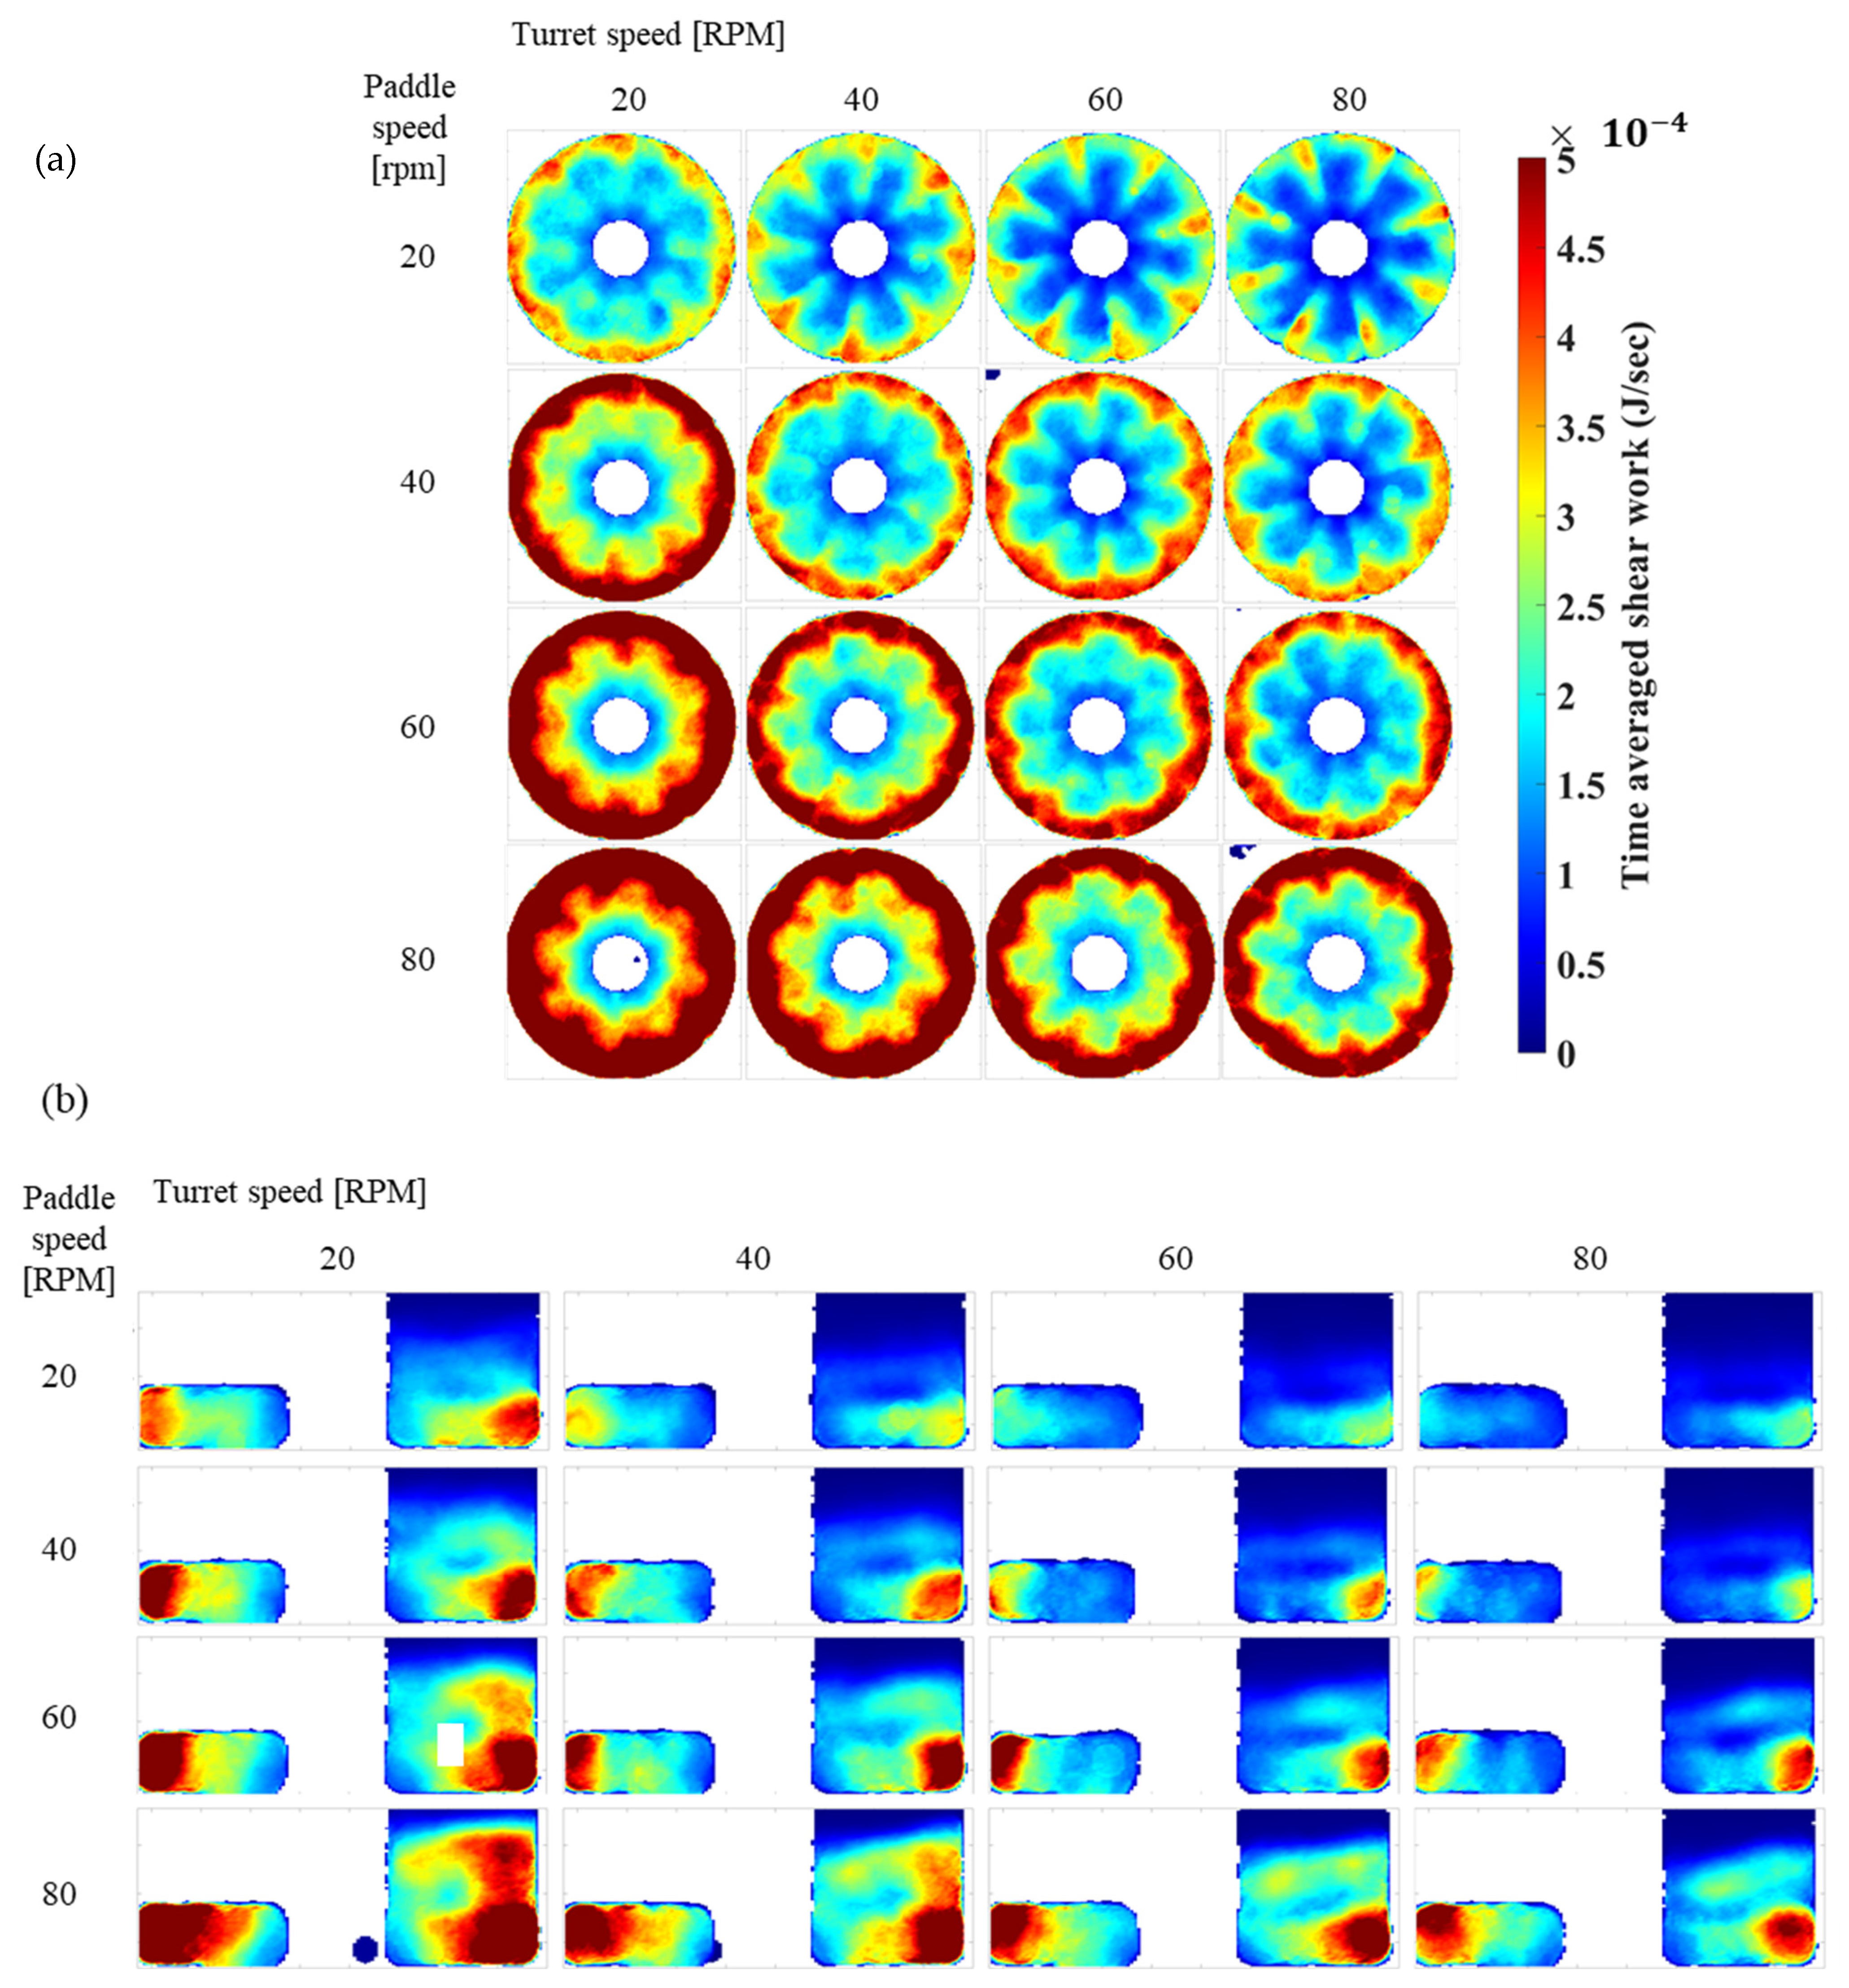
3.3. Shear Work Done

In addition to residence time and particle traveled distance, tangential shear work is also an indicator of particle attrition and overlubrication. Mixing is a shear-driven process; the higher the shear, the higher the mixing efficiency [49]. Previous work has shown that in the case of over lubrication, the surfaces of primary powder particles are covered with lubricant particles, thereby reducing the adhesion between particles [17]. The particle over lubrication propensity increases as the lubricant particles break into smaller particles or deagglomerate into smaller pieces. The spread of lubricant on particle surfaces is primarily driven by particle-particle and particle-wall shear interaction. The particle distance traveled is an indication of shear displacement, but the shear contact force is not considered. Hence, a parameter incorporating both the contact shear displacement and the shear force is the shear work done on a particle, and it can be calculated using Equation (8).
Figure 9 shows the top and side views of the DEM simulation of the feed-frame (Figure 9a–d) at a given time instance (30 s) and the effect of paddle speed and turret speed on time averaged shear work done over 30 sec (Figure 9e,f). In Figure 9a–d, the particles are colored based on the shear work done once the system reaches a steady state. At a paddle speed of 20 RPM (Figure 9a,b), the shear work done on the particles is significantly smaller than that at a paddle speed of 80 RPM (Figure 9c,d). The increase in turret speed (80 RPM) reduces the shear work because the residence time of particles in the chamber decreases with the increase in turret speed. However, an increase in paddle speed significantly increases shear work because of the increased shear work done by the paddle wheel on the particles. Therefore, the simulation with minimum turret speed (20 RPM) and maximum paddle speed (80 RPM) has the maximum shear work (Figure 9c). Figure 9e,f also confirm this. The slope of the curve in Figure 9f is more significant than that of the curve in Figure 9e, which indicates that the paddle speed has a larger effect on the shear work than the turret speed. To better understand the normalized spatial distribution of shear work over a time interval within the feed-frame, Figure 10a shows surface plots of the top view of the feed-frame chamber. Figure 10b shows the surface plots of the side view of the feed-frame chamber at different paddle and turret speeds. The shear work is highest at the end of the paddle wheel (red region in Figure 10a), which suggests that over lubrication and particle attrition would occur mainly at the periphery of the paddle wheel. This is because the end of the paddle wheel is farthest from the center of the paddle, so the linear velocity and the shear work on the particles is also the largest. There also appears to be a higher shear work concentration close to the paddles at the periphery of the feed-frame chamber. Similar to the top-view images, the side-view pictures (Figure 10b) show more extensive shear work at the edge of the paddle wheel. Furthermore, an interesting trend emerges at the hopper feeder interface, where high shear work can be seen to propagate in the hopper region, especially at higher paddle speeds. This can be attributed to the circulation of the particles at the stagnant hopper feeder interface because of the shear induced by the rotation of the paddle wheel. This suggests that the potential for over lubrication as well as attrition increases at higher paddle speeds even within the hopper region.

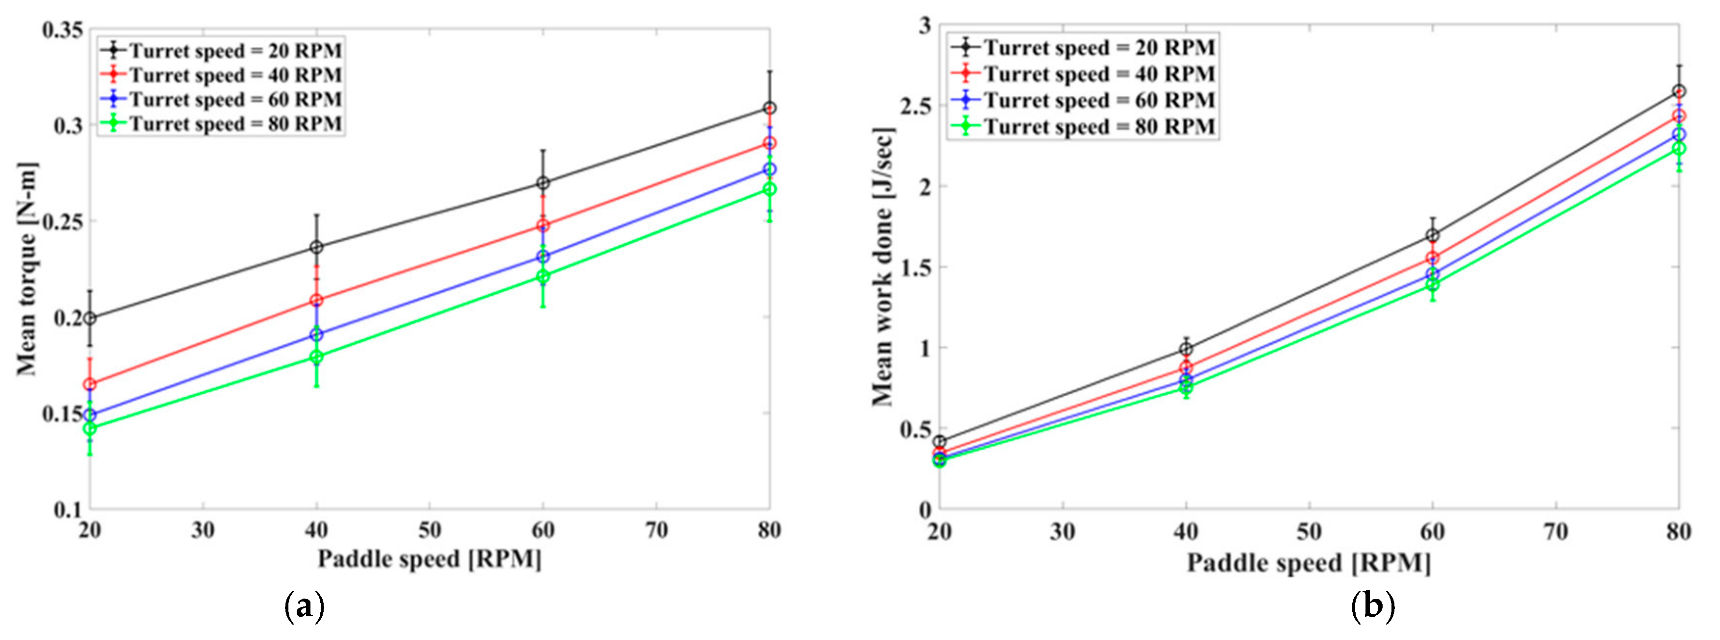
3.4. Torque on the Paddle and Work Done

Another factor that plays an important role in particle attrition in an agitated system is the total work done by the paddles on the particles. The total work done per unit of time can be calculated by multiplying the torque acting on the paddle wheel by the paddle speed [50,51]. The torque acting on the paddle acts along the rotating axis of the paddle and is shown in Figure 11a, and the work done on the particles per unit of time is shown in Figure 11b. Both torque and work done per unit time increase with paddle speed and decrease with turret speed. This behavior can be attributed to the amount of powder in the feed-frame chamber, the torque, and the work done increase as the paddle has to push more mass per rotation. While Figure 11a shows that the turret speed has more effect on the torque, the work done shows a different significance to turret speed (Figure 11b), especially at lower paddle speeds. The work done increases as the paddle speed increases, and an increase in turret speed reduces torque because more particles can move out of the chamber, resulting in less overall powder mass in the feed-frame chamber. These observations suggest that during the tablet manufacturing process, appropriate reduction of paddle speed can reduce particle attrition.

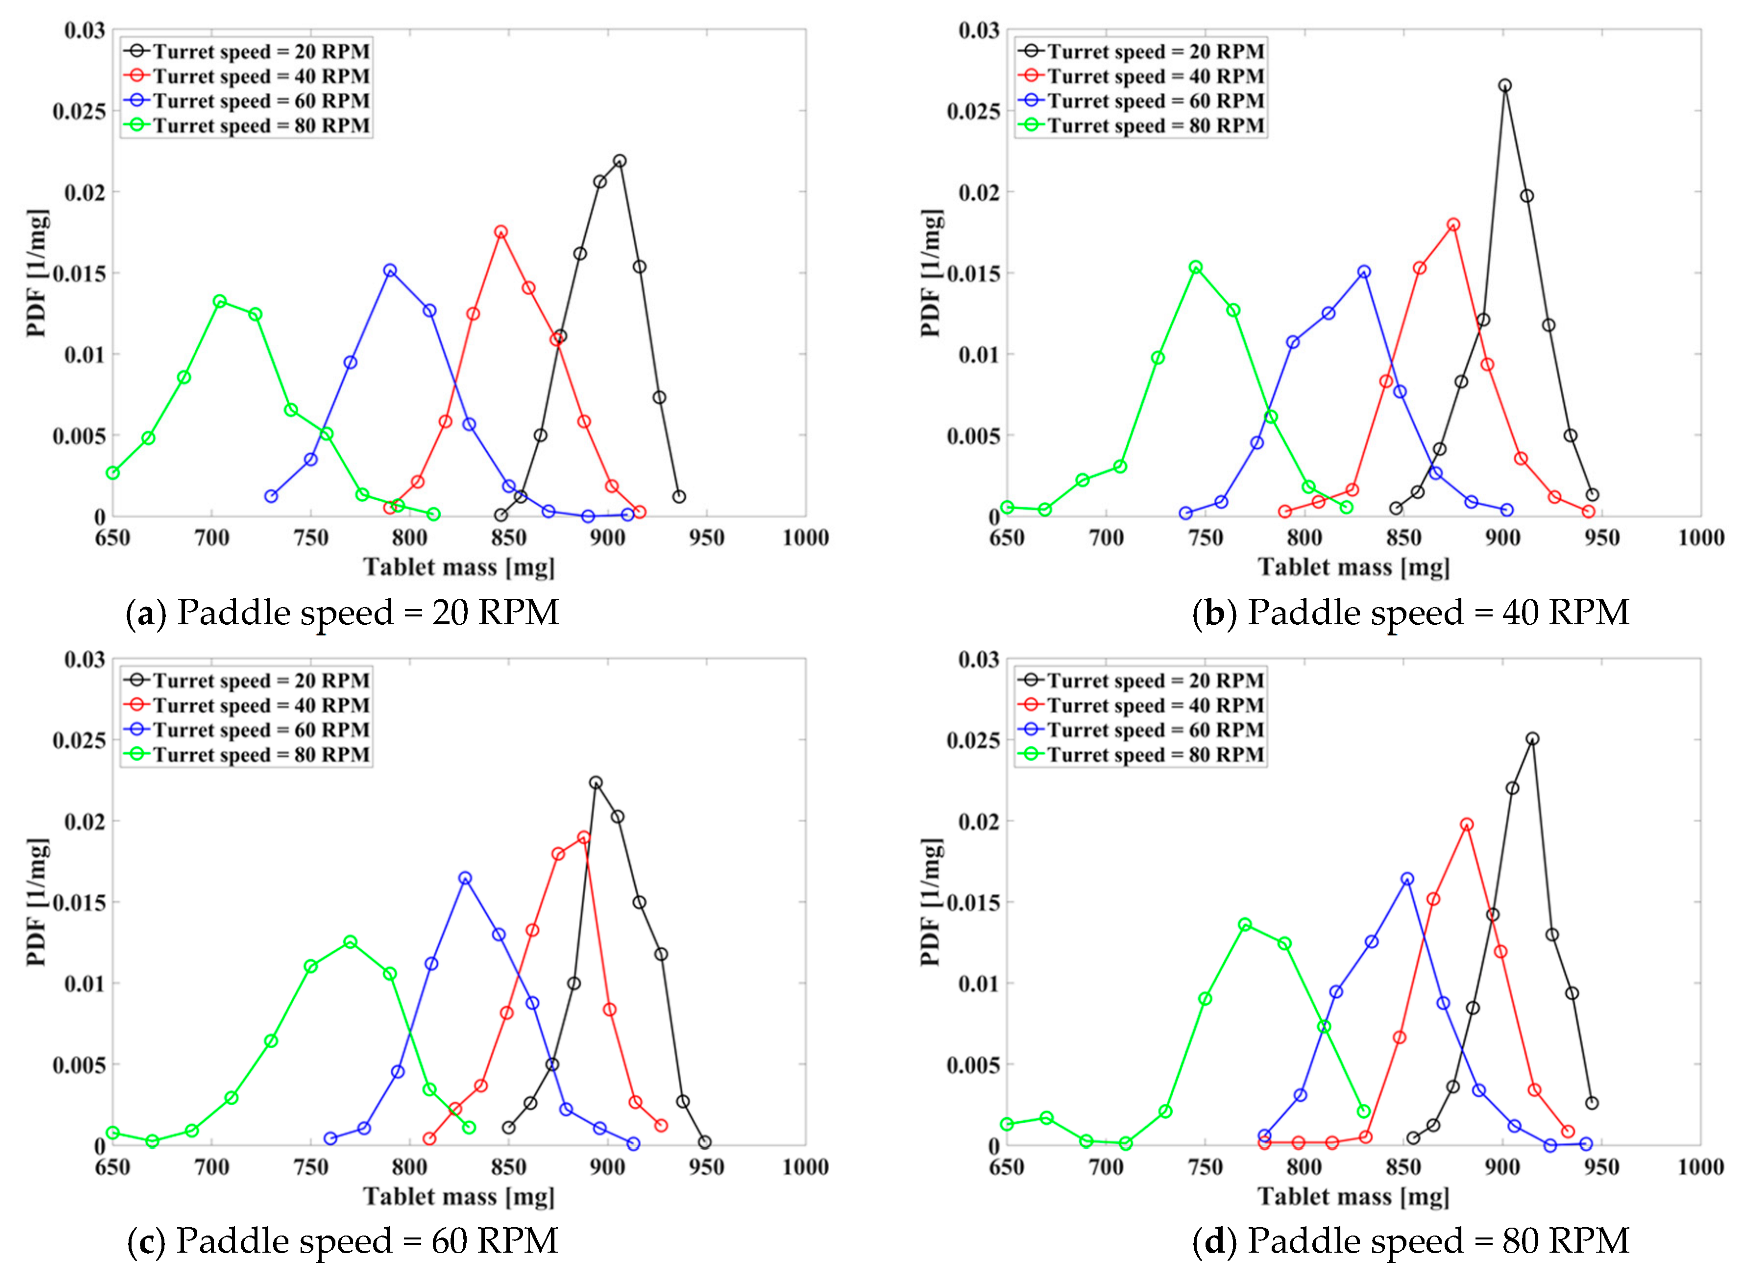
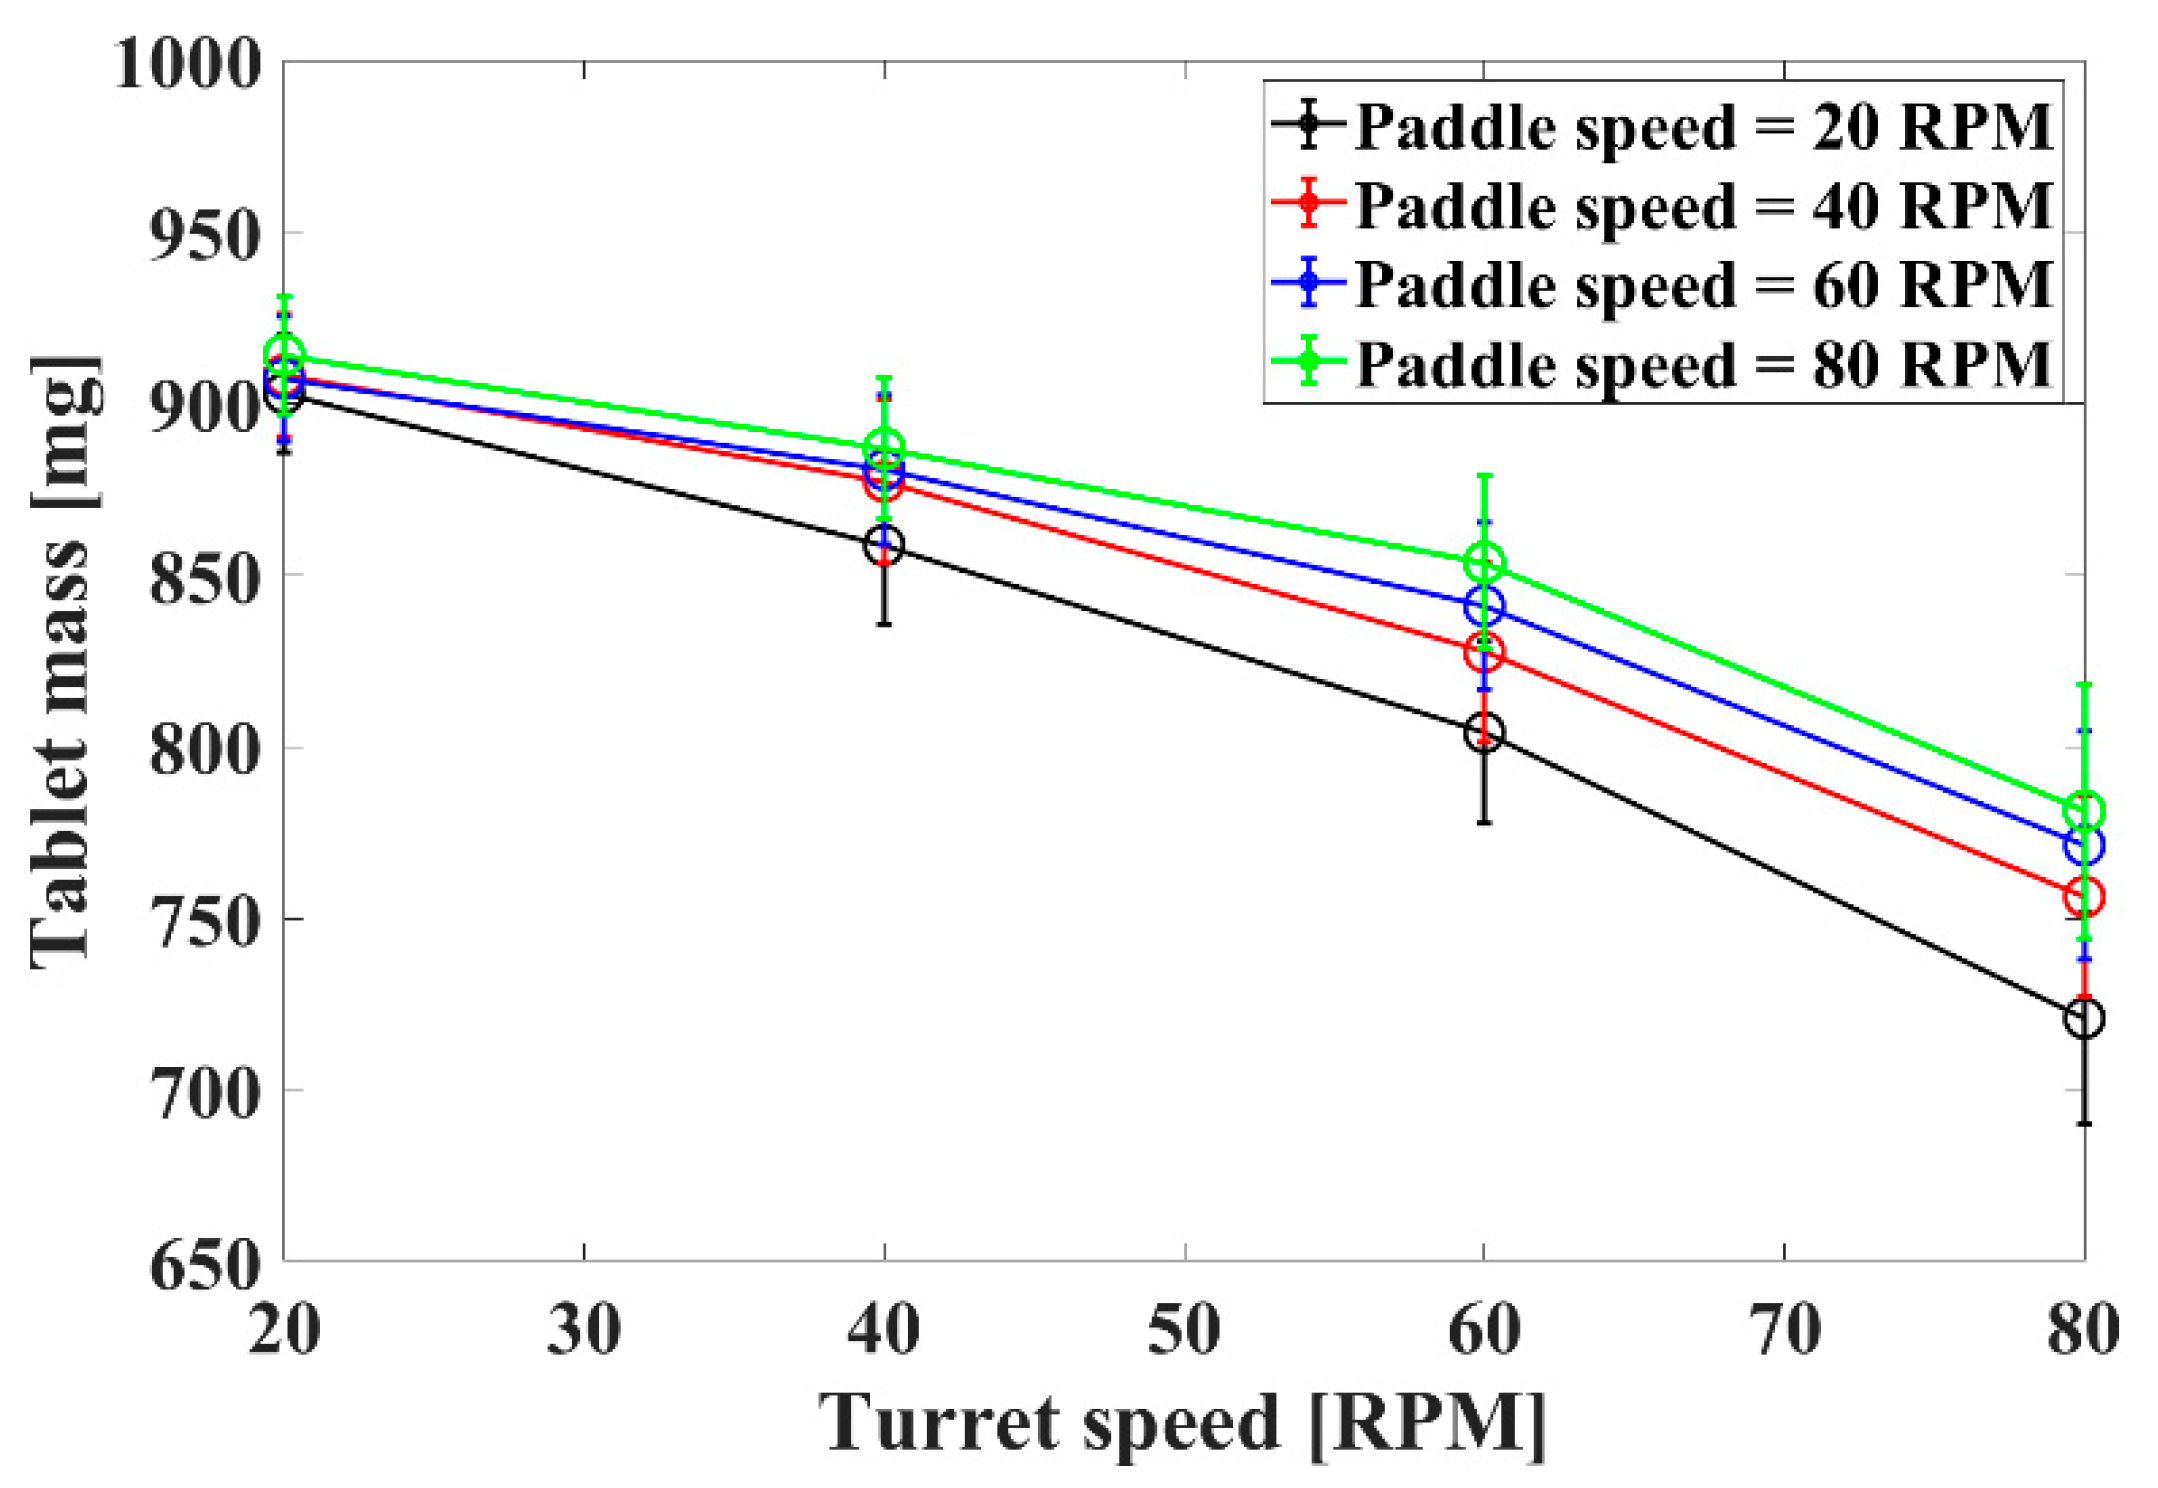
3.5. Tablet Mass and API Content

In tablet manufacturing, tablet thickness, mass, and API content uniformity are critical quality attributes (CQAs). Given that this DEM study focuses primarily on powder flow and die filling, powder compaction is out of scope, and therefore tablet thickness information is unavailable. However, tablet mass and API content uniformity data can be extracted from the DEM simulations and could provide a good qualitative understanding of die filling phenomenon during the tableting process. The tablet mass distributions are plotted to understand the effect of paddle speed and turret speed on tablet mass and process variability (Figure 12a–d). Each sub-plot corresponds to a given paddle speed for four different turret speeds. The tablet mass decreases with increasing turret speed, while the width of the tablet mass distribution increases with increasing turret speed. The high turret speed not only reduces the overall fill time but also increases the variability of the die filling process. Paddle speed does not significantly affect tablet mass distribution at lower turret speeds, but it did affect tablet mass at higher turret speeds. Although not shown here for brevity, increasing paddle speed increases the mass hold-up by bringing more particles into the feed-frame chamber, thus contributing to more uniform die fill mass and reducing the tablet mass variation. Figure 13 shows a plot of mean tablet mass versus turret speed, succinctly summarizing the die filling behavior. Tablet mass decreases with increasing turret speed, and paddle speed begins to affect tablet mass at higher turret speeds.
The powder undergoes a significant amount of shear in a tablet press before it reaches the turret die for tableting. Even before the particles enter the feed-frame chamber from the hopper, they are recirculated because of shear from the rotating paddles. Once the particles reach the feed-frame chamber, they are further sheared by the rotating paddle, causing mixing and size-based segregation due to percolation. Before the particles enter the die, they enter the opening at the narrow seal between the feed-frame chamber and the turret and are further sheared by the paddle wheel from the top and from the turret at the bottom. This can lead to substantial segregation and may affect the uniformity of final tablet content. Therefore, it is vital to understand the overall segregation behavior and how particles of different sizes are spatially distributed in the feed-frame system.
To understand this phenomenon, the API (smallest particle of size 0.55 mm with 5% w/w concentration) spatial distribution surface plots were created once a steady state was reached following the same methodology used for previous parameters. The top-view images of the API spatial distribution are shown in Figure 14a, and the side-view images of the API spatial distributions are shown in Figure 14b. from the top-view images, it can be seen that API spatial distribution is impacted by the paddle speed and the turret speed. As the paddle speed increases, the shear stress increases, and the API distribution within the feed-frame becomes increasingly non-uniform (Figure 14a). The API distribution becomes more uniform as turret speed increases, and this is because the residence time of the particles is reduced; thus, the time for the particles to interact with the paddle is also reduced. Primarily, two types of segregation patterns are observed in the feed-frame. The first is the segregation of particles caused by centrifugal force due to paddle rotation. As the paddle wheel rotates, larger particles experience greater centrifugal force than smaller particles, which causes the larger particles to move outward while the smaller particles accumulate near the hub. The second mode of segregation is gravity-driven percolation segregation, which subjects the smaller particles to vertical gravity from the above particles. Smaller particles percolate to the bottom and accumulate at the feed-frame bottom wall and the paddle blade periphery. The vertical distribution of API spatial distribution cannot be gauged by just looking at the top-view and one has to look at the side-view images. The side-view of the API particle distribution (Figure 14b) shows that particle segregation becomes more uniform as the paddle speed decreases and the turret speed increases. API accumulates near the hub, while in areas away from the paddle hub, API particles are primarily deposited at the bottom of the feed-frame chamber. At high paddle and low turret speeds, particle circulation at the hopper-feeder interface makes the API distribution in this region non-uniform.
Before the particles enter the die for compaction, the particles enter the opening at the seal between the feed-frame and the turret. The resulting API distribution in this region impacts the resulting table content uniformity. Figure 15 shows the top view of the API concentration distribution in the seal opening at different paddle and turret speeds. Gravity-driven percolation segregation, caused by shear from both the paddle and the turret, causes API particles to settle at the bottom of the seal. The API particles at the bottom are sheared by the rotating turret, so at any paddle speed and turret speed, the API particle concentration will accumulate in the direction of turret motion. The accumulation of API in the seal opening depends on a combination of factors. A higher turret speed will not only provide a higher shear but also have higher mass throughput, so there is a balance between two counter effects that needs to optimized. While a higher paddle speed will always create a more non-uniform API distribution upstream and in the seal opening. The seal opening is usually larger than the die opening, and the rotating turret is set such that the center of the die stays in the central portion of the seal for unobstructed material transfer. However, this causes deposition of API particles at the side walls, especially for lower turret speeds conditions, because of the smaller mass throughput leading to higher residence time and more segregation. It is an important observation because any leak in the seal due to overuse or improper fitting can lead to the loss of smaller particles, in this case, the API, and cause tablet content uniformity issues.
Although, the spatial distribution of API concentration is essential to get a more granular understanding of the feed-frame powder flow behavior. At the end of the process, the tablet characteristic is of utmost importance is the tablet’s API content uniformity. To understand this phenomenon, the tablet API concentration is evaluated until the simulation reaches a steady state. The tablet API concentration evolution is shown in Figure 16a–d, where each subplot corresponds to a given paddle speed and four turret speeds. A horizontal dotted line shows the target tablet API concentration of 5%. From these plots, it can be observed that the initial API concentration increases with paddle speed, especially for lower turret speeds, and takes longer to reach a desired steady state of 5% API concentration. The API concentration stabilizes faster as turret speed is increased due to higher mass throughput. The impact of residence time at the different operating conditions is apparent in these plots. The higher the residence time longer it takes the API concentration to stabilize. However, the API concentration eventually stabilizes for all operating conditions irrespective of upstream API concentration distribution. It may be happening due to scaled-up particle sizes considered in this DEM study due to computational limitations. Smaller particles could provide a better resolution into tablet mass and tablet mass variability.

4. Conclusions

The DEM simulations were used to study the movement of the API and excipient particles in the feed-frame of a kg-pharma RoTab tablet press. Based on the simulation results, the effects of paddle speed and turret speed on residence time, particle traveled distance, particle shear work, paddle torque, tablet mass, and API content were studied. The effects of changes in these parameters on particle over lubrication, attrition, and segregation are analyzed. Furthermore, the continuous top view and side view surface maps of the feed-frame provide a comprehensive particle-level understanding of the powder flow behavior.
The main findings from this study have been summarized as follows:
  • Increasing the turret speed and the paddle speed reduces the mean residence time, with turret speed having a more significant effect on residence time than paddle speed. Therefore, changing the turret speed is more effective at controlling over lubrication.
  • Increasing the paddle speed increases the particle traveled distance and thus increases particle attrition. Turret speed has a small effect on the particle traveled distance.
  • An increase in turret speed reduces paddle torque and particle shear work slightly; an increase in paddle speed significantly increases paddle torque and particle shear work. In tablet manufacturing, proper reduction of the paddle speed can reduce the particle shear work in the feed-frame chamber, thereby reducing the particle attrition.
  • An increase in paddle speed has less effect on tablet mass than turret speed. An increase in turret speed reduces tablet mass but also increases its variability. Increasing paddle speed only increases tablet mass at low turret speeds.
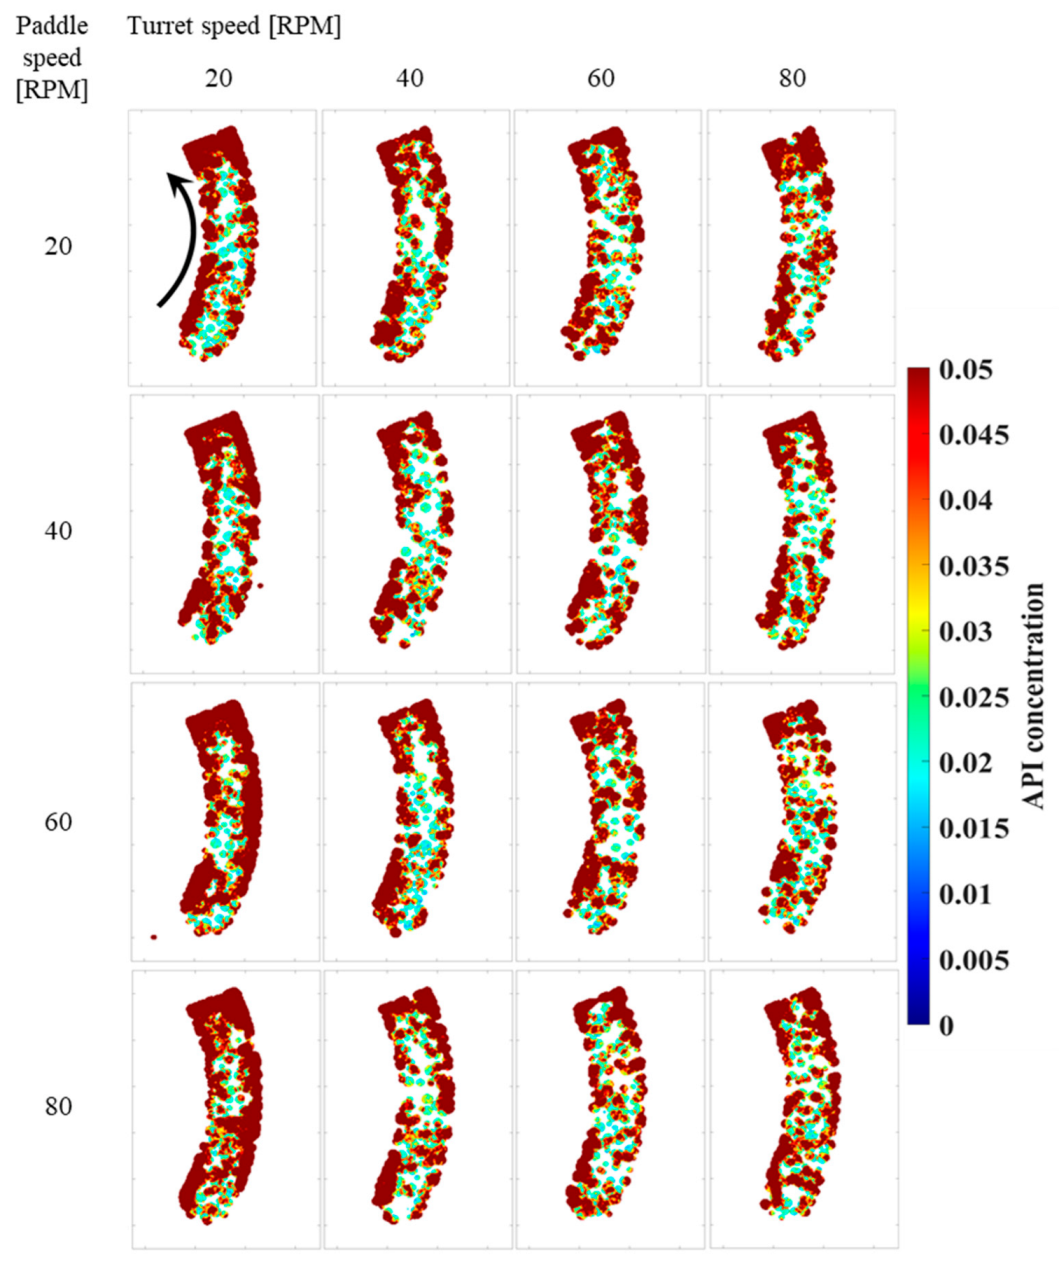
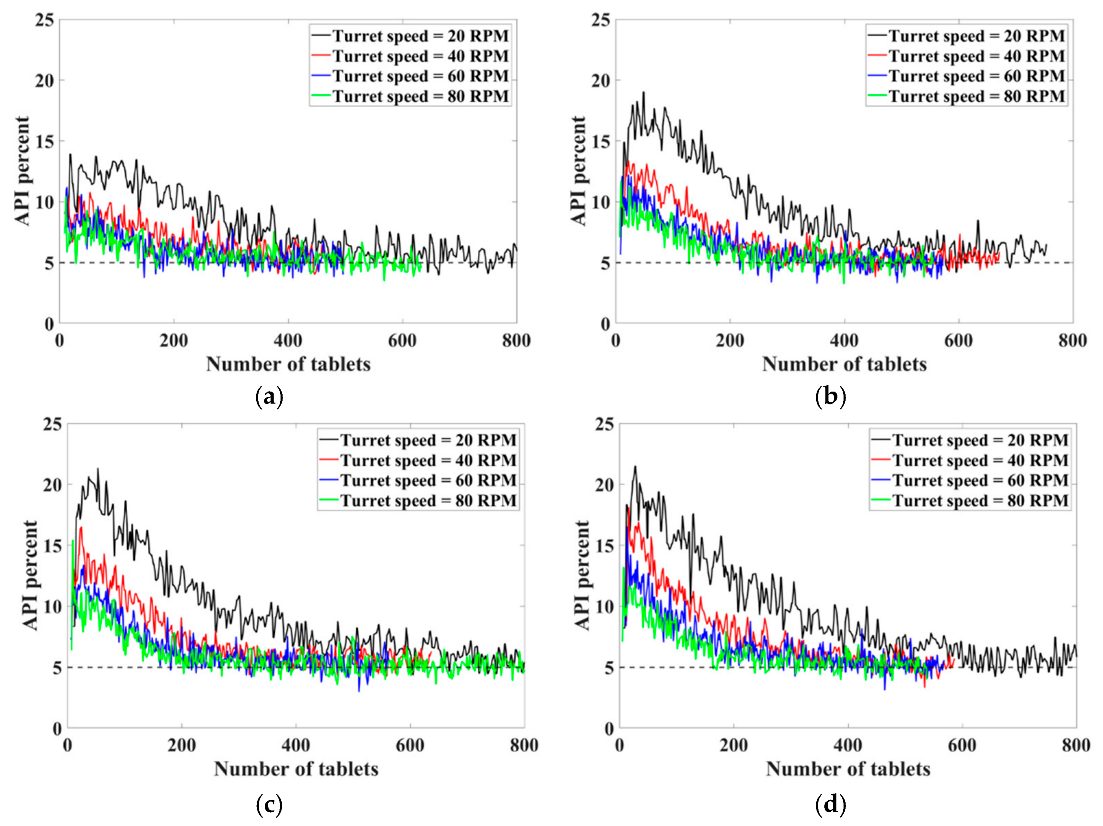
  • At the beginning of tablet manufacture, increasing turret speed or decreasing paddle speed significantly increases the tablet’s API particles (the smallest particles) content and results in particle separation. The impact of paddle speed and turret speed needs to be further investigated with smaller particles to achieve better resolution.
Future work should study the effect of paddle design, material properties, and particle size on powder flow behavior and final tablet API content uniformity. Future studies should also evaluate which simulation results out of residence time, distance traveled, and shear work is most suitable for predicting overlubrication and attrition in the feed frame.

Author Contributions

Conceptualization, Z.L., R.K. and H.R.G.; Data curation, Z.L.; Formal analysis, Z.L. and R.K.; Funding acquisition, R.K., H.R.G. and R.A.C.; Investigation, R.K.; Methodology, Z.L. and R.K.; Project administration, R.K., H.R.G. and R.A.C.; Resources, H.R.G. and R.A.C.; Software, Z.L. and R.K.; Supervision, R.K.; Validation, Z.L.; Visualization, R.K.; Writing—original draft, Z.L. and R.K.; Writing—review and editing, Z.L., R.K., H.R.G. and R.A.C. All authors have read and agreed to the published version of the manuscript.

Funding

This research project was sponsored by Alkermes Inc.

Data Availability Statement

Not applicable.

Acknowledgments

The authors would like to thank DCS Computing GmbH for providing software support for this work and especially Riccardo Togni for helping us set up a test simulation.

Conflicts of Interest

The authors declare no conflict of interest.

Nomenclature

AijParticle contact area
cCohesion energy density
dpParticle diameter
EYoung’s modulus
EeqEquivalent elastic modulus
fppParticle-particle static friction
fpwParticle-wall static friction
FnNormal contact force
FtTangential contact force
F n Additional normal force for the SJKR2 model
GShear modulus
GeqEquivalent shear modulus
knNormal stiffness
ktTangential stiffness
krRolling stiffness
lt,iTangential displacement at the contact
miMass of particle i
mjMass of particle j
meqEquivalent mass
NTotal number of contacts of the particle
rfppParticle-particle rolling friction
rfpwParticle-wall rolling friction
RiParticle radius of particle i
RijEquivalent particle radius
RjParticle radius of particle j
ReqEquivalent redius
sNumber of contacts at each time step
T i j r Additional torque modeled by EPSD2 model
T i j r , k Torque component modeled as a mechanical spring
WtShear work of a particle
γnNormal dissipation constant
γtTangential dissipation constant
𝜌Particle density
νPoisson’s ratio
ɛCoefficient of restitution
δ n Maximum constant overlap
δ ˙ n Relative velocity in the normal direction of the contact
δ t Relative tangential displacement
δ ˙ t Relative velocity in the tangential direction of the contact
Δ θ r , i j Incremental relative rotation between the two particles

References

  1. Macmillan, R.H. The Mechanics of Fluid-Particle Systems with Special Reference to Agriculture: Theory and Worked Examples; UoM Custom Book Centre: Manchester, UK, 2010. [Google Scholar]
  2. Dühlmeyer, K.P.; Özcoban, H.; Leopold, C.S. A novel method for determination of the filling level in the feed-frame of a rotary tablet press. Drug Dev. Ind. Pharm. 2018, 44, 1744–1751. [Google Scholar] [CrossRef] [PubMed]
  3. Dülle, M.; Özcoban, H.; Leopold, C.S. Analysis of the powder behavior and the residence time distribution within a manufacture scale rotary tablet press. Eur. J. Pharm. Sci. 2018, 125, 205–214. [Google Scholar] [CrossRef] [PubMed]
  4. Dühlmeyer, K.P.; Özcoban, H.; Leopold, C.S. In line monitoring of the powder filling level within a rotary tablet press feed-frame. Powder Technol. 2019, 351, 134–143. [Google Scholar] [CrossRef]
  5. El Hebieshy, J.F. Die filling of aerated powders. Doctoral dissertation, University of Surrey, Guildford, Surrey, UK, 2019. [Google Scholar] [CrossRef]
  6. Sun, Z.; Li, Z.; Espinoza, D.N.; Balhoff, M.T. Fluid-driven fractures in granular media: Insights from numerical investigations. Phys. Rev. E 2020, 101, 042903. [Google Scholar] [CrossRef] [PubMed]
  7. Li, Z.; Espinoza, D.N.; Balhoff, M.T. Fluid-driven fracture mechanisms in granular media: Insights from grain-scale numerical modeling. Granul. Matter 2021, 23, 1–18. [Google Scholar] [CrossRef]
  8. Li, Z.; Song, H.; Espinoza, D.N.; Balhoff, M.T. Experimental Study of the Effects of Non-Newtonian Polymers on Fracture Opening and Leakoff Patterns. Rock Mech. Rock Eng. 2022, 55, 7021–7034. [Google Scholar] [CrossRef]
  9. Grymonpré, W.; Vanhoorne, V.; Van Snick, B.; Prudilova, B.B.; Detobel, F.; Remon, J.P.; De Beer, T.; Vervaet, C. Optimizing feed frame design and tableting process parameters to increase die-filling uniformity on a high-speed rotary tablet press. Int. J. Pharm. 2018, 548, 54–61. [Google Scholar] [CrossRef]
  10. Ilium, L. Chitosan and its use as a pharmaceutical excipient. Pharm. Res. 1998, 15, 1326–1331. [Google Scholar] [CrossRef]
  11. Varma, K. Excipients used in the Formulation of Tablets. Research and Reviews. J. Chem. 2016, 5, 143–154. Available online: https://www.test.tjori.com/download/1c198c_excipients-used-in-the-formulation-of-tablets (accessed on 25 May 2022).
  12. Hildebrandt, C.; Gopireddy, S.R.; Scherließ, R.; Urbanetz, N. Numerical analysis of the die filling process within a pharmaceutical tableting machine. Chem. Ing. Tech. 2018, 90, 483–492. [Google Scholar] [CrossRef]
  13. The tableting cycle. 2015. Available online: https://www.youtube.com/watch?app=desktop&v=4xggZRckfTE&t=65s (accessed on 25 May 2022).
  14. Hildebrandt, C.; Gopireddy, S.R.; Scherließ, R.; Urbanetz, N.A. Assessment of material and process attributes’ influence on tablet quality using a QbD and DEM combined approach. Powder Technol. 2019, 345, 390–404. [Google Scholar] [CrossRef]
  15. Gopireddy, S.R.; Hildebrandt, C.; Urbanetz, N.A. Numerical simulation of powder flow in a pharmaceutical tablet press lab-scale gravity feeder. Powder Technol. 2016, 302, 309–327. [Google Scholar] [CrossRef]
  16. Ketterhagen, W.R. Simulation of powder flow in a lab-scale tablet press feed-frame: Effects of design and operating parameters on measures of tablet quality. Powder Technol. 2015, 275, 361–374. [Google Scholar] [CrossRef]
  17. Jarosz, P.J.; Parrott, E.L. Effect of lubricants on tensile strengths of tablets. Drug Dev. Ind. Pharm. 1984, 10, 259–273. [Google Scholar] [CrossRef]
  18. Tang, X.; Zakhvatayeva, A.; Zhang, L.; Wu, Z.F.; Sun, P.; Wu, C.Y. Flow behaviour of pharmaceutical powders during rotary die filling with a paddle feeder. Int. J. Pharm. 2020, 585, 119547. [Google Scholar] [CrossRef]
  19. Hildebrandt, C.; Gopireddy, S.R.; Scherließ, R.; Urbanetz, N.A. Simulation of particle size segregation in a pharmaceutical tablet press lab-scale gravity feeder. Adv. Powder Technol. 2018, 29, 765–780. [Google Scholar] [CrossRef]
  20. Dülle, M.; Özcoban, H.; Leopold, C.S. Investigations on the residence time distribution of a three-chamber feed-frame with special focus on its geometric and parametric setups. Powder Technol. 2018, 331, 276–285. [Google Scholar] [CrossRef]
  21. Dülle, M.; Özcoban, H.; Leopold, C.S. The effect of different feed-frame components on the powder behavior and the residence time distribution with regard to the continuous manufacturing of tablets. Int. J. Pharm. 2019, 555, 220–227. [Google Scholar] [CrossRef]
  22. Hildebrandt, C.; Gopireddy, S.R.; Scherließ, R.; Urbanetz, N.A. A DEM approach to assess the influence of the paddle wheel shape on force feeding during pharmaceutical tableting. Adv. Powder Technol. 2020, 31, 755–769. [Google Scholar] [CrossRef]
  23. Mendez, R.; Velazquez, C.; Muzzio, F.J. Effect of feed-frame design and operating parameters on powder attrition, particle breakage, and powder properties. Powder Technol. 2012, 229, 253–260. [Google Scholar] [CrossRef]
  24. Li, Z.; Yang, H.; Sun, Z.; Espinoza, D.N.; Balhoff, M.T. A Probability-Based Pore Network Model of Particle Jamming in Porous Media. Transp. Porous Media 2021, 139, 419–445. [Google Scholar] [CrossRef]
  25. Li, Z.; Sun, Z.; Espinoza, D.N.; Matthew, T.B. Grain-Scale Modeling of Polymer-driven Fracture Initiation and Wellbore Injectivity. In Proceedings of the SPE Improved Oil Recovery Conference, Virtual, 31 August–4 September 2020. [Google Scholar] [CrossRef]
  26. Hildebrandt, C.; Gopireddy, S.R.; Scherließ, R.; Urbanetz, N.A. Investigation of powder flow within a pharmaceutical tablet press force feeder–A DEM approach. Powder Technol. 2019, 345, 616–632. [Google Scholar] [CrossRef]
  27. Li, Z.; Sun, Z.; Balhoff, M.T.; Espinoza, D.N. Coupled CFD-DEM modeling of immiscible fluid injection into granular media. In Proceedings of the 54th US Rock Mechanics/Geomechanics Symposium, Virtual, 28 June–1 July 2020; Available online: https://onepetro.org/ARMAUSRMS/proceedings-abstract/ARMA20/All-ARMA20/ARMA-2020-1295/447489 (accessed on 25 May 2022).
  28. Li, Z.; Sun, Z.; Balhoff, M.T.; Espinoza, D.N. Impact of Suspended Solid Particles on Initiation of Fluid-Driven Fractures in Granular Media. In Proceedings of the 55th US Rock Mechanics/Geomechanics Symposium, Virtual, 18–25 June 2021; Available online: https://onepetro.org/ARMAUSRMS/proceedings-abstract/ARMA21/All-ARMA21/ARMA-2021-1770/468130 (accessed on 25 May 2022).
  29. Li, Z.; Espinoza, D.N.; Balhoff, M.T. Simulation of Polymer Injection in Granular Media: Implications of Fluid-Driven Fractures, Water Quality, and Undissolved Polymers on Polymer Injectivity. SPE J. 2022, SPE-200412-PA, 1–12. [Google Scholar] [CrossRef]
  30. Jia, C.; Huang, Z.; Sepehrnoori, K.; Yao, J. Modification of two-scale continuum model and numerical studies for carbonate matrix acidizing. J. Pet. Sci. Eng. 2021, 197, 107972. [Google Scholar] [CrossRef]
  31. Jia, C.; Sepehrnoori, K.; Huang, Z.; Yao, J. Modeling and analysis of carbonate matrix acidizing using a new two-scale continuum model. SPE J. 2021, 26, 2570–2599. [Google Scholar] [CrossRef]
  32. Zhang, X.; Jia, C.; Yao, J.; Huang, Z.; Gong, L.; Yang, W.; Yan, X.; Li, Y. An evaluation framework for production performance of high-temperature fractured and karstified geothermal reservoirs: Production mechanism, sensitivity study, and key parameters ranking. Gondwana Res. 2022, in press. [Google Scholar] [CrossRef]
  33. Siegmann, E.; Forgber, T.; Toson, P.; Martinetz, M.C.; Kureck, H.; Brinz, T.; Khinast, J. Powder flow and mixing in different tablet press feed-frames. Adv. Powder Technol. 2020, 31, 770–781. [Google Scholar] [CrossRef]
  34. Cundall, P.A.; Strack, O.D. A discrete numerical model for granular assemblies. Geotechnique 1979, 29, 47–65. [Google Scholar] [CrossRef]
  35. Hildebrandt, C.; Gopireddy, S.R.; Scherließ, R.; Urbanetz, N.A. Powder flow within a pharmaceutical tablet press–a DEM analysis. In Proceedings of the PARTICLES 2017: V International Conference on Particle-based Methods—Fundamentals and Applications, Hannover, Germany, 26–28 September 2017; pp. 237–248. Available online: http://hdl.handle.net/2117/187123 (accessed on 25 May 2022).
  36. Ramírez-Aragón, C.; Alba-Elías, F.; González-Marcos, A.; Ordieres-Meré, J. Segregation in the tank of a rotary tablet press machine using experimental and discrete element methods. Powder Technol. 2018, 328, 452–469. [Google Scholar] [CrossRef]
  37. Sierra-Vega, N.O.; Romañach, R.J.; Méndez, R. Feed-frame: The last processing step before the tablet compaction in pharmaceutical manufacturing. Int. J. Pharm. 2019, 572, 118728. [Google Scholar] [CrossRef]
  38. Siegmann, E.; Enzinger, S.; Toson, P.; Doshi, P.; Khinast, J.; Jajcevic, D. Massively speeding up DEM simulations of continuous processes using a DEM extrapolation. Powder Technol. 2021, 390, 442–455. [Google Scholar] [CrossRef]
  39. DCS Computing Website. 2021. Available online: https://www.aspherix-dem.com/ (accessed on 25 May 2022).
  40. Stukowski, A. Visualization and analysis of atomistic simulation data with OVITO—The Open Visualization Tool. Model. Simul. Mater. Sci. Eng. 2010, 18, 015012. [Google Scholar] [CrossRef]
  41. MATLAB, R2019b; The MathWorks Inc.: Natick, MA, USA, 2019. Available online: https://www.mathworks.com/(accessed on 25 May 2022).
  42. Kloss, C.; Goniva, C.; Hager, A.; Amberger, S.; Pirker, S. Models, algorithms and validation for opensource DEM and CFD–DEM. Prog. Comput. Fluid Dyn. Int. J. 2012, 12, 140–152. [Google Scholar] [CrossRef]
  43. Mindlin, R.D.; Deresiewicz, H. Elastic spheres in contact under varying oblique forces. J. Appl. Mech. 1953, 20, 327–344. [Google Scholar] [CrossRef]
  44. Thornton, C.; Yin, K.K. Impact of elastic spheres with and without adhesion. Powder Technol. 1991, 65, 153–166. [Google Scholar] [CrossRef]
  45. Kumar, R.; Ketterhagen, W.; Sarkar, A.; Hancock, B.; Curtis, J.; Wassgren, C. Influence of normal contact force model on simulations of spherocylindrical particles. AIChE J. 2018, 64, 1986–2001. [Google Scholar] [CrossRef]
  46. LIGGGHTS Manual. 2016. Available online: https://www.cfdem.com/media/DEM/docu/Manual.html (accessed on 25 May 2022).
  47. Coetzee, C. Simplified Johnson-Kendall-Roberts (SJKR) contact model. In University of Stellenbosch Report; University of Stellenbosch: Stellenbosch, South Africa, 2020. [Google Scholar]
  48. Iwashita, K.; Oda, M. Rolling resistance at contacts in simulation of shear band development by DEM. J. Eng. Mech. 1998, 124, 285–292. [Google Scholar] [CrossRef]
  49. Vanarase, A.U.; Osorio, J.G.; Muzzio, F.J. Effects of powder flow properties and shear environment on the performance of continuous mixing of pharmaceutical powders. Powder Technol. 2013, 246, 63–72. [Google Scholar] [CrossRef] [Green Version]
  50. Guo, Y.; Wassgren, C.; Hancock, B.; Ketterhagen, W.; Curtis, J. Predicting breakage of high aspect ratio particles in an agitated bed using the Discrete Element Method. Chem. Eng. Sci. 2017, 158, 314–327. [Google Scholar] [CrossRef]
  51. Kumar, R.; Ketterhagen, W.; Sarkar, A.; Curtis, J.; Wassgren, C. Breakage modeling of needle-shaped particles using the discrete element method. Chem. Eng. Sci. X 2019, 3, 100027. [Google Scholar] [CrossRef]
Figure 1. Particle calibration using angle of repose and mass flow rate experiment: (a) Experimental setup using Erweka GTB Granulate; (b) DEM simulation set up; (c) Mass flow measured through the experiment; (d) Mass flow measured through the DEM simulation.
Processes 11 00119 g001
Figure 2. (a) Schematic of the feed frame system of the kg-pharma RoTab tablet press. Both the paddle and the turret rotate in counterclockwise (CCW) direction. (b) A snapshot from the DEM simulation showing the filled hopper and the feed-frame.
Processes 11 00119 g002
Figure 3. (a) Marked particles in the lower quarter of the hopper at the hopper feeder interface. The paddle speed and turret speed are both set at 20 RPM. (b) The positions of the tracer particles before the simulation starts. (c) The positions of the tracer particles when the simulation time is 60 s. (d) The positions of the tracer particles when the simulation time is 120 s.
Processes 11 00119 g003
Figure 4. (a) Schematic showing the spread of lubricants on particles. (b) Effect of paddle speed and turret speed on the mean residence time of powder particles. (c) The state of the tracer particles when the simulation time is 30 s. Paddle speed = 20 RPM. Turret speed = 20 RPM. (d) The state of the tracer particles when the simulation time is 30 s. Paddle speed = 20 RPM. Turret speed = 80 RPM.
Processes 11 00119 g004
Figure 5. (a) Effect of paddle speed and turret speed on residence time distribution: (a) paddle speed 20 RPM; (b) paddle speed 40 RPM; (c) paddle speed 60 RPM; (d) paddle speed 80 RPM, at four turret speeds of 20 RPM, 40 RPM, 60 RPM, and 80 RPM. Image d also shows snapshots from the DEM simulation showing the recirculation phenomenon and stagnant particles.
Processes 11 00119 g005
Figure 6. Continuous spatial images showing averaged residence time in the feed frame where each column corresponds to a different turret speed and each row corresponds to a different paddle speed: (a) top view plane at 16 different paddle and turret speeds; (b) side view plane at 16 different paddle and turret speeds (left: half of the chamber; right: half of the chamber and the hopper). Blue color indicates smaller residence times, and red color indicates larger residence times.
Processes 11 00119 g006
Figure 7. Effect of paddle speed on normalized distance traveled defined as number of circulation per paddle rotation at different turret speeds; (a) 20 RPM; (b) 80 RPM for four different paddle speeds 20 RPM, 40 RPM, 60 RPM, and 80 RPM.
Processes 11 00119 g007
Figure 8. Continuous spatial plots showing averaged particle distance traveled in the feed frame where each column corresponds to a different turret speed and each row corresponds to a different paddle speed: (a) top view plane at 16 different paddle and turret speeds; (b) side view plane at 16 different paddle and turret speeds (left: half of the chamber; right: half of the chamber and the hopper). Blue color indicates smaller particle traveled distance, and red color indicates larger particle traveled distance.
Processes 11 00119 g008
Figure 9. Image showing the top view and the side view of the spatial distribution of particle distance traveled at a given time instance (30 s) for four different operating conditions (ad) and mean shear work done at different operating conditions (e,f) at a given time instance (30 s). (a) Paddle speed 20 RPM and turret speed 20 RPM; (b) Paddle speed 20 RPM and turret speed 80 RPM; (c) Paddle speed 80 RPM and turret speed 20 RPM; (d) Paddle speed 80 RPM and turret speed 80 RPM; (e) mean shear work varying with turret speed for different paddle speeds; (f) mean shear work varying with paddle speed for different turret speeds.
Processes 11 00119 g009
Figure 10. Continuous spatial plots showing time averaged (over 30 s) particle shear work done in the feed frame where each column corresponds to a different turret speed and each row corresponds to a different paddle speed: (a) top view plane at 16 different paddle and turret speeds; (b) side view plane at 16 different paddle and turret speeds (left: half of the chamber; right: half of the chamber and the hopper). Blue color indicates smaller shear work, and red color indicates larger shear work.
Processes 11 00119 g010
Figure 11. The effect of paddle speed and turret speed on, (a) the torque on the paddle wheel; (b) the work performed by the paddle wheel on the particles per unit of time.
Processes 11 00119 g011
Figure 12. Images showing the effect of paddle speed and turret speed on tablet mass distribution at different paddle and turret speeds: (a) Paddle speed = 20 RPM; (b) Paddle speed = 40 RPM; (c) Paddle speed = 60 RPM; (d) Paddle speed = 80 RPM, at four different turret speeds of 20 RPM, 40 RPM, 60 RPM, and 80 RPM.
Processes 11 00119 g012
Figure 13. Effect of paddle speed and turret speed on mean tablet mass. Tablet mass decreases with increasing turret speed, and paddle speed begins to affect tablet mass at larger turret speeds.
Processes 11 00119 g013
Figure 14. Continuous spatial plots showing the API (the smallest particle) distribution in the feed frame where each column corresponds to a different turret speed and each row corresponds to a different paddle speed: (a) top view plane at 16 different paddle and turret speeds; (b) side view plane at 16 different paddle and turret speeds (left: half of the chamber; right: half of the chamber and the hopper). Blue color indicates smaller API concentration, and red color indicates larger API concentration.
Processes 11 00119 g014
Figure 15. Top view of the API particle concentration distribution in the seal opening at different paddle and turret speeds, where each column corresponds to a different turret speed and each row corresponds to a different paddle speed. The arrow in the upper left corner indicates the direction of rotation of the turret.
Processes 11 00119 g015
Figure 16. The change in API content during tablet manufacture using different paddle and turret speeds. An increase in turret speed and a decrease in paddle speed significantly increase the API content of the tablet. The API content eventually stabilizes at 5%. (a) Paddle speed = 20 RPM; (b) Paddle speed = 40 RPM; (c) Paddle speed = 60 RPM; (d) Paddle speed = 80 RPM.
Processes 11 00119 g016
Table 1. Particle size distribution of powder particles.
Volume FractionParticle Diameter, (mm)
20%1.300
20%1.150
40%1.000
10%0.825
5%0.650
5%0.550
Table 2. Powder material properties and simulation parameters used in the DEM simulations.
Material PropertiesValue
Young’s modulus (E)1 × 10⁷ Pa
Poisson’s ratio (ν)0.3
Cohesion energy density (c)50,000 J/m3
Density (ρ)1400 kg/m3
P-P static friction (fpp)0.2
P-W static friction (fpw)0.4
P-P rolling friction (rfpp)0.1
P-W rolling friction (rfpw)0.1
Simulation time-step5 × 10−6 s
Disclaimer/Publisher’s Note: The statements, opinions and data contained in all publications are solely those of the individual author(s) and contributor(s) and not of MDPI and/or the editor(s). MDPI and/or the editor(s) disclaim responsibility for any injury to people or property resulting from any ideas, methods, instructions or products referred to in the content.

