Article

Numerical Simulation and Process Optimization of Magnesium Alloy Vehicle Dashboard Cross Car Beam (CCB) Based on MAGMA

1
College of Mechanical Engineering, Zhejiang University of Technology, Hangzhou 310014, China
2
WanFeng Meridian Lightweight Technology Co., Ltd., Shaoxing 312000, China
*
Author to whom correspondence should be addressed.
Processes 2023, 11(1), 16; https://doi.org/10.3390/pr11010016
Submission received: 18 November 2022 / Revised: 18 December 2022 / Accepted: 20 December 2022 / Published: 22 December 2022
(This article belongs to the Special Issue Manufacturing and Processing of Alloys)

Abstract

:
At present, the qualified rate of large thin-walled magnesium alloy castings is low. In this study, the effects of mold structure and process parameters were investigated to improve the production qualification rate of castings. The filling process of die castings was simulated by numerical simulation technology to optimize their structure. On the basis of an optimized mold structure, the process parameters of die castings were optimized using a response surface model, and a group of optimal process combinations were obtained: pouring temperature—660 °C; mold preheating temperature—200 °C; injection speed—6.5 m/s. The rationality of the optimized mold structure and process parameters is verified by die-casting experiments. The results show that the optimized mold structure and process parameters can effectively reduce the internal shrinkage cavity casting defects of automotive CCB castings, and effectively improve the production qualification rate of magnesium alloy CCB castings. This research has important guiding significance for the production of large thin-walled magnesium alloy parts.

1. Introduction

Since the turn of the 21st century, the increasing worldwide sales of automobiles has resulted in large-scale mining and use of metal materials [1], which has led to the increasing depletion of traditional metal resources on the Earth’s crust. The issue of how to reduce their resource consumption and environmental pollution has become a primary concern for sustainable human development [2,3]. In order to effectively solve this problem, automotive lightweight technology has become one of the key research directions in the automotive industry [4,5,6,7]. The most effective way to achieve automotive lightweight technology today is to use new lightweight materials to replace traditional metal materials and process the new lightweight materials into automotive parts through advanced processes [8,9]. In order to realize the sustainable development of automobile lightweight technology, in recent years, magnesium alloy has been widely used in the automobile industry for its light weight and excellent mechanical properties [10,11,12]. However, magnesium alloy in the actual die-casting production has several defects, which leads to casting scrap, and its low pass rate makes the progress of the magnesium alloy manufacturing industry difficult [13,14].
In the process of die-casting production, due to the imperfect design of mold structure and process parameters, many casting defects will be generated, among which air entrainment and shrinkage cavity defects are the most common [15,16,17]. Liu et al. [18] carried out a numerical simulation and predicted defects of YM5 magnesium alloy vehicle bearing through Pro/E software and improved the casting quality by optimizing the mold pouring system. Ma et al. [19] simulated the AZ91D automobile automotive cooling system’s pump impeller by ProCAST and predicted the shrinkage cavity and other defects and reduced the casting defects by optimizing the sprue bush structure. Peng et al. [20] used Any Casting to simulate different process parameters of the NZK magnesium alloy wheel to determine the optimal process, and the die-casting experiments showed that the solution can effectively reduce casting defects. However, first, most studies have been confined to theoretical research, with lack of proof and severe limitations. Second, all the magnesium alloy parts that have been studied are small parts, and there is no in-depth study of large-scale thin-walled magnesium alloy parts.
In the magnesium alloy manufacturing industry, the complexity of the mold design for large thin-walled castings has resulted in a lack of experience in this area, so it can only be produced by trial and error. However, due to entrainment and shrinkage, the product scrap rate is high, and the production cost is additionally increased [21]. For this, it is of great industrial value to improve the quality of castings by optimizing the structure and process of the mold before production. It is necessary to further promote the application of magnesium alloy in automotive lightweight technology, and to reduce the casting defects of large thin-walled magnesium alloy castings while improving the qualification rate of production. In this paper, the minimum air entrainment and the minimum shrinkage cavity rate are taken as the optimization objectives, and the die-casting filling simulation of the designed die structure is carried out through the numerical simulation technology to select the optimal casting system scheme. Through the Design-Expert response surface experiment, the pouring temperature, mold preheating temperature, and injection velocity parameters were theoretically analyzed and optimized, and a group of optimal process parameters were obtained. The experimental results show that the optimized mold structure and process parameters can effectively reduce the entrainment shrinkage phenomenon of the castings, in which the air entrainment rate is reduced by 17%, the shrinkage cavity rate is reduced by 7%, and the qualified rate of CCB castings is greatly improved.

2. Materials and Methods

2.1. Materials and Modeling

The material studied in this project is AM60B alloy (Shanxi Regal Advanced Material Co., Ltd.; Yuncheng City, Shanxi Province, China), which belongs to the Al-Mn system of magnesium alloys. It is widely used in the shells of electrical products, thin or shaped brackets, and other parts because of its high strength and good corrosion resistance. Cross Car Beam (CCB) is used as a crossbeam bracket part for automotive dashboards, and AM60B alloy fully meets the performance requirements of CCB. The chemical composition of the selected AM60B magnesium alloy is shown in Table 1.
The magnesium alloy CCB studied in this project has high requirements for its machining accuracy and surface quality because of its wall thickness and complex structure. Using UG12.0 software (MAGMA 5.4) to design the three-dimensional model of CCB parts, two options were designed for its pouring system, as shown in Figure 1.
Figure 1 shows that the biggest difference between the casting systems of the two schemes is the layout of the runner. Considering that the arrangement of the runner has a great influence on the flow of molten metal, it is necessary to select a better scheme by simulating the die-casting filling process of these two casting systems through numerical simulation technology.

2.2. Response Surface Test Design

In die-casting production, the process parameters have an extremely important influence on the filling and solidification of magnesium liquid [22,23,24,25,26,27]. Factors such as pouring temperature, mold preheating temperature, and injection speed have a great influence on metal thermoforming. If these process parameters are not designed reasonably, castings are prone to casting defects such as air entrainment and shrinkage cavity.
The MAGMA software (UG12.0 software, MAGMA5.4) calculates the mass exchange of liquid metal in the local area during the solidification of the casting and the resulting feeding process. The shrinkage-related defects can be quantitatively predicted by the feeding model.
In summary, this paper optimizes the pouring temperature, mold preheating temperature, and compression injection speed. Using the volume of rolled air and shrinkage cavity rate as the optimization indexes, the factor-level table of the response surface test was obtained as shown in Table 2.

2.3. Die Casting Experiment

The object of this study was large thin-walled magnesium alloy castings, and an IDRA3200 large die-casting machine was used in the production of die casting. The rough castings produced by die casting were obtained by deburring the castings, and the final castings were obtained by machining. The CCB ca stings before and after the optimization of the process parameters were tested by the X-ray testing machine (SRE MAX 80–150; the minimum resolution is 100 μm) to detect the important parts of the castings, and the mechanical properties of the castings before and after the optimization were tested by the mechanical performance testing machine (AG-IC 100 KN).

3. Results and Discussion

3.1. Simulation Analysis of Die Casting Filling

The process parameters are determined before the simulation. According to the die casting manual and experience, the initial setting is 680 °C for pouring temperature, 180 °C for mold preheating temperature, and 5.5 m/s for press injection speed.

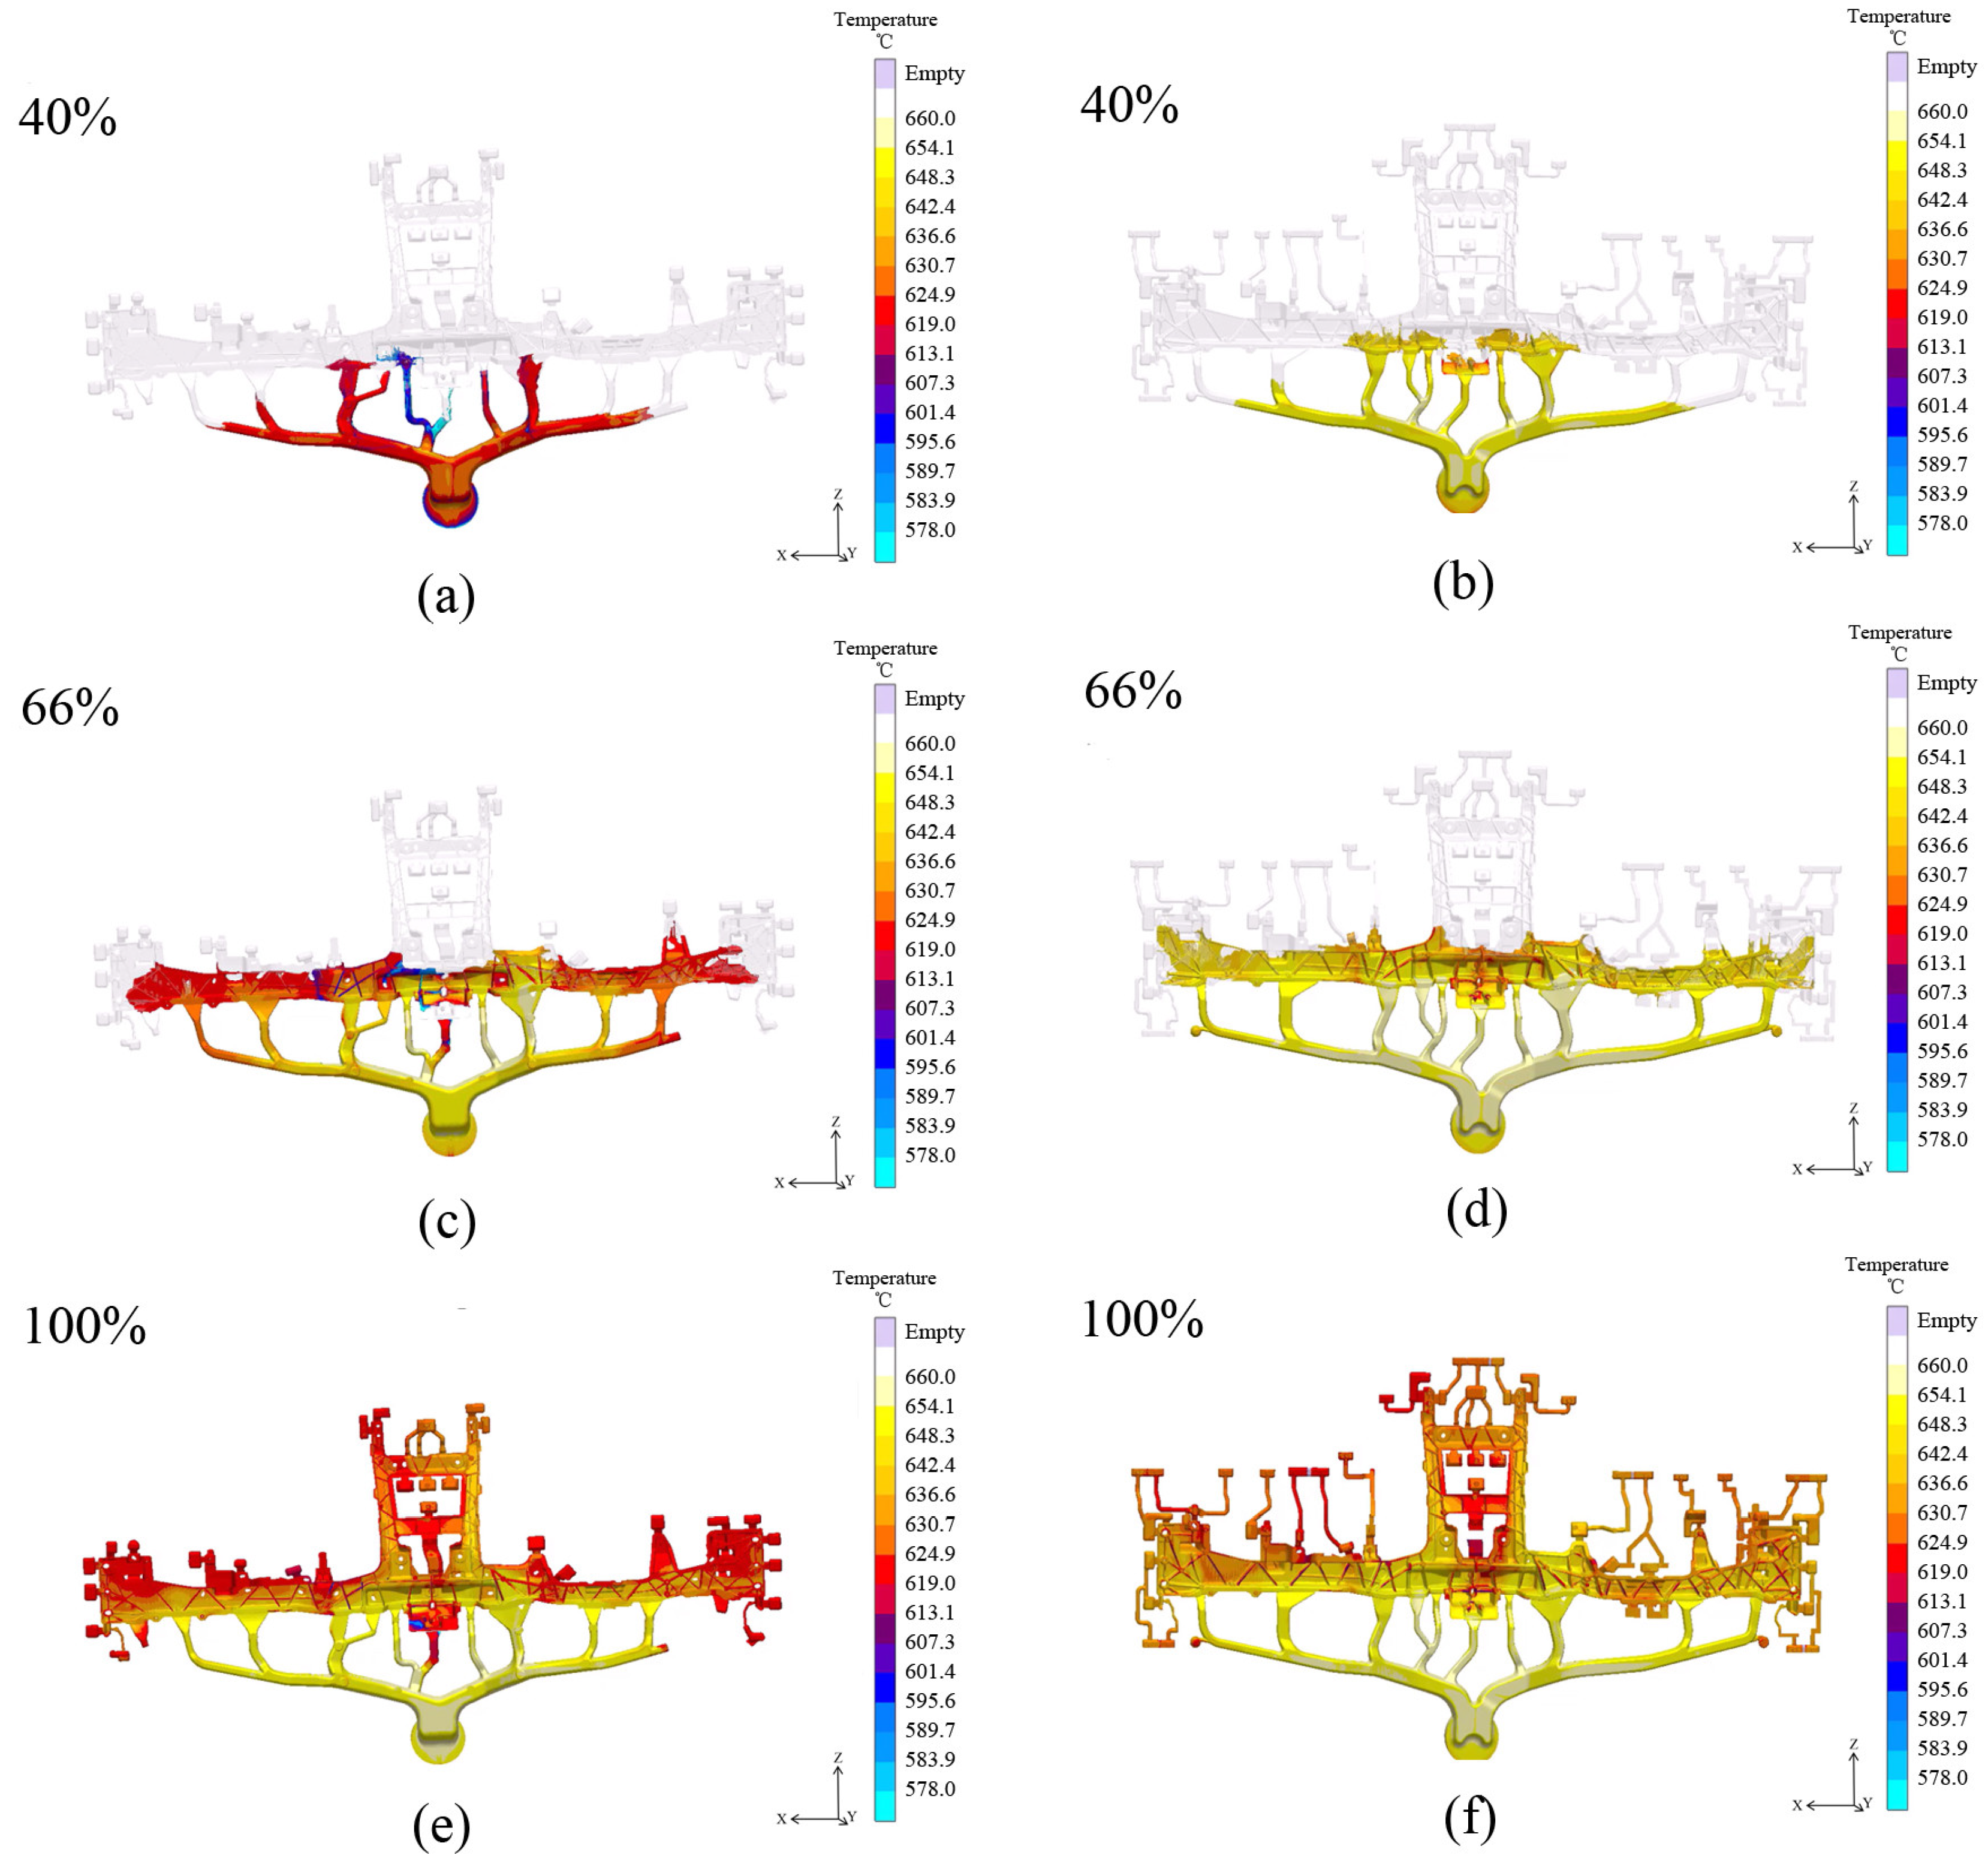
3.1.1. Filling Temperature Simulation

Figure 2 shows the temperature distribution of the simulated filling process of the two schemes. The figure shows that when it reaches 40%, the filling temperature of scheme 1 is only about 620 °C, and in particular, the temperature of one sprue is less than 600 °C, which is a greater difference compared to the set pouring temperature, and it is easy to have cold compartment defects, while scheme 2 does not show a similar phenomenon when filling. When filling up to 66%, the temperature of molten metal in scheme 1 rises slowly, but the previous lower temperature metal liquid has been filled to the main body of the casting, which will appear as a large temperature difference, making the lower temperature area in the process of cooling a large stress difference; it is likely to have serious shrinkage cavity defects. In contrast, scheme 2 keeps filling to the casting body at the set temperature; when the filling is completed, the temperature distribution of scheme 2 is relatively more uniform compared with the two schemes, which is conducive to reducing the generation of casting defects in CCB during the die-casting production process. In summary, the simulation result of filling temperature of scheme 2 is better than that of scheme 1.

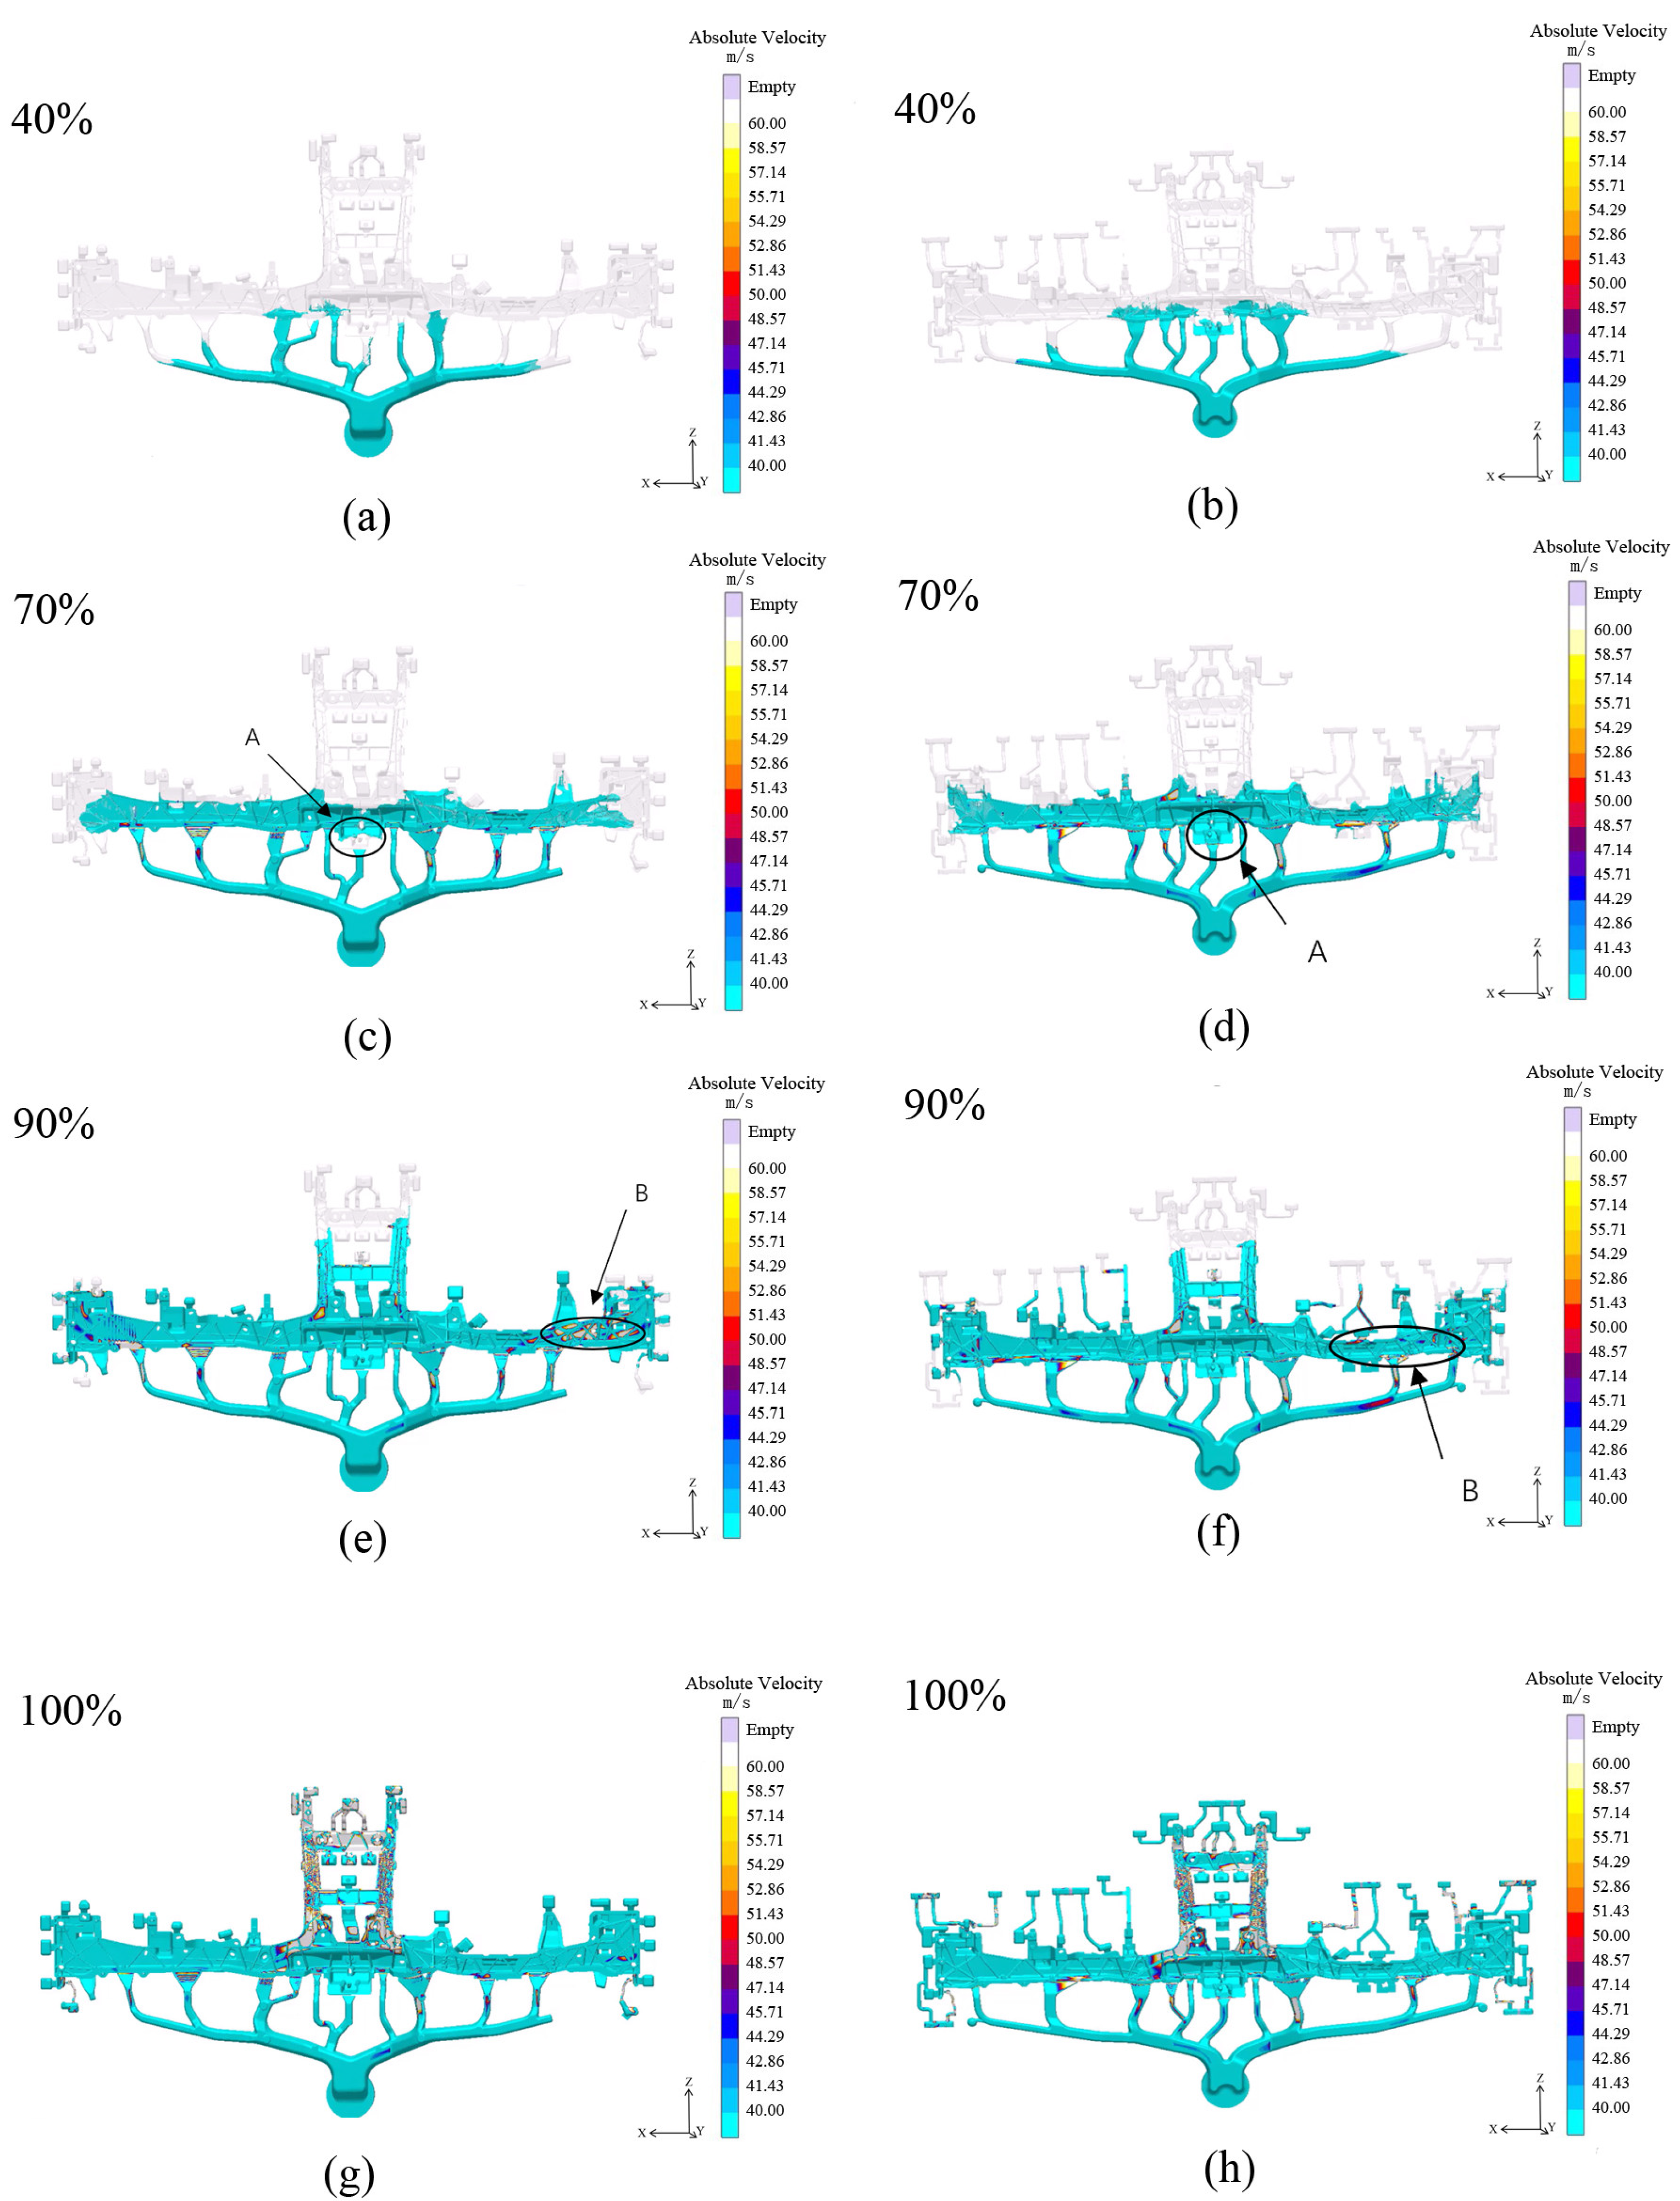
3.1.2. Filling Speed Simulation

Figure 3 shows the simulation results of the filling speed of the two solutions. Figure 3 shows that when the filling reaches 40%, the metal liquid of both solutions starts to flow into the casting with a speed of about 40 m/s, but the metal liquid of the middlemost flow channel of solution 1 is obviously filling into the casting more slowly; when the filling reaches 70%, there is clearly an unfilled phenomenon in the A area of solution 1, which will make the area very prone to air entrapment, while option 2 has no similar phenomenon. When filling up to 90%, there are several small and thin reinforcement bars in the B area of scheme 1, which leads to a liquid flow velocity of more than 60 m/s. The higher velocity difference will also lead to the easy occurrence of air entrapment in this area, while scheme 2 eliminates the problem of excessive liquid velocity in the B area; when filling is completed, the liquid velocity of scheme 2 is more uniform compared with that of scheme 1, and the velocity simulation is better.
To summarize, the pouring system layout of scheme 2 is more reasonable than that of scheme 1. In the simulation process of scheme 2, the magnesium liquid loses less heat during filling, which makes the fluidity of the magnesium liquid better, makes the filling process smoother, and reduces the energy consumption of the magnesium liquid. Therefore, the simulation results of scheme 2 are better than scheme 1.

3.2. Response Surface Test Results and Analysis

Based on scheme 2, 17 sets of experiments were designed with the optimized parameters of pouring temperature, mold preheating temperature, and injection speed, and the optimized indexes of air entrapment rate and shrinkage cavity rate, among which there were five sets of repeatability experiments at the same level to verify the model, and the remaining 12 sets of experiments at different levels. The experimental results are shown in Table 3.

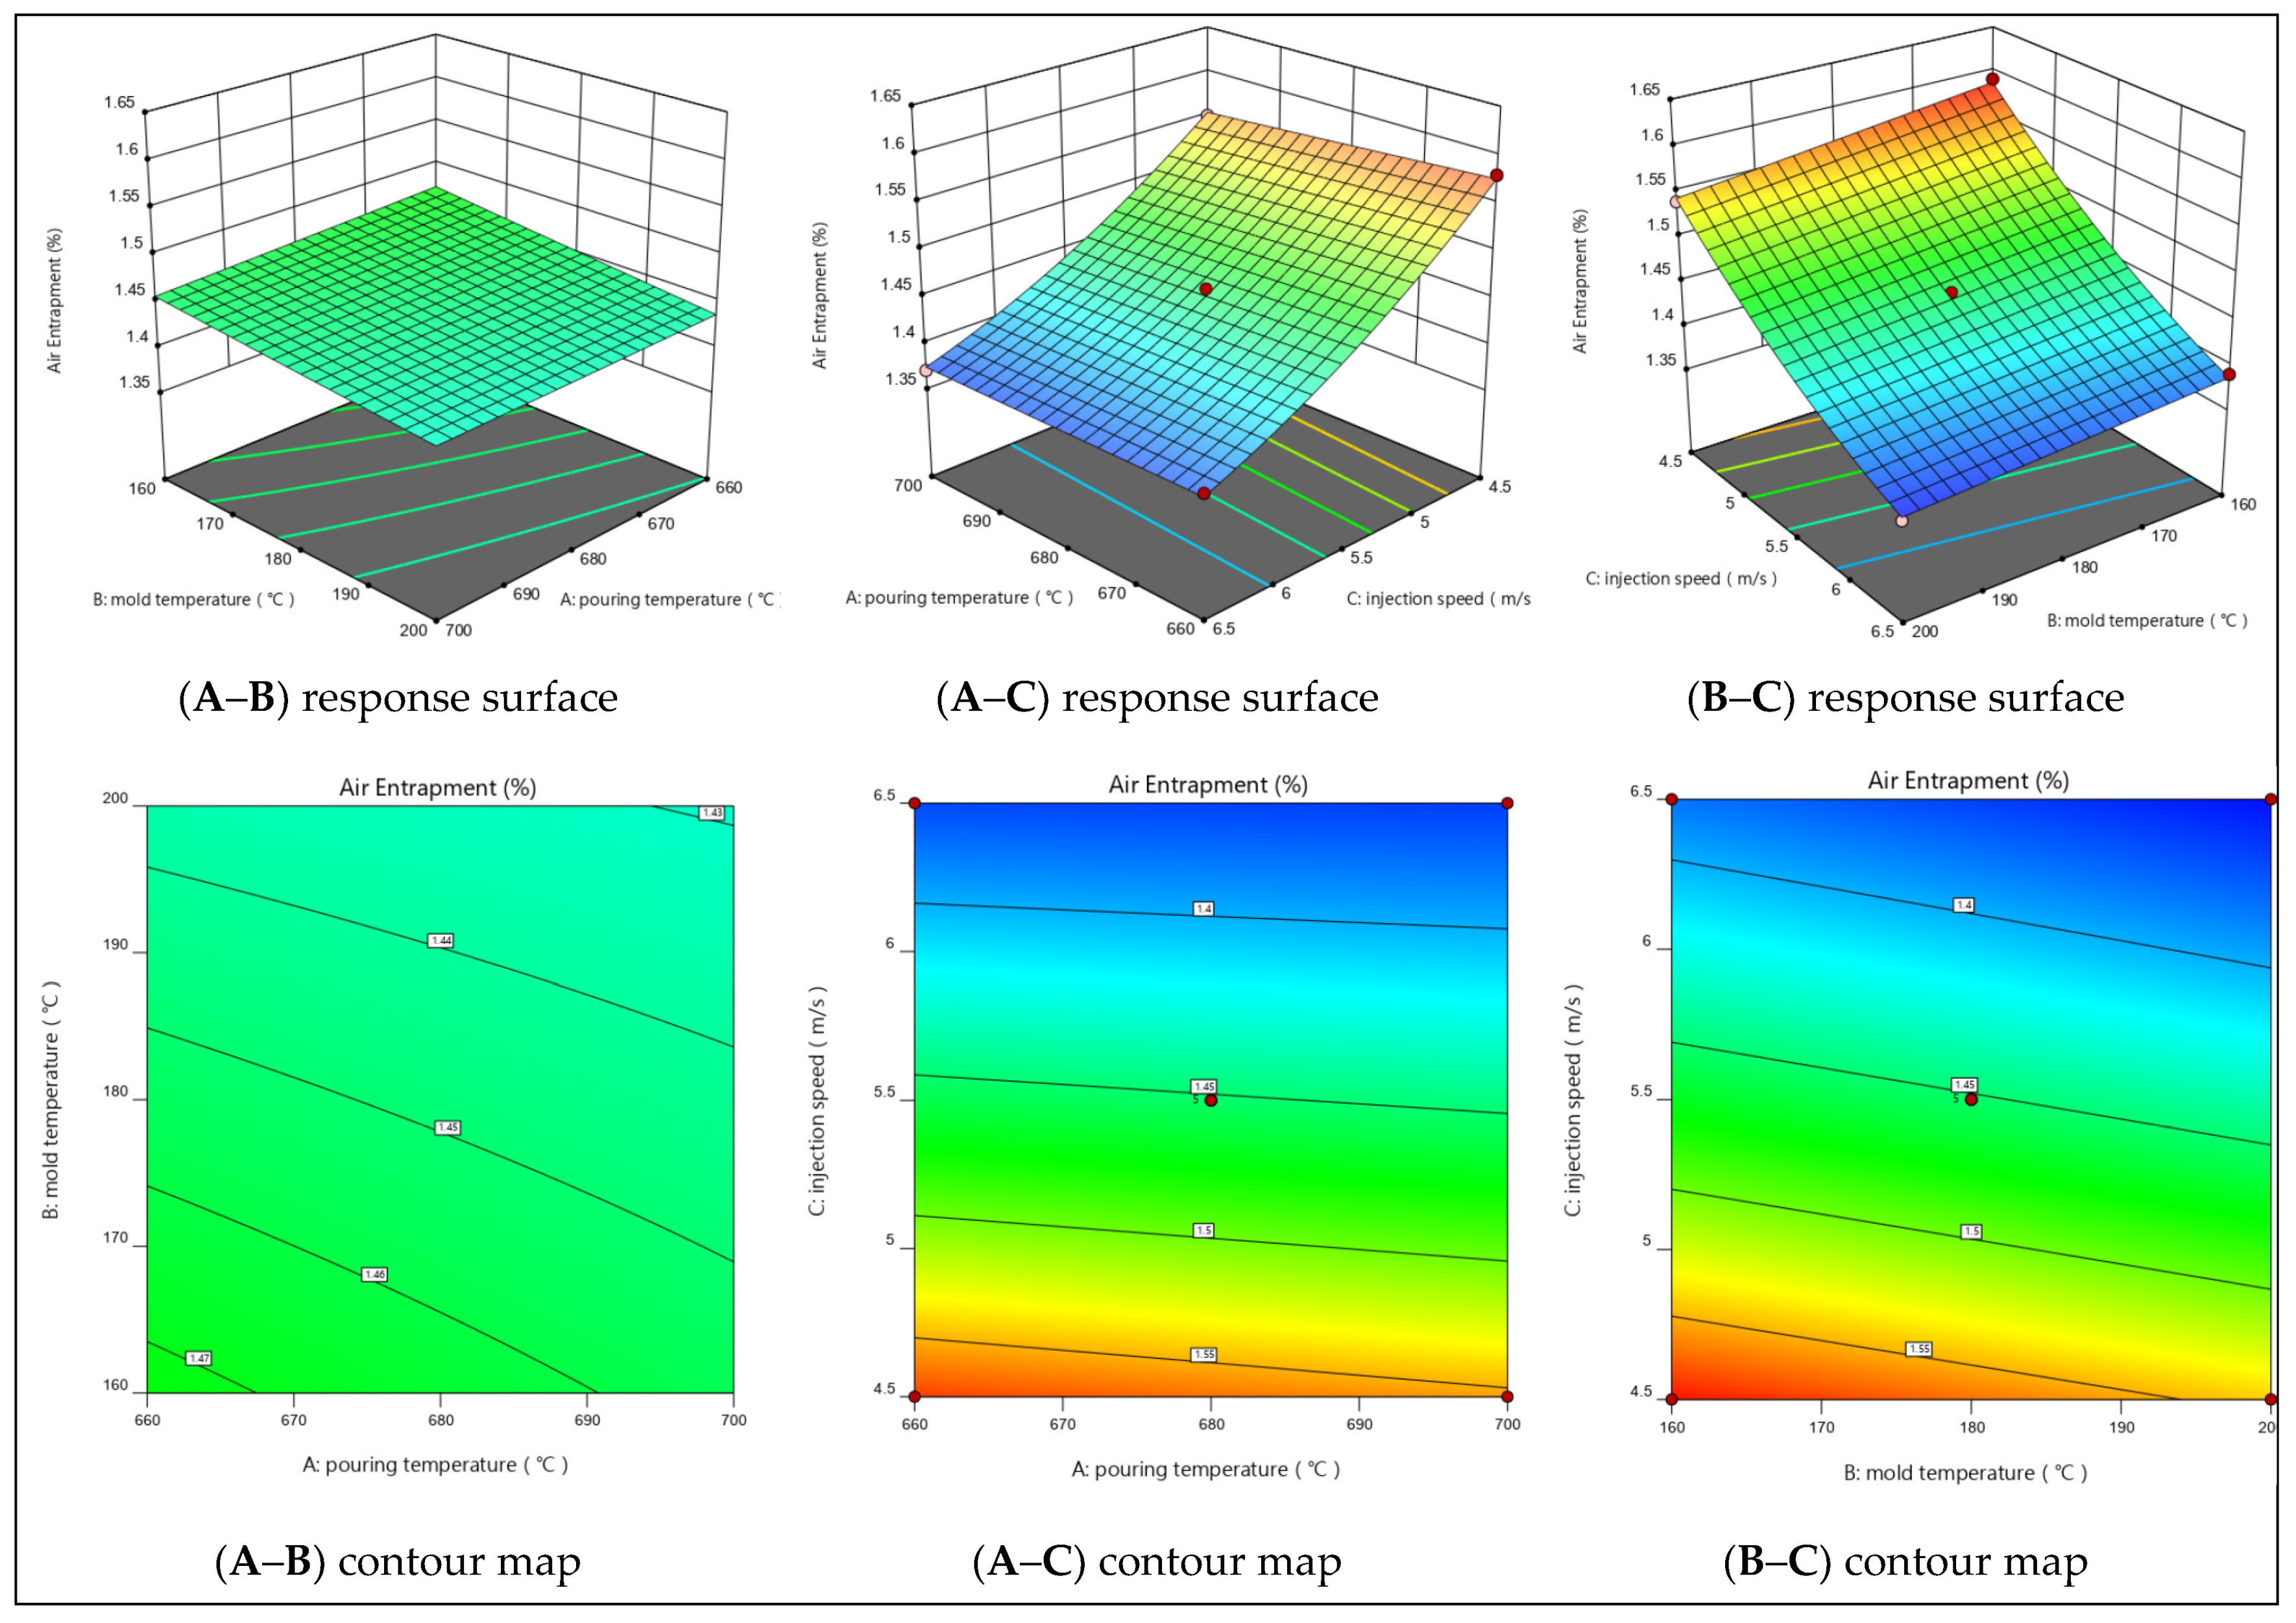
3.2.1. Response Surface Model for Air Entrapment Rate

The quadratic model was analyzed by the Model Fit Summary module of the Design-Expert software to have the highest fit, and the significance analysis of the response surface of the air entrapment rate under this model is shown in Table 4. The F-value of this model is 194.29, which indicates that the significance of the model is very high. p < 0.0001 in this model indicates a very significant term, and p < 0.05 indicates a more significant term. From the p-value of this model, it can be seen that the primary term C has a very significant effect on the air entrapment rate, B has a significant effect on the air entrapment rate, and the secondary term C2 also has a significant effect on the air entrapment rate.
By analysis, the fitted Equation (2) of the air entrapment rate (Y1) of the model is:
Y1 = 1.45 − 0.0062 × A − 0.0162 × B − 0.095 × C + 0.0025 × AB + 0.005 × AC + 0.005 × BC + 0.0002 × A2 + 0.0002 × B2 + 0.0178 × C2
In the case of considering only the air entrapment rate, the degree of influence of single factors on the air entrapment rate is shown in Figure 4. It can be seen that the pouring temperature and mold preheating temperature have little effect on the air entrapment rate of the casting, but the pressure injection speed has a greater effect on the air entrapment rate of the casting and reduces the air entrapment rate of the casting as the pressure injection speed increases.
In the case of considering only the air entrapment rate, the effect of two factors acting together on the air entrapment rate was analyzed, and the results are shown in Figure 5. Through the response surface and contour distribution in the figure, it can be seen that the significance of the three die-casting process parameters on the air entrapment rate is in the following order: injection speed, mold preheating temperature, and pouring temperature. The optimal process combination is 680 °C for pouring temperature, 200 °C for mold preheating temperature, and 6.5 m/s for injection speed.

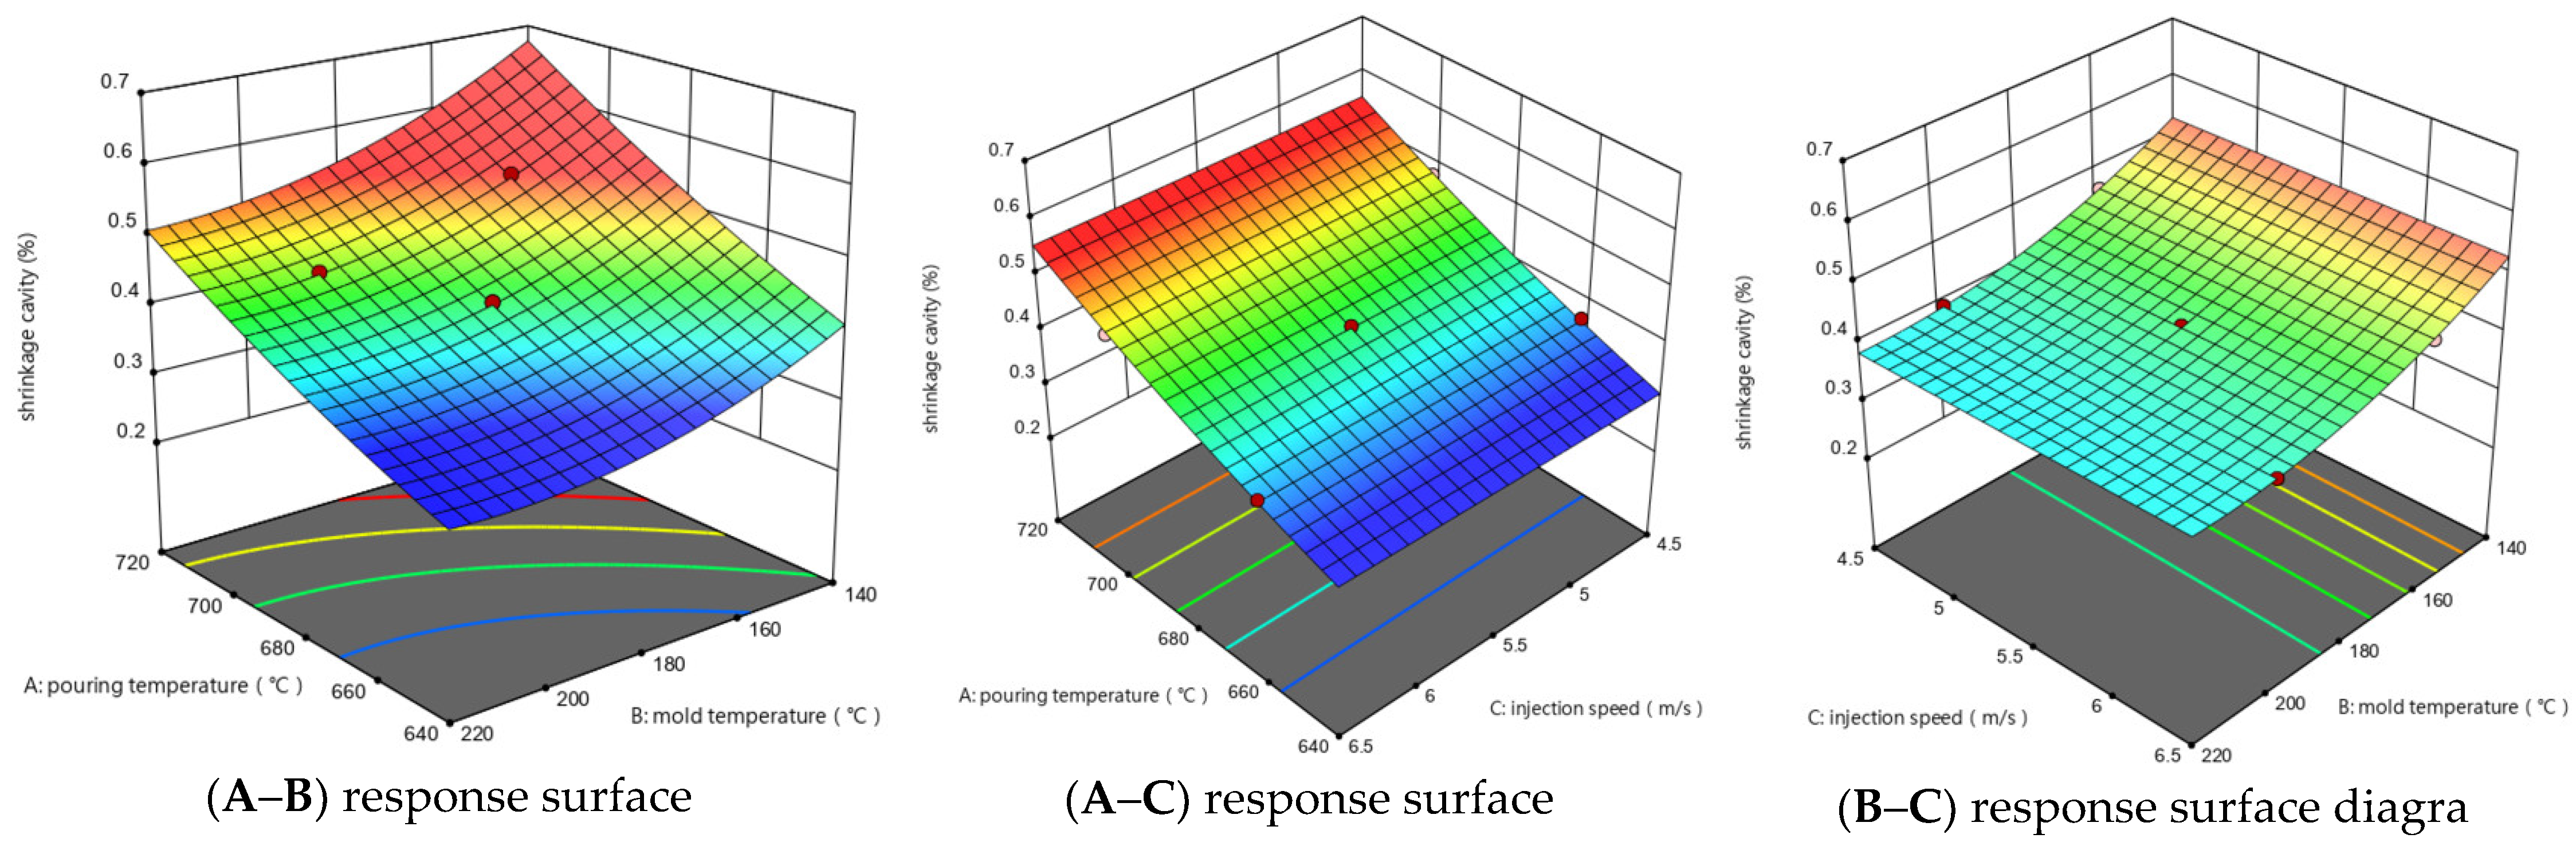
3.2.2. Response Surface Model for Shrinkage Cavity Rate

The quadratic model was analyzed by the Model Fit Summary module of Design-Expert software to have the highest fit, and the response surface significance analysis of the shrinkage cavity rate under this model is shown in Table 5. The F-value of this model is 148.17, which indicates that the significance of the model is very high. p < 0.0001 in this model indicates a very significant term, and p < 0.05 indicates a more significant term. From the p-value of this model, it can be seen that the primary terms A and B have a very significant effect on the shrinkage cavity rate, and the secondary term B2 has a significant effect on the solidification time.
By analysis, the fitted Equation (2) of the shrinkage cavity rate (Y2) of the model is:
Y2 = 0.4192 + 0.0606 × A − 0.0359 × B + 0.001 × C − 0.0033 × AB − 0.0005 × AC + 0.0035 × A20.0952 × B2 + 0.0003 × C
Figure 6 shows the degree of influence of single factors on the shrinkage cavity rate in the case of considering only the shrinkage cavity rate. It can be seen that the pouring temperature and mold preheating temperature have a greater effect on the shrinkage cavity rate of the casting, and the shrinkage cavity rate of the casting increases as the pouring temperature increases, while the shrinkage cavity rate of the casting decreases as the mold preheating temperature increases. However, the pressure injection speed has almost no effect on the shrinkage cavity rate of the casting.
In the case of considering only the shrinkage cavity rate, the effect of two factors acting together on the shrinkage cavity rate was analyzed, and the results are shown in Figure 7. The response surface and contour distribution in the figure show that the significance of three die-casting process parameters on the shrinkage cavity rate are in the following order: pouring temperature, mold preheating temperature, and injection speed. The optimal process combination is 660 °C for pouring temperature, 200 °C for mold preheating temperature, and 4.5 m/s for injection speed.
In the actual production, the above factors should be taken into consideration, and the optimal process combination was obtained through the analysis of the Optimization module of Design-Expert software when the air entrapment rate and shrinkage cavity rate were considered at the same time: pouring temperature 660 °C, mold preheating temperature 200 °C, and press injection speed 6.5 m/s.

3.3. Simulation Analysis

Based on the optimal process combination obtained above, the air entrapment rate and shrinkage cavity rate of the CCB before and after optimization were simulated using MAGMA software, and the simulation results are shown in Figure 8.
In terms of the air entrapment rate, from Figure 8, we can see that before the optimization of the castings in the filling process, the volume of air is very high; most of the castings’ air entrapment amounted to 14%, especially in region A, where the amount of air entrapment is more than 20% of the draft, which also indicates that the area is prone to casting defects such as air holes.
After optimization, the volume of air in the casting is obviously reduced, the volume of air in most of the castings is less than 3%, and only a very small number of areas have a volume rate of 14%. In terms of air entrainment rate, the optimized casting air entrainment rate is reduced by 17%, which greatly reduces air entrainment defects in casting.
As far as the shrinkage cavity is concerned, it can be seen from Figure 9 that the shrinkage cavity area before optimization is mainly concentrated in the middle of the casting, and the shrinkage cavity rate reaches 14%. The shrinkage cavity position of the optimized casting is significantly reduced, and the shrinkage cavity rate is only 7%. It shows that the shrinkage porosity of the optimized casting is reduced by about 7%.

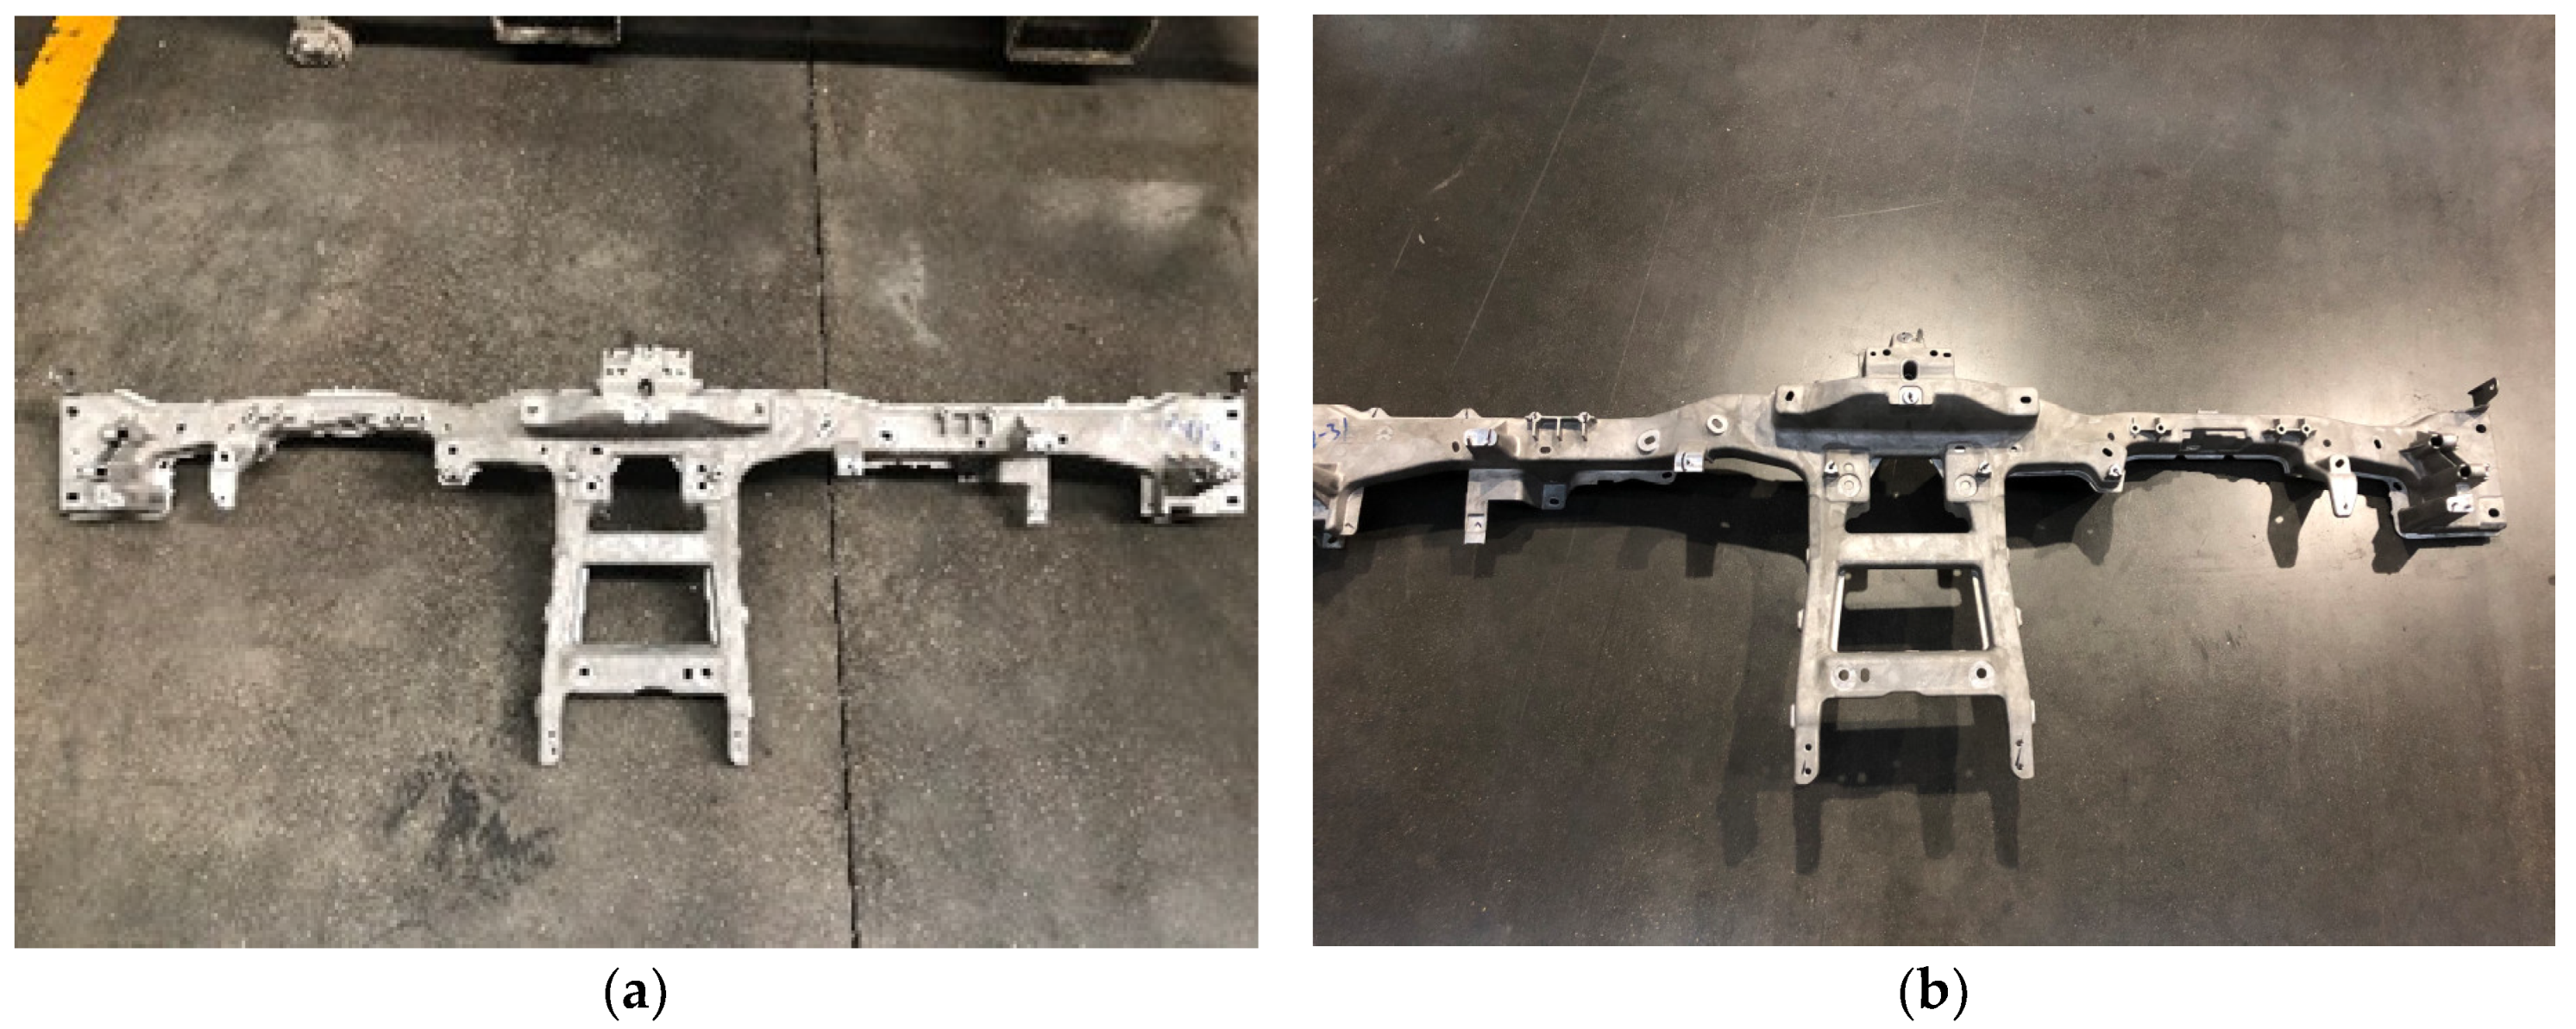
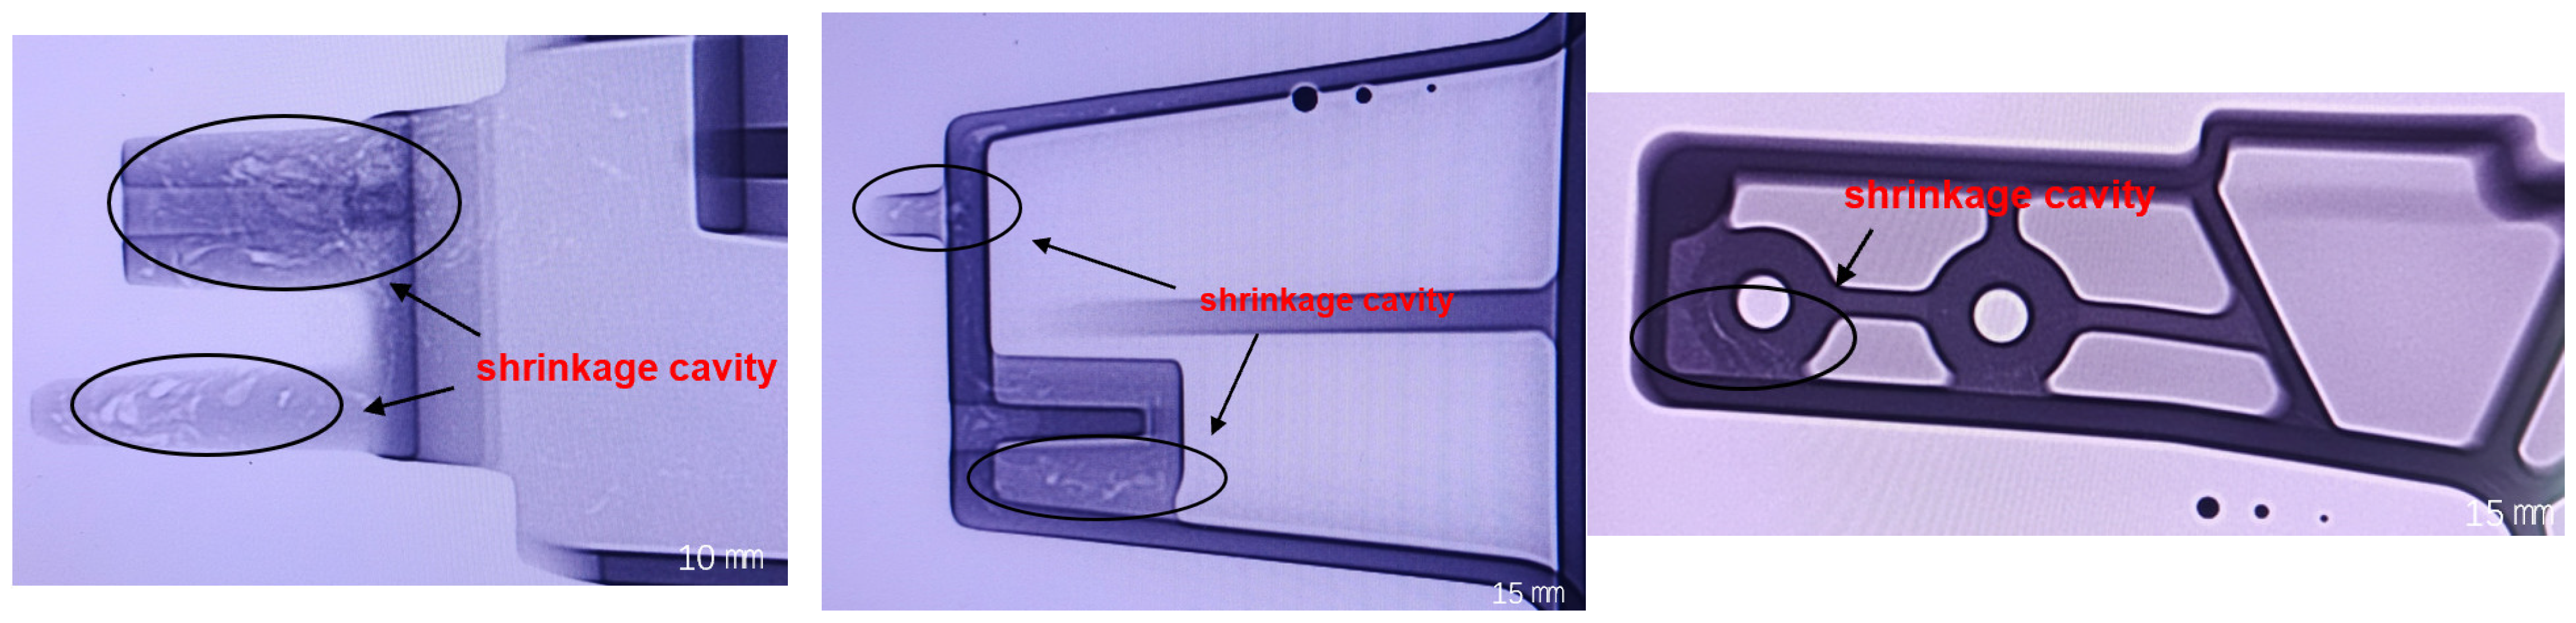
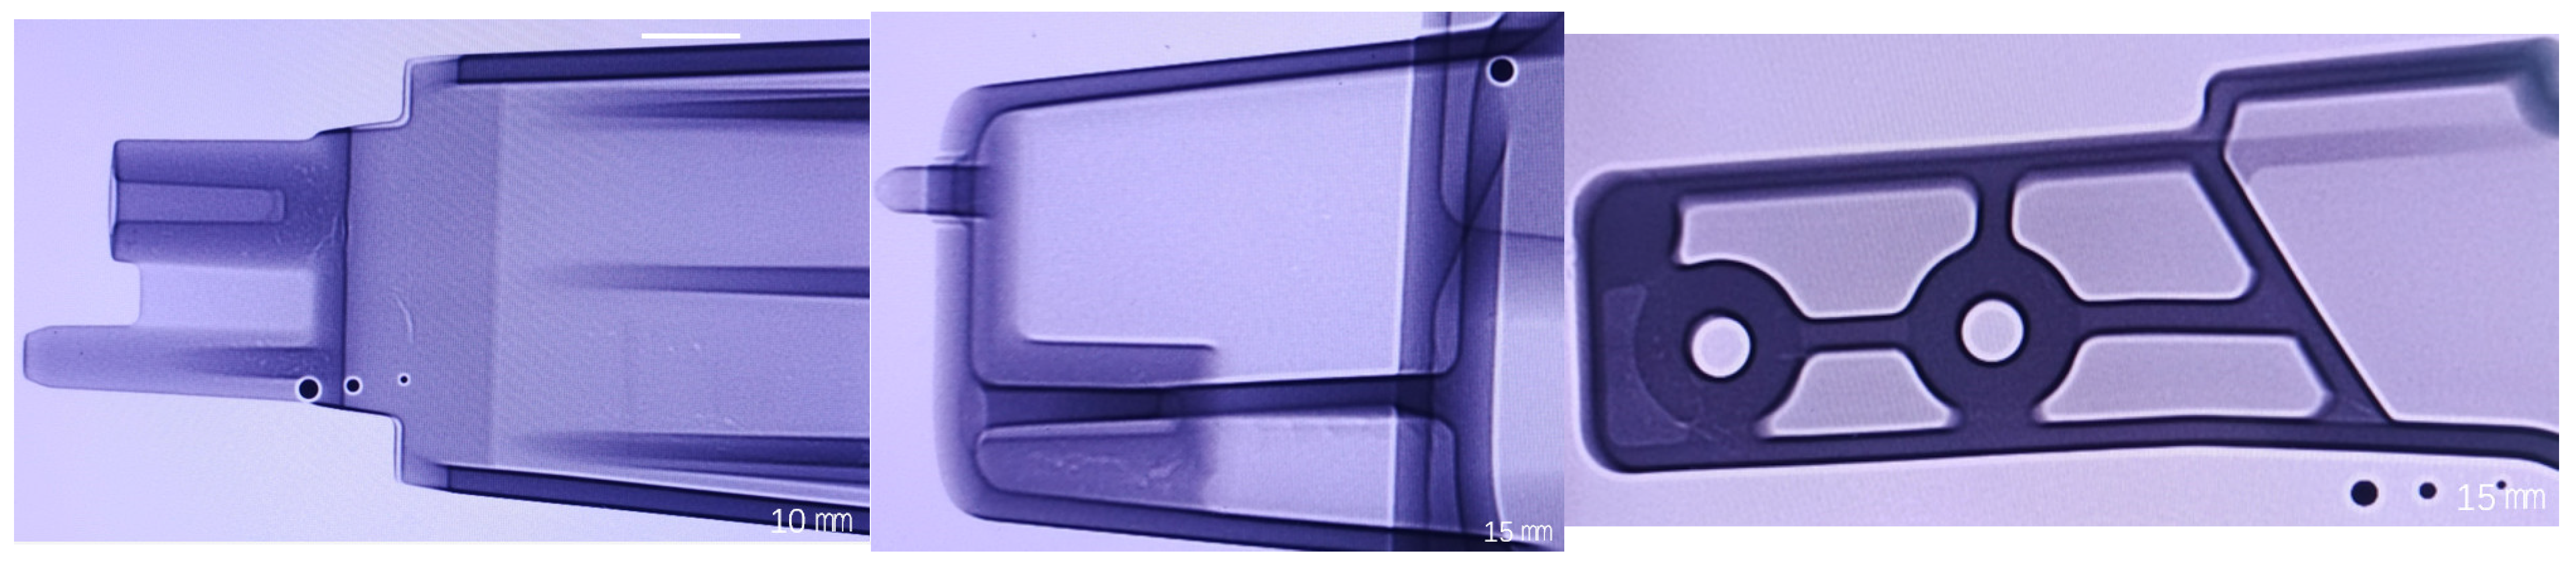
3.4. Die Casting Experiment

The process parameters before and after optimization combined with the structure of scheme 2 are applied to the die-casting production of CCB parts. The castings obtained by die-casting and machining are shown in Figure 10. It can be seen from Figure 10 that there is no obvious difference in the surface of the CCB casting before and after optimization. From the overall appearance, the surface gloss of the casting is good and there are no obvious defects.
After the die-casting was completed, 100 castings were taken before and after process optimization for X-ray inspection on their key parts. The inspection results are shown in Table 6. It can be seen from Table 6 that before process optimization, there were many air entrainments or shrinkages inside 85 castings, and only 15 castings were qualified products; after process optimization, only six castings had many air entrainments or shrinkages inside, and there were 94 castings qualified. The results further demonstrate the accuracy of the previous MAGMA simulation.
Figure 11 shows the X-ray inspection results of key parts of the CCB casting before optimization. It can be seen from the circled parts in the figure that there are a large number of casting defects caused by entrained air inside the casting. It is because of the existence of these defects that the casting has defective products.
Figure 12 shows the optimized X-ray inspection results of key parts of CCB parts. The results show that the internal quality of CCB castings is generally good, and no casting defects such as large shrinkage cavity porosity were found, which meets the ASTM E505A2 standards.
The mechanical properties of CCB castings before and after optimization are shown in Table 7. It can be seen from Table 6 that the tensile strength, yield strength, and elongation of CCB castings have been significantly improved after optimization. Among them, the tensile strength increased by about 30 MPa, the yield strength increased by about 20 MPa, and the elongation increased by about 5%.

4. Conclusions

In this paper, the die-casting process of large thin-walled magnesium alloy castings was simulated by numerical simulation technology. By optimizing the mold casting system and process parameters, the quality of castings can be improved, and the qualified rate of products can be increased, which has great guiding significance for the production of large thin-walled magnesium alloy castings. The specific conclusions are as follows:
(1)
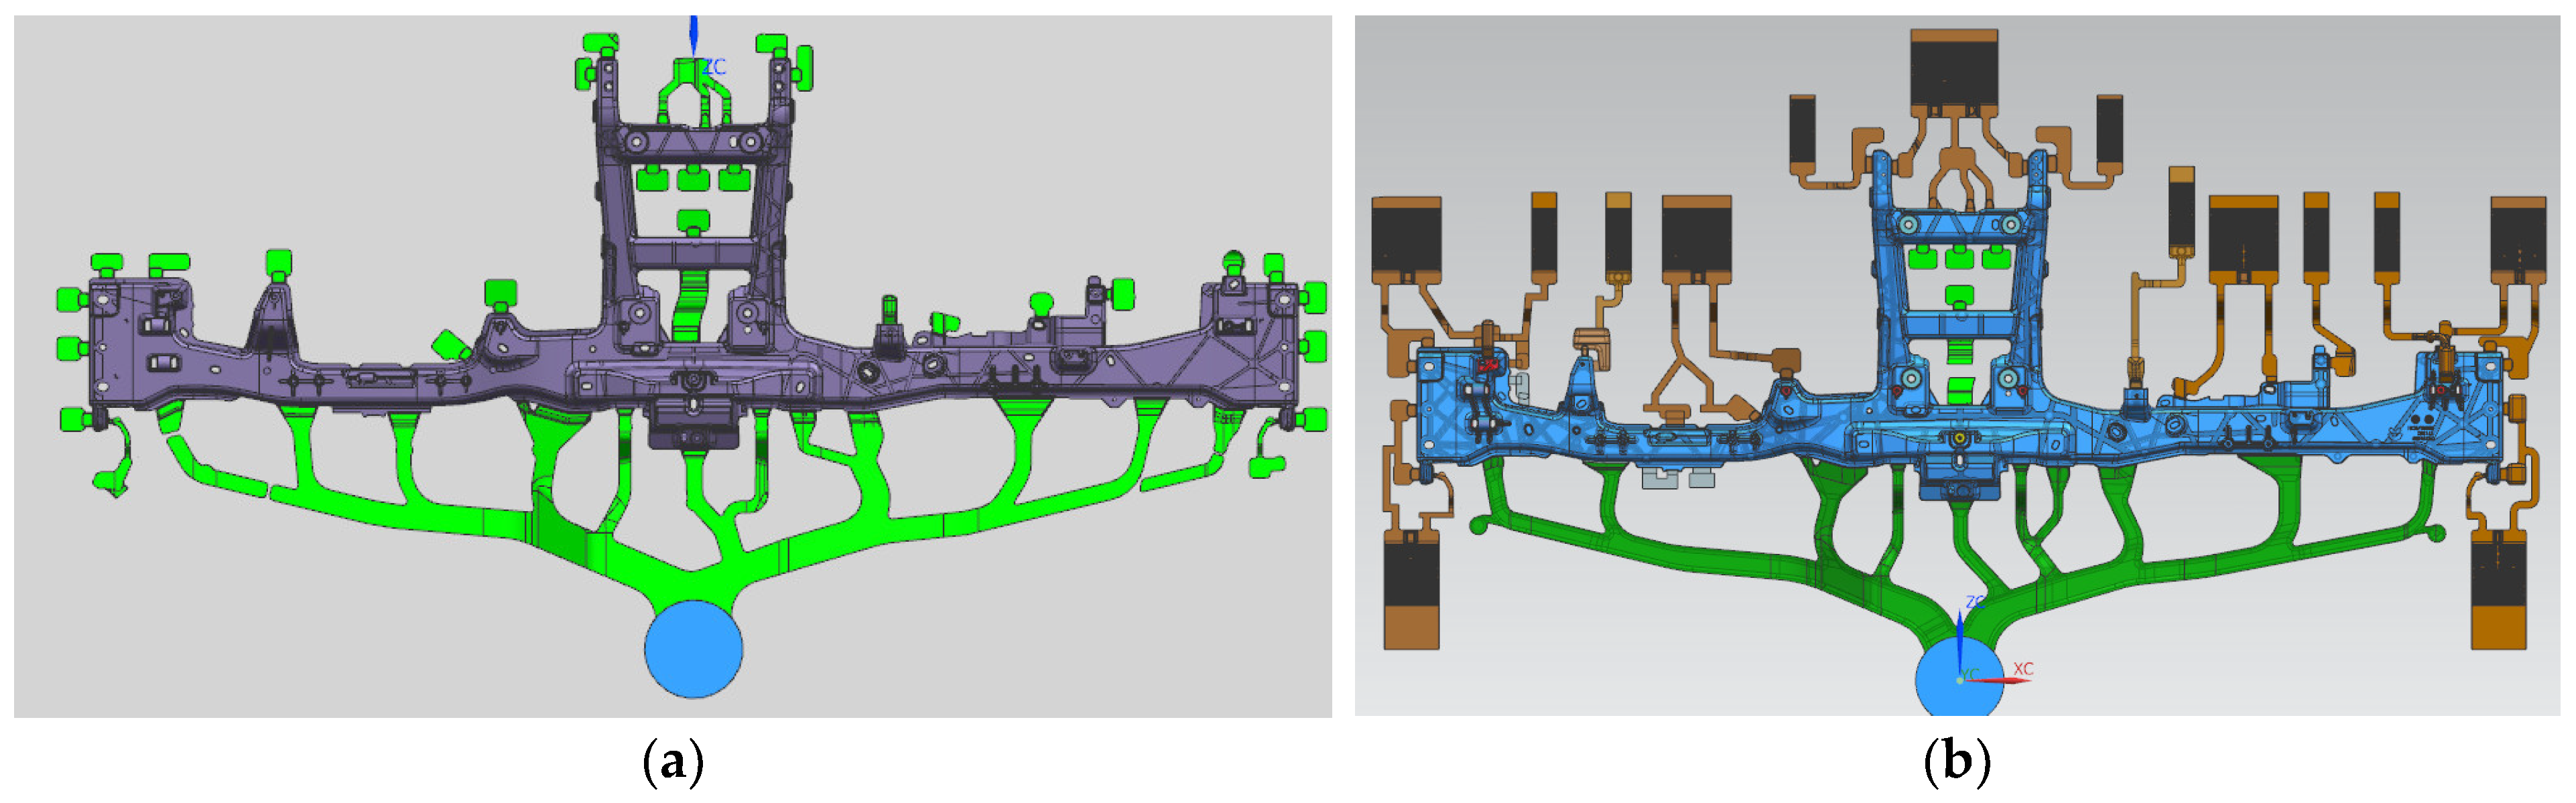
Under the same process parameters, MAGMA software was used to simulate the filling of two pouring system schemes for CCB of magnesium alloy automobiles, and the results showed that the design of the pouring system of scheme 2 was better than that of scheme 1, and the design of scheme 2 could effectively reduce casting defects.
(2)
In the die-casting process of the AM60B magnesium alloy automotive CCB bracket, when only the air entrapment rate is considered, the press injection speed has the greatest influence, the mold preheating temperature is second, and the pouring temperature has the least influence. When considering only the shrinkage cavity rate, the pouring temperature has the greatest influence, the mold preheating temperature is second, and the press injection speed has the least influence.
(3)
In the actual production process, the air entrainment rate and shrinkage cavity rate should be considered comprehensively. The optimal combination of process parameters is as follows: pouring temperature 660 °C, mold preheating temperature 200 °C, and press injection speed 6.5 m/s. Under these process parameters, the qualified rate of magnesium alloy CCB castings can be improved effectively.

Author Contributions

Conceptualization, J.L. and L.C.; methodology, J.L. and S.J.; software, L.C.; validation, L.C., H.G. and W.H.; writing—original draft preparation, L.C.; writing—review and editing, J.L. All authors have read and agreed to the published version of the manuscript.

Funding

This research was funded by the Zhejiang Key Research and Development Program (No. 2022C01081).

Institutional Review Board Statement

Not applicable.

Informed Consent Statement

Not applicable.

Data Availability Statement

The data that support the findings of this study are available from the corresponding author upon reasonable request.

Conflicts of Interest

The authors declare no conflict of interest.

References

  1. Wang, Z.W.; Zhang, N. The Promotion of Chinese Automobile Lightweight Technical Progress by Mechanism Innovation. J. Iron Steel Res. Int. 2011, 18, 747–751. [Google Scholar]
  2. Guo, R.C.; Wu, N.; Zhang, G.R. New Materials for Auto-body Lightweight Applications. In Proceedings of the 2nd International Conference on Material and Manufacturing Technology, Xiamen, China, London, UK, 8 July–10 December 2017. [Google Scholar]
  3. Zhao, H.W.; Zhang, R.B.; Bin, Z.Y. A Review of Automotive Lightweight Technology. In Proceedings of the 2nd International Conference on Mechanical, Electronic, Control and Automation Engineering, Qingdao, China, 30–31 March 2018. [Google Scholar]
  4. Anonymous. Global Vehicle Lightweighting-Technology, Trends and the Future-2022 Q1 Edition: Credits. Just-Auto 2022. Available online: https://www.reportlinker.com/p02618913/Global-vehicle-lightweighting-technology-trends-and-the-future.html (accessed on 11 June 2022).
  5. Anonymous. Global Vehicle Lightweighting-Technology, Trends and the Future-2021 Q2 Edition: Table of Contents. Just-Auto 2021. Available online: https://www.reportlinker.com/p02618913/Global-vehicle-lightweighting-technology-trends-and-the-future.html (accessed on 11 June 2022).
  6. Fang, D.; Jinhua, W.; Yunfei, J.; Yuanqing, Z.J. Research on Lightweight Technology of New Energy Vehicles. E3S Web Conf. 2021, 257, 01065. [Google Scholar] [CrossRef]
  7. Yue, Z. Analysis on the Development Status of Automobile Lightweight Welding Technology. J. Phys. Conf. Ser. 2021, 1750, 012001. [Google Scholar]
  8. Yao, C.M. Lightweight automotive design technology and material application analysis. In Proceedings of the 4th International Conference on Mechanical, Control and Computer Engineering, Hohhot, China, 25–27 October 2019. [Google Scholar]
  9. Liu, D.F.; Tao, J. Application of Automobile Lightweight Alloys and the Development of its Die-Casting Technology. In Proceedings of the International Conference on Advanced Design and Manufacturing Engineering, Guangzhou, China, 16–18 September 2011. [Google Scholar]
  10. Pan, F.S.; Yang, M.B.; Chen, X.H. A review on casting magnesium alloys: Modification of commercial alloys and development of new alloys. J. Mater. Sci. Technol. 2016, 32, 1211–1221. [Google Scholar] [CrossRef]
  11. Kulekci, M.K. Magnesium and its alloys applications in automotive industry. Int. J. Adv. Manuf. Technol. 2008, 39, 851–865. [Google Scholar] [CrossRef]
  12. Akinlabi, E.T. An overview on joining of aluminum and magnesium alloys using friction stir welding (FSW) for automotive lightweight applications. Mater. Res. Express 2019, 6, 11. [Google Scholar]
  13. Fu, Y.; Wang, G.G.; Hu, A. Formation, characteristics and control of sludge in Al-containing magnesium alloys: An overview. J. Magnes. Alloy. 2022, 10, 599–613. [Google Scholar] [CrossRef]
  14. Wu, D.H.; Chang, M.S. Use of Taguchi method to develop a robust design for the magnesium alloy die casting process. Mater. Sci. Eng. A-Struct. Mater. Prop. Microstruct. Process. 2004, 379, 366–371. [Google Scholar] [CrossRef]
  15. Li, X.; Xiong, S.M.; Guo, Z. Failure behavior of high pressure die casting AZ91D magnesium alloy. Mater. Sci. Eng. A 2016, 672, 216–225. [Google Scholar] [CrossRef]
  16. Balbi, M. A model for high-cycle fatigue crack propagation. Mater. Test. 2017, 59, 35–40. [Google Scholar] [CrossRef]
  17. Oborin, V.; Naimark, O. Scaling invariance of fatigue crack growth in aluminum alloy. Procedia Mater. Sci. 2014, 3, 1004–1008. [Google Scholar] [CrossRef] [Green Version]
  18. Liu, H.W.; Sun, H.H.; Liu, J.M. Numerical Simulation on the Die Casting Forming Process of a Magnesium Alloy Bearing Block. In Proceedings of the 6th International Conference on Mechatronics, Materials, Biotechnology and Environment, Yinchuan, China, 13–14 August 2016. [Google Scholar]
  19. Ma, X.C.; Zhuang, Y.Q.; Tao, Y.Q. Numerical Simulation of Die-casting Magnesium Alloy Impeller with the Central Gating System. In Proceedings of the International Conference on Recent Trends in Materials and Mechanical Engineering, Shenzhen, China, 27–28 January 2011. [Google Scholar]
  20. Peng, L.M.; Wang, Y.X.; Fu, P.H. Numerical Simulation and Process Development for Low Pressure Diecasting of Magnesium Alloy Wheels. In Proceedings of the 114th Annual Metalcasting Congress, Orlando, FL, USA, 20–23 March 2022. [Google Scholar]
  21. Sket, F.; Fernandez, A.; Jeusalem, A. Effect of Hydrostatic Pressure on the 3D Porosity Distribution and Mechanical Behavior of a High Pressure Die Cast Mg AZ91 Alloy. Metall. Mater. Trans. A-Phys. Metall. Mater. Sci. 2015, 46A, 4056–4069. [Google Scholar] [CrossRef]
  22. Huang, Y.J.; Hu, B.H.; Pinwill, I. Effects of process settings on the porosity levels of AM60B magnesium die castings. Mater. Manuf. Process. 2000, 15, 97–105. [Google Scholar] [CrossRef]
  23. Hung, C.M.; Chang, M.S.; Tang, N.K. Evaluation between mechanical properties and die casting process control by Toguchi method for magnesium alloy AM60B. In Proceedings of the Symposium on Magnesium Technology 2004 held at the TMS Annual Meeting, Charlotte, NC, USA, 14–18 March 2004. [Google Scholar]
  24. Lin, C.J.; Jin, Y.; Tang, H.Q. Finite Element Analyses and Model of Squeeze Casting Process for Producing Magnesium Wheels. In Proceedings of the 2nd International Conference on Chemical Engineering and Advanced Materials, Guangzhou, China, 13–15 July 2012. [Google Scholar]
  25. Rzychon, T.; Adamczk-Cieslak, B.; Kielbus, A. The influence of hot-chamber die casting parameters on the microstructure and mechanical properties of magnesium-aluminum alloys containing alkaline elements. Mater. Werkst. 2012, 43, 421–426. [Google Scholar] [CrossRef]
  26. Vanli, A.S.; Akdogan, A. Effects of process parameters on mechanical and metallurgical properties in high pressure die casting of AZ91 magnesium alloy. Indian J. Eng. Mater. Sci. 2019, 26, 27–35. [Google Scholar]
  27. Liu, Y.G.; Huang, Z.H.; Ding, H. Study on pressure variations in the mold of magnesium alloy die castings. In Proceedings of the Asian Pacific Conference for Fracture and Strength, Sanya, China, 22–25 November 2007. [Google Scholar]
Figure 1. 3D model with pouring system: (a) scheme 1; (b) scheme 2.
Processes 11 00016 g001
Figure 2. Temperature distribution diagram of two projects: scheme 1 (a,c,e); scheme 2 (b,d,f).
Processes 11 00016 g002
Figure 3. Filling velocity simulation results of the two projects: Scheme 1 (a,c,e,g); Scheme 2 (b,d,f,h).
Processes 11 00016 g003
Figure 4. Effect of single factors on air entrapment rate (Y1).
Processes 11 00016 g004
Figure 5. The interaction effect of two factors on the air entrapment rate (Y1).
Processes 11 00016 g005
Figure 6. Effect of single factor on shrinkage cavity rate (Y2).
Processes 11 00016 g006
Figure 7. Interactive effect of two factors on shrinkage cavity rate (Y2).
Processes 11 00016 g007aProcesses 11 00016 g007b
Figure 8. Comparison of air entrainment rate before and after optimization: (a) before optimization; (b) after optimization.
Processes 11 00016 g008
Figure 9. Comparison of shrinkage cavity rate before and after optimization: (a) before optimization; (b) after optimization.
Processes 11 00016 g009
Figure 10. CCB Die-casting: (a) before optimization; (b) after optimization.
Processes 11 00016 g010
Figure 11. X-ray test before optimization.
Processes 11 00016 g011
Figure 12. X-ray test after optimization.
Processes 11 00016 g012
Table 1. Chemical composition of diecast AM60B alloy.
ElementAlZnMnSiFeCuNiBeMg
Proportion (%)5.80.180.560.080.00030.0060.000860.0012Bal.
Table 2. Factor-level table of response surface test.
ABC
Pouring Temperature (°C)Mold preheating Temperature (°C)Injection Speed (m/s)
Level 16601604.5
Level 26801805.5
Level 37002006.5
Table 3. Experimental table of response surface and statistics of results.
Serial NumberPouring Temperature (°C)Mold Preheating
Temperature (°C)
Injection Speed (m/s)Air Entrapment (%)Shrinkage Cavity (%)
ABCY1Y2
16601605.51.470.401
27001605.51.460.537
36602005.51.440.334
47002005.51.440.457
56601804.51.580.365
67001804.51.550.479
76601806.51.380.368
87001806.51.370.48
96801604.51.590.463
106802004.51.540.393
116801606.51.390.465
126802006.51.360.395
136801805.51.450.423
146801805.51.460.419
156801805.51.450.418
166801805.51.450.413
176801805.51.450.423
Table 4. Response surface significance analysis.
SourceSum of SquaresdfMean SquareF-Valuep-ValueStatistical Significance
Model0.076290.0085194.29<0.0001Significant
A0.000310.00037.170.0316
B0.002110.002148.480.0002
C0.072210.07221657.05<0.0001Significant
AB0100.57380.4735
AC0.000110.00012.30.1736
BC0.000110.00012.30.1736
A22.632 × 10−712.632 × 10−70.0060.9402
B22.632 × 10−712.632 × 10−70.0060.9402
C20.001310.001330.450.0009Significant
Residual0.000370
Lack of fit0.000230.00013.750.1171
Pure error0.0001410
Cor total0.07656
Table 5. Significance analysis of response surface.
SourceSum of SquaresdfMean SquareF-Valuep-ValueStatistical Significance
Model0.040290.0045148.17<0.0001Significant
A0.029410.0294975.23<0.0001Significant
B0.010310.0103341.5<0.0001Significant
C0.00000810.0000080.26530.6223
AB0101.40.2751
AC0.00000110.0000010.03320.8607
BC01001
A20.000110.00011.740.2292
B20.000410.000412.670.0092Significant
C23.184 × 10−713.184 × 10−70.01060.921
Residual0.000270
Lack of fit0.0001302.760.1761
Pure error0.000140
Cor total0.040416
Table 6. X-ray inspection results of 100 castings taken before and after optimization.
Air Entrainment or ShrinkageQualified Product
Before optimization8515
After optimization694
Table 7. Mechanical properties before and after optimization.
Tensile Strength (MPa)Yield Strength (MPa)Elongation (%)
After optimization190.2479.763.2
191.5281.354.2
184.5878.945.8
Before optimization221.19103.649.4
215.34106.7410.6
218.9698.749.8
Disclaimer/Publisher’s Note: The statements, opinions and data contained in all publications are solely those of the individual author(s) and contributor(s) and not of MDPI and/or the editor(s). MDPI and/or the editor(s) disclaim responsibility for any injury to people or property resulting from any ideas, methods, instructions or products referred to in the content.

