Article

Establishment and Application of a Novel Four-Dimensional Model for Simulation of a Natural Water Flooding Reservoir—A Case Study of Nanpu No. 2 Structure in the BHW Basin

1
Jidong Oilfield Company, PetroChina, Tangshan 063200, China
2
School of Energy Resources, China University of Geosciences, Beijing 100083, China
*
Author to whom correspondence should be addressed.
Processes 2023, 11(1), 189; https://doi.org/10.3390/pr11010189
Submission received: 29 November 2022 / Revised: 30 December 2022 / Accepted: 31 December 2022 / Published: 6 January 2023

Abstract

:
Long-term development of fluvial reservoirs causes regular changes in the microscopic pore-throat structure, physical properties and phase permeability curves of the reservoirs, and the evolution history of different oil layer varies. These effects can be explored using a four-dimensional (4D) model of the maturing field. The logging curves of 89 sand bodies of the Nanpu No. 2 structure in the Bohai Bay Basin were restored to the non-water flooded state based on the changing status of water flooding layers at different stages and levels, and an original geological model was established by combining data for the old wells. The time-varying relationship was incorporated in the dynamic model with surface flux as the variable, and the numerical simulation analysis was conducted based on the reservoir time-varying characteristics. The results showed that ① the logging data of the water-flooded layer significantly affected the simulation results of the geological model and can only be used for the establishment of the initial geological model after repositioning of time and space; ② the time variation of reservoir properties and relative permeability markedly affected the simulation results of the remaining oil. Reservoir parameters and fluid properties simulated by the 4D model were consistent with the data of water flooded layers in new wells during different periods; ③ the novel method significantly improved the fitting rate of the dynamic model, and the model was used to quantitatively describe the morphology of dominant seepage channels and reservoir variation parameters. The novel idea of ‘retreat as progress’ and ‘bring in to solve’ achieved the solution of the dynamic and static parameters of the 4D model according to each time step of space-time evolution. The results provide a guide for comprehensive adjustment and evaluation of Nanpu Oilfield for 52 well-times with an oil increase of 1.68 × 10⁴ tons for the different stages.

1. Introduction

Water flooding, polymer flooding, and compound flooding cause complex changes in the microstructure and macroscopic physical properties of a reservoir after the long-term development process of oil reservoirs. These factors affect the distribution of remaining oil and the preparation of the further development plan. Several studies have reported construction of a 4D geological attribute model, and the time-varying numerical simulation of the reservoir has been conducted [1,2,3]. Peng and Zhang et al. integrated the coring, logging, and experimental test data of different development stages obtained between 2004 to 2005, and established different three-dimensional geological models or reservoirs [4,5]. Yan et al. (2010) used the mathematical evolution model of reservoir parameters with the degree of water flooding to establish a 4D reservoir model based on reservoir development performance [6]. Yao et al. (2013) established water-flooding geological models based on water-flooded logging data obtained at different periods [7]. Liu et al. (2011) transformed the traditional black oil model based on experimental data and established a continuous mathematical evolution model [8]. Jiang (2016) and Cui et al. (2021) conducted dynamic model research on permeability and phase permeability curve based on surface flux [9] and performed numerical simulation of polymer flooding based on reservoir physical properties and time-varying characteristics [10]. These studies indicate use of 4D characterization for geological physical property field and reservoir property field and provide a basis for reservoir development. Previous findings indicate that the inter-well physical properties and water flooding degree of the reservoir during the process of constructing the 4D model in stages are affected by the depositional environment and the development history, which leads to different flooding times and degrees in different layers of the same well. Therefore, the information of the flooded layer of the infilling wells in the maturing field only reflects the current flooding status, and it can neither be simplified or normalized to the status of the same period nor be used as the basis for establishing a model of a certain development stage. The approach of fitting various parameters of the reservoir to the time-varying dynamics using algorithms, such as neural networks and fuzzy mathematics, emphasizes the internal correlation of static and dynamic parameters, and the well pattern should be relatively regular. The same type of reservoirs of multi-layer production can have significant differences in usage status due to small differences in reservoir quality or formation pressure, and the results may exhibit multiple solutions due to the multiple factors that affect the process and the large amount of data in the maturing field with high heterogeneity and complex development history. The time-varying numerical simulation method based on the reservoir uses a mathematical model to effectively couple the static and dynamic parameters and has accurate predictive ability. However, this method ignores the effect of the water-flooded layer data of maturing fields with time-varying effects at different periods in the model. Modeling based on the combination of mature and new well data can lead to incorrect model attribute fields. Currently, researchers are exploring methods to combine the basic well pattern and infilling wells at different periods to construct a 4D dynamic model of the maturing fields, which is a challenge in enhancing oilfield development. Moreover, it is imperative to establish reproducible and general technical ideas and methods suitable for reservoirs with high heterogeneity and an irregular well pattern.

2. Geological Characteristics of the Study Area

The Nanpu Oilfield is part of the Nanpu concave of the BHW Basin in China. The shallow layer of the Nanpu No. 2 structure is located in the middle of Nanpu Oilfield, which is a buried-hill draping anticline with complex faults. The reservoir is a layered lithologic-structural reservoir, characterized by braided river and meandering river deposits. The reservoir mainly comprises fine sand and siltstone. The cementation type in the area was primarily porous cementation, the interstitial material was mainly kaolinite, and the pore type was dominantly intergranular pores. The porosity ranged from 12.1% to 35.2%, with an average porosity of 27.3%. The area had 0.5–860.8 × 10⁻³ μm2 permeability, with an average of 331.4 × 10⁻³ μm2, implying that it is a high-porosity and high-permeability reservoir. The sedimentary rhythm was mainly compound rhythm and the reservoir variation coefficient was 0.92–1.06, indicating significant heterogeneity. The density of underground crude oil was 0.78 g/cm3 and the viscosity of crude oil was 2.7 mPa·s, indicating that it belongs to the conventional thin oil reservoirs. The reservoir was developed in 2007. The rolling development stage was between 2008 and 2010, the encryption adjustment stage ranged from 2013–2014, and the comprehensive management stage was from 2015–2020. Analysis showed medium- and high-water content in July 2020. Seismic data, well data (horizontal + directional well), and reservoir dynamic data were combined to conduct in-depth analysis of channel sand bodies with dense well patterns in the study area to improve the research accuracy of the available oil and flow field from the perspective of modeling and digital model integration in the maturing field. The scale, geometry and sedimentary microfacies of fluvial facies sand bodies were extensively characterized (channel width-thickness ratio was 40:1 to 78:1 and the aspect ratio of the beach bar was about 2.6:1). Subsequently, macroscopic and microscopic methods were used to explore the causes and rules of the logging parameters of the water-flooded layers in new wells at different stages, providing a basis for the establishment of the 4D model.

3. The Novel Idea for 4D Model Research

Reservoirs in continental basins have relatively high heterogeneity. Differences in the time and degree of water flooding in the reservoir plane, between layers and within layers, are observed owing to the impact of factors such structures and faults. The time-varying characteristics of different reservoirs in the various development stages are distinct. For instance, it varies in stable production and liquid extraction stages, and water flooding, profile control, and displacement stages also exhibit differences. It is a continuous and regular dynamic process. These findings indicate that modeling and numerical modeling should be integrated when designing 4D models. Therefore, a novel research idea was proposed from the perspective of integration. A new method of combining data for the basic well pattern, infilling wells, and passing wells at different periods to establish a 4D model of the maturing field was explored. Establishment of the initial fine geological model was extensively integrated with the working concepts based on the time-varying numerical simulation of the reservoir. Previous studies report a complete technical process of designing a 4D model of the maturing field. The process mainly comprises three parts. The first part is the geological modeling concept of ‘retreat to advance’. The main method used was integration of the basic production and establishment of wells, the infilling wells, and the passing wells of shallow reservoirs in the No. 2 structure of Nanpu Oilfield to explore the evolution characteristics of significant static physical parameters including water flooding degree and physical characteristics based on the guidance of dynamic analysis results and indoor experimental data. In addition, the changing rules of the reservoir parameters of the water-flooded layer at each stage were summarized. The reservoir was restored to the unflooded state according to specific rules and principles. The geological model of the initial state was then established by combining the structure and reservoir data of new and old wells. The second part is the numerical simulation concept of ‘substitute solution’. The main method was to consider the water flow of each grid node as an independent variable, obtain the surface flux at each time step, write a program, and substitute the functional relationship between the surface flux and the reservoir time-varying characteristics into the equation of the dynamic model. The numerical simulation research based on the reservoir time-varying effects was then carried out, and the geological and physical property model of each time step were obtained. The results were then substituted into the dynamic equation to determine the relevant parameters of the reservoir, for continuous tracing and recovery of the development process. Quality control inspection should be conducted based on the comparison and analysis of the model physical property evolution and the logging curve of the water-flooded layer. In addition, quality control analysis of the production performance comparison should be performed to improve the accuracy of the model. The third part is characterization of the 4D dominant seepage channel and qualitative and quantitative analysis of the remaining oil based on the dynamic model. A flow chart of design and analysis of the reservoir using the 4D model is shown in Figure 1. Novel ideas and methods for 4D model research are presented in this study.

4. Case Studies and Applications

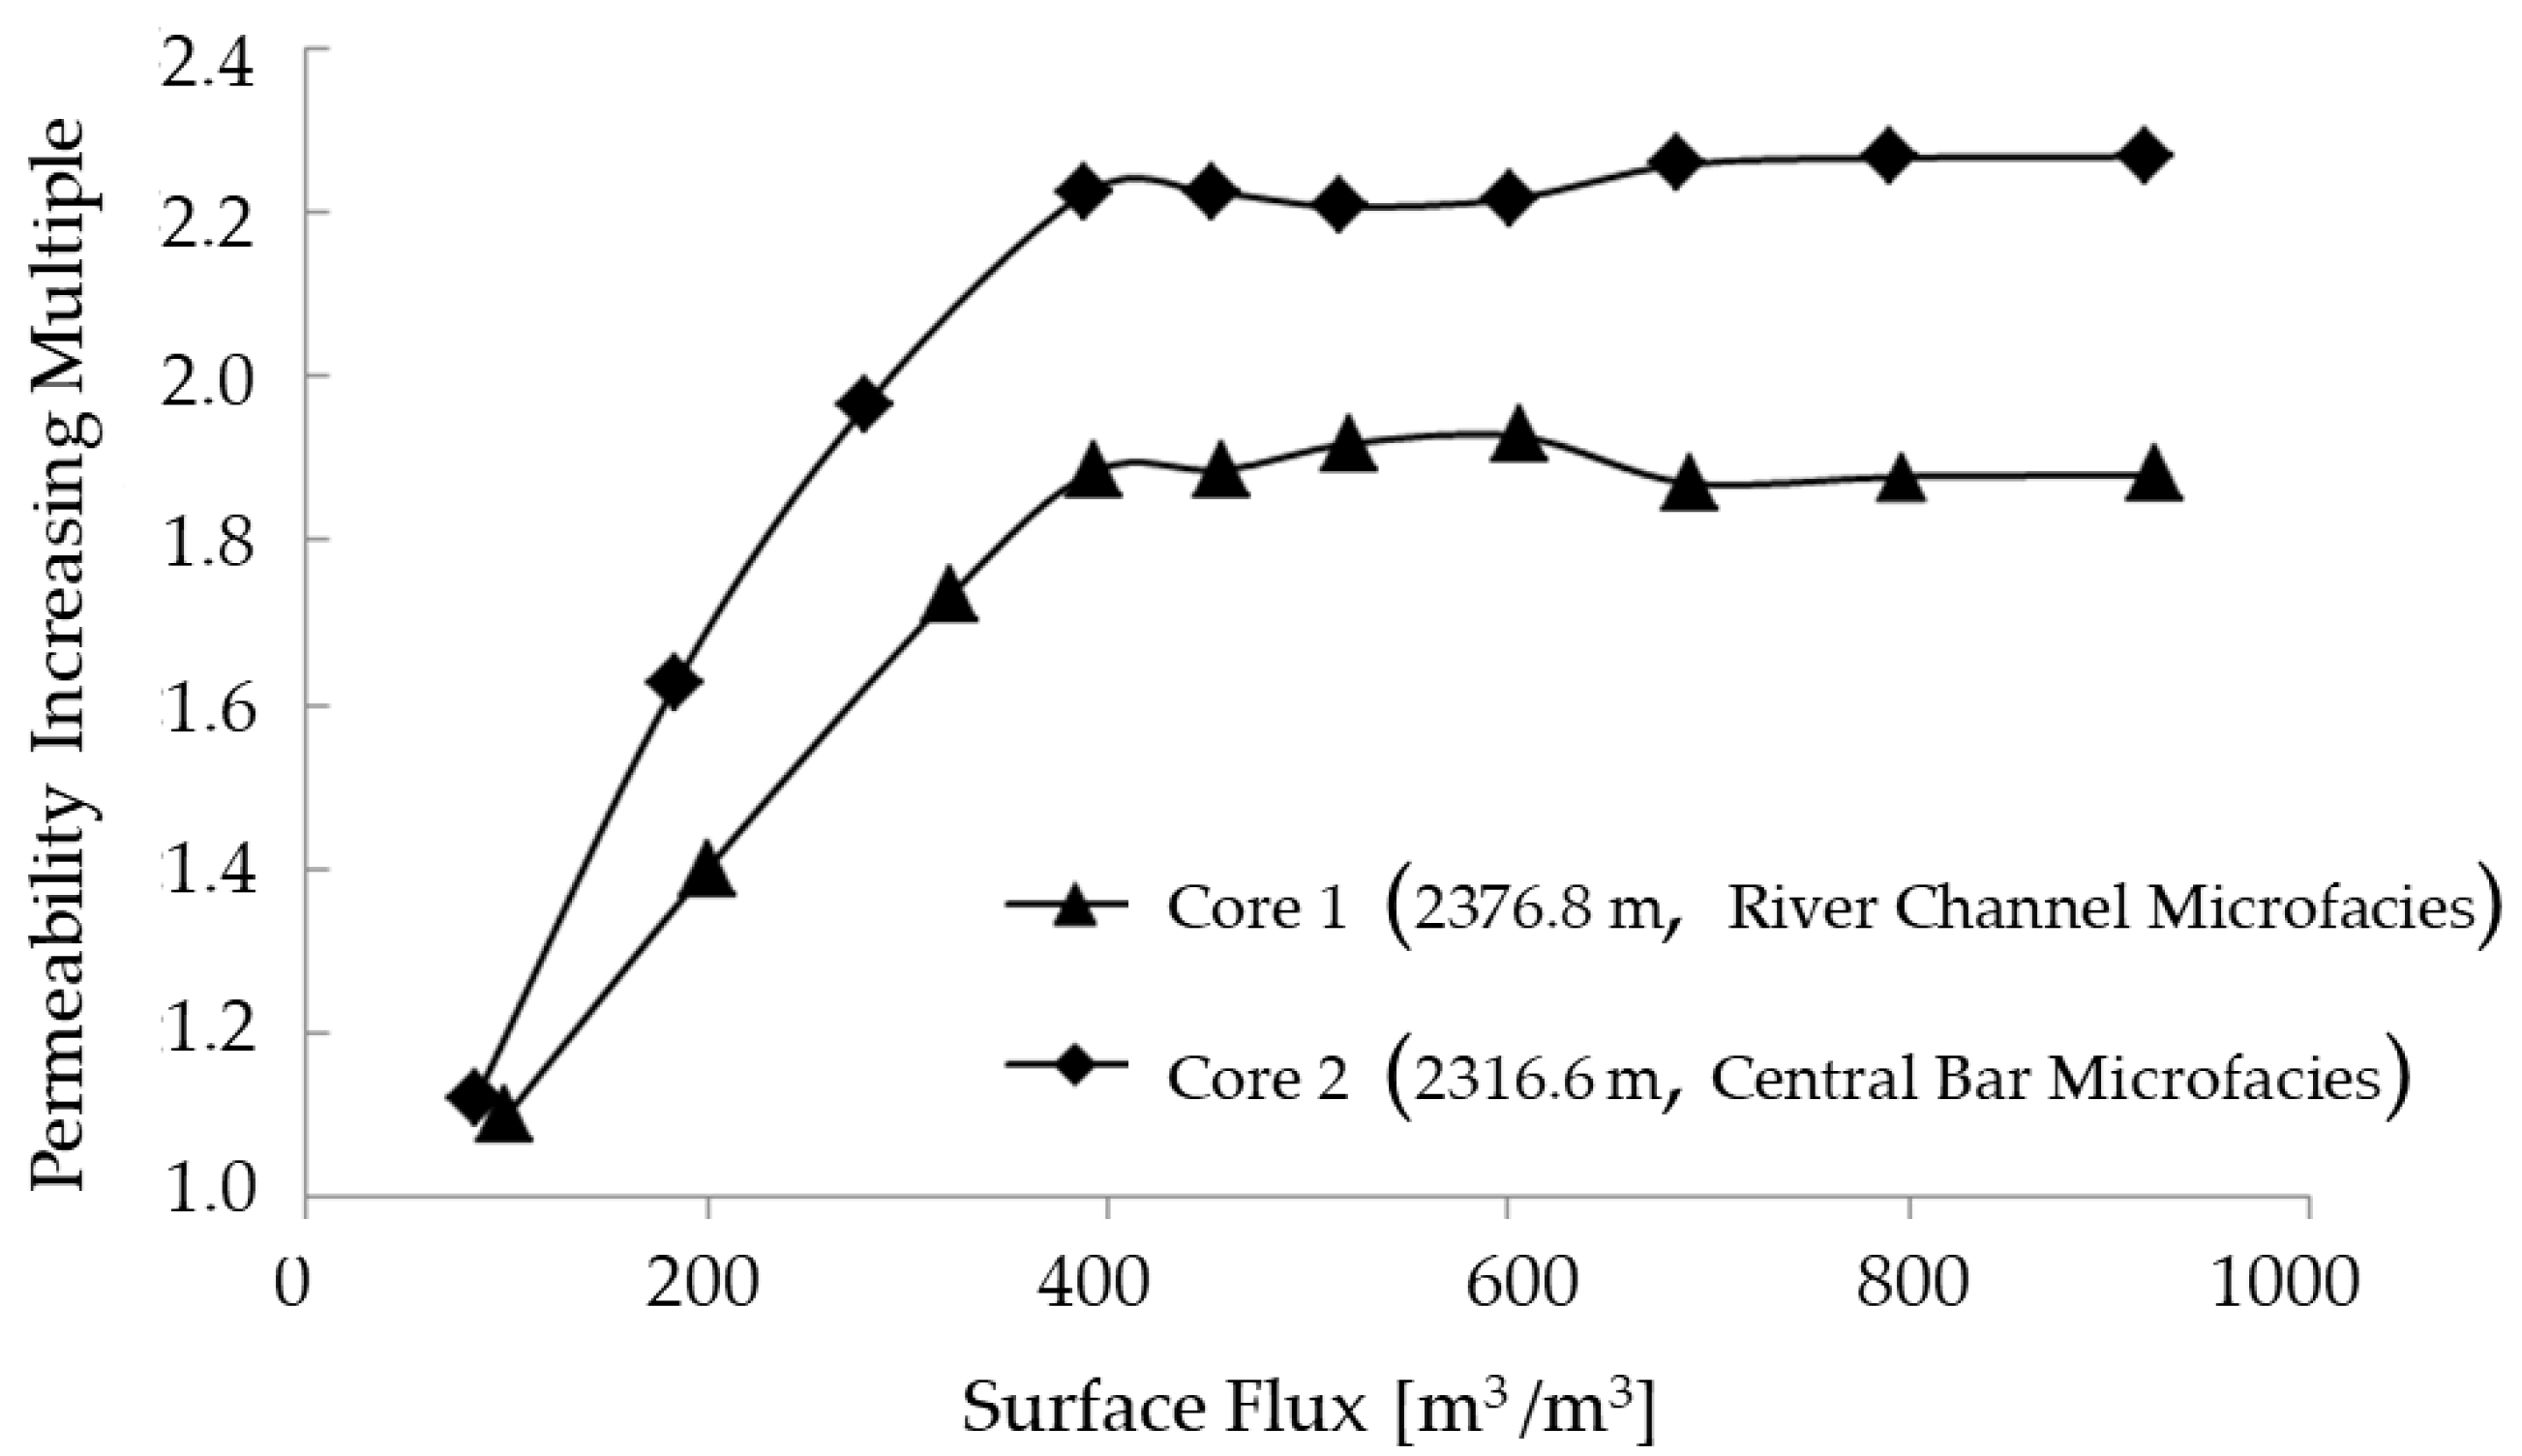
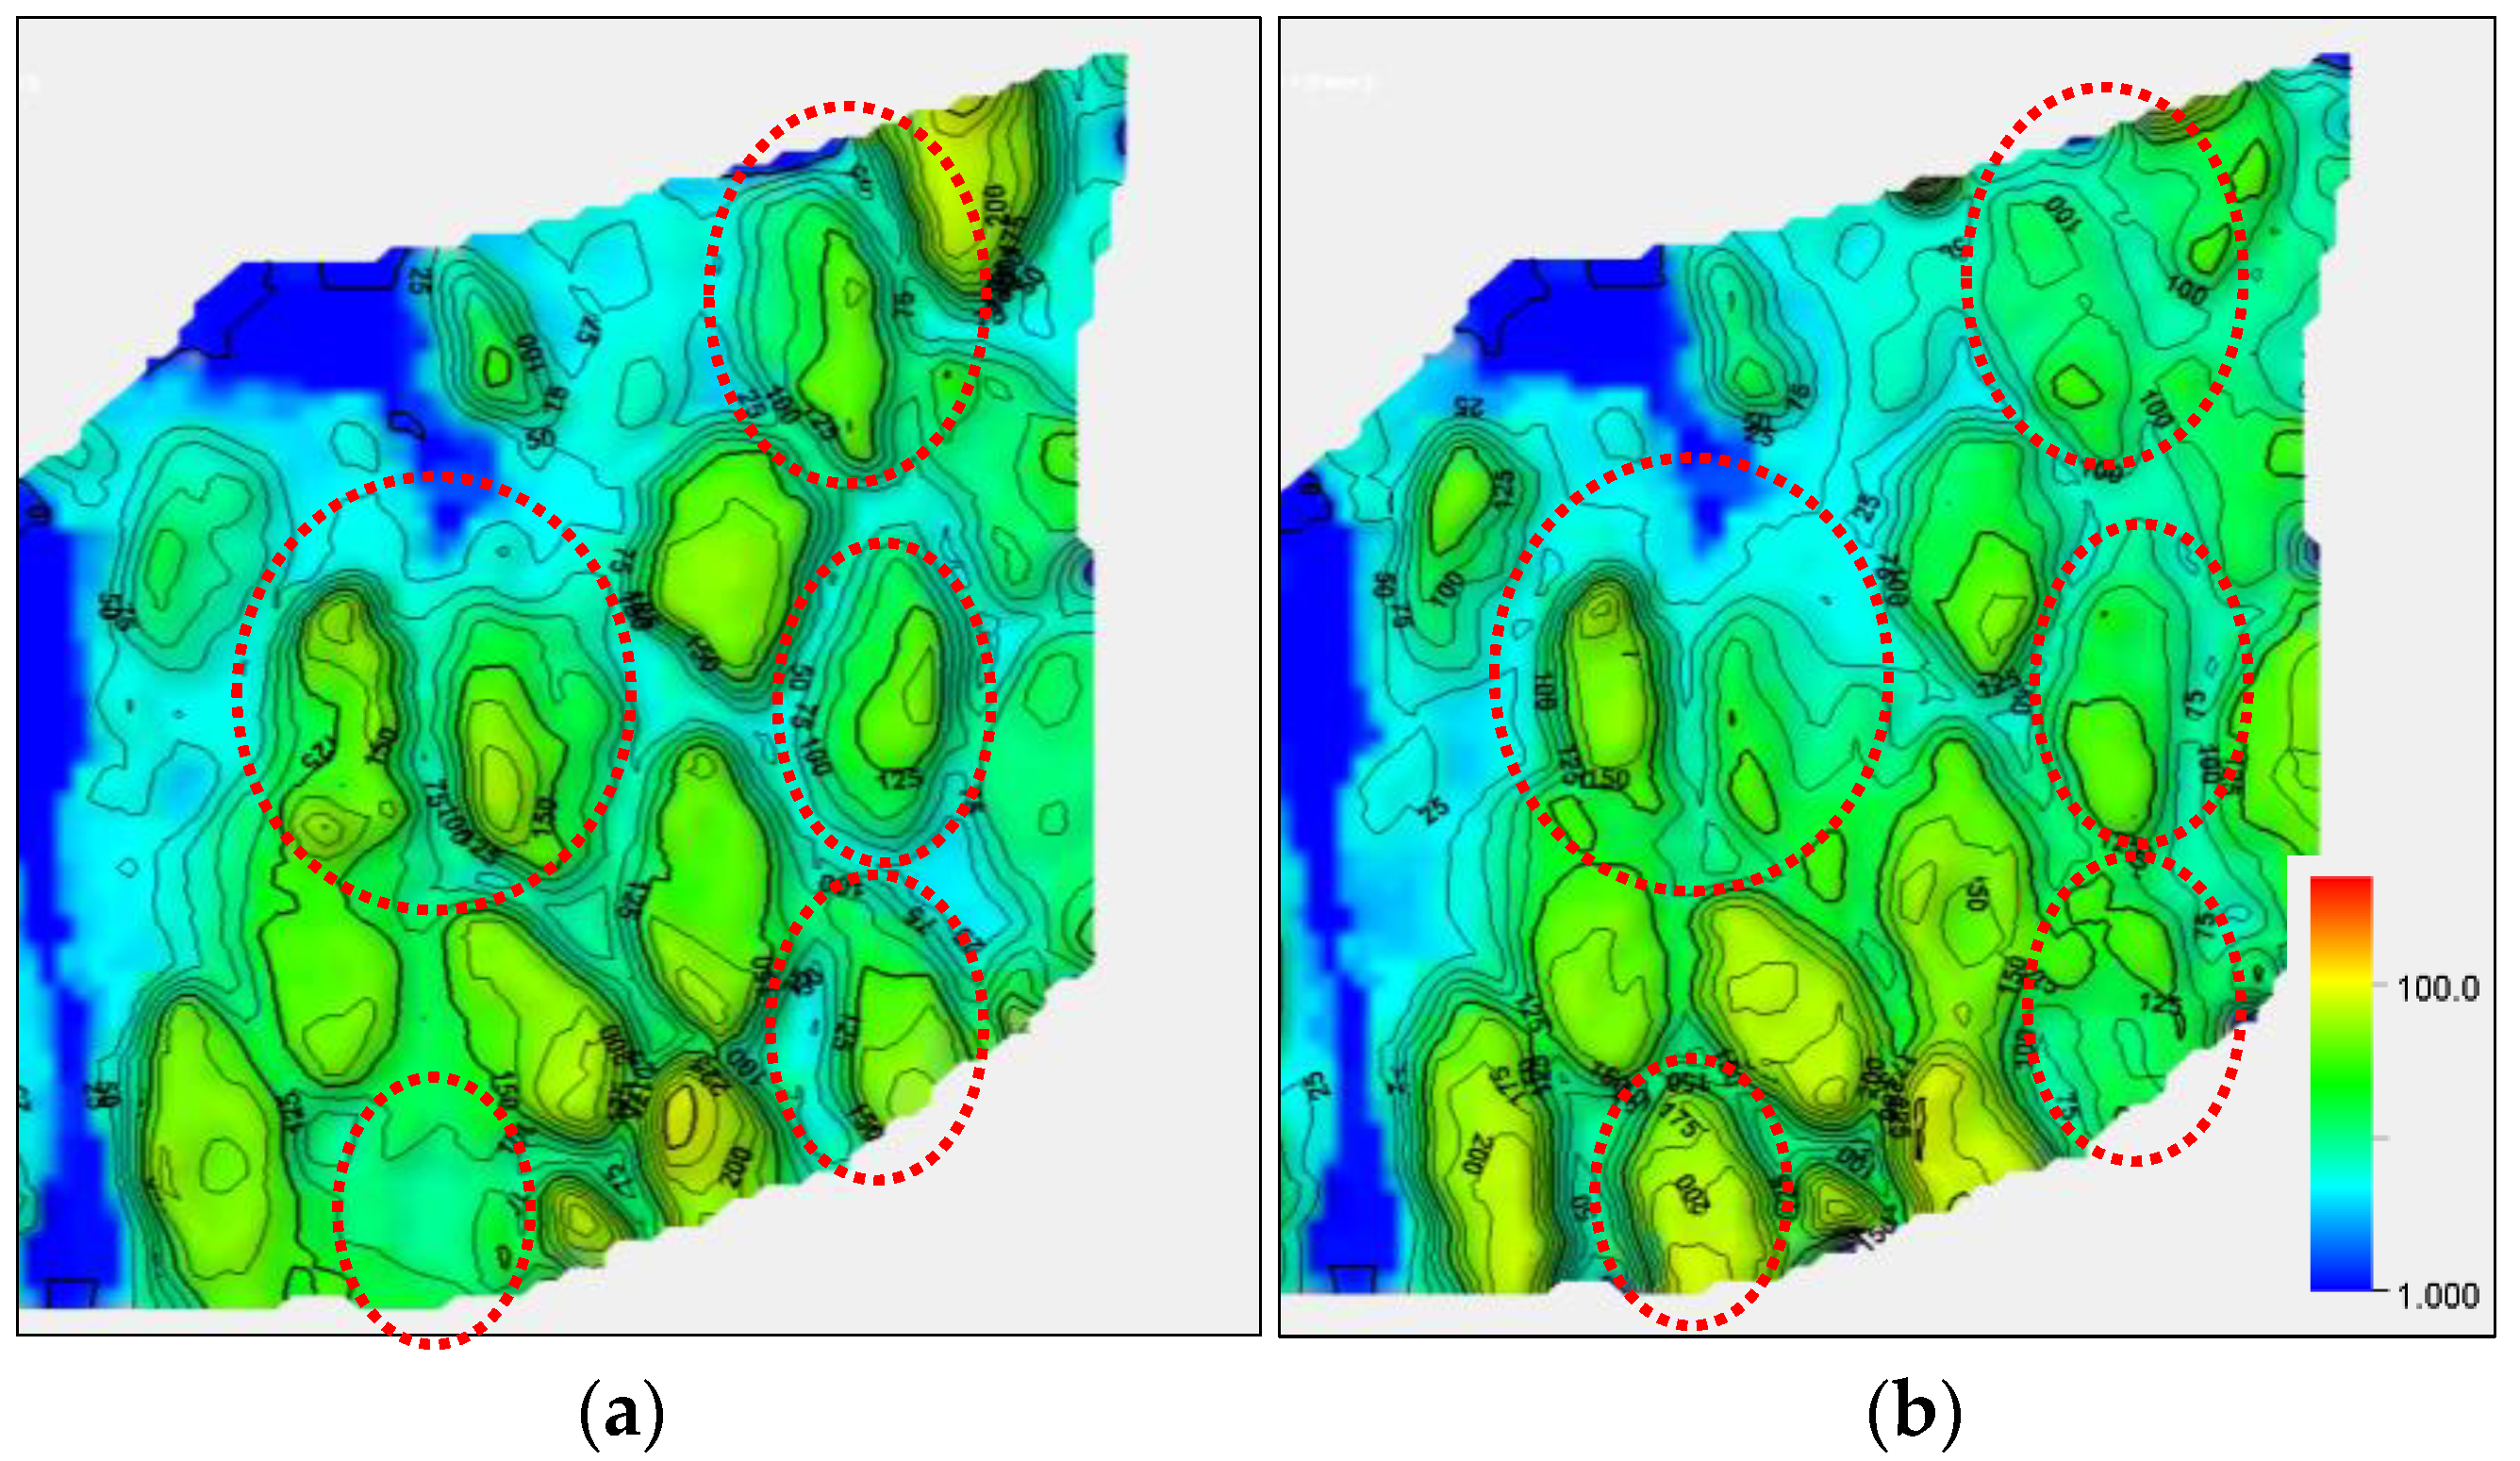
4.1. Time-Varying Characteristics of Reservoirs at Different Development Stages

The development process of the research area was divided into two stages based on the actual situation. The first stage is the stable production stage from 2007 to 2018, and the other stage comprises the liquid extraction stages between 2019 and 2020. The experimental data of the two cores during the stable production stage showed that the functional relationship between the increase in reservoir permeability and the true surface flux was an exponential relationship (Figure 2). The permeability of central bar microfacies rapidly increased by 2.2–2.4 fold when the surface flux was 100–400 m3/m2, and the permeability of channel microfacies rapidly increased by 1.8–2.0 fold. These parameters gradually plateaued after this stage. This effect can be attributed to a decrease in the content of kaolinite, a clay mineral in the reservoir, from 67.8–69.9% to 62.6% (experimental data of 25 samples) due to long-term water flooding. Moreover, the space between particles increased and the permeability and porosity significantly increased. The data of 89 water-flooded layers of 56 infilling adjustment wells and passing wells were chosen as sample points, and 13 sets of sand body data for 26 layers of pair wells were selected for comparative analysis.
The results showed the porosity of the stable production stage increased by 6–15% and the permeability increased by 20.2–210% after the oil layer was flooded (Table 1). Different sublayers exhibited different changes in physical properties after flooding. NP23-X17, NP23-X47, and NP23-X45 in Figure 3 are pair wells that were under production in 2007, 2013, and 2019, respectively. In the early stage, the permeability of II6-1 sand body increased from 185 × 10−3 μm2 (NP23-X17 well) to 265.6 × 10⁻³ μm2 (NP23-X47 well) due to edge water intrusion. The permeability increased to 360.6 × 10⁻³ μm2 (NP23-X45 well) after long-term flushing. The II6-2 sand body exhibited poor production due to unperforated and interlayers. The NP23-X17 well and NP23-X45 well did not show significant change, but an increase from 254 × 10−3 μm2 (NP23-X17 well) to 456.6 × 10⁻³ μm2 (NP23-X45 well) was observed at the later stage. The comparative analysis results showed that although the permeability of the two single sand layers increased, the evolution rule of permeability was affected by lithology, microfacies, physical properties, perforation location, development history, and the evolution history and rules were different. The original porosity of the II13 sublayer was 25.4%, and 27.4% porosity was observed after flooding, which was a 7.8% increase in porosity. The original permeability was 303 × 10−3 μm2, and the permeability after flooding was 481 × 10−3 μm2, indicating a 58.4% increase.
Moreover, the results showed that the porosity-permeability could significantly increase after liquid extraction or large liquid extraction. For instance, the original permeability of the III2 sublayer was 356 × 10−3 μm2, whereas the permeability after flooding was 486 × 10−3 μm2. The permeability of the strongly flooded layer after liquid extraction was 698 × 10−3 μm2.

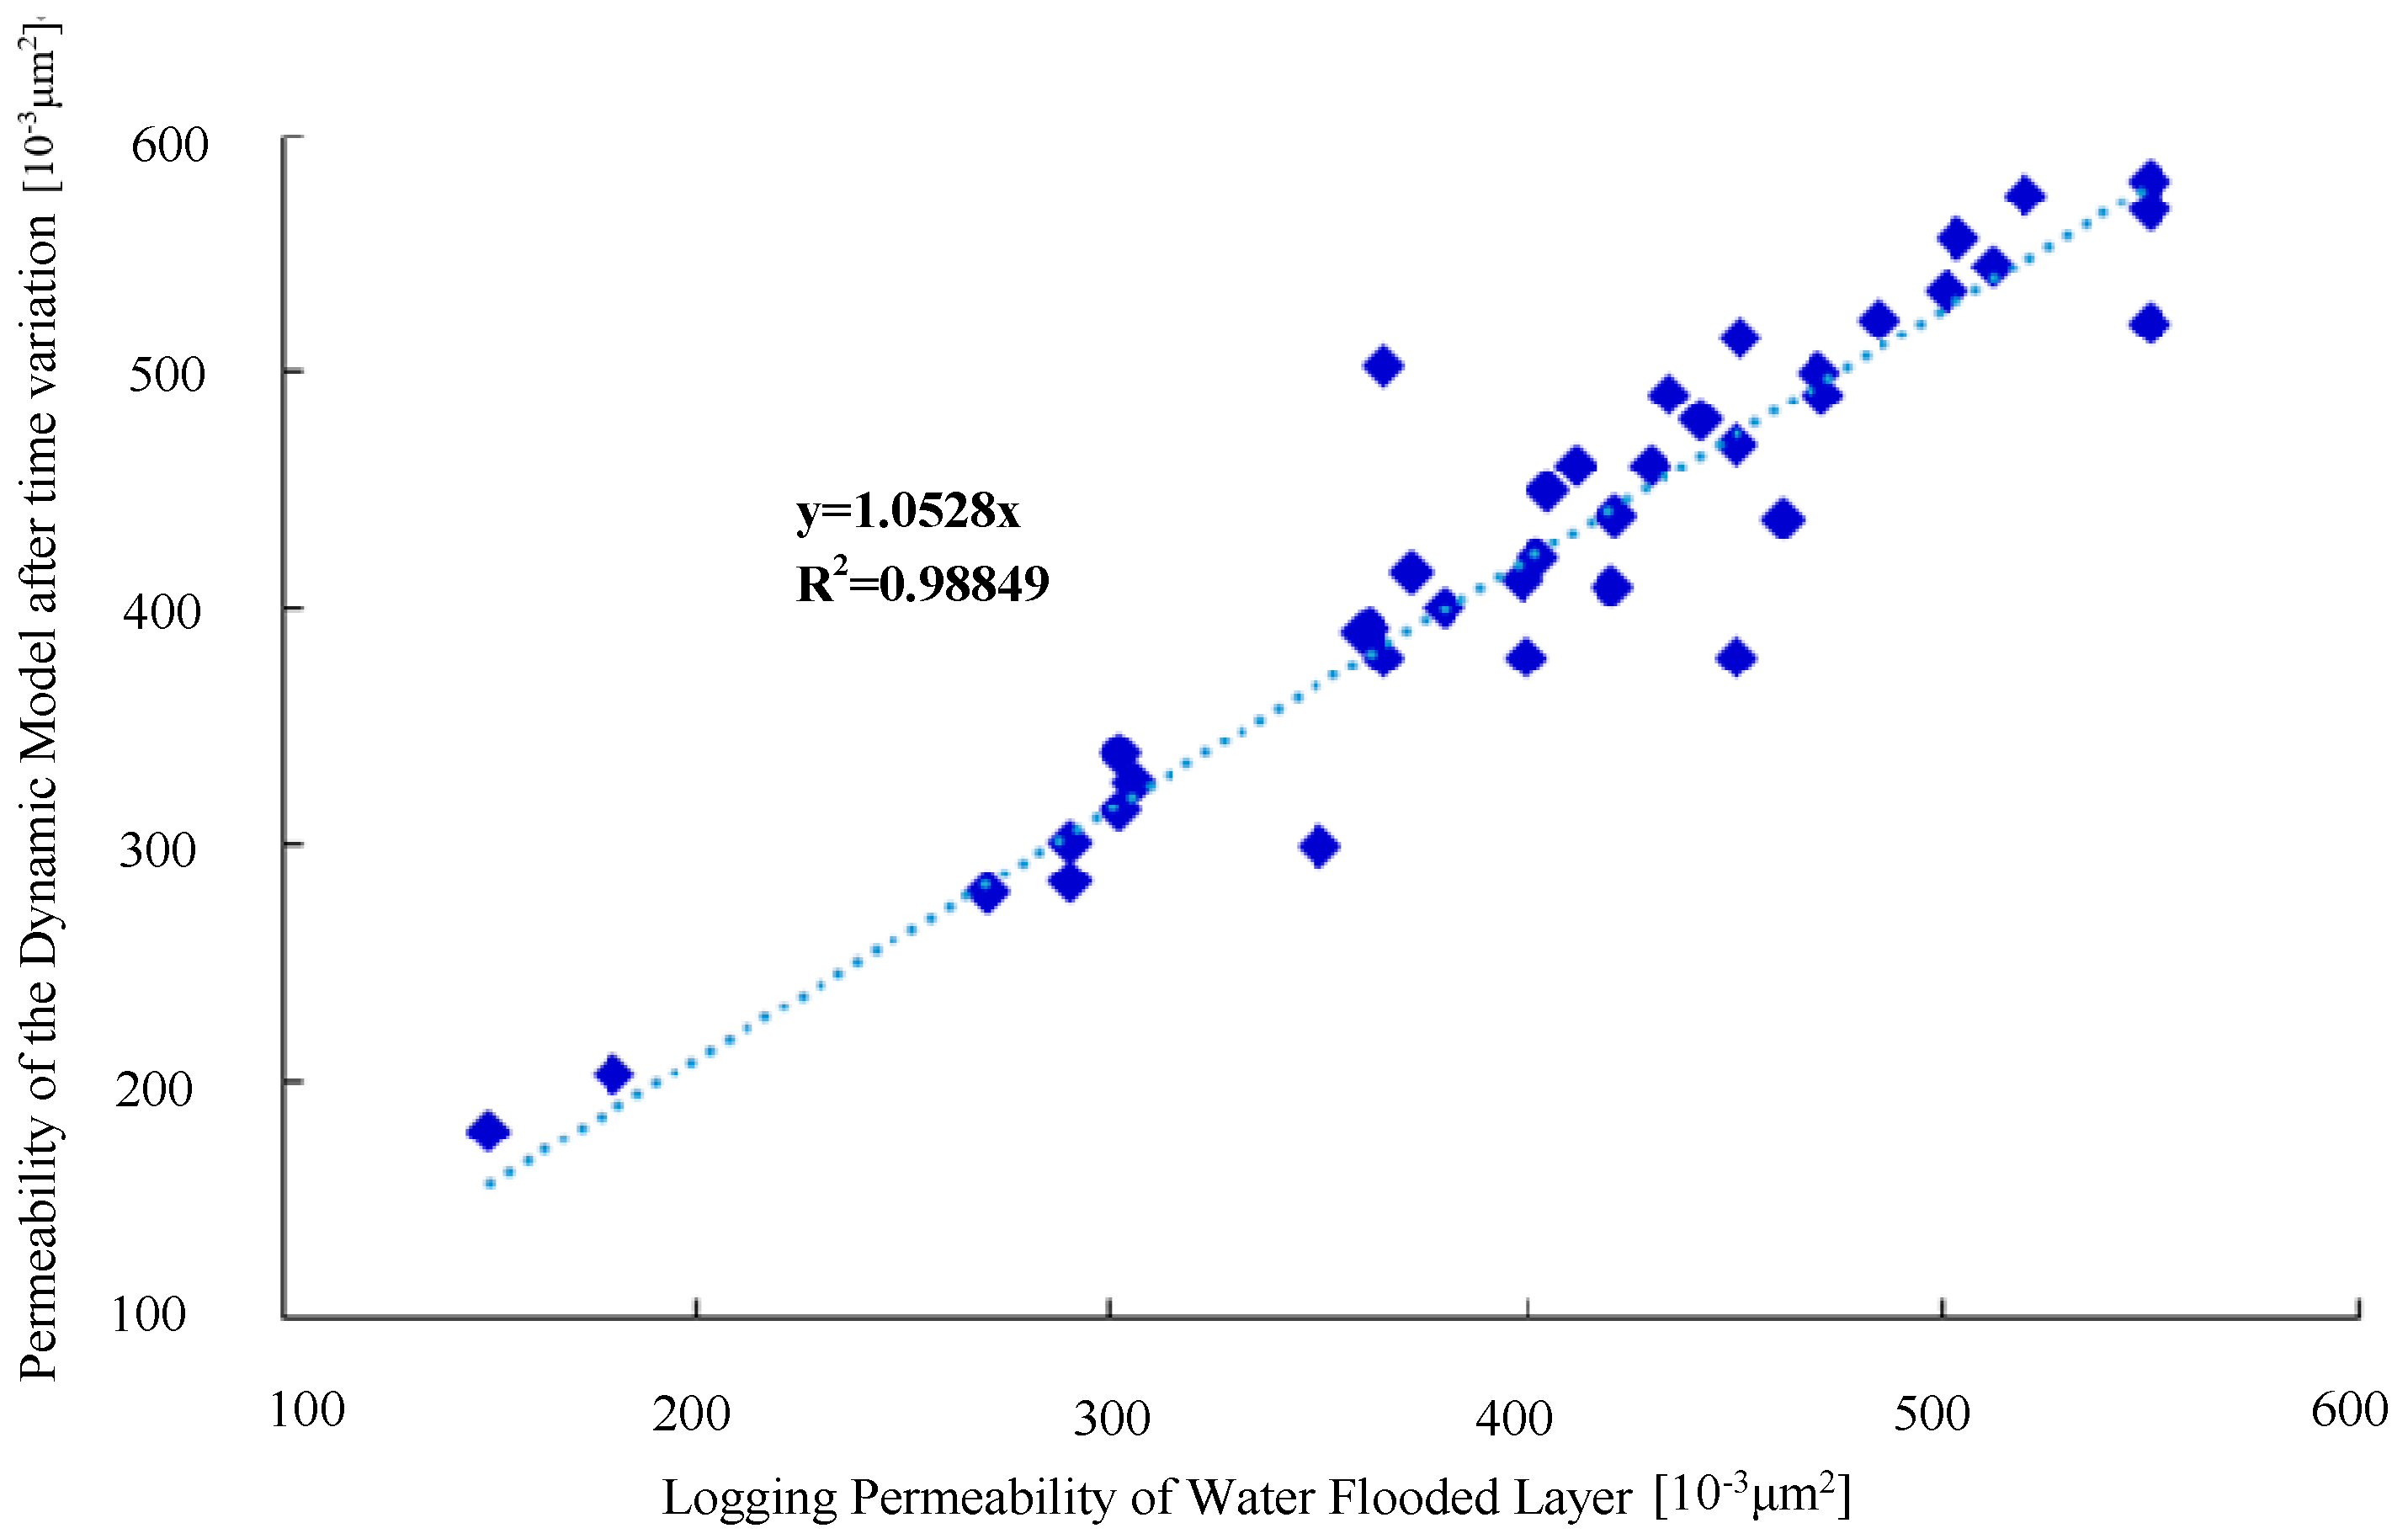
4.2. Recovery of the Logging Curve in a Water-Flooded Zone

Logging curve recovery of a water-flooded layer was defined as the process of recovering the permeability and porosity of the water-flooded layer in each period to the state before water flooding according to the water-flooding rule based on the logging interpretation and dynamic analysis. The purpose was to establish an original geological static model by simulation of the data for new and old wells. The theoretical basis of this simulation was that there was a significant regularity in time variation of the reservoir in each development stage [11,12,13]. This step comprised combining data for the new wells to the original starting point, ensuring that all new well information is utilized in the establishment of the initial geological model. The reservoir time varying effects and the dynamic variation of the reservoir were also classified into the research scope of the dynamic model to alleviate the problem of normalizing the spatiotemporal information of the water-flooded layer. Evaluation of the water-flooded layer in the study area was based on the logging curve, supplemented by the reservoir dynamic analysis. Interpretation of key physical parameters, such as permeability and porosity, was primarily based on cores. Quantitative interpretation models for different lithologies of different oil groups were subsequently established, and a comparative analysis was conducted under the same standard conditions. Recovery of the log curve of the water-flooded zone was divided into two steps.
The first step was to establish qualitative and quantitative relationships between the stages and levels of flooding [14,15,16]. The relationship between the porosity and permeability of the 26 water-flooded layers in 13 pairs of wells was separately established according to the two development stages of 2007–2018 and 2019–2020 (as shown in Figure 4). Subsequently, the well points of the water-flooded layer were divided into two categories according to the dynamic analysis and the characterization conclusion of the dominant seepage channel. The two categories included the dominant seepage channel (strongly flooded) and flanks of the dominant channel (medium and weakly flooded). The relationship between various flooding functions is shown in Table 2. The first function on the permeability change relationship in the case of strong flooding during the liquid extraction stage was Y = 132.35e0.0007X. The second function for the high flooded permeability during the stable water flooding stage was Y = 73.9e0.0022X. The permeability variation function for the medium water-flooding permeability was Y = 68.9e0.0035X.
The second step was to establish a recovery curve based on the quantitative relationship of well pairs and layer pairs. The plane distribution of dominant seepage channels in the study area was modulated by multiple factors, such as provenance direction, microfacies characteristics, reservoir heterogeneity, well pattern, structure, and water energy. The vertical distribution was affected by factors such as reservoir rhythm, lithology, body overlapping relationship, interlayer distribution, perforation location, development history, and development characteristics. Therefore, it was imperative to consider the basis as logging evaluation, the dynamic analysis conclusion of a single sand layer as the unit, and combine the distribution characteristics of dominant seepage channels, the degree of water flooding, the location of water flooding, and the relationship between new drilling and dominant seepage channels. Different recovery curves for the permeability and porosity of the water-flooded layer were established. The study area was divided into weak flooding, moderate flooding, high flooding, and strong flooding according to the level of flooding. The criteria were as follows:
(1)
The permeability of the strong water-flooded layer above the dominant seepage channel was recovered using Equation (1).
(2)
The water-flooding degree of the seepage channel side wells should be checked, according to the characteristics of the logging curve and the comprehensive analysis of adjacent wells, to determine whether to conduct recovery or not. Equation (3) denotes the recovery relationship for the permeability of the medium water-flooded layer.
(3)
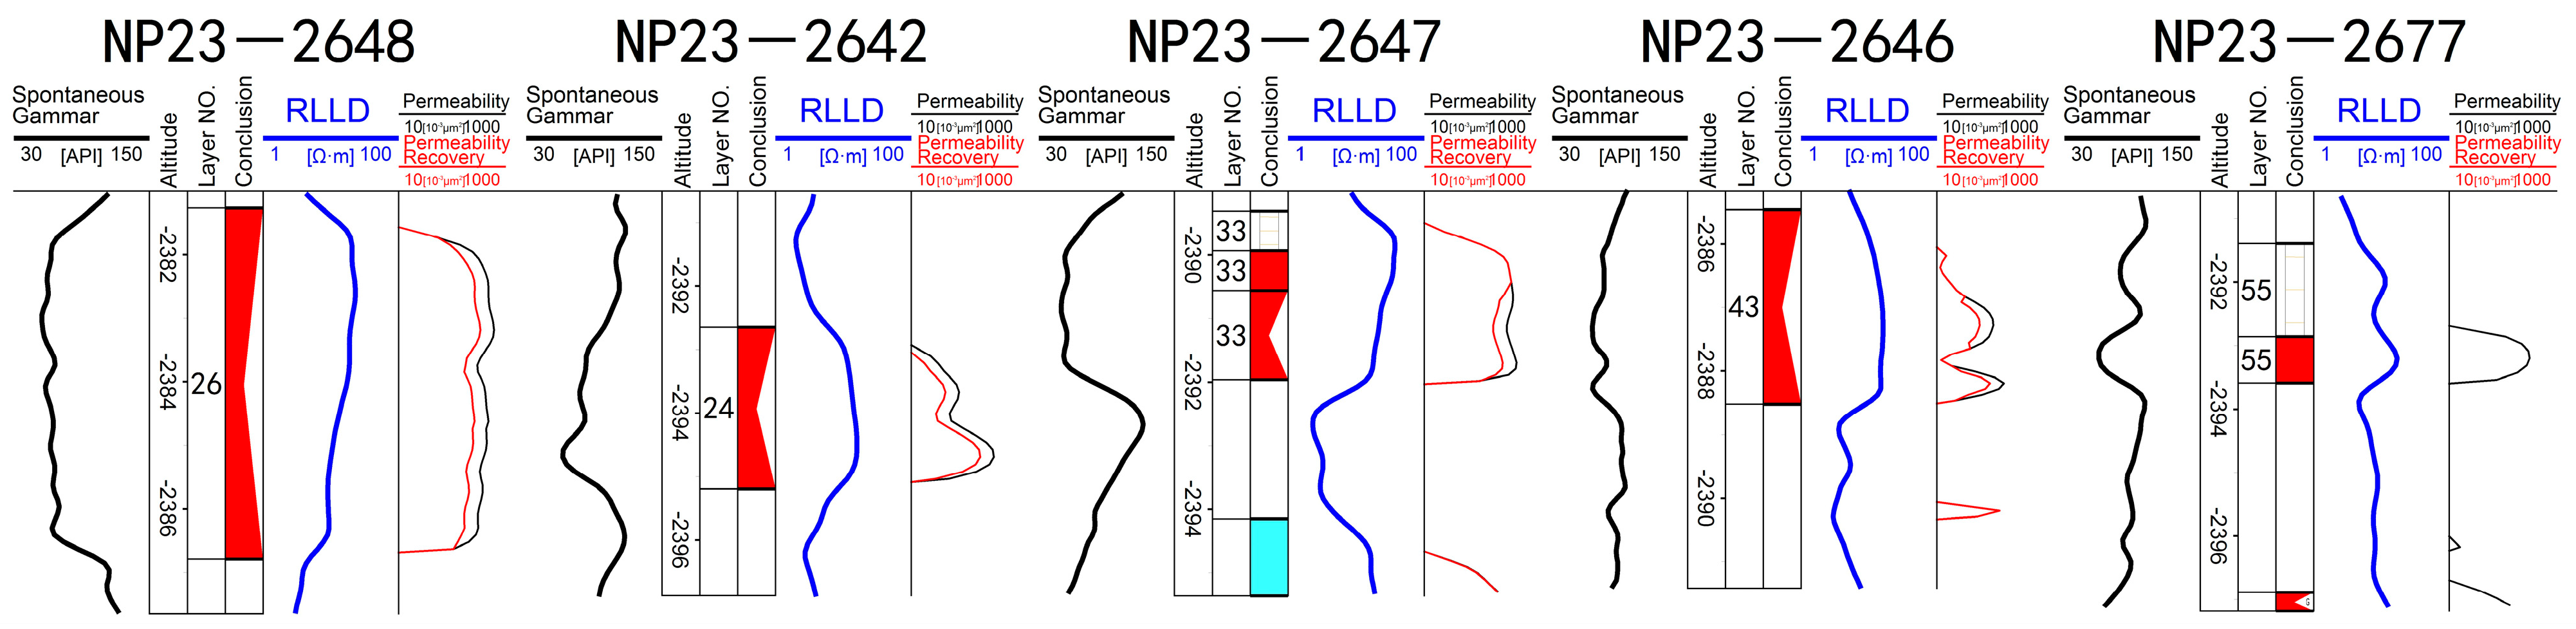
The flooded part in the layer should be recovered, and the non-flooded part should not be recovered, as shown in the No. 33 layer of well NP23-2647 in Figure 5.
(4)
Recovery of the top of the positive rhythm channels sand body depends on the water flooding status and degree. The No. 43 layer of well NP23-2646 was presented as a water-flooded layer (Figure 5). However, static and dynamic comprehensive analysis indicated that the top of the well was not flooded due to poor physical properties and low resistivity. Thus, the top of the well was not recovered.
Figure 5. Comparison of calculation results before and after recovery of the II13 permeability logging curve.
Processes 11 00189 g005
It is imperative to accurately conduct the verification of the flooding degree during the entire analysis and recovery process based on dynamic analysis. Different situations should be treated differently, and the following four aspects should be considered during the process.
(1)
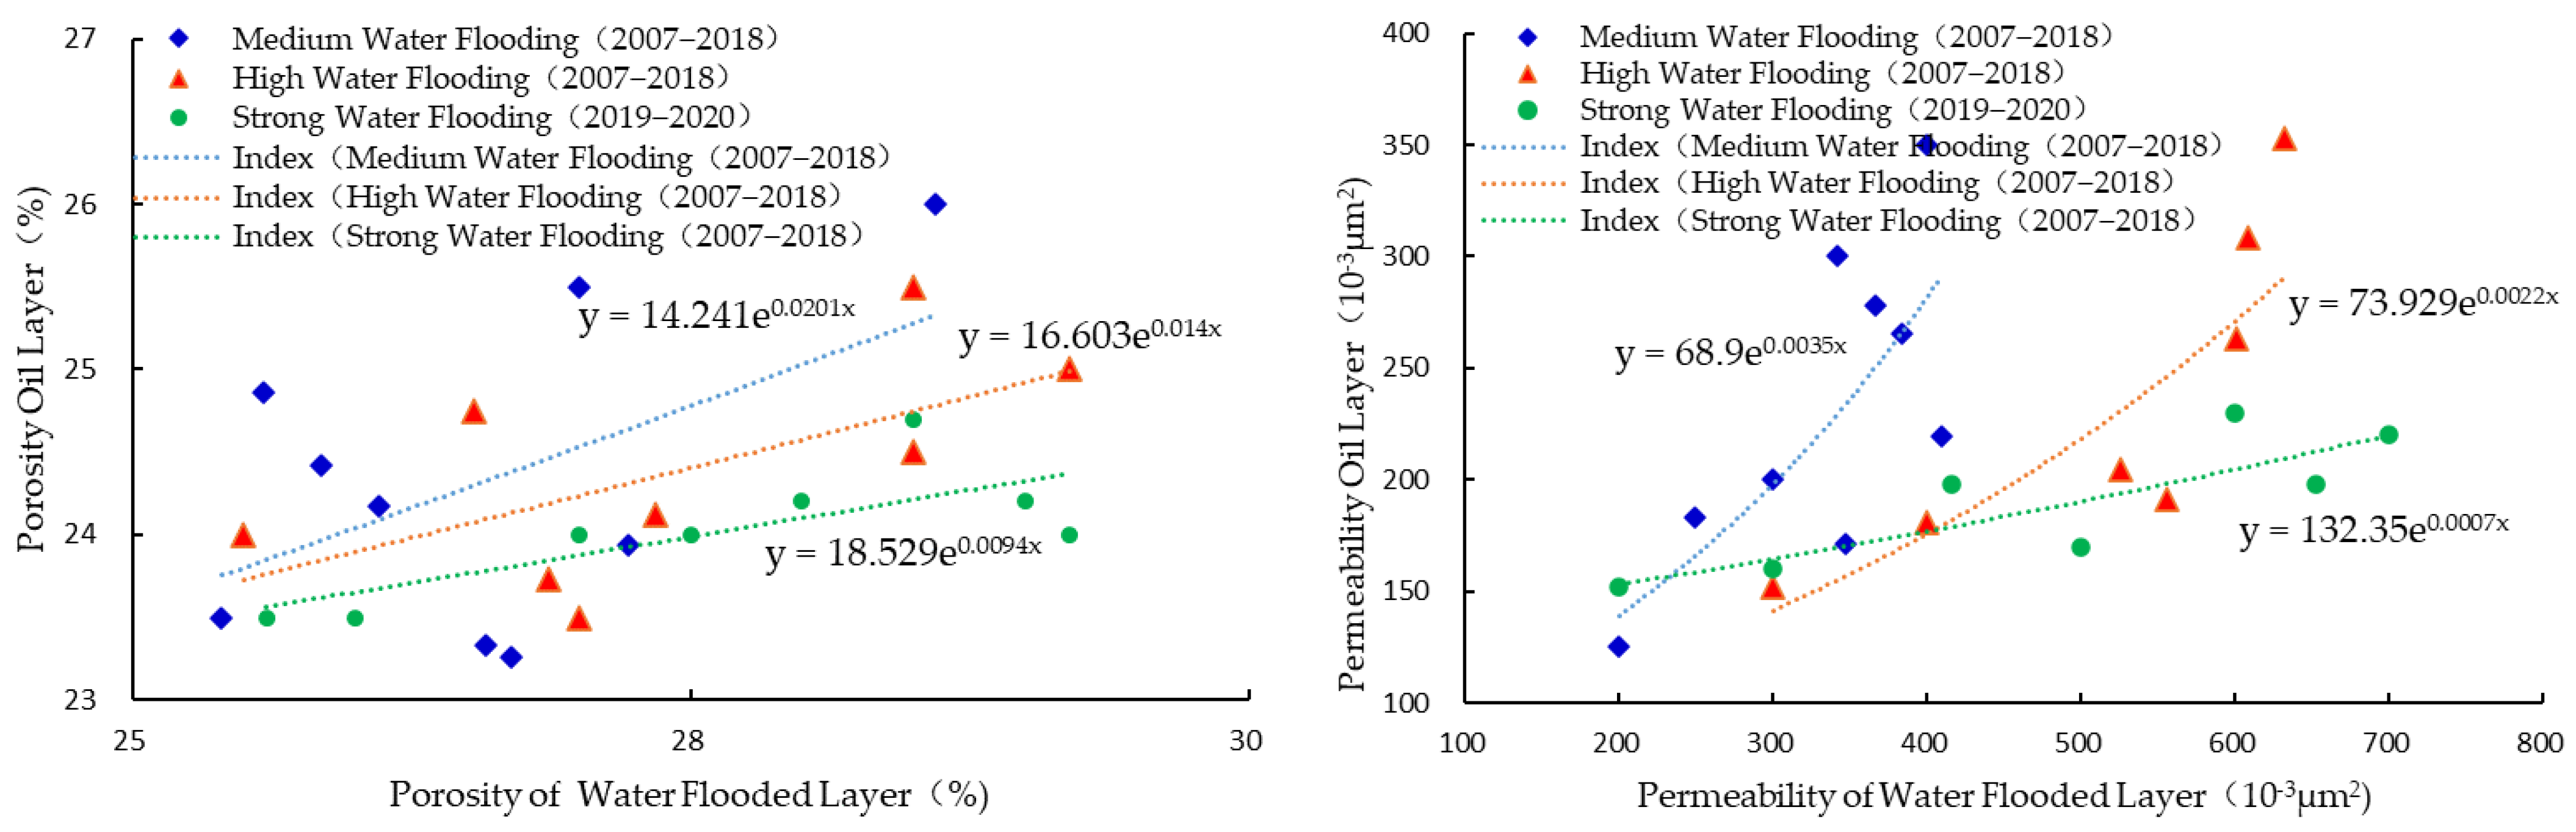
The distribution of reservoir physical properties at different base levels and different locations was considered vertically based on the geological reservoir characteristics. Different quantitative recovery relationships should be established for the different oil groups according to the oil group division results obtained using the logging interpretation model.
(2)
A quantitative recovery relationship can be established by classifying different sedimentary microfacies to improve the recovery accuracy if the logging data is abundant.
(3)
It is necessary to consider the differences between different dominant seepage channels, distinguish primary and secondary, and strong and weak channels according to their effect on the distribution of the remaining oil in the reservoir, and explore the relationship between well points and locations of dominant seepage channel in the water-flooded layer.
(4)
The logging facies, lithology, and rhythm characteristics of the reservoir should be considered, and the water-flooded status of different parts of the same sublayer should be comprehensively evaluated. The difference between the reduction of resistivity curve caused by the thinning of lithology in the middle and upper part of fluvial facies reservoir and the reduction of resistivity after water flooding should also be determined. Details on the composite rhythm logging curve of the superimposed sand body should be highlighted. Different parts of the same sublayer should be considered in sections.
Poor correlation and large differences in sample points may be encountered when establishing a quantitative relationship for the first time. Therefore, the process should be repeated, correlated, iterated, and optimized several times, which is a rough-to-fine process.

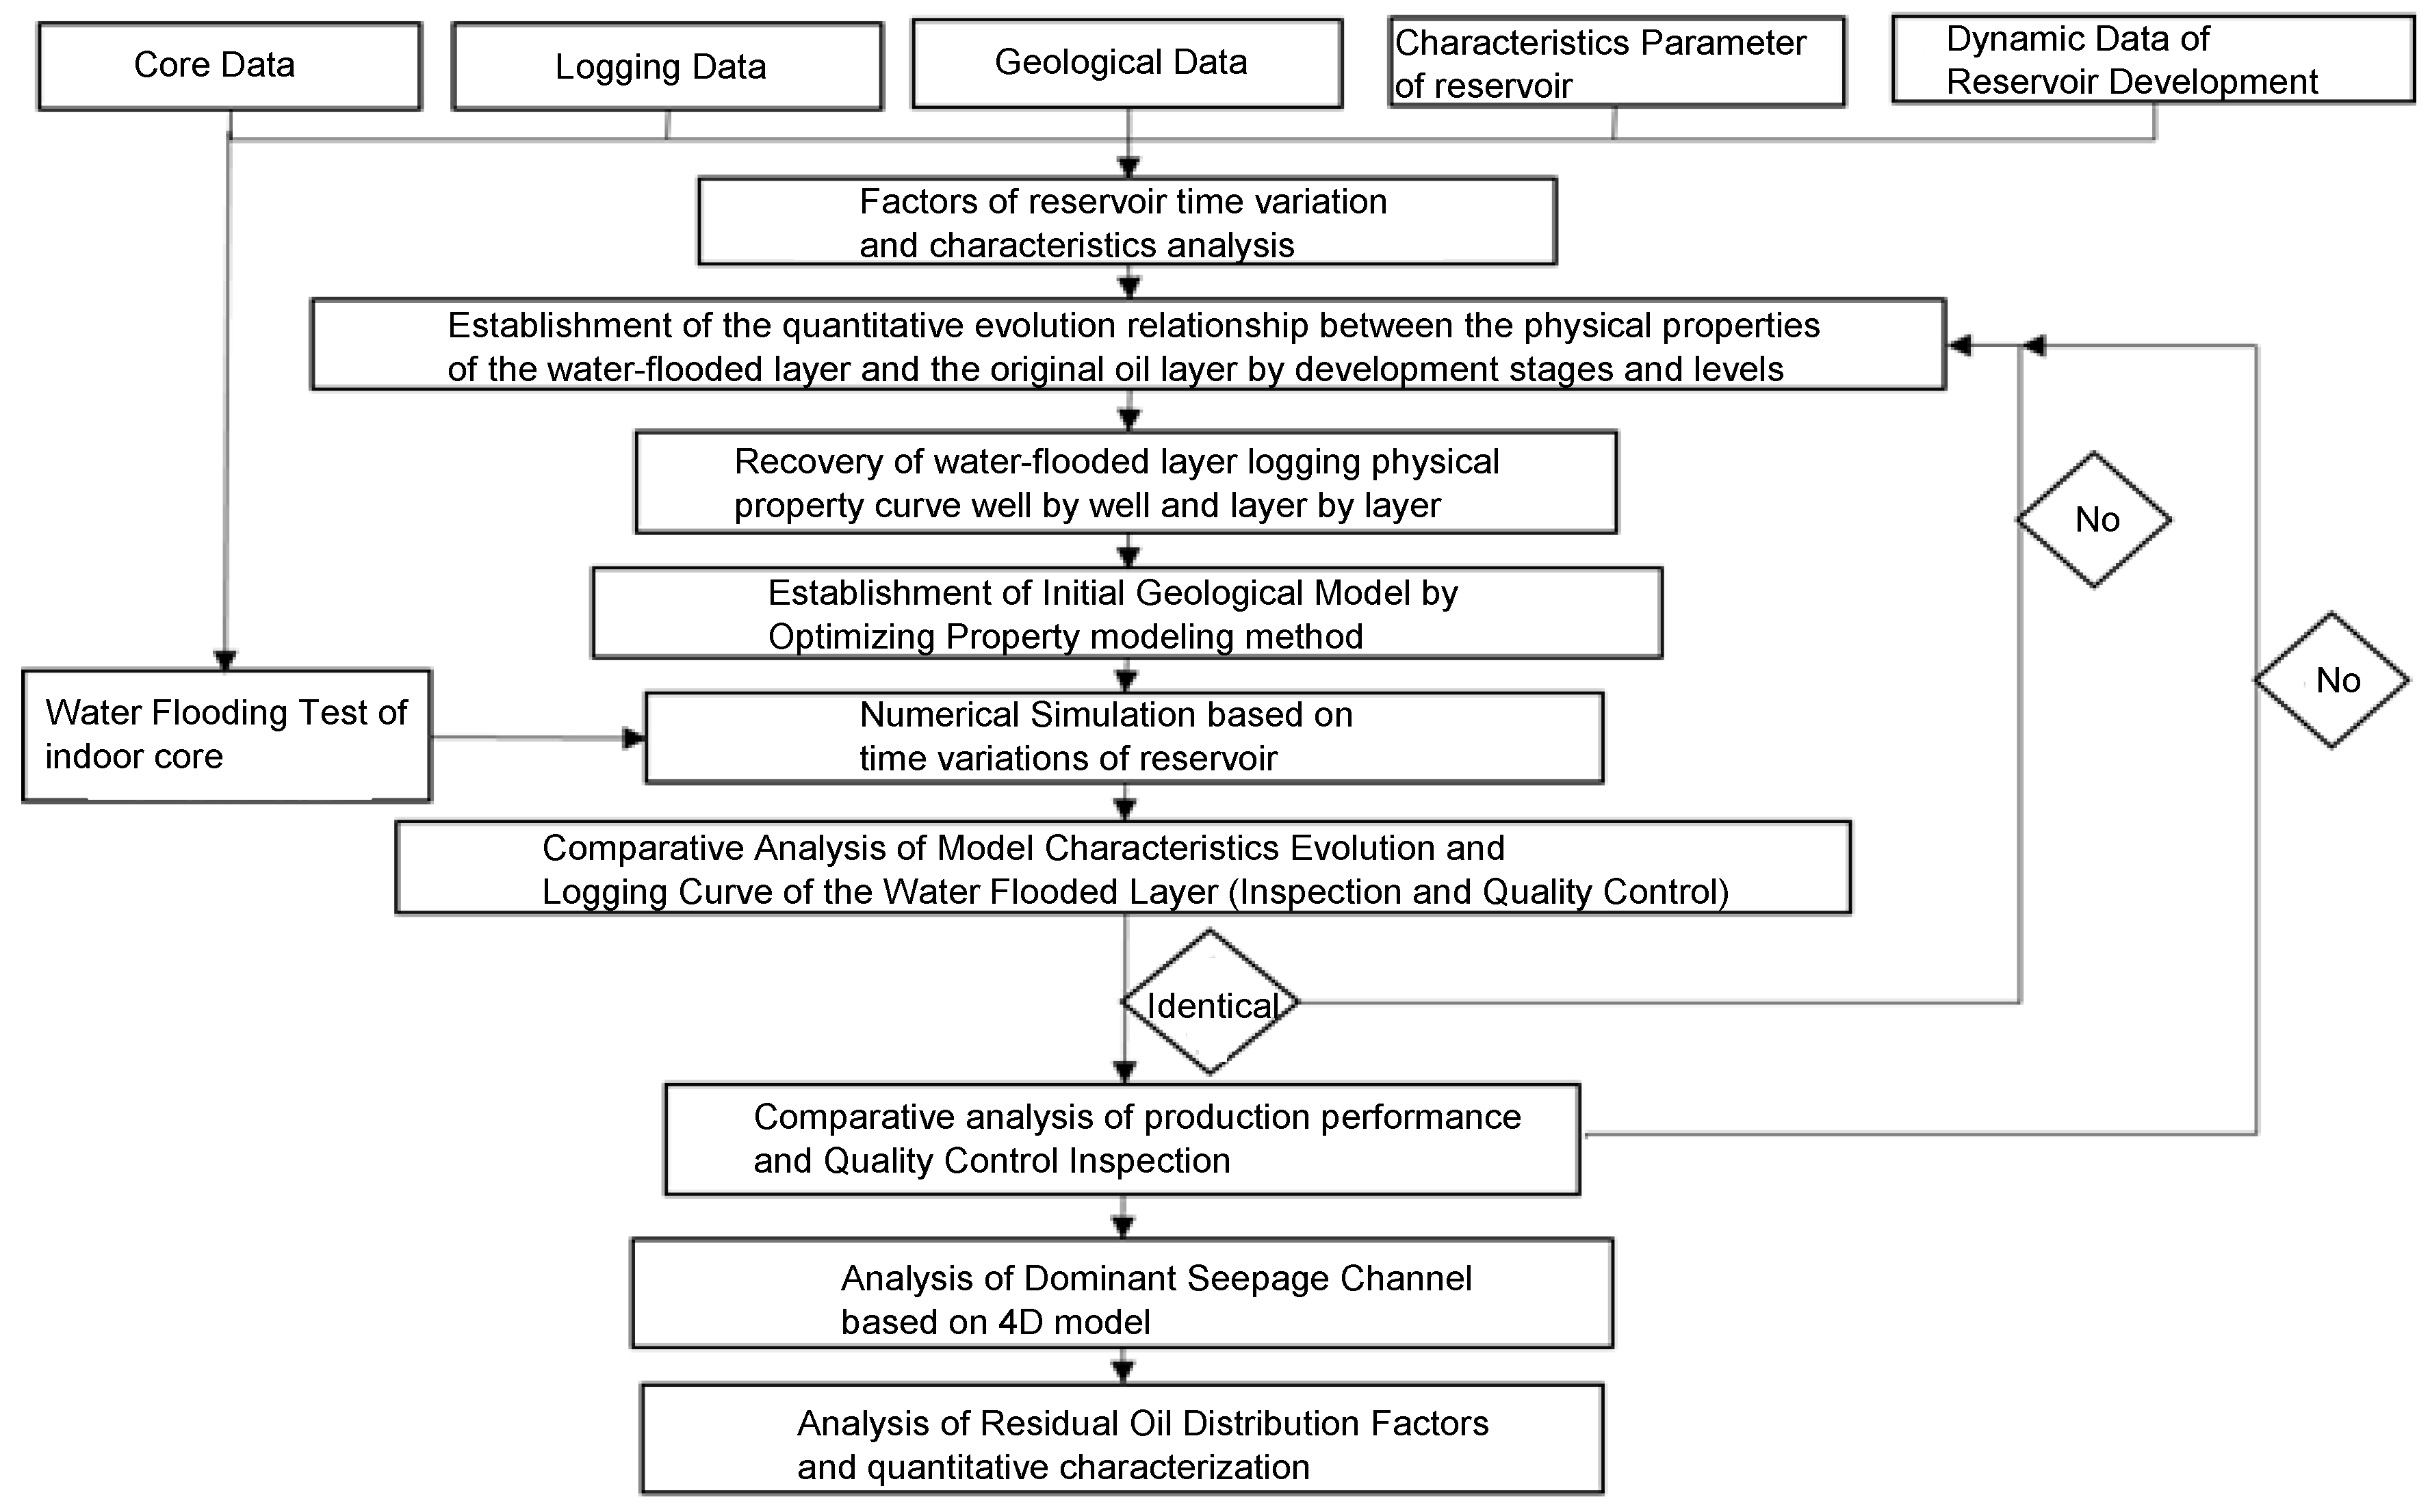
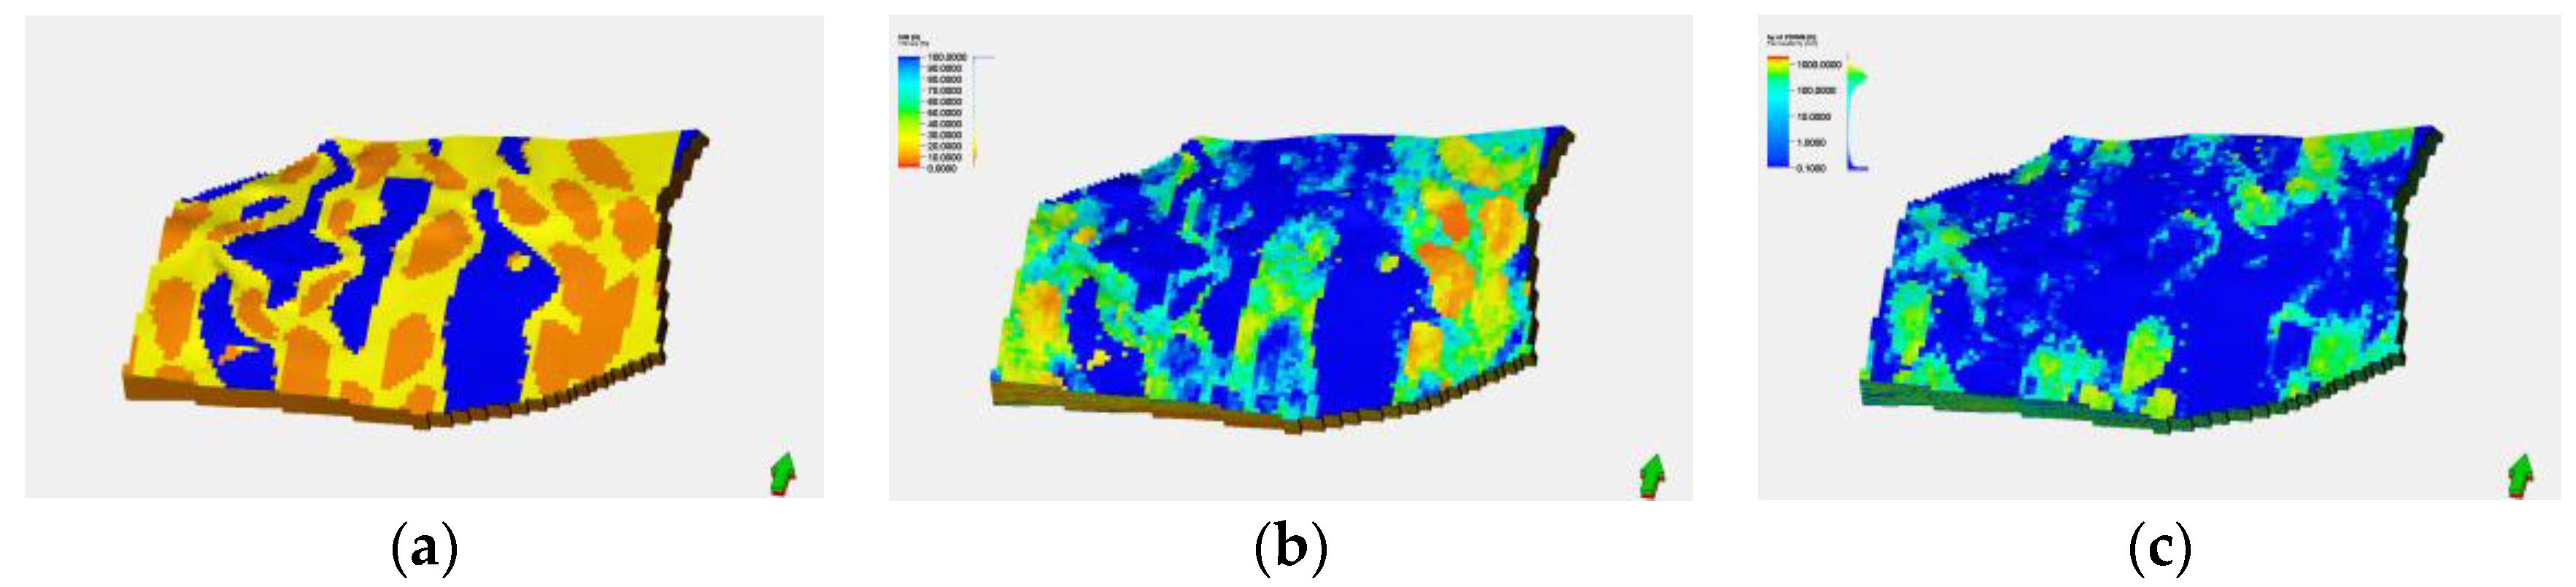
4.3. Initial Construction of the Fine Geological Model

The concept of facies-controlled geological modelling was applied for the present study area. The sequential Gaussian method [17,18] was used to establish the initial fine geological model of permeability and porosity. Comparison of the calculated results of the permeability of the geological model before and after the recovery of the water-flooded layer curve showed significant difference between the two (Figure 6). The difference in the location of the flooded wells was attributed to the increase in the permeability level of the flooded wells. A significant difference was observed between the wells, mainly due to the influence of the large size of the water-flooded layer area, resulting in changes in the distribution of model geostatistical sample points. The model interpolates and predicts data between wells using an algorithm, resulting in differences in the calculation results of the model between wells. The results showed that effective adjustment of infilling and passing wells is associated with richer water-flooded layer data. Moreover, this leads to a significant difference between the results of the ‘retreat as the advance’ modeling concept and the traditional modeling results of the old differentiation stage, which is close to the practical situation. The water-flooded layer data were used as the basis for quality control to evaluate the rationality of the geological model after the reservoir time-varying effects and reservoir variation were classified into the category of numerical simulation. This method circumvents the multi-solution and uncertainty between wells caused by several dynamic factors in the staged modeling concept.
The initial fine geological model of the shallow fluvial facies in Nanpu 2–3 block was jointly established using data from old and new wells (Figure 7), which showed that the similarity of reservoir properties within the same microfacies and the differences between different microfacies reflects changes in vertical and horizontal reservoir properties. Phase-controlled simulation of the physical parameters, such as shale content, porosity, and permeability of a single sand layer, indicated that the lateral connectivity of sand bodies in the cycle dominated by the ascending hemicycle changed from good at the bottom to poor at the top. The physical properties of the developed branching river based on the end of the base level cycle, the central bar and side bar on the plane were better compared with the channel microfacies. The model results are closer to the geological conditions.

4.4. Numerical Simulations Based on Time-Varying Characteristics of the Reservoir

Several methods have been established to improve the accuracy of numerical simulation history matching [19,20]. The numerical simulation technology based on reservoir time-varying characteristics has been utilized for more than 10 years [21,22,23,24]. The function for the mathematical model was developed from the relationship between the physical properties and the multiple of water passing to the relationship between the physical properties and the surface flux. In this study, the concept of ‘bringing in and solving’ was adopted to circumvent the limitation of the time-varying effect in the numerical simulation of reservoirs. The functional relationship between the surface flux in the study area and the physical parameters of the reservoir was obtained through laboratory experiments (see Equation (1)). Subsequently, the functional relationship among the water flow Qi, Qj, Qk in the three directions of the known quantity grid in the mathematical model, the size of the model grid (dx, dy and dz) and the surface flux (see Equation (2)) was established. The permeability for each time step of the model was then presented as the aerial flux as a function of the original permeability k M and k r P M . Equations (1) and (2) were substituted into the conservation Equation (3) in the model. A mathematical model with continuous calculation that can introduce the time-varying law of the reservoir was established using the tNavigator20.4 software platform. The other definite solution conditions and auxiliary equations were not changed. The specific equations are presented below:
K M = 0.336 l n M 0.3656
  M = Q i dydz + Q j dxdz + Q k dxdy  
t ϕ N c = div P = O , W , G x c , P ξ p k M k r P M μ P P P γ P D + q c  
where, ϕ represents the porosity, %; x c , P denotes the number of moles of component c per mole of p-phase; ξ p indicates the molar density of p-phase under standard conditions, kg/m3; k M represents absolute permeability, μm2; k r P ( M ) indicates the relative permeability of p-phase with surface flux as independent variable, μm2; P P denotes the pressure difference of the p-phase, MPa; γ P represents the vertical pressure gradient of the p-phase, MPa/m; D indicates the vertical depth, m; Qi, Qj and Qk represent the cumulative water flow in three directions of the grid, m3; dx, dy and dz denote the dimensions of the grid in three directions, m. The porosity solution for each time step in the model was similar to the permeability and is not presented. The time-varying phase permeability curve was a key element of the reservoir time-varying characteristics. An increase in aerial flux was associated with regular shifts in the relative permeability of oil and water. Multiple sets of phase permeability data under different plane fluxes were obtained through the experimental data. The experimental data for the study area showed (Table 3) that the irreducible water saturation of the phase permeability curve increased, whereas the isotonic point and residual oil saturation slightly decreased. The permeation curve data under different surface fluxes of each grid node were numbered during the process of numerical simulation, and then the program was written. The corresponding relative permeability curve data was uploaded through the data change of the grid surface flux and were substituted into the dynamic model for calculation of each time step; the dynamic model parameters under the time-varying phase permeability curve were obtained.

4.5. Quality Control Based on Monitoring and Dynamic Data

Quality control analysis based on new drilling logging data and dynamic data is important in 4D model research. Firstly, the macroscopic law of model reservoir time-varying effects should be analyzed. The evolution process of the permeability model profile of the II6 sublayer passing through the dominant seepage channel after model history matching (Figure 8) showed that the permeability of the middle and lower parts of the positive rhythm reservoir gradually increased with increase in water flow, and a dominant seepage channel was formed at the final stage. The flooding status of the model effectively reflected the effect of the interlayer on the propulsion of the water body. The internal heterogeneity of the reservoir was accurately represented by the effect of geological model changes. Secondly, the measured physical parameters of the water-flooded layer of the new well were used as the quality control data, and the results of each stage of the prediction model were compared and analyzed to determine the accuracy and reliability of the geological model and dynamic model to accurately reproduce the changes in reservoir characteristics in the final stage. For example, oil wells 23–68 and 22–03 were flooded in the dynamic model and the calculated results were 452 × 10−3 μm2 and 468 × 10−3 μm2, and the logging interpretation of the two wells were 426 × 10−3 μm2 and 482 × 10−3 μm2, implying that the two were basically the same.
A cross-plot of permeability data of 37 practical water-flooded layer logging data and numerical simulation dynamic model well point data was generated (Figure 9). The linear relationship between the two was clear; the correlation coefficient was 0.8849, indicating a high correlation. The results showed that the dynamic model accurately simulated the actual reservoir water-out variation law. Some sample points may present a large deviation between the results obtained using the dynamic model and the log interpretation results based on the actual water-flooded layer. The effect of a few abnormal sample points on the geological model should not be ignored. The reasons for the inconsistency are mainly due to the logging interpretation conclusion; the positional relationship between the well point and the dominant seepage channel, lithology, logging facies, and water-flooded position in the layer should be explored to determine whether the relevant conclusions should be optimized, refined, and adjusted. The dynamic production status was thus used as the quality control data to evaluate the accuracy of the model. Comparative analysis of the residual oil predicted using the model before and after introduction of the time-varying model showed that the model with time-varying thick oil layer introduced significant edge water fingering than the model without the time-varying layer, but the residual oil of the stagnant type was still enriched in the structural waist. This result indicates a significant difference before and after the time-varying of the thin oil layer. The actual oil well production status and the status before and after introduction of the model were explored.

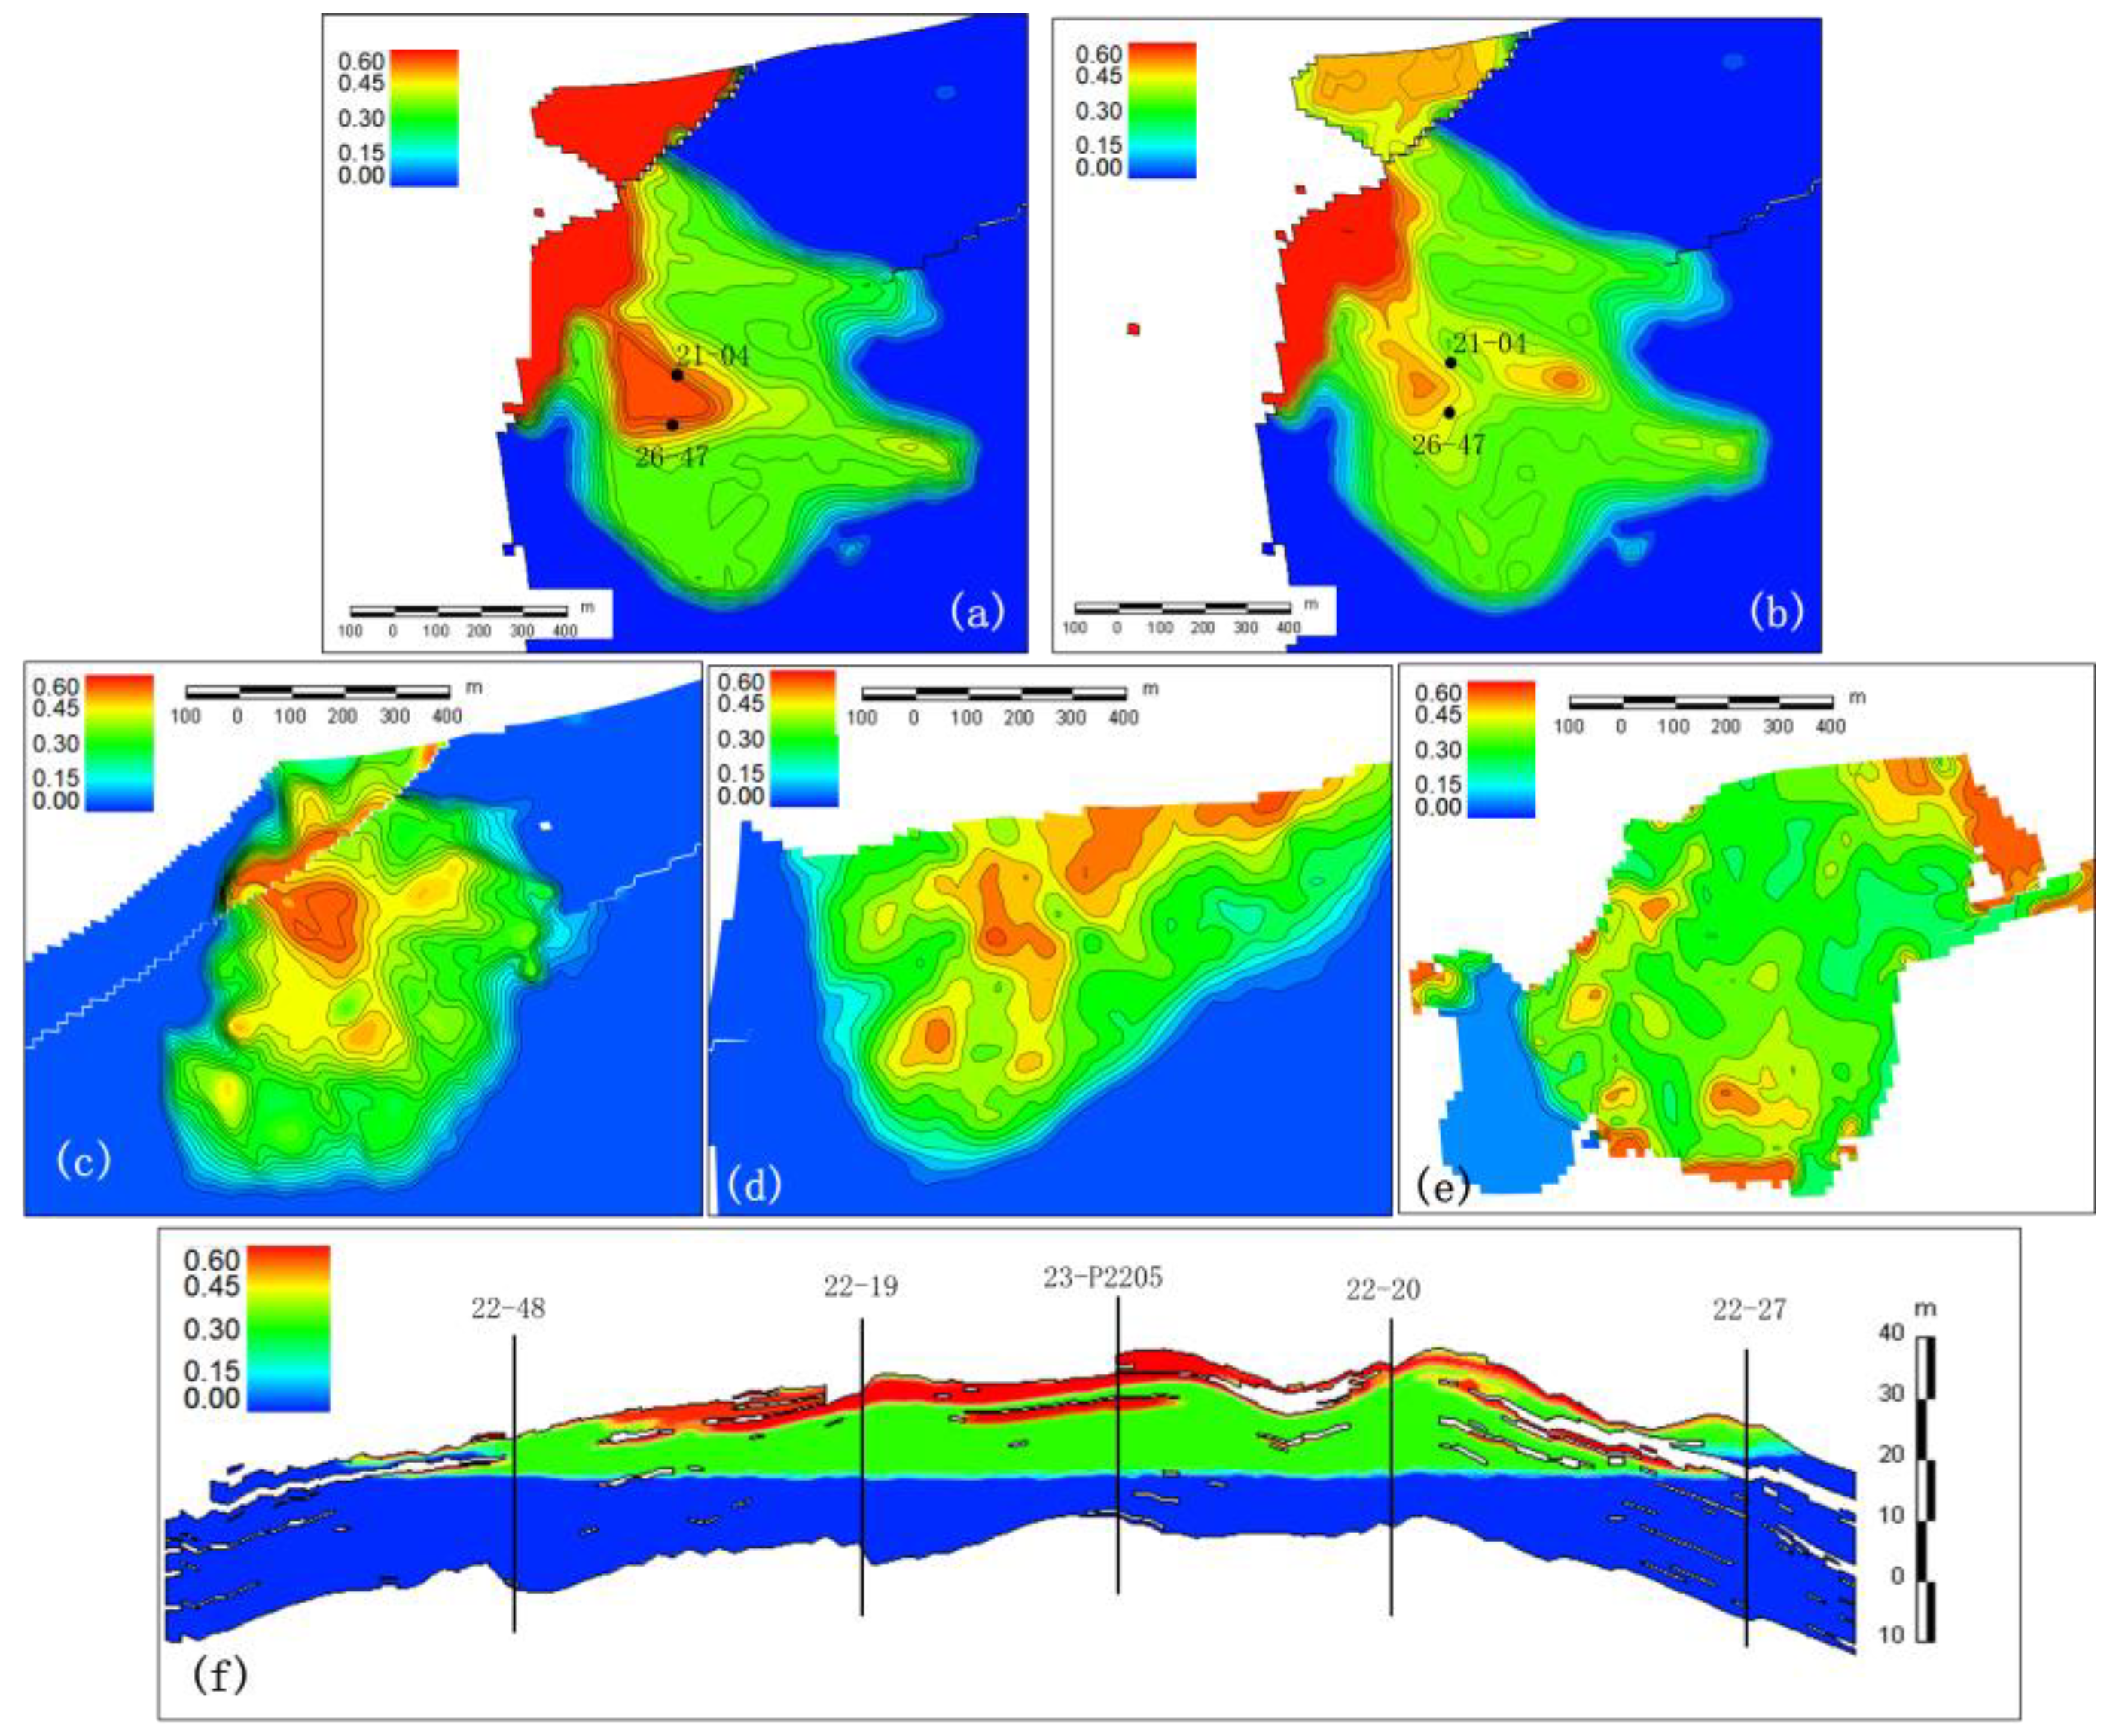
4.6. Characterization of Dominant Seepage Channel and Remaining Oil Distribution

Qualitative and quantitative characterization of dominant seepage channels using dynamic models was conducted. The specific parameters of the shallow dominant seepage channel in Nanpu 2−3 area were defined as reservoirs with a water-passage ratio more than 80-fold, 50% increase in permeability, and 10% increase in porosity. The results on the increase in physical properties predicted using the dynamic model (Figure 10) showed that the edge-water reservoirs were mainly distributed in long strips after edge-water intrusion, characterized by flakes. Each sublayer exhibited 2 to 6, and a total of 19 dominant seepage channels were developed, with a width of 20 to 210 m. The width of heavy oil reservoirs was smaller than that of thin oil reservoirs, which was mainly attributed to the oil-water viscosity ratio, and the permeability increased by 1.5–2.1-fold. The study area was a faulted anticline structure, which was caused by several factors such as development history and sedimentary microfacies distribution. The results showed that there were generally more than four water inflow directions in a single-layer edge-water reservoir (Figure 10a,b) The formation and distribution directions of each dominant seepage channel were different, with independent distribution and were locally connected into pieces. The physical properties of beach-bar sand bodies were better than channel microfacies, thus there were more dominant seepage channels in the former than in the latter. The dominant seepage channels after bottom water coning in the bottom water reservoirs were mainly distributed at the liquid extraction well points, which were mainly ‘conical’ in the vertical direction, supplemented by flakes. A total of 12 cone-shaped dominant seepage channels with a cone diameter of 45–125 m were developed. The results indicated a significant correlation between the water bodies due to the small well spacing between the dominant channels of the water cone in the bottom water reservoir (Figure 10c,d). The scale of the water cone at the production oil wells in the middle and high parts of the structure was relatively large, and the scale of the water cone was relatively small in the low part of the structure due to the combined effect of the edge and bottom water.
The four-dimensional modeling and digital-analog integration was performed to obtain a practical and more accurate geological static field to explore the evolution process and status of the remaining oil distribution (Figure 11). The results of the model without the time-varying data showed that wells 26−47 and 21−04 were both in the remaining oil-enriched area (Figure 11a,b). In October 2016, 518 cubic meters of fluid was drained from the third layer of well III2 in well 21−04, and no oil was observed. Well 26−47 produced 176 tons of crude oil and 994 tons of water after refilling, indicating that the results from the four-dimensional model were consistent with the actual situation. Analysis of the distribution of the remaining oil in the main sublayer showed that the characteristics of the remaining oil in heavy oil and thin oil reservoirs were different. The water invasion width of sublayer III①5 in the heavy oil reservoir in the medium to high water cut stage was narrow. The remaining oil was mainly enriched in the root of the fault, the middle and upper part of the oil layer, and the retention area between wells, mainly in sheets and supplemented by strips. The residual oil of the stagnant type II6 sublayer in the thin oil thick oil layer reservoirs in the high water cut stage was enriched in the structural high part, the top of the reservoir and the two flanks of the dominant seepage channel. The thin oil layer III2 sublayer was mainly enriched in the fault root and inter-well stagnation area. The low parts of the structure were extensively flooded because high amounts of oil swept the area. The high parts were distributed in sheets and bands and the enrichment areas were scattered. The main factors that affected distribution of oil in these regions included plane heterogeneity, fault occlusion, structure, and development history. The sublayer I6 in the bottom water reservoir mainly enriched the top of the reservoir and the upper and lower parts of the interlayer. The main factors that affected this distribution were the rhythm in the reservoir and the distribution of interlayers.

4.7. Application of the Model

The results on the 4D geological modeling and digital-analog integration technology in the shallow maturing field of Nanpu No. 2 shows that the residual oil reserves in the research area account for 79.9%. The residual remaining oil in the heavy oil reservoirs accounted for 15.3%, whereas the retentive remaining oil accounted for 84.7%. The residual remaining oil accounts for 21.2% in conventional thin oil reservoirs, whereas the retentive oil accounts for 78.8%. A total of 31 dominant seepage channels were described using the dynamic model and the novel 4D model. The research and establishment of the NgII6 profile control and flooding + huff and puff enhanced oil recovery scheme in Nanpu 2–1 area and the comprehensive adjustment scheme in Nanpu 2–3 area were carried out based on the findings from the 4D model. In the former, the characterization results of the dominant seepage channels of the model were considered when deploying the well pattern. Plugging wells with two injections and three productions were deployed on the dominant seepage channels to improve the ability to resist edge water and increase the swept volume of water flooding. After this implementation, the three oil wells exhibited a significant oil increase, with a daily oil increase of 4.2 tons per well (Figure 12a), and the recovery factor increased by 3.0-fold. The increase in oil recovery rate was achieved based on the characterization results of the dominant seepage channels and the remaining oil to conduct subdivision, reorganization, and homing plan of the strata. The effective pattern deployment in the plan considered the oil wells avoiding the dominant channels and the medium and the high water-flooded positions, and preferentially selected the areas where the remaining oil was enriched. This provides a basic well pattern for further control of flooding to enhance oil recovery. A total of 47 well-times were implemented in the plan, and the amount of oil increased by 14,700 tons. Efficacy of the main parameters including hole filling, recovery, liquid extraction, and the huff and puff was 83.2%, which markedly reduced the comprehensive decline rate of the block (Figure 12b). Comprehensive rating standard for reservoirs shows that the development level of the oil reservoirs in the study area was improved from Class II to Class I.

5. Conclusions

Modeling and numerical simulation should be combined in studies on the 4D modeling of natural water flooding reservoirs. This allows integration and connection of concepts to achieve a unified goal. In addition, the combination allows definition of the scope of modeling and digital modeling under the guidance of the integration concept. A complete and improved method and process were established for the fine simulation of 4D static and dynamic fields by relocating the time-space information of the reservoir and fluid, and combining the information on the time coordinate axis. This method enables in-depth study of a four-dimensional model of a natural water drive reservoir.
The water flooded layer contains dual information of geological static and reservoir dynamics, and the logging curve of the water flooded sand body was recovered to the unflooded state by establishing the quantitative relationship of different stages and different water flooding degrees. In addition, the original geological model was accurately established by combining the old well data. The new modeling method of ‘retreat to advance’ allows evaluation of the hidden static information value of the water flooded layer, and minimizes the effects of production dynamics on the geological model. Moreover, it simplifies the research method and process, is consistent with the practical situation, and reduces the multi-solution of the model.
The approach of incorporating the functional relationships between surface flux and physical properties, between surface flux and relative permeability, into the dynamic model solution accurately reflects the variation rule of the reservoir at each stage, and significantly improved the agreement between the numerical simulation results and use of dynamic experimental data. This process is reversible and traceable. Data on water flooding at different levels were used as the quality control data to explore the rationality and accuracy of the geological and dynamic models, which is important for practical application of the model. In addition, the dynamic model can effectively and quantitatively simulate the evolution process, spatial distribution, and various parameters of the dominant seepage channels, providing a reliable basis for the formulation of a solution to water flooding. The findings provide a basis for the application of 4D model integration technology in the maturing field for other studies on the same type of reservoir.

Author Contributions

J.D.: Conceptualization, Methodology, Validation, Formal analysis, Investigation, Writing—Original draft, Visualization. W.L.: Writing—Review, Supervision. L.Z.: Data curation, Visualization. All authors have read and agreed to the published version of the manuscript.

Funding

This research was funded by National Science and Technology Major Project Development of Large Oil and Gas Fields and Coalbed Methane ‘Oil and Gas Enrichment Rule and Reserve Increasing Field in Nanpu Sag’, grant number 2016ZX05006-006.

Data Availability Statement

Data that support the findings of this study are available from the first author upon reasonable request.

Conflicts of Interest

The authors declare no conflict of interest.

References

  1. Sureshjani, M.H.; Ahmadi, M.; Fahimpour, J. Estimating reservoir per-meability distribution from analysis of pressure/rate transient data: A regional approach. J. Pet. Sci. Eng. 2020, 191, 107172. [Google Scholar] [CrossRef]
  2. Eidsvik, J. Pyrcz and Deutsch: Geostatistical Reservoir Modeling. Math Geosci. 2015, 47, 497–499. [Google Scholar] [CrossRef]
  3. Zhijun, Z.; Jianglong, X.; Libin, Z. Numerical simulation fitting technology: A case study from Longhupao Oilfield. Lithol. Reserv. 2016, 28, 101–105+134. [Google Scholar]
  4. Shimi, P.; Zhijun, Y.; Haiyan, L. A New Trial to Build a 4-Dimensional Reservoir Model—A Case Study of the Reservoir Model of Member 3 of the Shahejie Formation in Eastern Hebei Province. Geol. Rev. 2004, 50, 662–666. [Google Scholar]
  5. Jichun, Z.; Shimi, P.; Lihua, M.; Yijian, S.; Jianmin, L. Four-dimensional dynamic simulation models for flow unit. Acta Pet. Sin. 2005, 26, 69–73. [Google Scholar]
  6. Ke, Y.; Shao-Chun, Y.; Huai-Qiang, R. Building of 4D reservoir model based on development performance. J. China Univ. Pet. 2010, 34, 12–17. [Google Scholar]
  7. Xiantai, L. Study on numerical simulation technology based on time varying physicals in mid-high permeability sandstone reservoirs. Pet. Geol. Recovery Effic. 2011, 18, 58–62. [Google Scholar]
  8. Zhangwen, Y.; Zhongquan, L. 4-D geological modeling of Xing 6 Middle Area reservoir in Xingshugang oilfield of Daqing. Fault-Block Oil Gas Field 2013, 20, 744–747. [Google Scholar]
  9. Ruizhong, J.; Xin, Q.; Wenchao, T. Numerical Simulation of Reservoir Time—Variation Based on Surface Flux. Spec. Oil Gas Reserv. 2016, 23, 69–72. [Google Scholar]
  10. Ruizhong, J.; Yongzheng, C.; Yang, H.; Xin, Q.; Yihua, G.; Jianchun, X. Numerical simulation of polymer flooding considering reservoir property time variation. Fault-Block Oil Gas Field 2019, 26, 751–755. [Google Scholar]
  11. Zene, M.T.A.M.; Jiang, R.; Wei, L.X. Effects of Polymer Injectivity Concentration on Time-Variation Relative Permeability. J. Phys. Chem. Biophys. 2021, 11. [Google Scholar]
  12. Balogun, Y.; Iyi, D.; Faisal, N.; Oyeneyin, B.; Oluyemi, G.; Mahon, R. Experimental investigation of the effect of temperature on two-phase oil-water relative permeability. J. Pet. Sci. Eng. 2021, 203, 108645. [Google Scholar] [CrossRef]
  13. Javad, S.; Najafi, A.; Sharifi, M.; Fahimpour, J.; Shabani, M.; Liu, B.; Yan, J.; Ostadhassan, M. An insight into core flooding experiment via NMR imaging and numerical simulation. Fuel 2022, 318, 123589. [Google Scholar]
  14. Ashman, K.D.; Volpin, S.G.; Kovaleva, O.V. Possible methods for estimating the composition, distribution and properties of residual oil during flooding (Russian). Oil Ind. J. 2019, 2019, 114–117. [Google Scholar]
  15. Shadadeh, M.; James, L.A.; Johansen, T.E. An improved procedure for generating pseudorelative permeabilities for water flooding in stratified reservoirs. J. Pet. Explor. Prod. Technol. 2018, 9, 449–459. [Google Scholar] [CrossRef] [Green Version]
  16. Landa-Marbán, D.; Bødtker, G.; Vik, B.F.; Pettersson, P.; Pop, I.S.; Kumar, K.; Radu, F.A. Mathematical modeling, laboratory experiments, and sensitivity analysis of bioplug technology at Darcy scale. SPE J. 2020, 25, 3120–3137. [Google Scholar] [CrossRef]
  17. Zare, A.; Bagheri, M.; Ebadi, M. Reservoir facies and porosity modeling using seismic data and well logs by geostatistical simulation in an oil field. Carbonates Evaporites 2020, 35, 703–708. [Google Scholar] [CrossRef]
  18. Rahimi, M.; Riahi, M.A. Static reservoir modeling using geostatistics method: A case study of the Sarvak Formation in an offshore oilfield. Carbonates Evaporites 2020, 35, 25–38. [Google Scholar] [CrossRef]
  19. Zargar, Z.; Thakur, G.C. Importance of reservoir simulation and early reservoir management for successful field development—Case study. Energy Rep. 2022, 8, 5038–5052. [Google Scholar] [CrossRef]
  20. Fernandes, B.R.B.; Sepehrnoori, K.; Delshad, M.; Marcondes, F. New fully implicit formulations for the multicomponent surfactant-polymer flooding reservoir simulation. Appl. Math. Model. 2022, 105, 751–799. [Google Scholar] [CrossRef]
  21. Jiang, R.; Zhang, W.; Zhao, P.; Jiang, Y.; Cai, M.; Tao, Z.; Ming, Z.; Tianlu, N.; Jianchun, X.; Yongzheng, C.; et al. Characterization of the reservoir property time-variation based on ‘surface flux’ and simulator development. Fuel 2018, 234, 924–933. [Google Scholar] [CrossRef]
  22. Galindez-Ramirez, G.; Contreras, F.R.L.; Carvalho, D.K.E.; Lyra, P.R.M. A very high-order flux reconstruction approach coupled to the MPFA-QL finite volume method for the numerical simulation of oil-water flows in 2D petroleum reservoirs. Appl. Math. Model. 2022, 106, 799–821. [Google Scholar] [CrossRef]
  23. Wei, Z.; Bin, L.; Xinran, W.; Xilin, L.; Zhiqiang, Z. Research on the evolution of high conductive channels based on formation parameters variation. Xinjiang Oil Gas Field 2019, 15, 61–66+4. [Google Scholar]
  24. Jamshidnezhad, M. Experimental Design in Petreoleum Reservoir Studies; Petroleum Industry Press: Beijing, China, 2020; pp. 102–146. [Google Scholar]
Figure 1. Integration method and process of 4D modeling for a natural water flooding reservoir in the maturing field.
Processes 11 00189 g001
Figure 2. The relationship between permeability and surface flux-based core experimental data over time.
Processes 11 00189 g002
Figure 3. Comparison of logging curves before and after water flooding of sub-layer II6 in typical pair wells.
Processes 11 00189 g003
Figure 4. Physical relationship of pairs of well reservoirs before and after water flooding in various stages.
Processes 11 00189 g004
Figure 6. (a) Before Recovery. (b) After Recovery. Comparison of permeability calculation results obtained using the geological model before and after recovery of the II6 small water-flooded layer curve.
Processes 11 00189 g006
Figure 7. (a) Phase Model. (b) Clay Content Model. (c) Permeability Model. 3D geological model of the shallow reservoir in the No. 2 structure of Nanpu Oilfield.
Processes 11 00189 g007
Figure 8. Profile of the evolution process of the water-flooded permeability dynamic model of the small layer II6 through the well.
Processes 11 00189 g008
Figure 9. Relationship between permeability of the water flooded layer in the newly drilled wells and permeability after time-varying of the dynamic model.
Processes 11 00189 g009
Figure 10. Increase in permeability of the main small layer. (a) III①5 sublayer (heavy oil, edge water). (b) II6 sublayer (thin oil, edge water). (c,d) I6 sublayers (thin oil, bottom water).
Processes 11 00189 g010
Figure 11. Distribution of remaining oil in main layers of various types of reservoirs. (a) III2 sublayer without considering time variation. (b) III2 sublayer considering time variation. (c) II6 sublayer considering time variation (heavy oil, edge water). (d) III①5 sublayer considering time variation (heavy oil, edge water). (e,f) I6 sublayer (thin oil, bottom water).
Processes 11 00189 g011
Figure 12. Effect of mine implementation stage of the shallow reservoir in the Nanpu No. 2 structure. (a) Periodical effect of NgII6 profile control and flooding + huff and puff scheme in the Nanpu 2–1 area. (b) Periodical effect of the comprehensive adjustment solution of the Nanpu District 2–3.
Processes 11 00189 g012
Table 1. Porosity and permeability of different sublayers before and after water flooding.
Sublayer No.Intrinsic
Porosity
[%]
Porosity after Water Flooding
[%]
Porosity
Increasing
Multiple
Intrinsic
Permeability
[×10−3 μm2]
Permeability
after Water Flooding
[×10−3 μm2]
Permeability Increasing
Multiple
II524.226.91.11256.2458.21.79
II624.127.11.12228.4402.61.76
II1325.427.41.08303.6481.81.59
III225.828.21.09356.6698.21.96
Table 2. The relationship between water-flooded layer porosity and permeability recovery.
Development StageHorizontal Position of Water FloodingType of
Microfacies
Layer NumberThickness of Sand Oil Layer
[m]
Average Thickness of Water
Flooding
[m]
Logging AnalysisPorosity
Recovery
Permeability Recovery
2019–2020 Above the dominant channelRiver channel; Central bar;
Concave flood plain
126.54.3Strong water floodingY = 18.5e0.0094XY = 132.3e0.0007X
2007–2018Above the dominant channelRiver channel; Central bar; Concave flood plain147.64.2High water floodingY = 16.6e0.014XY = 73.9e0.0022X
Flanks of the dominant channel386.84.3Medium water floodingY = 14.2e0.0201XY = 68.9e0.0035X
257.23.5Weak water flooding--
Table 3. Time-varying data table of key points of the phase permeability curve under different surface flux conditions (experimental data).
Relative Permeability Curve Surface Flux
[m3/m2]
Irreducible Water
[%]
Isotonic Point
[%]
Residual Oil
[%]
SCAL000.3460.6120.222
SCAL1200 ≤ M < 3000.3620.6010.202
SCAL2300 ≤ M < 4000.3730.5920.190
SCAL3400 ≤ M0.3810.5860.178
Disclaimer/Publisher’s Note: The statements, opinions and data contained in all publications are solely those of the individual author(s) and contributor(s) and not of MDPI and/or the editor(s). MDPI and/or the editor(s) disclaim responsibility for any injury to people or property resulting from any ideas, methods, instructions or products referred to in the content.

