Article

Parametric Effects on the Mixing Efficiency of Resonant Acoustic Mixing Technology for High-Viscosity Mixture: A Numerical Study

1
School of Mechanical Engineering, Nanjing University of Science and Technology, Nanjing 210094, China
2
School of Mechanical & Manufacturing Engineering, National University of Sciences and Technology (NUST), Islamabad 44000, Pakistan
*
Author to whom correspondence should be addressed.
Processes 2023, 11(1), 266; https://doi.org/10.3390/pr11010266
Submission received: 24 November 2022 / Revised: 29 December 2022 / Accepted: 1 January 2023 / Published: 13 January 2023

Abstract

:
Numerical investigations were conducted on the mixing efficiency of resonant acoustic mixing (RAM) technology using a high-viscosity mixture under vertically forced vibrations. The density distribution was analyzed for a mixture of high-melting explosive (HMX) and trinitrotoluene (TNT). The effects of mixing time, amplitude, frequency, fill level, and mixing vessel geometry were evaluated to determine their influence on the blend homogeneity and the efficiency of the mixing process. The results showed that amplitude and frequency both have significant influences on the mixing efficiency of the RAM process. With higher values of amplitude and frequency, the mixing efficiency was very good, and uniform mixing was achieved in a much shorter time. At the same time, it was seen that geometric changes did not affect the mixing process; in contrast, varying the fill level did have a significant effect. This approach could potentially be used for pharmaceutical blending, cosmetics, and explosive applications, where only small quantities of active particle ingredients (APIs) can change the behavior of the mixture.

1. Introduction

The modern process of mixing goes back to the 1950s, with significant contributions from Gray and Uhl (1966) and Nagata (1975). Over the past 30 years, many engineering principles have been developed, and mixing equipment for specific desired processes and objectives has been designed [1]. Nowadays, the characteristics of powdered products are becoming more and more complex. In some products, a mixture of up to 20 powder ingredients is necessary [2]. For example, in the pharmaceutical industry, around 80% of all finished products are solid dosage forms made from powder blends; however, despite active research, mixing is still not a well-understood process [3,4]. An inefficient mixing process takes more time to combine the ingredients, which increases the cost, resulting in a high price of the final product [5]. Therefore, new tools that can improve mixing performance have received significant interest, especially for processes that involve highly potent and cohesive ingredients [6]. Resonant acoustic mixing (RAM) has been shown to reduce processing times and cost and has limited environmental impact. It is a non-contact, forced vibrational mixing process which applies high-intensity acoustic waves to achieve highly efficient particle collisions [7]. RAM is a widely used technique for mixing in a vertically vibrated mixing vessel on a shaker platform. It has already shown great potential in the concrete [8], pharmaceutical [9], and food [10] industries. RAM is based on the principle of a vertical forced vibrational system that creates micro-mixing zones throughout the entire mixing vessel. Instead of mixing blades, the apparatus consists of a spring-mounted platform to which a mixing vessel is affixed [11]. This approach is totally different from conventional techniques, where mixing takes place at the tip of impeller blades, at discrete locations of baffles, or as co-mingling products induced by tumbling materials. In RAM mixing, there are no shearing interactions with the material, and hence, it can be said that RAM achieves uniform energy distribution [12,13,14].
Zhan et al. [15] investigated the mixing performance of vertically forced vibrations with two high-viscosity fluids and analyzed the dynamics and flow characteristics of initially stratified fluids and the main effects of the vibration parameters on the blending process. They also applied a validated CFD model to study the mixing characteristics of two miscible fluids in a horizontally vibrated, closed container [16] and analyzed the flow characteristics and interfacial dynamics of the initially stratified fluids, as well as the effects of the vibrational parameters and gravity on mixing efficiency. Cheng, Wangjian et al. [17] prepared a 90% solid polymer-bonded explosive (PBX) using RAM and studied the evolution of the applied materials with different mixing vessels, accelerations, and times. The application of vibrations to fluid systems with density gradients is receiving increased attention from the research community. The dynamic behavior of the surfaces of liquid and gas phases have been broadly studied theoretically as well as experimentally [18,19]. The hydrodynamic mechanism underlying the disintegration and drop formation on the free surface in a vertically vibrated container has also been investigated [20,21]. RAM technology is suitable for use with many types of materials, such as solid–solid, solid–liquid, liquid–liquid, and liquid–gas systems [22]. This technique can be utilized to mix low-viscosity, high-viscosity, and non-Newtonian systems. This new approach provides faster, more uniform mixing throughout the vessel than conventional mixing systems. Efficiently achieving the processing objectives is important to successfully manufacture a product. When working with highly viscous fluids, effective mixing performance cannot be achieved by simply applying deformation to the free surface [15]. However, when the intensity of vibrations increases, the free surface and the interface disintegrate, greatly enhancing the mixing efficiency and accelerating fluid mixing. The costs of manufacturing may be increased significantly if the mixing scale-up fails to produce the required product yield, quality, or physical attributes, and more importantly, the release of new products may be delayed or even canceled in view of the cost and time required to correct the problems in the mixing process [1]. Hashimoto and Sudo [23] studied the dynamic behaviors of two liquids with different densities and free surfaces in a container under vertical vibrations and analyzed the stabilities of the surface and the interface between the two liquids. These findings provide fundamental theories and methods for characterizing fluid mixing in vertically vibrated containers. The mixing performance of RAM technology with ultra-high-performance concrete (UHPC) was investigated by Aileen Vandenberg et al. [8]. Parameters such as specific mixing energy were optimized, workability spread flow tests were performed, and acceleration curve profiles were created, allowing the authors to compare the performance of RAM with that of a tabletop paddle mixer in terms of the compressive and flexural strength properties as well as the effects of the mixing process on workability and flow. The main focus of their research was to mix UHPC using a recently developed mixing technique called resonant acoustic mixing. This approach is based on the vertical reciprocating movement of a spring, which creates short-amplitude, high-frequency (up to 60 Hz) acoustic pressure waves that induce micro-mixing zones and bulk movements [24,25,26] in the materials to be mixed. The Discrete Element Method (DEM) is a popular simulation technique in a study on particle flow behavior under vibration conditions [27]. In an experimental study, a Lab-RAM approach was used to mix several pharmaceutical blends [2] of active pharmaceutical ingredients (APIs) with different cohesive properties, concentrations, and particle sizes. The authors sought to determine the effects of different mixing parameters, such as fill level, acceleration, and blending time, on the homogeneity of the blend by estimating the relative standard deviation (RSD) of low concentrations of APIs and lubricant blends. Pahl and Wittreck [28] suggested a 3D vibration mixing technique and established its suitability for mixing of solids and liquids. Yang [29] investigated the mixing and segregation of a binary granular mixture under vertical vibration at a frequency of 15 Hz. Katayama et al. [30] performed a numerical simulation to study two-component powder mixing by vertical vibration. The results from the experiments indicated that improved mixing performance was achieved by the resonant acoustic mixer with longer blending times and with higher accelerations. Opposite to other types of mixers, such as tumbling mixers or shear mixers, mixing performance was found to be independent of fill level. The process was further examined for pharmaceutical blends and tablets [31] to determine changes and their effect on the bulk properties of the products; and the authors found that, overall, the bulk properties were significantly affected by acceleration, blending time, and total energy input. These measured properties were correlated to the resonant acoustic mixing parameters.
Contrary to traditional mixing equipment, such as batch style mixers, kettles, tumblers, and extruders, which mainly relies on stirring to achieve the purpose of mixing and has been thoroughly studied widely, mixing through resonant acoustic technique is yet to be explored widely. The previous studies have mainly focused on low-viscosity mixtures rather than the high-viscosity ones, which have different mixing mechanisms. The major problems and their effects on the mixing process, such as the frictional collision between the mixing element and the mixing vessel and excessive mixing pressure; the making of agglomeration which leads to the need for longer time for loading and unloading; and the production of hazardous wastes, which impose serious risk to the health and safety of workers, have been rarely investigated. Data on the dynamic behaviors of a material in a mixing vessel vibrated vertically are also insufficient, and the effects of different parametric factors need to be clarified. Therefore, additional studies should focus on the mechanism of vibration mixing through RAM mechanism to promote its application for high-viscosity mixtures. This study was performed to explore numerically the mechanism of resonant acoustic mixing (RAM) technology for high-viscosity materials, and to analyze the effects of different parametric factors because it is very difficult mix high-viscosity materials in traditional mixers homogeneously and efficiently.

2. Materials and Mixing Methods

2.1. Properties of Materials

Commercially available high-melting explosive (HMX) and trinitrotoluene (TNT) were used as the mixing ingredients in all mixtures. HMX when mixed with TNT, which is referred to as “octols”, is used in melt-cast-able explosives [32]. Similarly, TNT is a chemical compound used as a reagent in chemical synthesis, but it is best known as an explosive material with convenient handling properties. TNT have the fastest dissolution rate followed by HMX and then RDX (Royal Demolition Explosive) [33]. The properties used in Fluent for the HMX (referred to as the solid material) and TNT (referred to as the liquid material) in this work were taken from [34,35], which are shown in Table 1.

2.2. Mix Compositions

The density distribution of the mixture of HMX and TNT with a particle diameter of 100 nanometer (nm) for up to 120 s vibration was simulated. The volume fraction of the HMX was set to 19%, whereas the volume fraction of TNT was set to be 81% in all mixtures. Density difference was considered as the standard for uniform mixing. A density difference less than or equal to 0.5 kg/m3 was considered as uniform mixing.

2.3. The RAM Setup

The working principles of RAM are explained in more detail in [36,37]. The RAM system consists of three elements: a mass system, a spring assembly, and a loaded mixing vessel as shown in Figure 1. A motor is responsible for fixing the mixing media to a reciprocating agitation movement controlled by the spring assembly [10]. Resonance occurs in the system when the spring’s stored forces and the mass’s inertial forces become equal to each other. That resonance translates to the mixing media with a short amplitude and a high frequency as a longitudinal acoustic wave. Acceleration is generated by the vertical motion of the RAM. This vertical, sinusoidal motion operates at a frequency between 58 and 62 Hz and at a peak displacement of up to 0.55 inch (approx. 14 mm) when operated at 100 g, while some investigations have shown that RAM does not use direct acoustic excitation to affect mixing [38]. Rather, it functions more similarly to a shaker table, where the mixing vessel vibrates vertically at a frequency near 60 Hz with a vertical displacement that may exceed an amplitude of about 1 inch [5,39].
This low-frequency vibration with displacement creates a physical mixing. This condition of the system is proven over a range of frequencies that permits a balance between the kinetic energy of the springs and potential energy of the oscillating plates of the resonator platform (Figure 2). When the system operates at resonance, virtually all the energy from the system motors is applied directly to the materials being mixed, resulting in a highly energy-efficient system [40].
The governing equation, which shows the overall behavior of this vibrational system, consists of the inputs to the system (such as externally applied forces through the motor to give excitation to the system), and outputs (such as forces which are stored by the system in the shape inertia and stiffness). For a simple vibrational system having the mass-spring-damper model, the equation of motion is described in [36] as follows:
m x ¨ ( t ) + c x ˙ ( t ) + k x ( t ) = F 0 sin ( ω f t )
which is a second-order differential equation in which the left-hand side represents the “system forces” in terms of inertial forces “m” (vessel’s mass), mixing forces “c” (damping coefficient), and stored forces “k” (spring constant), and the right-hand side of the equation represents the “input forces” F0 and sin ( ω f t ) , where F0 is the amplitude of the excitation, and sin ( ω f t ) is the harmonic function where w is the excitation frequency in radians per second.
Equation (1) represents forced-damped mechanical vibration system, where at resonance, the inertial forces cancel out the stored forces. The response of the system has two directions, in the X direction and in the Y direction. For the displacement in both directions, the response of the system is shown in the following equations:
x ( t ) = F 0 c o s ( ω f t )
y ( t ) = F 0 s i n ( ω f t )
Solving Equations (2) and (3), respectively, the response will be converted to the velocity of the system and we obtain Equations (4) and (5), respectively.
x ˙ ( t ) = F 0 ω s i n ( ω f t )
y ˙ ( t ) = F 0 cos ( ω f t )
Similarly, for acceleration, we obtain Equation (6):
x ¨ ( t ) = A ω 2 A cos ( ω f t )
where “A” denotes the peak amplitude to the driving force with respect to the starting center point, which is directly related to the driving force but inversely related to the damping coefficient. Equation (4) shows that the acceleration is linearly related to the amplitude. Therefore, if the mechanical system is in resonance which means ω f ω n , the percentage mixing intensity directly relates to the acceleration of the material.

2.4. Numerical Simulations

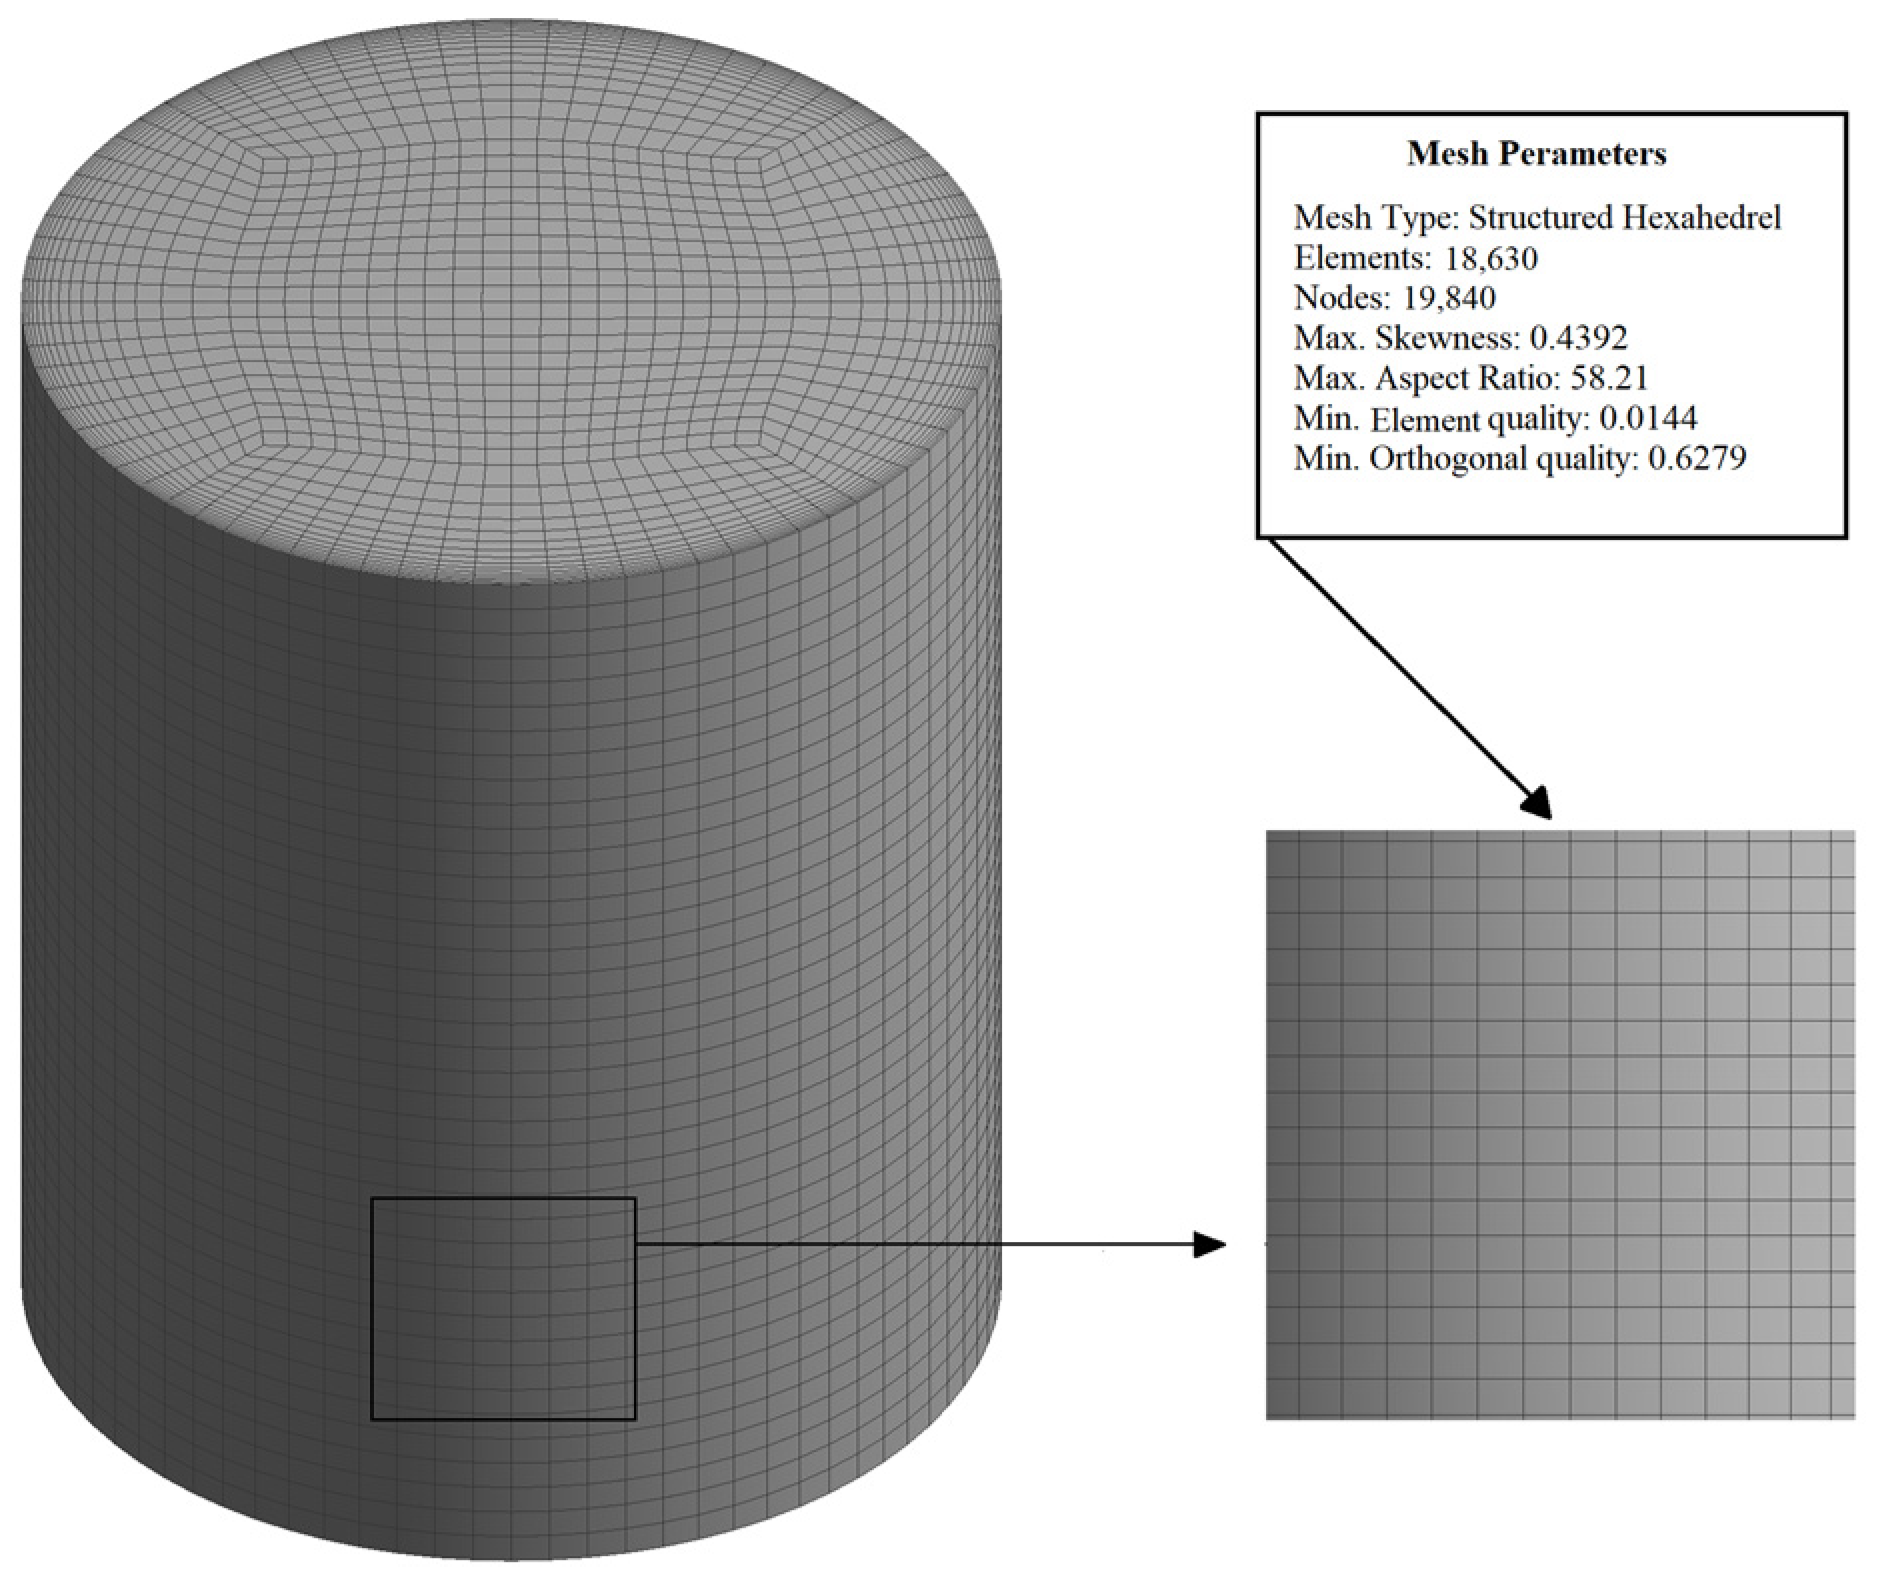
As the focus of this study was on the physical understanding of mixing, a 3D cylindrical flow field area model having a diameter of 150 mm and 200 mm in height was established. Figure 3 illustrates the computational fluid domain and its meshing.
According to the model of the mixing vessel, the three-dimensional structured flow field area with 18,630 hexahedral cells and 54,729 quadrilateral interior faces was established and gravity was considered. The moving mesh model was used to simulate the problem that the shape of the flow field changes over time due to boundary motion. With the local reconstruction of the mesh regeneration method, the mesh update process is automatically generated by Fluent according to the boundary changes in each iteration step.
The flow was assumed to be laminar, incompressible, and isothermal, and the mixing was assumed to involve no chemical reactions. In this study, a mixture model with two Eulerian phases, slip velocity, and implicit body force was used to describe the process. The mixture model was chosen to track and locate the free surface between two phases. This model was employed by Keller et al. [41] in their study on the interface breakup and by Bale et al. [42] in their study on the stability of the free surface in a vibrated column. The walls of the vessel were defined as rigid-body with an implicit body force and slip velocity condition. Simplec was selected for the solution method algorithm because it shows optimized response among the other solver setup algorithms in Fluent. The interface modeling was set to sharp/dispersed and the number of Eulerian phases was set to 2 as there were two phases that interacted with each other. The region was created according to the specified fill level (30%, 60%, and 90%) for mixing, and then the materials (HMX and TNT) were assigned to the mixing regions.
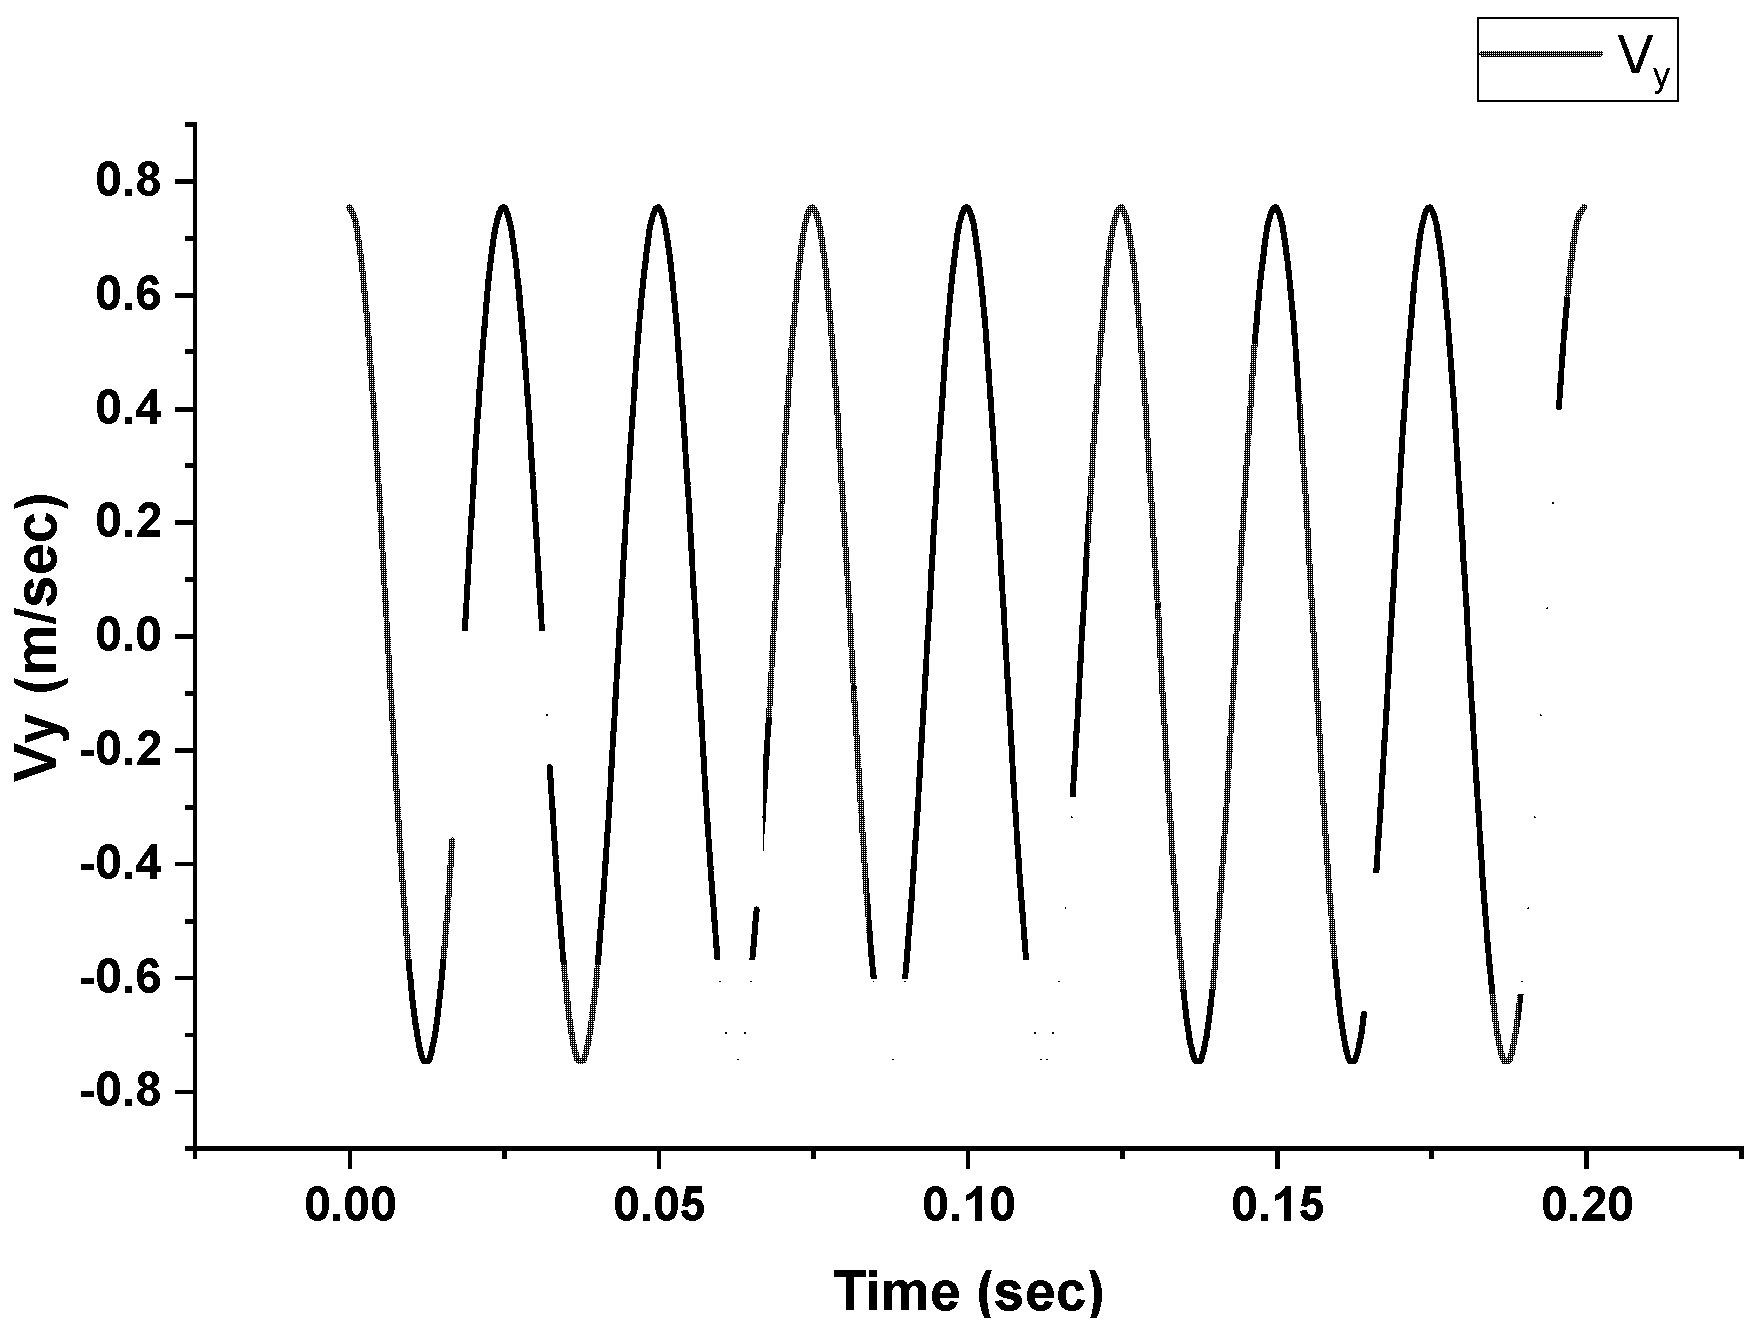
When writing a profile, discrete points were used to specify the sinusoidal motion of the boundary. MATLAB was used to compile discrete points that satisfy the sinusoidal motion, control the time interval to 0.001 s, frequency to 20~60 Hz, amplitude to 0.001~0.005 m (1 mm to 5 mm), and total time to 60 to 120 s, and the discrete points were imported into the “prof” file in Fluent. After debugging, a discrete point with a time interval of 0.001 s was generated, which can simulate a sinusoidal motion curve, as shown in Figure 4.
According to the results of the numerical simulation, the above method was proven to be feasible. From the simulations, plots at different time points at the centerline of geometry (known as centroids) were obtained from the geometric model, which makes a vertical straight line across the center of the mixing vessel.
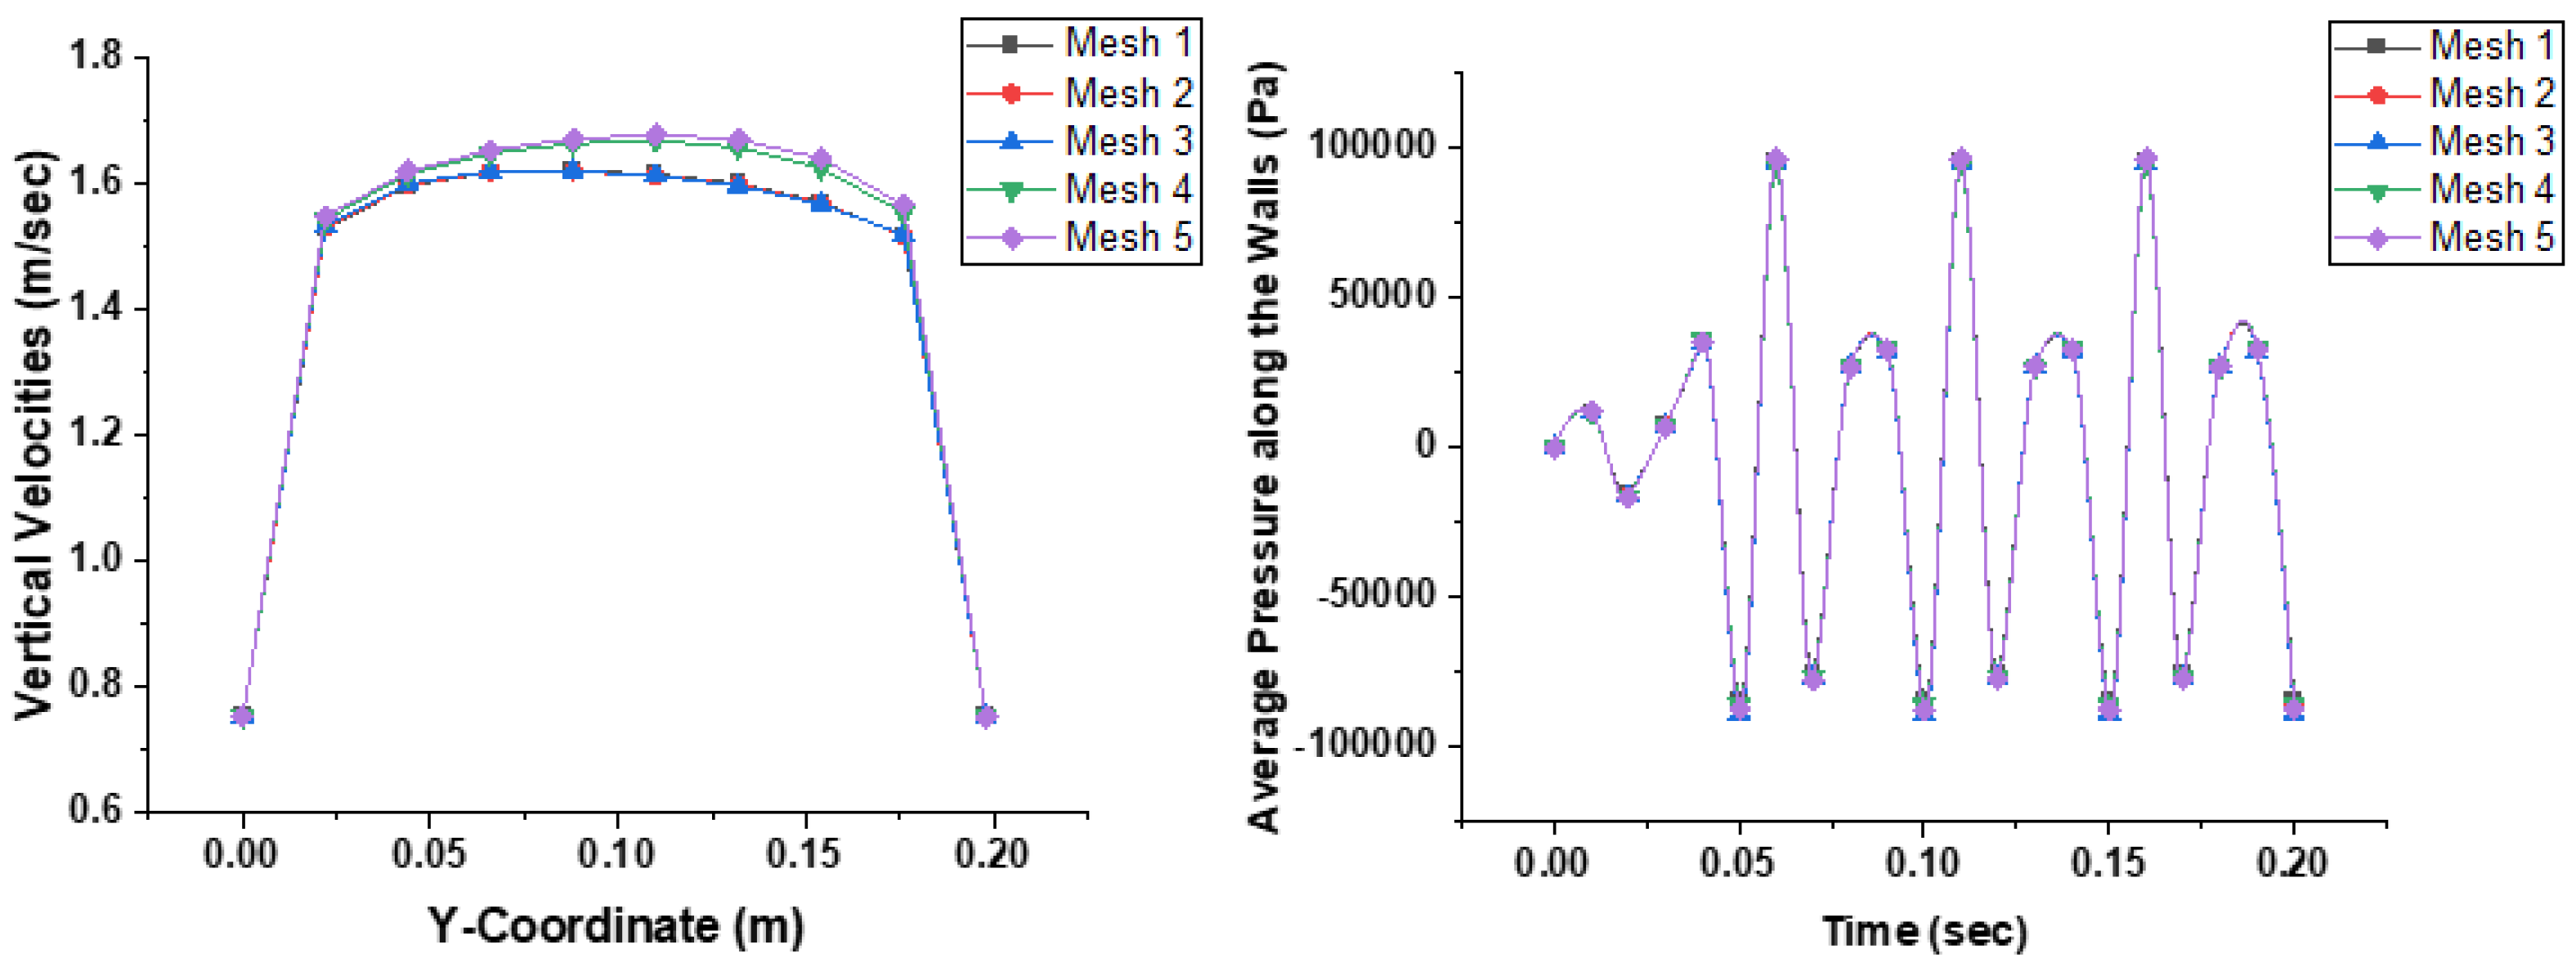
The impact of the number of elements on a problem’s solution is a key issue when applying the finite element approach. The high degree of resolution and accuracy offered by a large number of elements must be balanced against the higher computational expense required to run a larger simulation [43]. The user must assess the required degree of resolution and balance it with the processing resources at hand. Therefore, a mesh independence test and grid convergence study was performed to confirm whether the solution was grid independent. The criterion of the vertical velocities along the vertical centerline (at the Y-coordinate) and the pressure along the walls of the mixing vessel at 0.2 s were drawn that were subjected to the vibration with the increasing number of grids. Five mesh sizes were investigated, as shown in Figure 5. The minimum element quality of the meshes was 0.030, 0.021, 0.014, 0.011, and 0.008, respectively.
As a result, the whole computational domain was composed of approximately 13,662, 16,146, 18,630, 23,725, and 27,972 hexahedral cells, respectively. Maximum skewness and maximum aspect ratio are the critical quality parameters of the mesh to achieve convergence of solution [44]. The results for the vertical velocity and the pressure along the walls were almost similar for all five meshes with very minor changes in the mesh parameters; however, fast convergence rate was obtained on mesh 3. The numerical convergence can significantly slow down the CFD analysis’s time frame depending on the size of the computational mesh [45]. Thus, reasonable accuracy could be reached with mesh 3. Therefore, mesh 3 was chosen for the process simulations. To compare the results of all modules, simulations were performed until the flow field reached an equilibrium state. Equilibrium state was defined as the condition where the density difference reached 0.5 kg/m3 in a given time.

3. Results and Discussions

3.1. Mechanism of Vertically Vibrated RAM Process

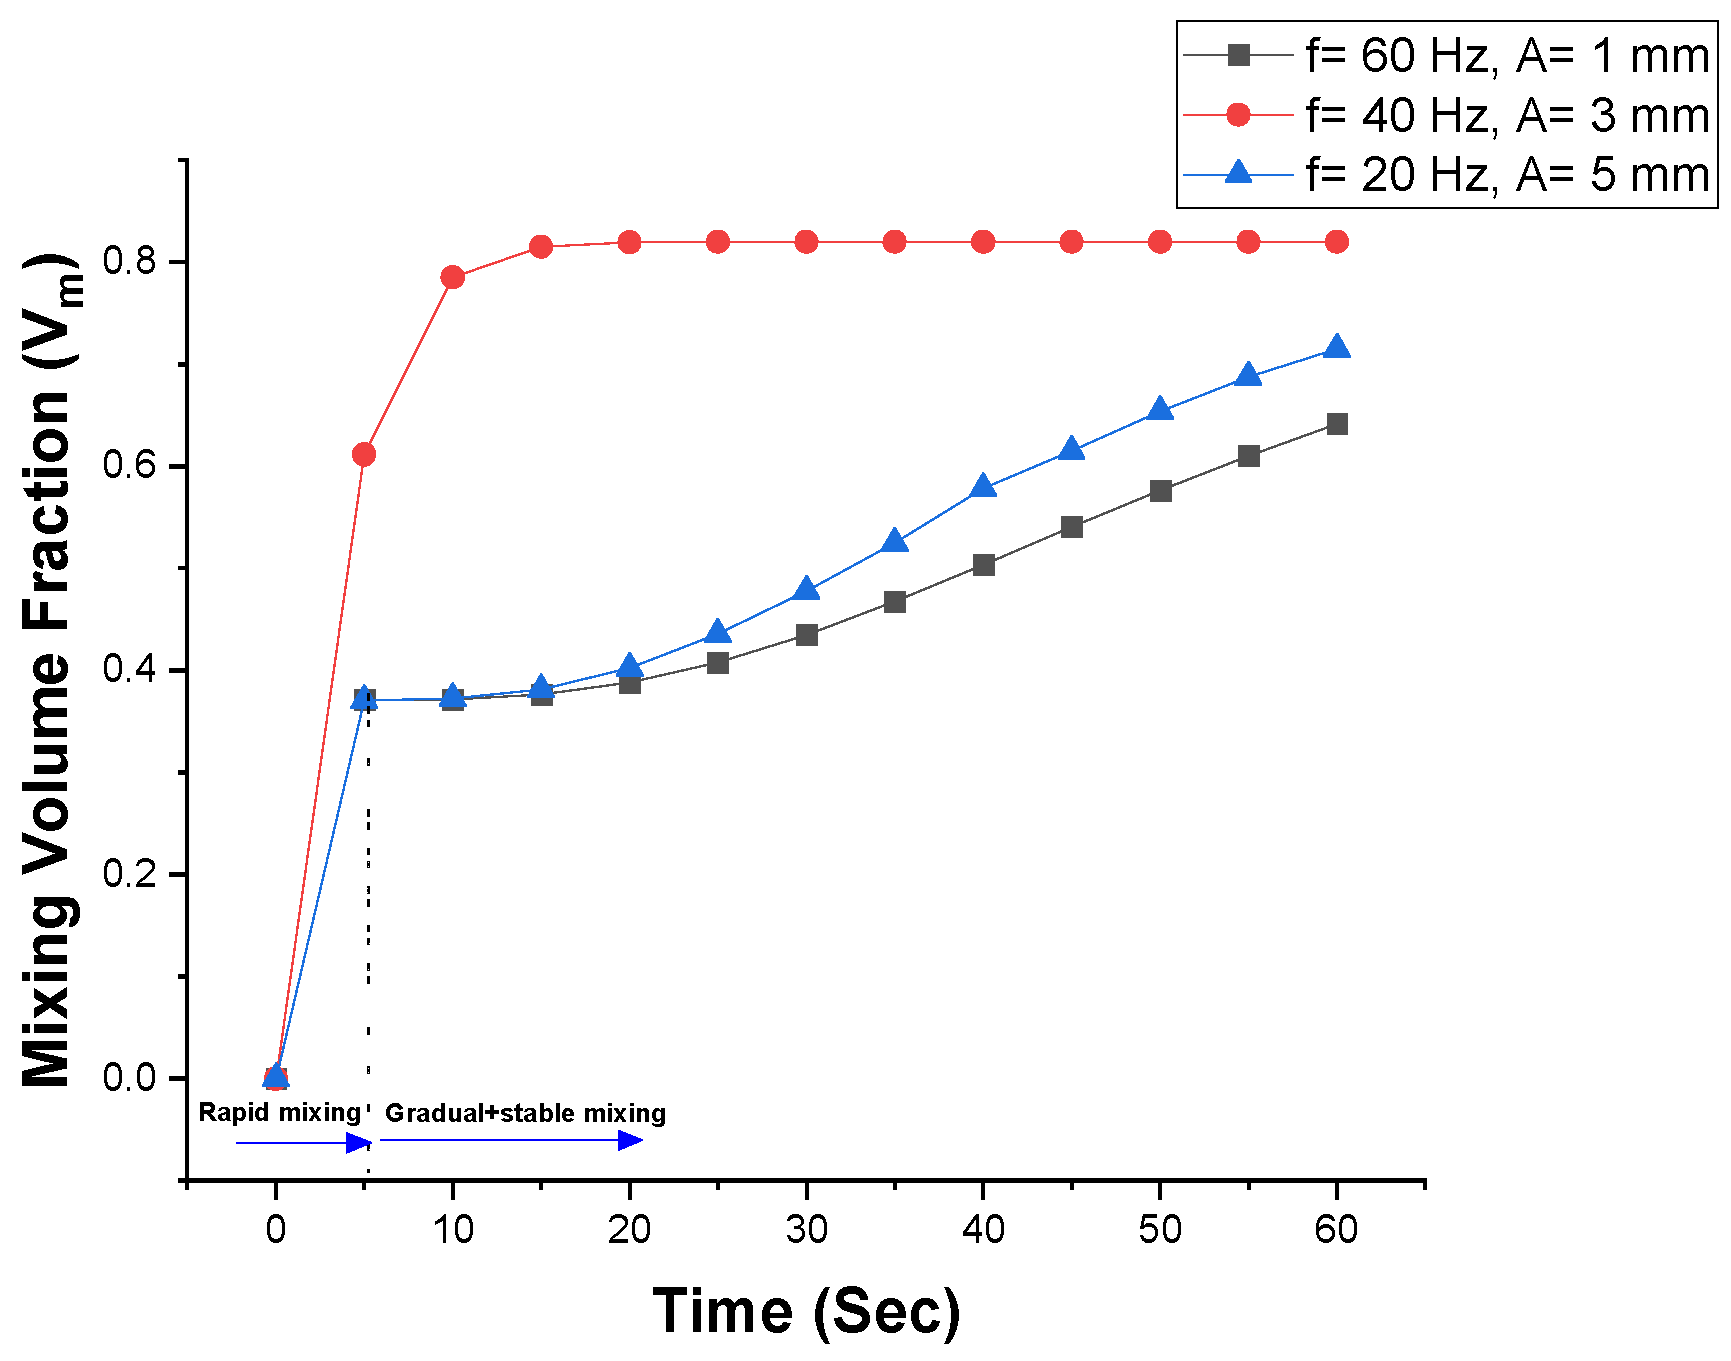
At the time t = 0 s, where the mixture was at rest, the vibration was initiated. After the vibration started in the vessel, different flow regimes were observed depending on the vibration intensity. The fluid mixing curves are displayed separately in Figure 6. The time needed to achieve full mixing is dependent on the vibrational parameters (frequency and amplitude). Thus, it is important to determine the effects of vibrational parameters in the RAM mixing. Therefore, simulations were performed with different values of amplitude (1 mm, 3 mm, and 5 mm) as well frequency (20 Hz, 40 Hz, and 60 Hz). Other simulations were obtained by varying the dimensions of the vessel (size of height and diameter) and the effects of vessel geometry were analyzed. The effects of fill level of 30%, 60%, and 90% were also analyzed. The density variations were obtained at different time steps throughout the mixing process and the density difference was considered as standard for mixing homogeneity.

3.2. Effects of Different Parameters on the Mixing Process

The mixture can be mixed in a vertically vibrated mixing vessel while controlling the vibration amplitude and frequency. Different mixing processes can be observed depending on the vibration parameters. The effect of the vibration parameters on the mixing process was further investigated by varying its amplitude, frequency, and different sizes for the mixing vessel. The degree of mixing was determined by the density difference of the mixture after the mixing process was completed.
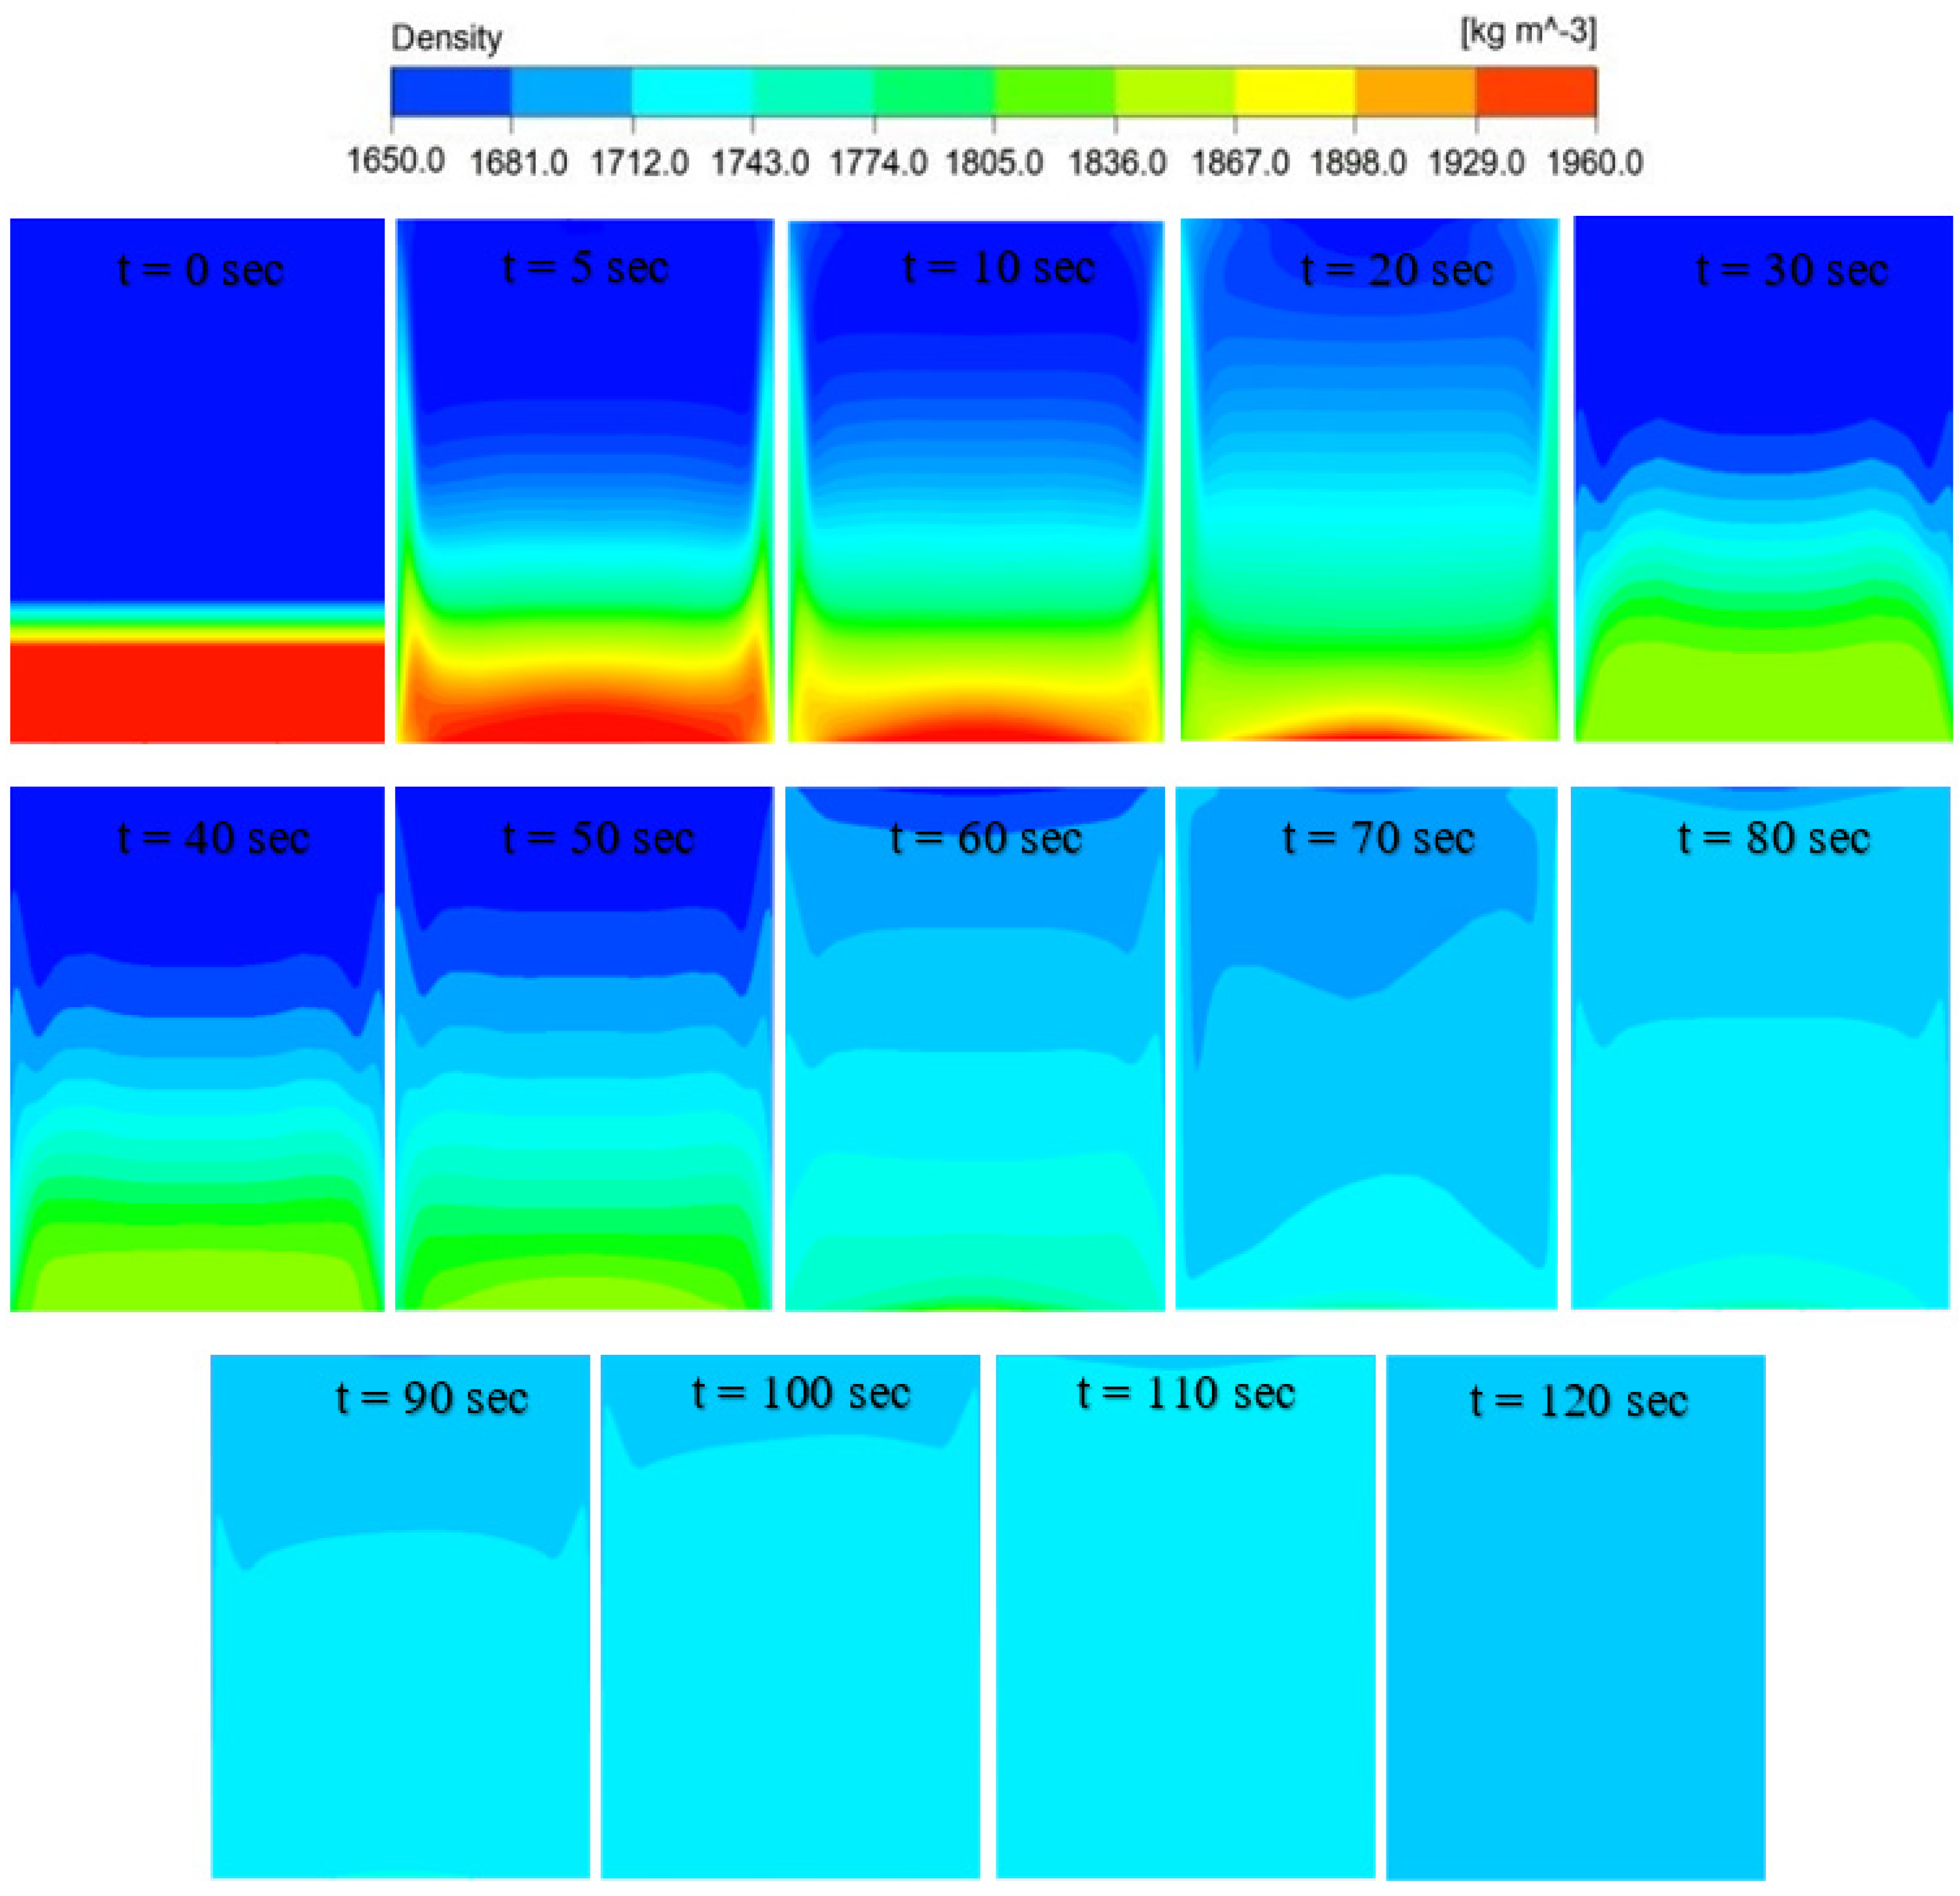
Taking the mixing process at an amplitude of 1 mm and frequency of 20 Hz for 120 s as an instance, the mixing procedure is presented in Figure 7. The density variation contours and curves are captured at different time steps. The simulation results are discussed thoroughly from the initial state (at time = 0 s), where there was no vibration, to the final state (at time = 120 s), where the mixing process was completed for 120 s.
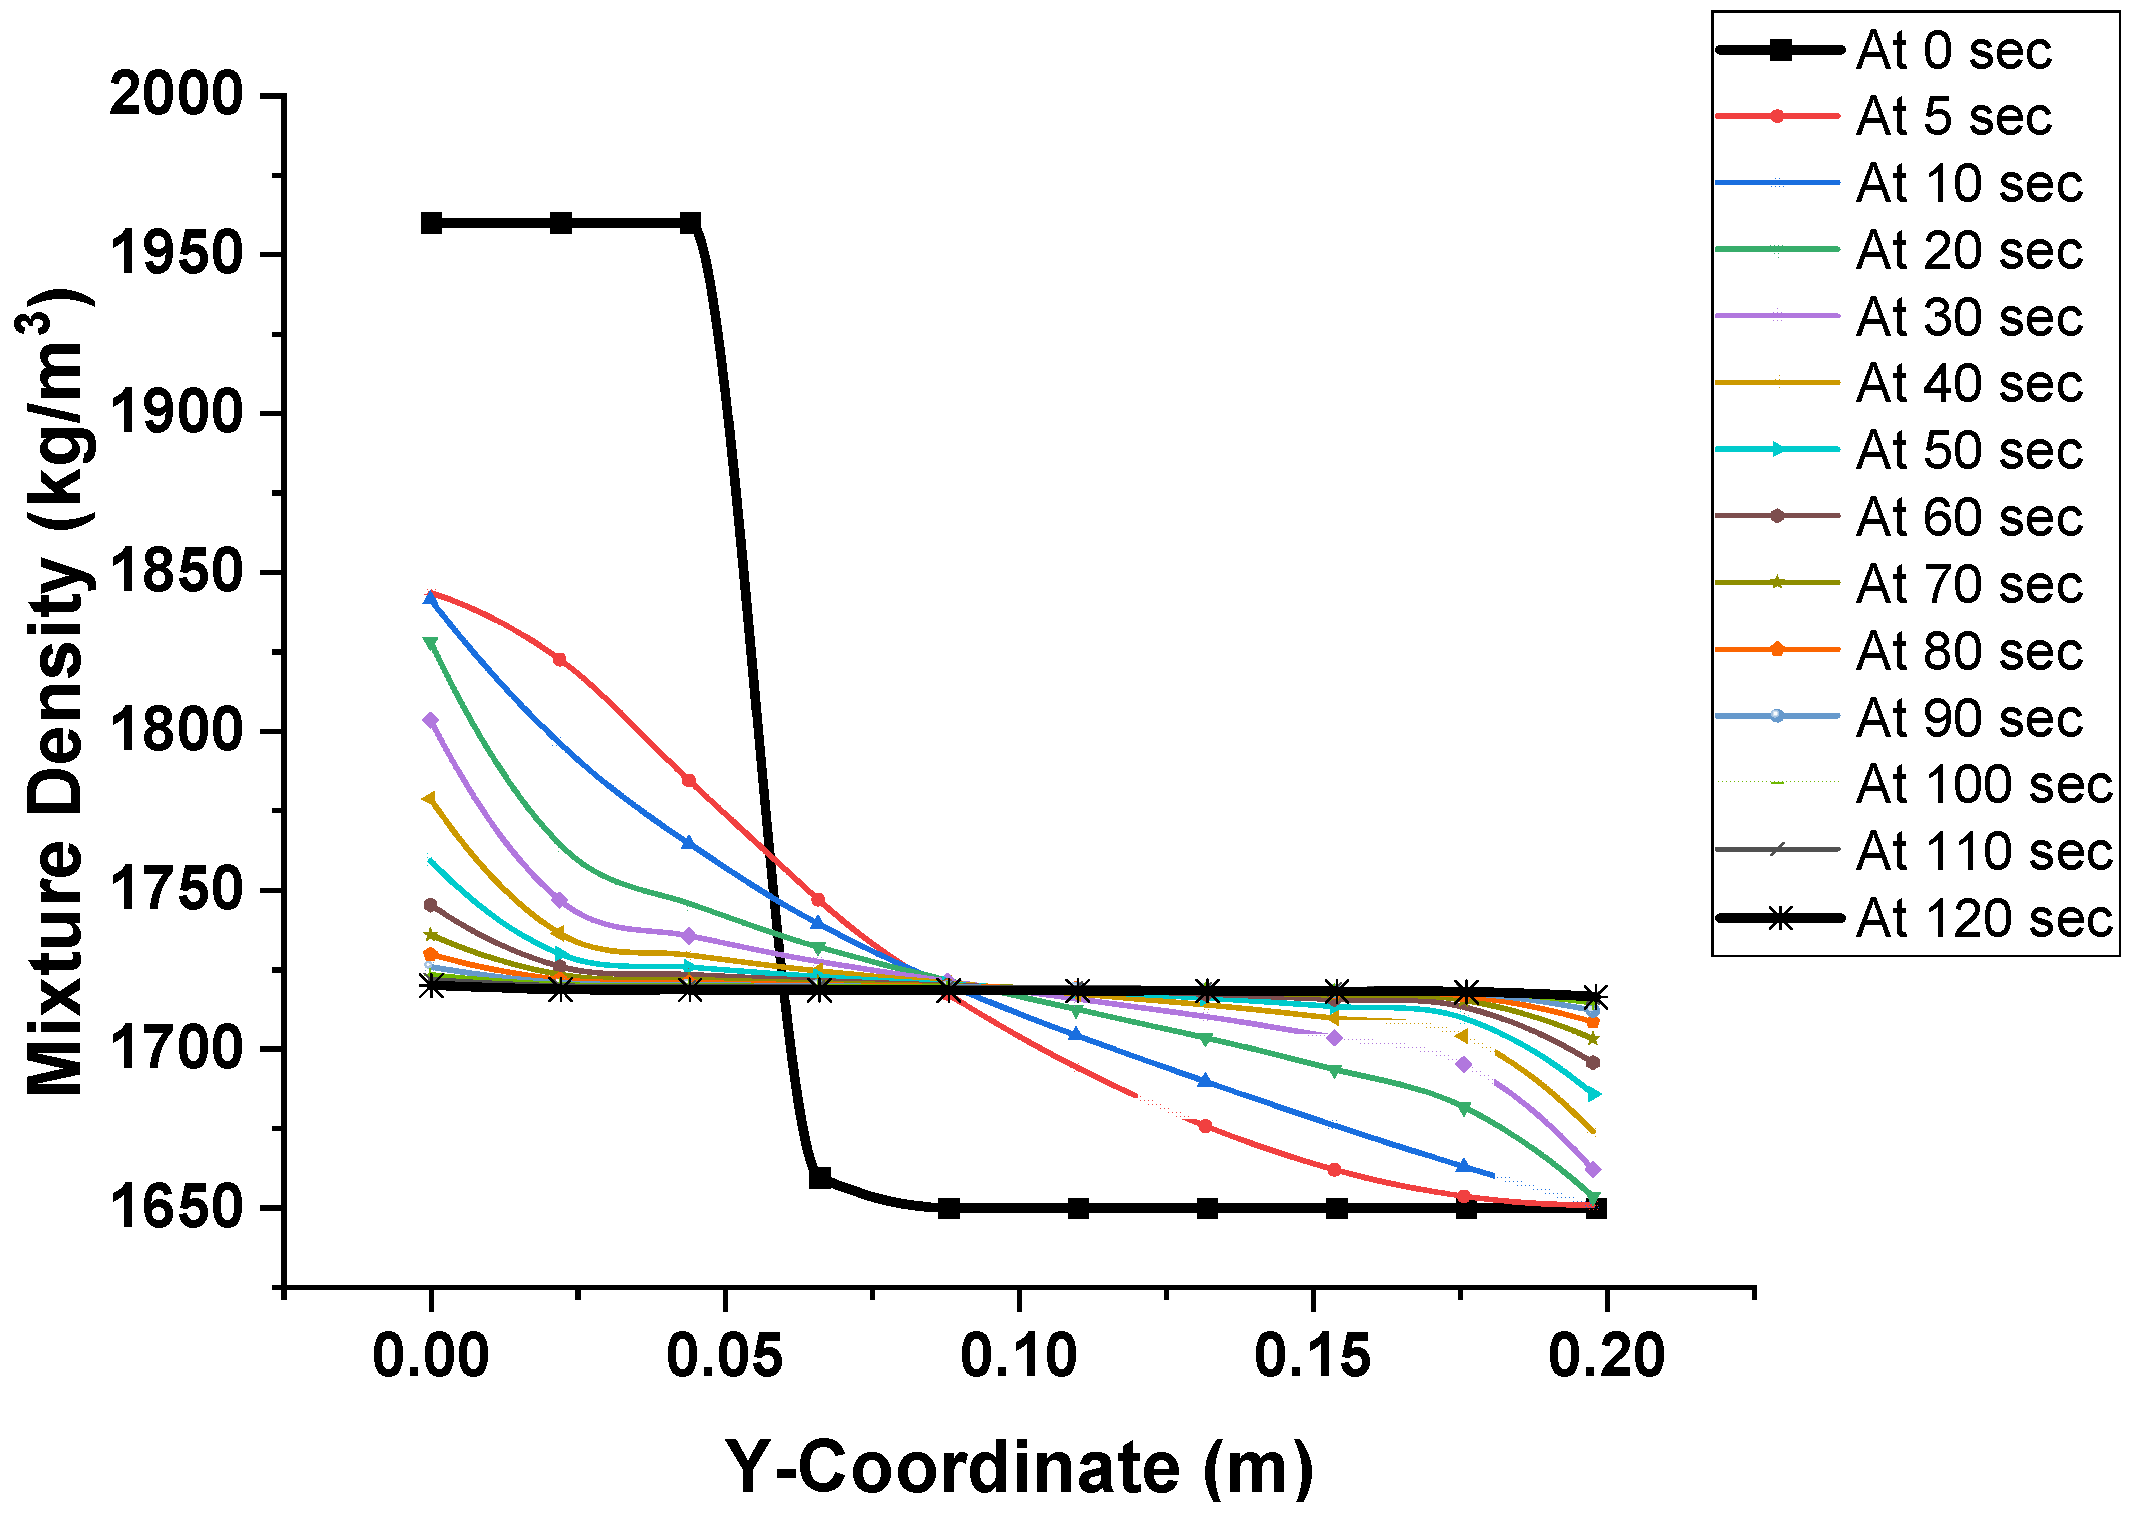
The contours were obtained from the initial state of mixing, where the vibration was not started yet, to the final state till the completion of the process. After the vibration had started, the materials just started to mix, and the results are obtained through the plots of density curves obtained at every five-second interval, as shown in Figure 8.
The density was found to change with time as initially the density of the HMX was 1960 kg/m3 and 1650 kg/m3 for TNT before vibration, as shown in Figure 9. After 120 s of mixing, the density of the HMX and TNT changed to 1720.42 kg/m3 and 1716.17 kg/m3, respectively, therefore the density difference was 4.25 kg/m3, which is a larger value compared to the standard set for uniform mixing.
The results show that the mixing efficiency is independent of time, as it is totally dependent on amplitude and frequency. It can be seen that only longer mixing times cannot improve the mixing uniformity, but amplitude and frequency can improve mixing uniformity significantly.

3.2.1. Effect of Amplitude on the Mixing Process

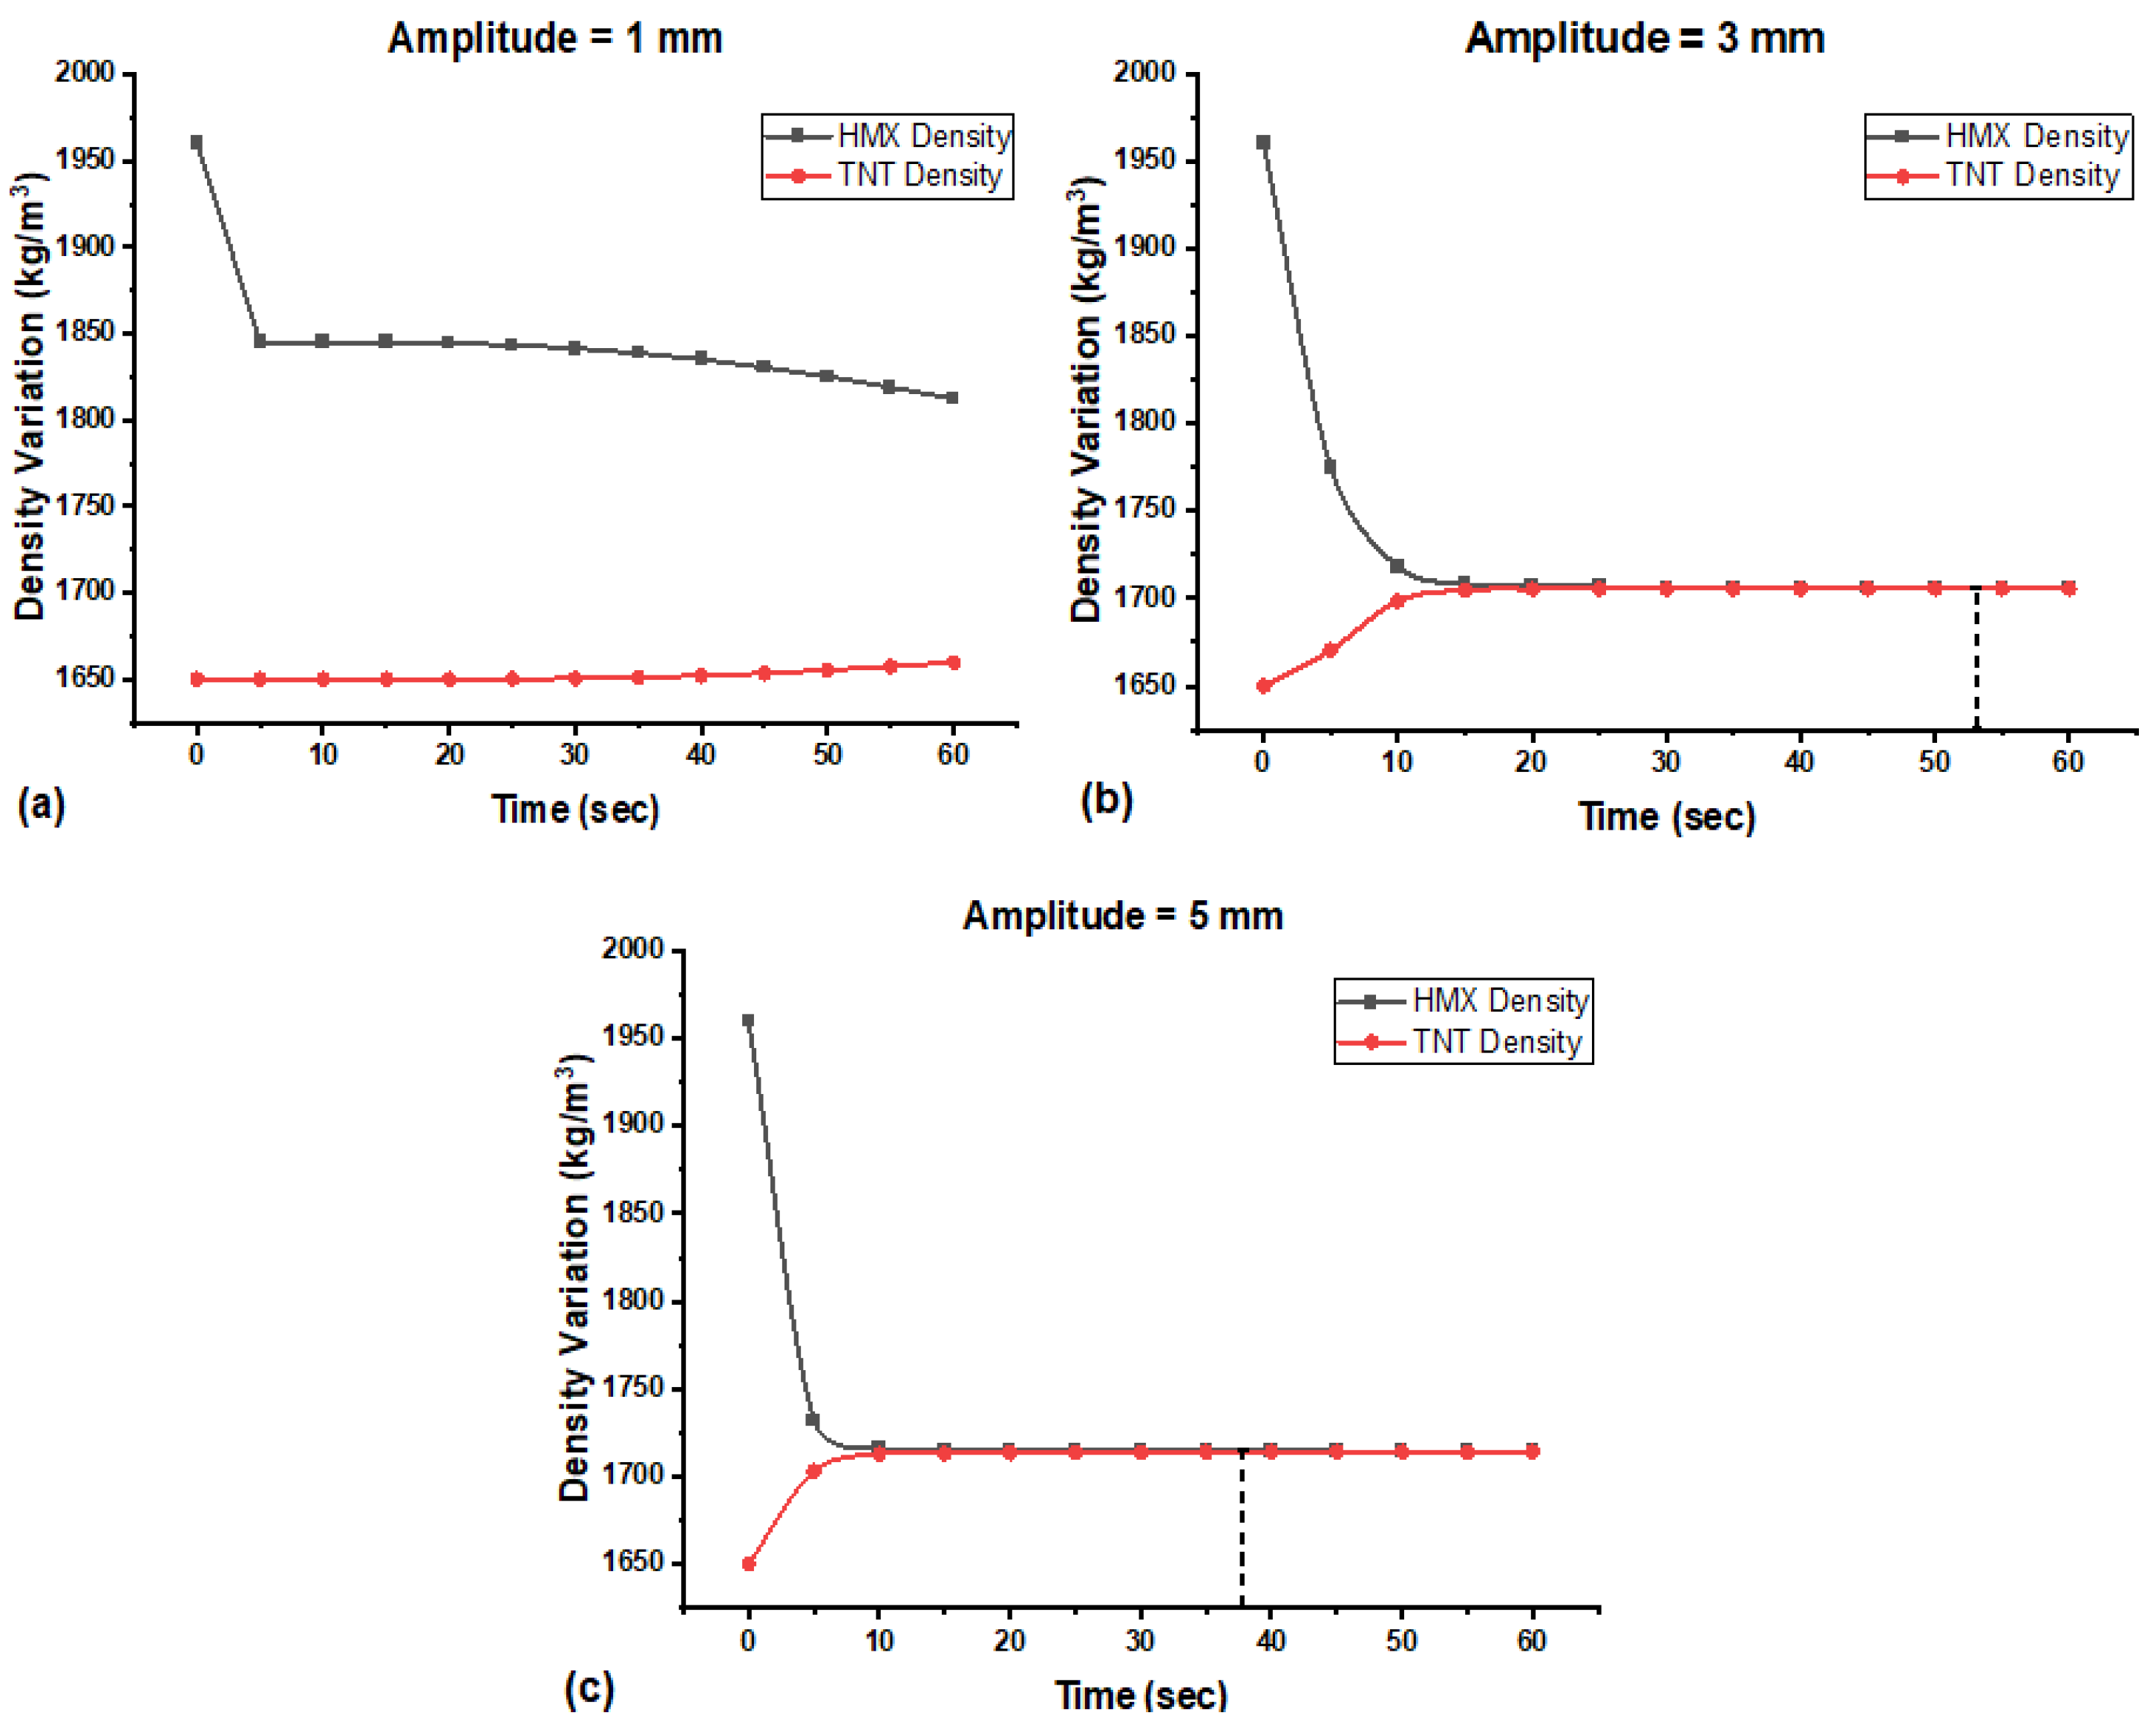
The mixing process was simulated for different values of amplitudes and its efficiency was analyzed for 1 mm, 3 mm, and 5 mm, whereas time and frequency were set as fixed (i.e., 40 Hz and 60 s, respectively), to see how the amplitude affected the mixing uniformity. The plots of density variation over different values of amplitude are shown in Figure 10a–c.
For the simulation of 1 mm amplitude, the density difference was 152.79 kg/m3 after 60 s, therefore, with these parameters, the mixing efficiency was totally undesirable. Similarly, for the 3 mm amplitude, the density difference after 60 s was 0.40 kg/m3. Therefore, uniform mixture was achieved after 56 s. When the amplitude was 5 mm, the results showed that the density difference after 60 s was 0.11 kg/m3, which suits the standards set for uniform mixing, and a uniform mixture could be achieved after 38 s.
The results were compared with each other which showed that lager amplitudes enhanced mixing efficiency. When the value of amplitude was 5 mm, the time required for uniform mixing was 38 s; when the amplitude was 3 mm, the time required was 56 s; and when amplitude was 1 mm, the time required was 98 s. The bigger the amplitude’s value, the better the mixing efficiency. The comparison is displayed in Figure 11.

3.2.2. Effects of Frequency on the Mixing Process

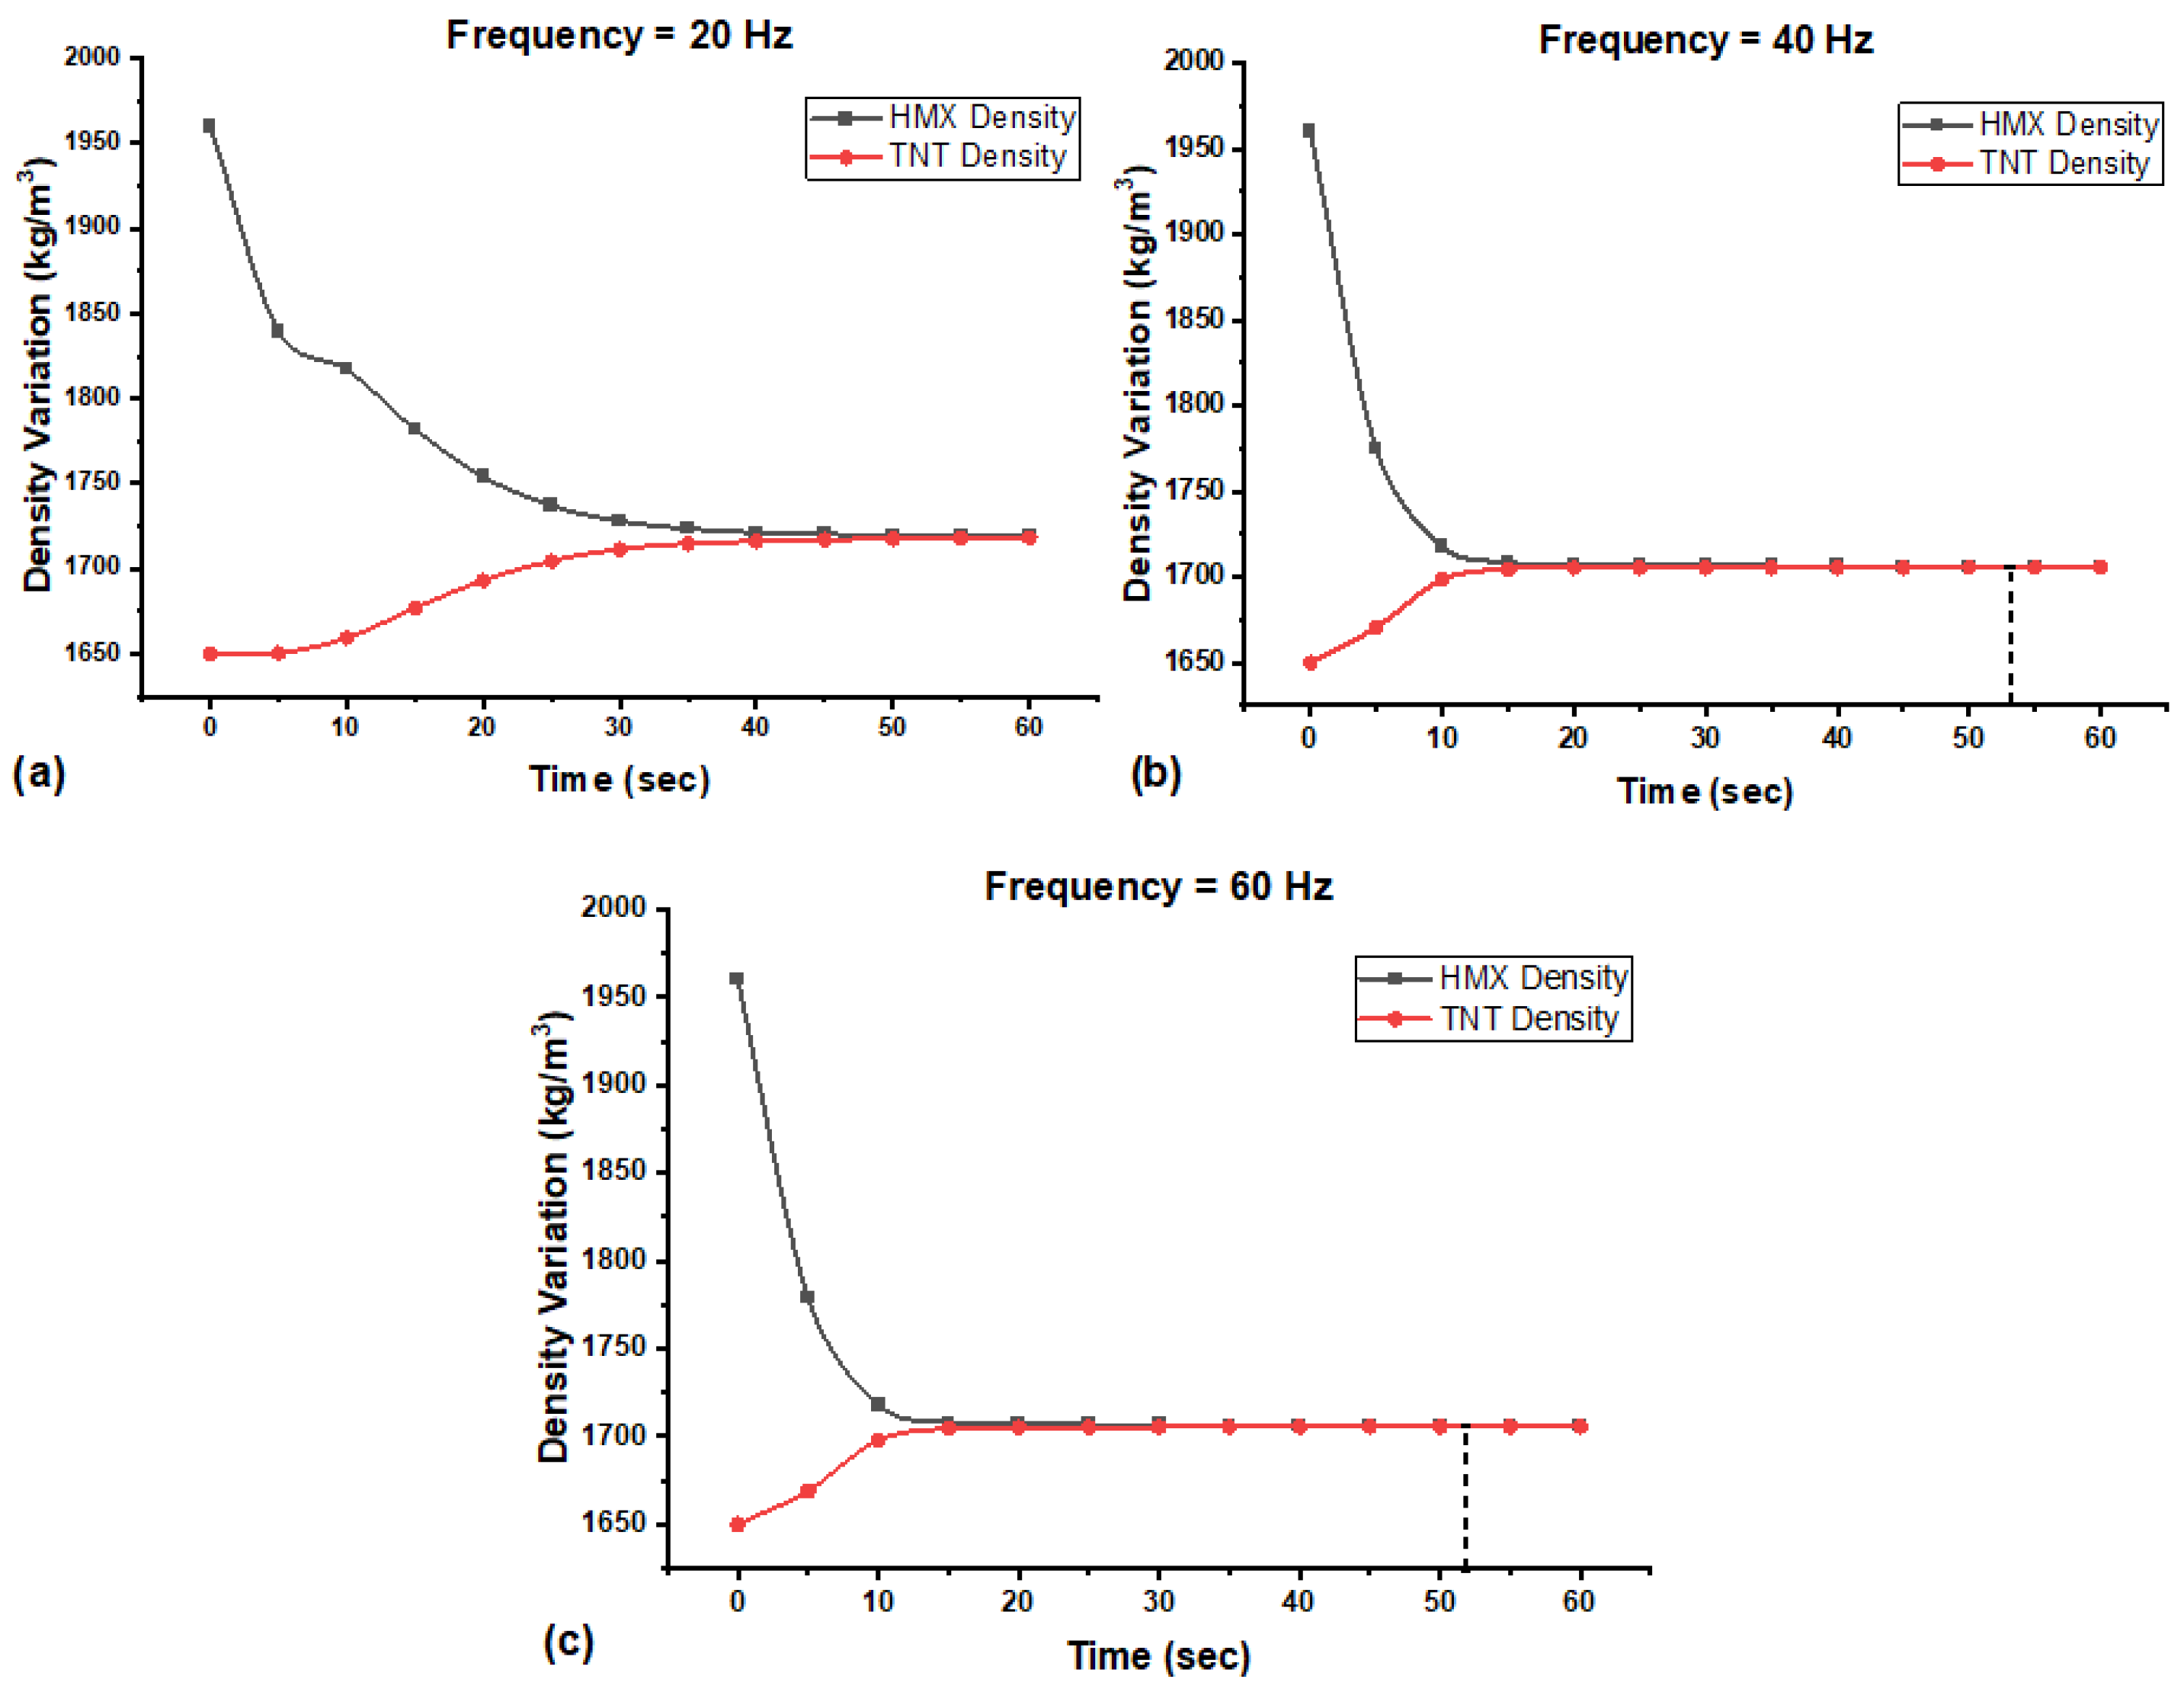
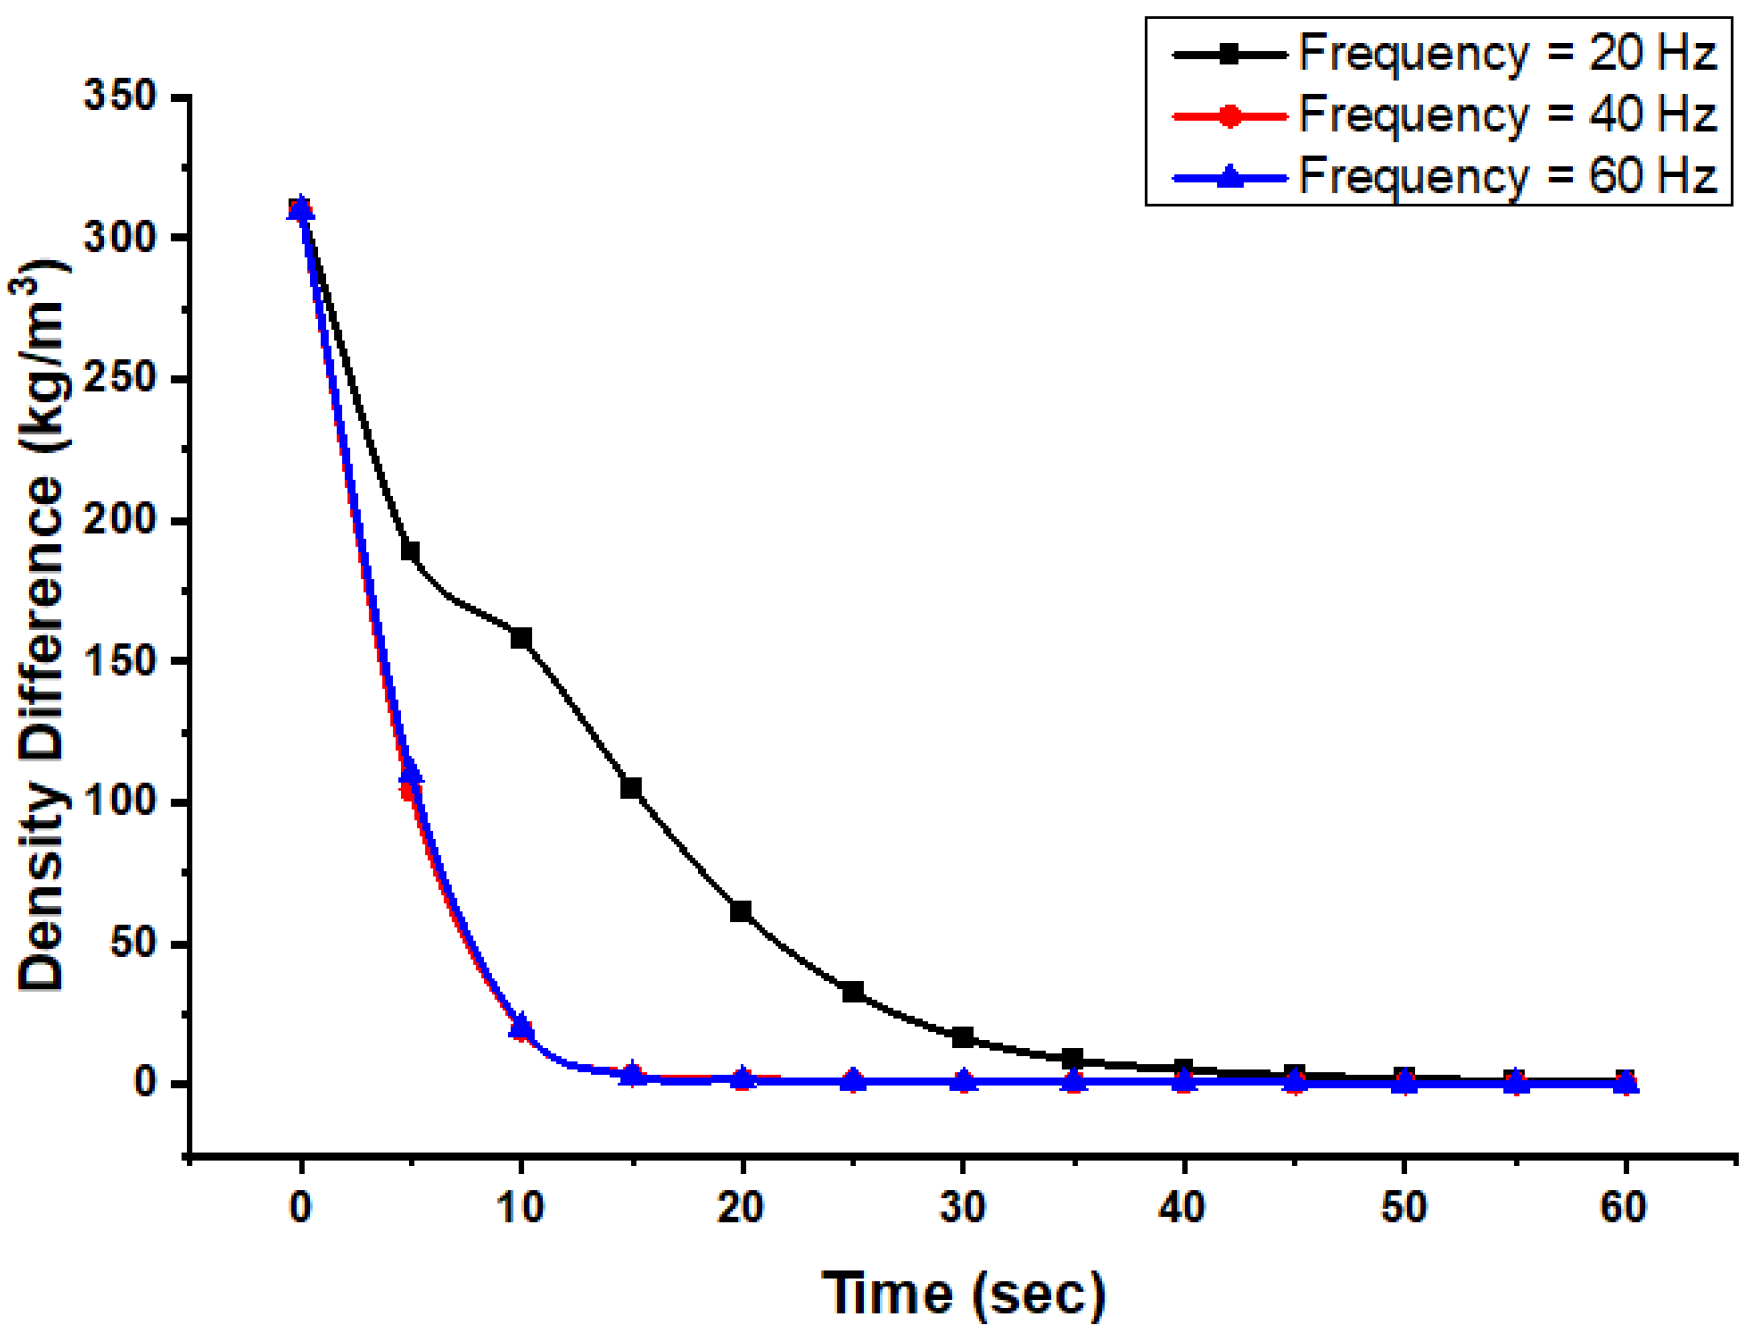
Mixing efficiency was analyzed for different values of frequency from 20 Hz, 40 Hz, to 60 Hz whereas the other parameters, such as amplitude and mixing time, were set as fixed (i.e., 3 mm and 60 s) for all three modules. The results were evaluated to see how frequency affected the mixing process. The plots of density variations over different frequency are shown in Figure 12a–c.
Taking the frequency to be 20 Hz, the density difference was 0.94 kg/m3 after 60 s, which is near the standards set for uniform mixing, but slightly needs some more time to mix uniformly. In addition, when simulating at 40 Hz, the density difference was 0.40 kg/m3, so the mixture could mix uniformly after 56 s. For the simulation of the mixture at 60 Hz, the results showed that the density difference was 0.39 kg/m3 after 60 s, therefore the mixture mixed uniformly after 54 s.
The mixing process efficiency was analyzed for different values of frequency and the results were compared with each other (Figure 13). It is figured that the higher the vibration frequency, the shorter the time required to mix the materials uniformly. The other parameters were same (i.e., 3 mm and 60 s), but when the frequency was 20 Hz, the time needed was about 80–90 s; when the frequency was 40 Hz, the time needed was 56 s; and when the frequency was 60 Hz, the time needed was 54 s.

3.2.3. Effects of Fill Level on the Mixing Process

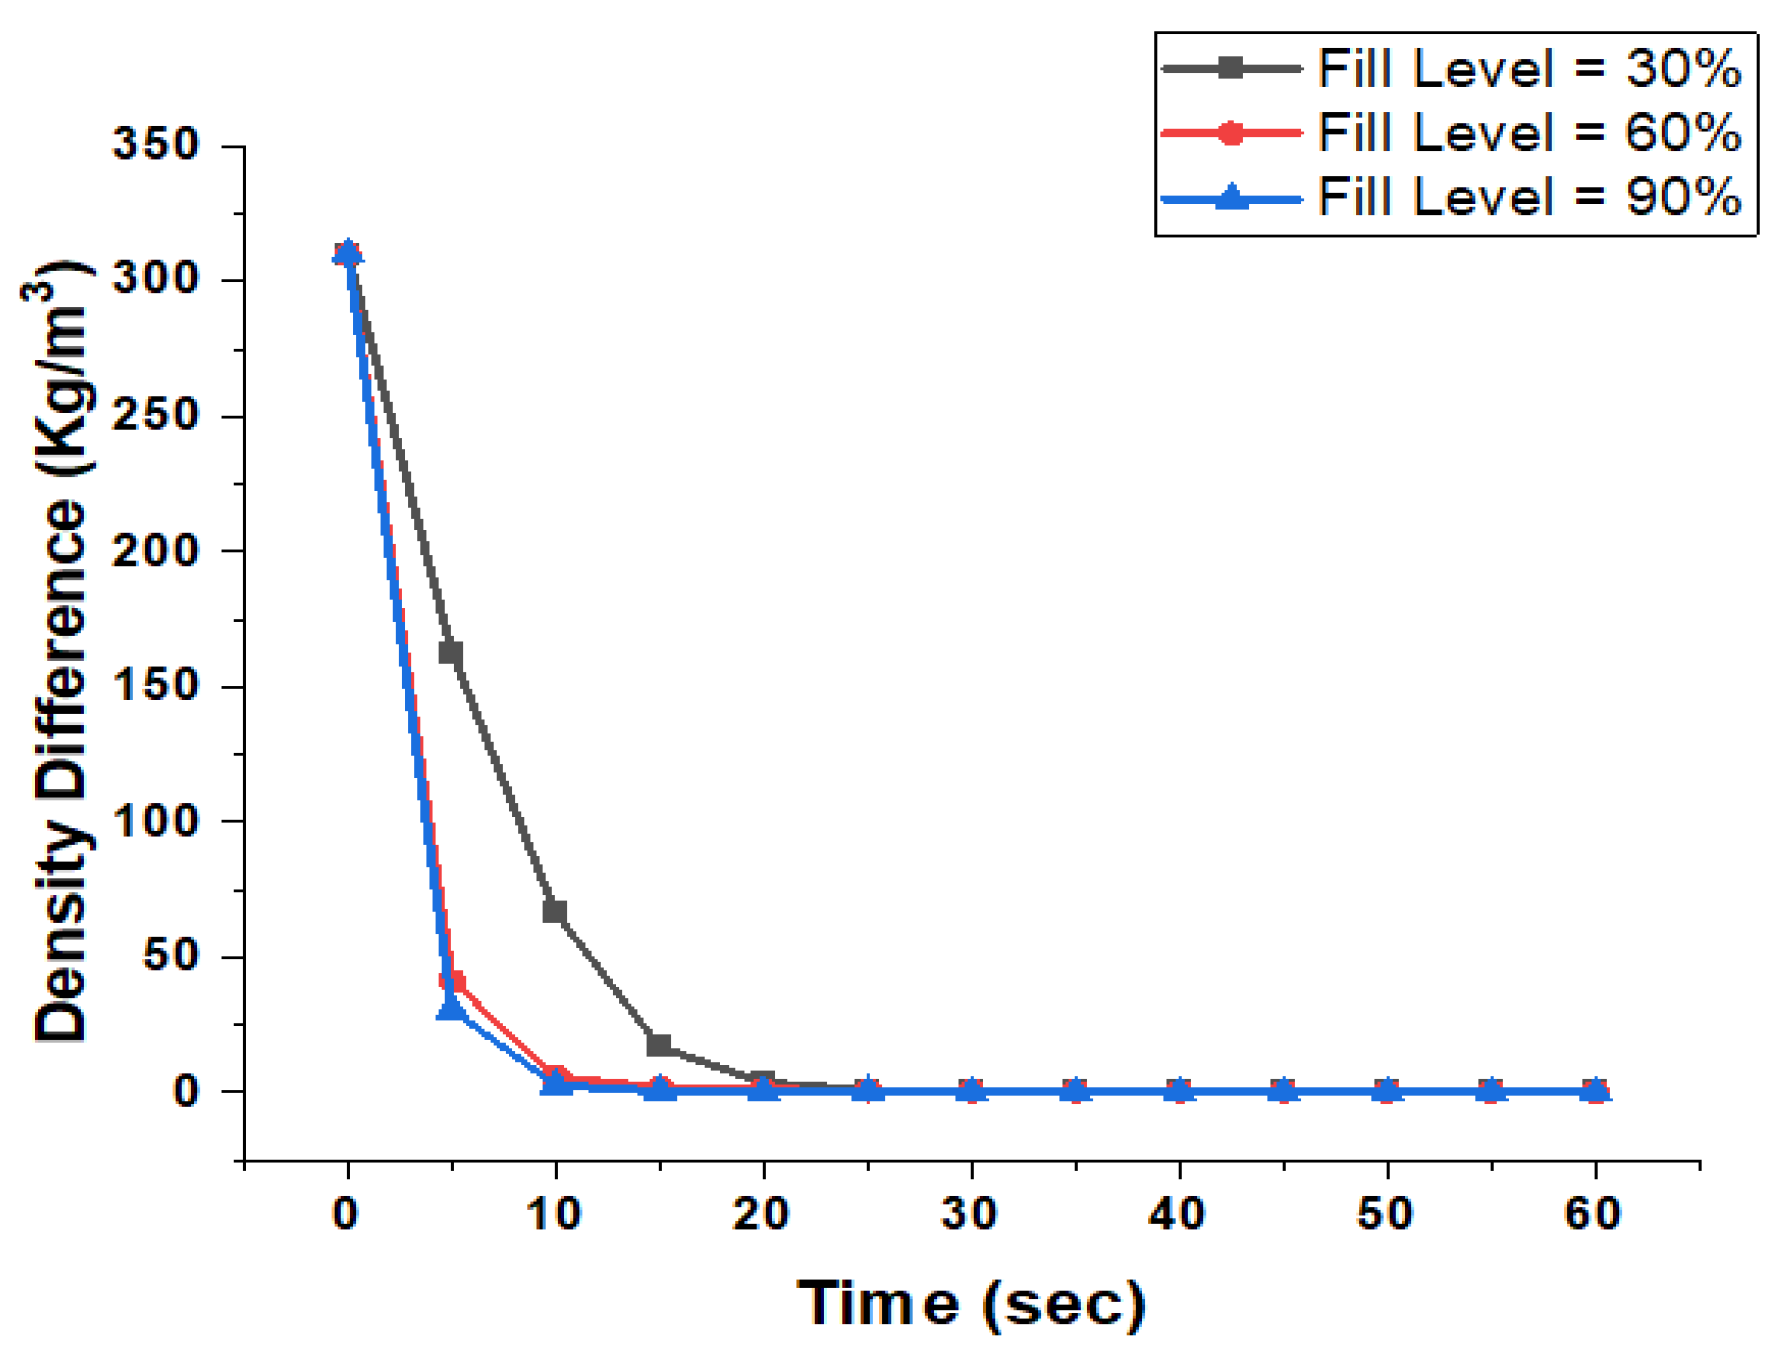
The mixing process was evaluated at different fill levels, including 30%, 60%, and 90%, to see its effect on the mixing uniformity and to check for the optimal fill level for the mixing process in the RAM, as shown in Figure 14a–c.
The results showed that, parallel to amplitude and frequency, fill level also affects the mixing process significantly as shown in Figure 15. When the fill level was 30 percent, the density difference was 0.33569 kg/m3 after 60 s. Similarly, when the vessel was filled up to 60%, the difference was 0.25476 kg/m3, and when the material was filled up to 90%, the density difference after 60 s was 0.09277 kg/m3.
The results were compared on the basis of density difference; therefore, according to the standard set for uniform mixing, among these three fill levels (i.e., 30%, 60%, and 90%), the best fill level for the mixing was that of 90%.

3.2.4. Effects of Vessel Geometry on the Mixing Process

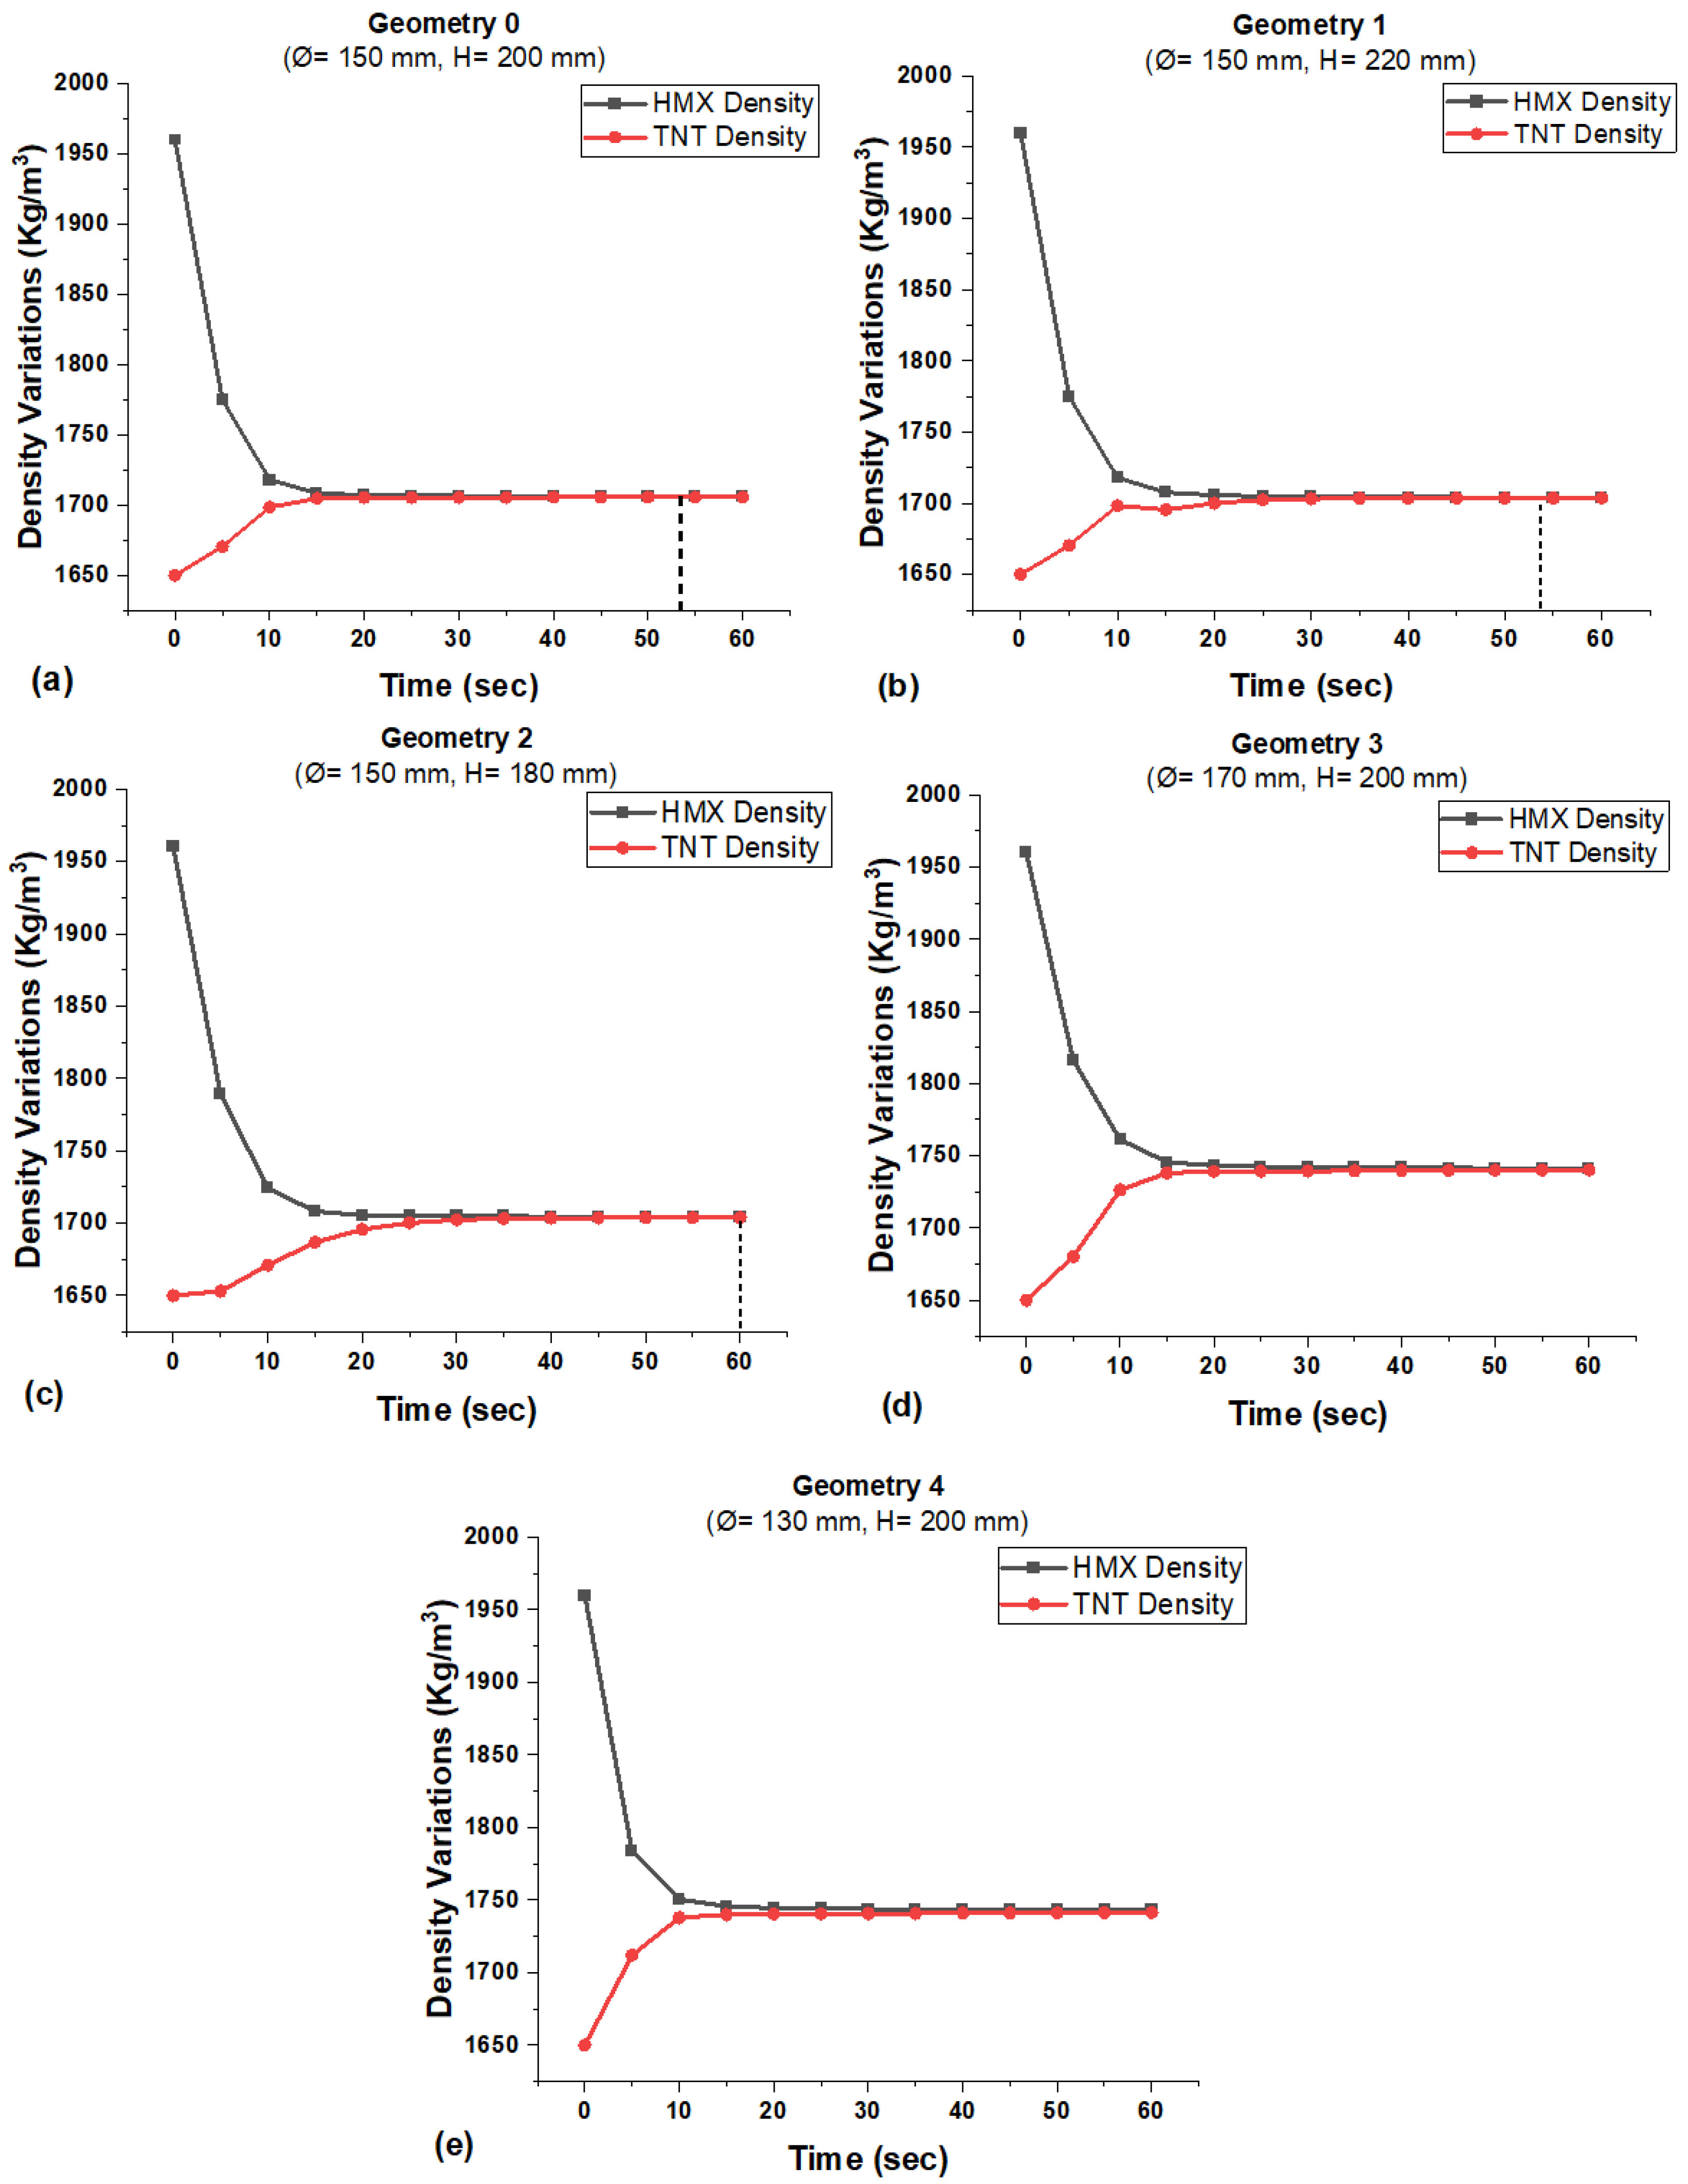
By varying the size of vessel height and diameter, mixing was simulated for five different vessels of various dimensions, as shown in Figure 16a–e. The vessel with diameter (Ø) of 150 mm and height (H) of 200 mm was set to be the control geometry. The first two vessels had the dimensions of 170 × 200 mm and 130 × 200 mm, and the last two vessels had the dimensions of 150 × 220 mm and 150 × 180 mm, respectively.
The results in the table show that geometric changes do not affect significantly. Only the change in the height of the vessel makes a slight change, but it is not that much to take into consideration. Additionally, the change in diameter affects the process negatively as the density difference is above the mixing standards set for uniform mixing.

3.3. The Overall Comparison

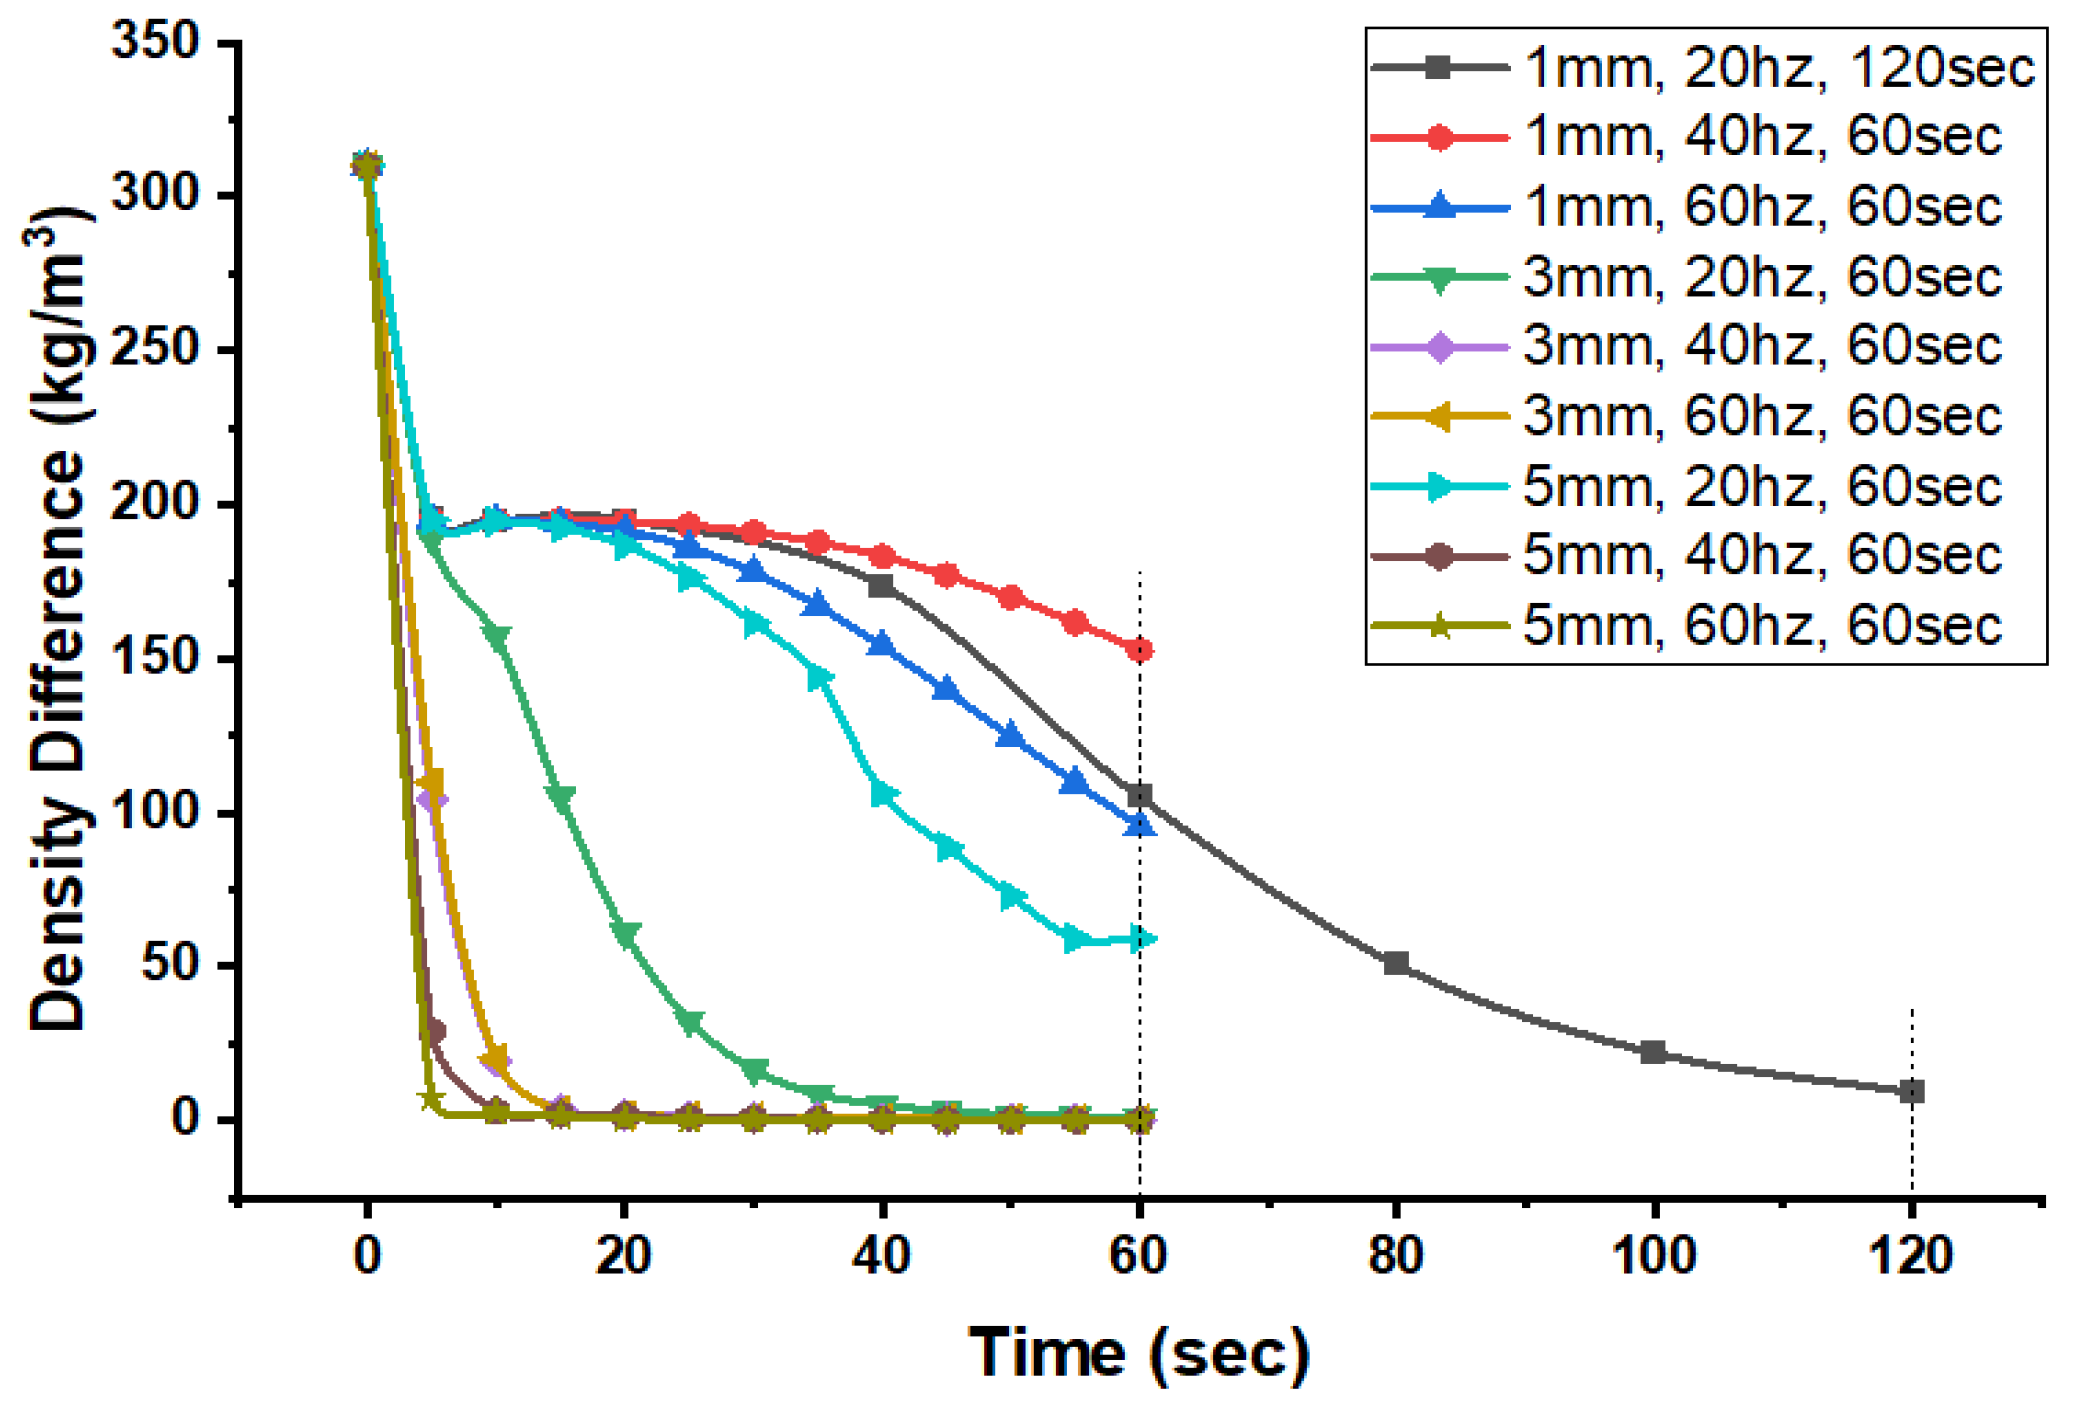
The mixing of high-viscosity mixtures was accomplished by resonant acoustic mixing (RAM) technology and evaluated through different simulations in Fluent. After that, the simulations were put together for comparison to check for the optimal mixing process. Figure 17 shows the overall comparison of mixing efficiency of RAM.
The results were compared with each other, and from the combined results, the graph shows that the best efficiency among all simulations is that of 5 mm and 60 Hz, in which the mixture is mixed uniformly just after 24 s. Following that, the second best is for 5 mm and 40 Hz, in which the time required for the material in the vessel to reach uniform is 38 s. The third best efficiency is for 3 mm and 60 Hz at 60 s, where the mixture is mixed uniformly after 54 s. Therefore, the optimal boundary conditions for the mixing process are set to have 5 mm in amplitude, 60 Hz in frequency, a fill level of 90%, and a vessel with a diameter (Ø) of 150 mm and a height (H) of 200 mm.

4. Conclusions

The presented work in this paper offers a qualitative study of resonant acoustic mixing technology for the mixing of high-viscosity mixtures. This makes it an attractive mixing technique as it reduces the cost of wear and tear of the mixing device. Furthermore, it is a non-contact mixing process, which could be beneficial in cases where the interaction of the mixing tool and the mixing medium is an important parameter to consider. The main observation from the results described here is that better mixing performance in the resonant acoustic mixer is achieved when the mixing process runs at higher amplitude and frequency. The resonant acoustic mixing (RAM) technology allows to obtain a better quality of the final mixtures in a reduced amount of time.
Starting from the theory of multiphase flow, this paper takes a RAM system as the research object and tries to start from numerical simulation. The conclusions that can be drawn are as follows:
(1)
This study established a finite element model of the resonance acoustic mixing system in ANSYS workbench, performed modal analysis, and compared it with the operating frequency. The results show that the designed structure’s natural frequency is lower than the operating frequency, so that resonance or damage is avoided.
(2)
The dynamic mesh parameters were defined, the initial conditions of the simulation were set, and the materials were filled according to the specified ratio.
(3)
According to the shape of the inner cavity of the mixing vessel, the corresponding three-dimensional (3D) flow field model was established in the Fluent. Through simulation calculation, the mixing efficiency of the mixing vessel was analyzed.
(4)
Using the control volume method, the influence of vibrational frequency and amplitude on the mixing efficiency of the RAM was analyzed.
(5)
The results show that amplitude and frequency both have greater influence in the mixing efficiency of the RAM, because, in the simulations with larger values of amplitude and smaller values of frequency, and vice versa, the mixing uniformity is not good enough. However, when the amplitude and frequency both have the largest given values, such as in the simulations of 5 mm, 60 Hz, and 60 s; 5 mm, 40 Hz, and 60 s; 3 mm, 60 Hz, and 60 s; and 3 mm, 40 Hz, and 60 s, the mixing efficiency is very good.
(6)
Mixing performance was found to be independent of time. The longer mixing time did not affect the mixing process significantly as it was mainly dependent on the amplitude as well as on frequency. In addition, in between amplitude and frequency, the efficiency was more dependent on amplitude when it was compared with higher values of frequency.
(7)
These simulations can be used for understanding the mixing of highly viscous materials by using resonant acoustic mixing technology’s approach. This approach could potentially be used for pharmaceutical blending as well as for explosive applications.

5. Recommendations for the Future Work

Since the conclusions of this paper are based only on the results of numerical simulations, and actual experiments are not performed, therefore further experimental research is needed to support the conclusions obtained through simulation in this paper, and the composition proportion of the mixed materials needs to be further expanded and subsequent work can be followed.
In the future, the authors plan to add a comparison of experimental results with simulation ones, and add some other parameters and examine their effects on the mixing performance of the RAM.

Author Contributions

Conceptualization and supervision of the project were provided by R.G.; methodology setting, investigations, and writing—original draft preparation were conducted by I.U.K.; software usage was supported by U.F.; review, editing, and project administration were offered by H.Z. and S.A. All authors have read and agreed to the published version of the manuscript.

Funding

This research received no external funding, however the APC was funded by [Guo Rui].

Data Availability Statement

Any type or any kind of data or information will be made available upon reasonable request.

Conflicts of Interest

The authors declare no conflict of interest.

References

  1. Paul, E.L.; Atiemo-Obeng, V.; Kresta, S. Handbook of Industrial Mixing; Wiley Online Library: Hoboken, NJ, USA, 2004. [Google Scholar]
  2. Osorio, J.G.M.; Fernando, J. Evaluation of resonant acoustic mixing performance. Powder Technol. 2015, 278, 46–56. [Google Scholar] [CrossRef]
  3. Asachi, M.; Nourafkan, E.; Hassanpour, A. A review of current techniques for the evaluation of powder mixing. Adv. Powder Technol. 2018, 29, 1525–1549. [Google Scholar] [CrossRef]
  4. Muzzio, F.J.; Llusa, M.; Goodridge, C.L.; Duong, N.H.; Shen, E. Evaluating the mixing performance of a ribbon blender. Powder Technol. 2008, 186, 247–254. [Google Scholar] [CrossRef]
  5. Nance, D.V. An Examination of the Resonant Acoustic Mixers Flow Field; Air Force Research Lab Eglin Afb Fl Munitions Directorate; p. 2013. Available online: https://apps.dtic.mil/sti/citations/ADA590055 (accessed on 23 November 2022).
  6. Muzzio, F.J.; Shinbrot, T.; Glasser, B.J. Powder technology in the pharmaceutical industry: The need to catch up fast. Powder Technol. 2002, 124, 1–7. [Google Scholar] [CrossRef]
  7. Andrews, M.R.; Collet, C.; Wolff, A.; Hollands, C. Resonant acoustic® mixing: Processing and safety. Propellants Explos. Pyrotech. 2020, 45, 77–86. [Google Scholar] [CrossRef]
  8. Vandenberg, A.; Wille, K. Evaluation of resonance acoustic mixing technology using ultra high performance concrete. Constr. Build. Mater. 2018, 164, 716–730. [Google Scholar] [CrossRef]
  9. Leung, D.H.; Lamberto, D.J.; Liu, L.; Kwong, E.; Nelson, T.; Rhodes, T.; Bak, A. A new and improved method for the preparation of drug nanosuspension formulations using acoustic mixing technology. Int. J. Pharm. 2014, 473, 10–19. [Google Scholar] [CrossRef]
  10. Batmaz, E.; Sandeep, K.P. Integration of ResonantAcoustic® mixing into thermal processing of foods: A comparison study against other in-container sterilization technologies. J. Food Eng. 2015, 165, 124–132. [Google Scholar] [CrossRef]
  11. Claydon, A.J.; Patil, A.N.; Gaulter, S.; Kister, G.; Gill, P.P. Determination and optimisation of Resonant Acoustic Mixing (RAM) efficiency in Polymer Bonded eXplosive (PBX) processing. Chem. Eng. Process.-Process Intensif. 2022, 173, 108806. [Google Scholar] [CrossRef]
  12. Han, D.F. Raissa Douglas Influence of high mixing intensity on rheology, hydration, and microstructure of fresh state cement paste. Cem. Concr. Res. 2016, 84, 95–106. [Google Scholar] [CrossRef]
  13. Han, D.; Ferron, R.D. Effect of mixing method on microstructure and rheology of cement paste. Constr. Build. Mater. 2015, 93, 278–288. [Google Scholar] [CrossRef] [Green Version]
  14. Juilland, P.; Kumar, A.; Gallucci, E.; Flatt, R.J.; Scrivener, K.L. Effect of mixing on the early hydration of alite and OPC systems. Cem. Concr. Res. 2012, 42, 1175–1188. [Google Scholar] [CrossRef]
  15. Zhan, X.; He, Y.; Sun, Z.; Shen, B.; Li, X. Mixing Characteristics of High-Viscosity Fluids under Forced Vertical Vibration. Chem. Eng. Technol. 2020, 43, 1327–1335. [Google Scholar] [CrossRef]
  16. Zhan, X.; Sun, Z.; He, Y.; Shen, B.; Shi, T.; Li, X. Characterization of fluid mixing in a closed container under horizontal vibrations. Can. J. Chem. Eng. 2019, 97, 1931–1938. [Google Scholar] [CrossRef]
  17. Cheng, W.; Mu, J.; Li, K.; Xie, Z.; Zhang, P.; An, C.; Ye, B.; Wang, J. Evolution of HTPB/RDX/Al/DOA mixed explosives with 90% solid loading in resonance acoustic mixing process. J. Energetic Mater. 2021, 1–20. [Google Scholar] [CrossRef]
  18. Hashimoto, H.; Sudo, S. Surface disintegration and bubble formation in vertically vibrated liquid column. AIAA J. 1980, 18, 442–449. [Google Scholar] [CrossRef]
  19. Tso, C.P.; Lim, T.L.; Low, L.C.; Lee, G.C.; Yap, T.C. Fifteenth Asian Congress of Fluid Mechanics (15ACFM). J. Phys. Conf. Ser. 2017, 822, 011001. [Google Scholar] [CrossRef] [Green Version]
  20. Zeff, B.W.; Kleber, B.; Fineberg, J.; Lathrop, D.P. Singularity dynamics in curvature collapse and jet eruption on a fluid surface. Nature 2000, 403, 401–404. [Google Scholar] [CrossRef] [PubMed]
  21. Hashimoto, H.; Sudo, S. Drop formation mechanism in a vertically vibrated liquid column. AIAA J. 1987, 25, 727–732. [Google Scholar] [CrossRef]
  22. Nelson, A.; Miller, M. Resonant Acoustic Mixing of High-Energy Composite Materials. In SERDP. ESTCP Symposium; Resodyn Corporation: Butte, MT, USA, 2018. [Google Scholar]
  23. Hashimoto, H.; Sudo, S. Dynamic behavior of stratified fluids in a rectangular container subject to vertical vibration. Bull. JSME 1985, 28, 1910–1917. [Google Scholar] [CrossRef]
  24. Osorio, J.G.; Hernández, E.; Romañach, R.J.; Muzzio, F.J. Characterization of resonant acoustic mixing using near-infrared chemical imaging. Powder Technol. 2016, 297, 349–356. [Google Scholar] [CrossRef]
  25. Wang, Y.; Osorio, J.G.; Li, T.; Muzzio, F.J. Controlled shear system and resonant acoustic mixing: Effects on lubrication and flow properties of pharmaceutical blends. Powder Technol. 2017, 322, 332–339. [Google Scholar] [CrossRef]
  26. Nagapudi, K.; Umanzor, E.Y.; Masui, C. High-throughput screening and scale-up of cocrystals using resonant acoustic mixing. Int. J. Pharm. 2017, 521, 337–345. [Google Scholar] [CrossRef] [PubMed]
  27. Zhang, S.; Wang, X. Effect of vibration parameters and wall friction on the mixing characteristics of binary particles in a vertical vibrating container subject to cohesive forces. Powder Technol. 2023, 413, 118078. [Google Scholar] [CrossRef]
  28. Pahl, M.H.; Wittreck, H. Three-dimensional vibrational mixing. Chem. Eng. Technol. Ind. Chem.-Plant Equip.-Process Eng.-Biotechnol. 1997, 20, 511–521. [Google Scholar] [CrossRef]
  29. Yang, S. Density effect on mixing and segregation processes in a vibrated binary granular mixture. Powder Technol. 2006, 164, 65–74. [Google Scholar] [CrossRef]
  30. Katayama, T.; Aoyama, E.; Yamamoto, K.; Sakaue, S. Evaluation of two-component powder mixing by vertical vibration: Investigation of powder behavior and mixed state by internal pressure fluctuation. J. Mater. Process. Technol. 2004, 155, 1571–1576. [Google Scholar]
  31. Osorio, J.G.; Sowrirajan, K.; Muzzio, F.J. Effect of resonant acoustic mixing on pharmaceutical powder blends and tablets. Adv. Powder Technol. 2016, 27, 1141–1148. [Google Scholar] [CrossRef] [Green Version]
  32. Moshe, S.S.B.; Ronen, Z.; Dahan, O.; Weisbrod, N.; Groisman, L.; Adar, E.; Nativ, R. Sequential biodegradation of TNT, RDX and HMX in a mixture. Environ. Pollut. 2009, 157, 2231–2238. [Google Scholar] [CrossRef]
  33. Urbanski, T.; Laverton, S.; Ornaf, W. Chemistry and Technology of Explosives; Pergamon Press: Oxford, UK, 1964; Volume 1. [Google Scholar]
  34. Dobratz, B.M. Ethylenediamine Dinitrate and its Eutectic Mixtures: A Historical Review of the Literature to 1982. 1983. Available online: https://apps.dtic.mil/sti/citations/ADA131641 (accessed on 23 November 2022).
  35. Lawless, Z.D.; Hobbs, M.L.; Kaneshige, M.J. Thermal conductivity of energetic materials. J. Energetic Mater. 2020, 38, 214–239. [Google Scholar] [CrossRef]
  36. RAM Technical White Paper; Resodyn Corporation: Butte, MT, USA, 2009.
  37. S., L.J.T.; Miller, P.L. Idustrial Outcomes in Resonant Acoustic_Mixing. In Mix Power: Resodyn Forum; Resodyne Acoustic Mixers: Butte, MT, USA, 2013. [Google Scholar]
  38. Howe, H.W.; Warriner, J.J.; Cook, A.M.; Coguill, S.L.; Farrar, L.C. Apparatus and Method for Resonant-Vibratory Mixing. U.S. Patent No. 7,188,993, 13 March 2007. [Google Scholar]
  39. Coguill, S.; Farrar, L.; Mixers, R.A. Resodyn Acoustic. Resonant acoustic mixing of PBX. In International Pyrotechnics Seminar; Resodyn Acoustic Mixers: Butte, MT, USA, 2014. [Google Scholar]
  40. Coguill, S.; Martineau, Z.; Martineau, Z.R. Vessel Geometry and Fluid Properties Influencing Mix Behavior for ResonantAcoustic Mixing Processes. In Proceedings of the 38th International Pyrotechnics Seminar, Denver, CO, USA, 10–15 June 2012. [Google Scholar]
  41. Keller, A.V.; Vandromme, D.; Zaleski, S. Proceedings of the 6th International Conference on Liquid Atomization and Sprays Systems Process, Rouen, France, 18–22 July 1994; Descriçao, E., Ed.; Begell House: Danbury, CT, USA, 1994. [Google Scholar]
  42. Bale, S.; Clavin, K.; Sathe, M.; Berrouk, A.S.; Knopf, F.C.; Nandakumar, K. Mixing in oscillating columns: Experimental and numerical studies. Chem. Eng. Sci. 2017, 168, 78–89. [Google Scholar] [CrossRef]
  43. Harewood, F.J.; McHugh, P.E. Investigation of finite element mesh independence in rate dependent materials. Comput. Mater. Sci. 2006, 37, 442–453. [Google Scholar] [CrossRef]
  44. Ramayee, L.; Supradeepan, K. Grid convergence study on flow past a circular cylinder for beginners. In AIP Conference Proceedings; AIP Publishing LLC: New York, NY, USA, 2021. [Google Scholar]
  45. Almeida, Z.; da Silva, Y.P.; Jr, E.F.; Vianna, S. Assessment of richardson extrapolation method in the cfd mesh convergence pro-cess. In I Congresso Brasileiro de Fluidodinamica Computational; PB: Campina Grande, Brazil, 2016. [Google Scholar]
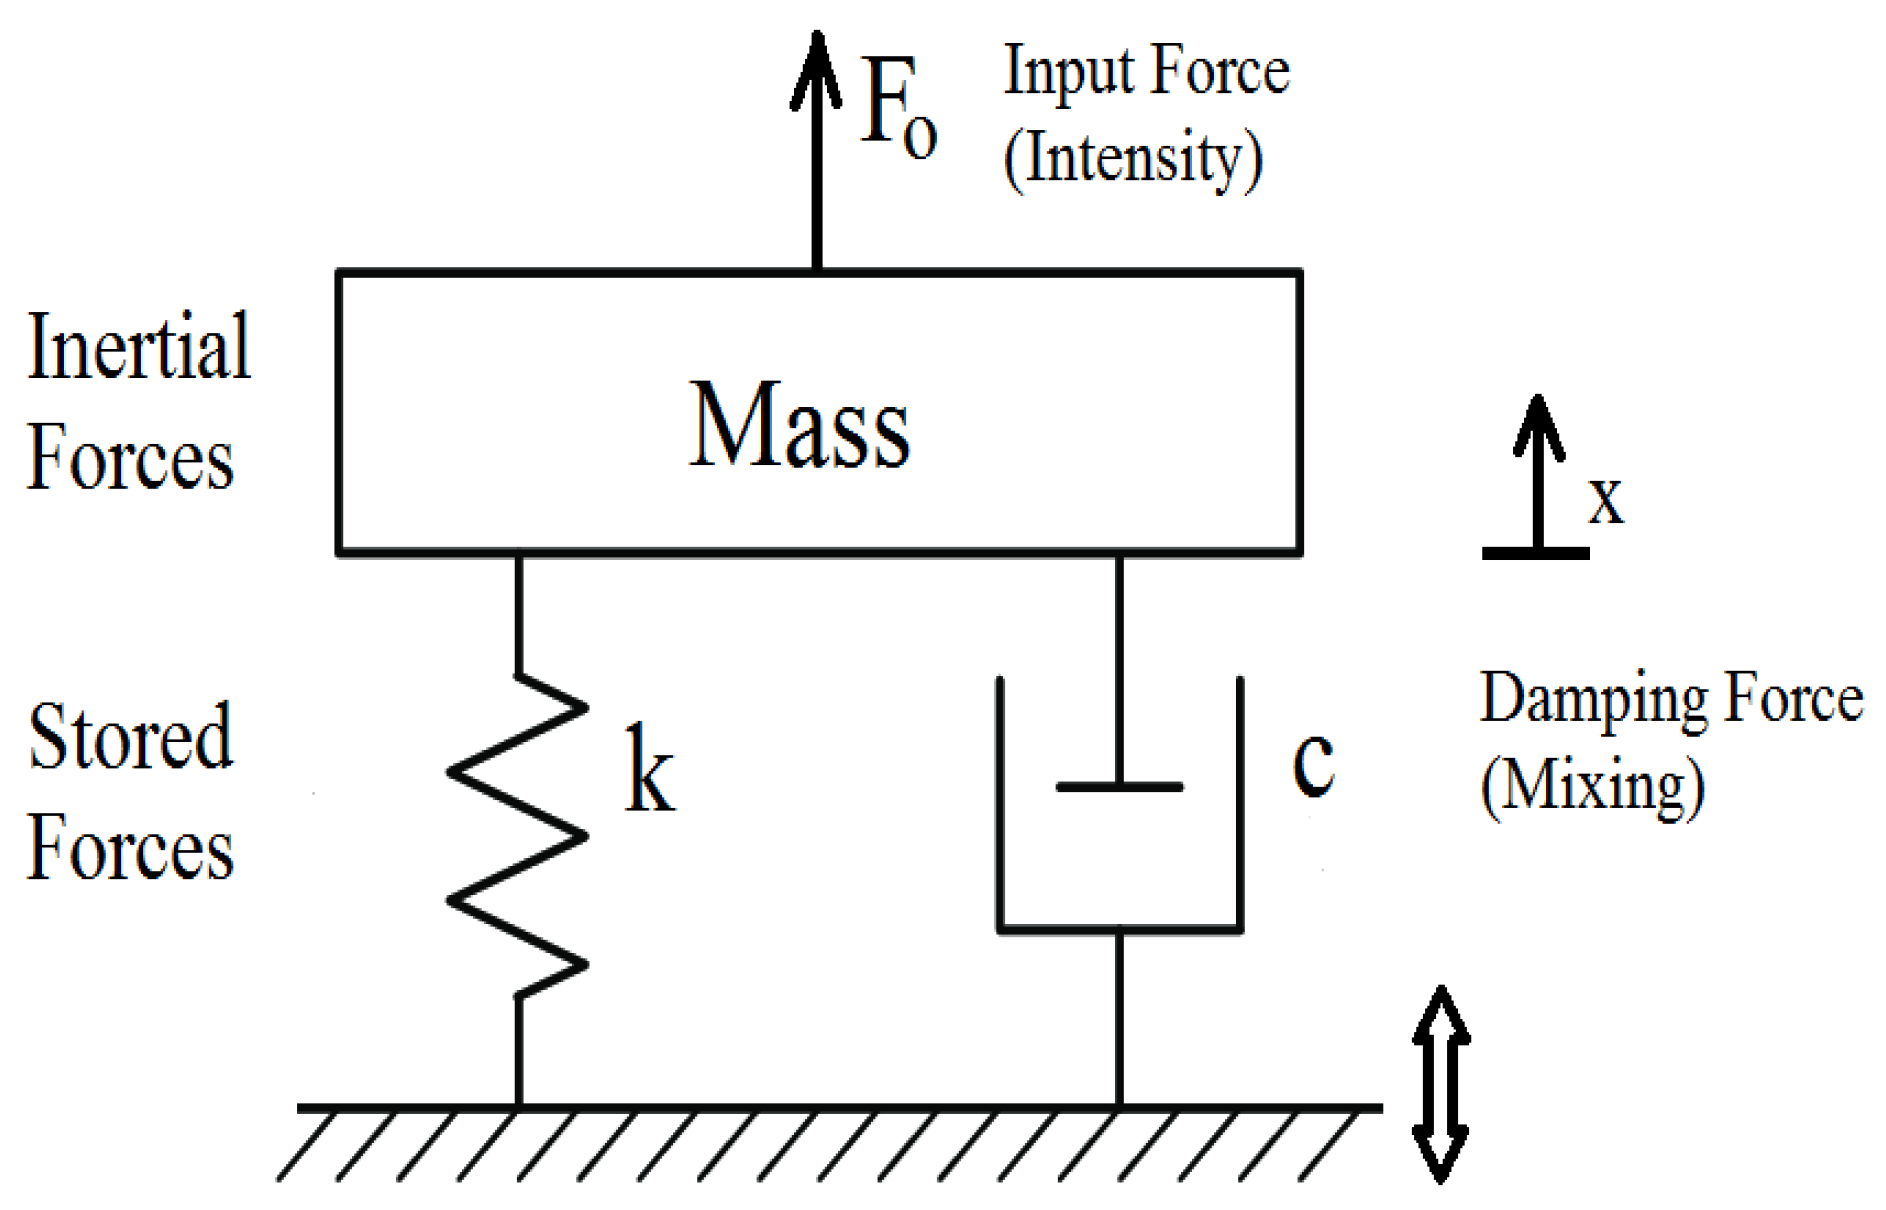
Figure 1. Schematic diagram of the RAM System (Simple Mass-Spring-Damper System).
Processes 11 00266 g001
Figure 2. RAM mixing mechanism and mix material motion schematic.
Processes 11 00266 g002
Figure 3. Three-dimensional computational geometry with hexahedral mesh.
Processes 11 00266 g003
Figure 4. Sinusoidal motion curve produced by MATLAB.
Processes 11 00266 g004
Figure 5. Mesh independence test for different meshes.
Processes 11 00266 g005
Figure 6. Plot of fractional mixing volume as a function of time.
Processes 11 00266 g006
Figure 7. Plots of density contours from initial mass fraction distribution configuration (t = 0 s) to end time of the mixing process (t = 120 s).
Processes 11 00266 g007
Figure 8. Mixture density curves at every 5 s interval from the start (at t = 0 s) to end time of the mixing process (t = 120 s).
Processes 11 00266 g008
Figure 9. Final density cloud after 120 s.
Processes 11 00266 g009
Figure 10. Plots of density variation from (a–c) over different values of amplitude.
Processes 11 00266 g010
Figure 11. Mixing efficiency comparison based on amplitude.
Processes 11 00266 g011
Figure 12. Plots of Density Variation from (a–c) over different values of frequency.
Processes 11 00266 g012
Figure 13. Mixing efficiency comparison based on frequency.
Processes 11 00266 g013
Figure 14. Plots of density difference at (a) fill level of 30%, (b) fill level of 60%, and (c) fill level of 90%.
Processes 11 00266 g014
Figure 15. Plot of mixing efficiency comparison over different fill levels.
Processes 11 00266 g015
Figure 16. Plots of density variations from (ae) over different vessel geometries.
Processes 11 00266 g016
Figure 17. Overall comparison of mixing efficiency of RAM.
Processes 11 00266 g017
Table 1. Physical and mechanical properties of the mixing materials.
Material PropertyHMXTNT
Density1960 kg/m31650 kg/m3
Viscosity7.5 kg/m-sec7.5 kg/m-sec
Phase change temperature441 °K350 °K
Thermal conductivity0.51 W-m−1K−10.26 W-m−1K−1
Detonation velocity9100 m/sec6900 m/sec
Melting point549 to 559 °K353.50 °K
Disclaimer/Publisher’s Note: The statements, opinions and data contained in all publications are solely those of the individual author(s) and contributor(s) and not of MDPI and/or the editor(s). MDPI and/or the editor(s) disclaim responsibility for any injury to people or property resulting from any ideas, methods, instructions or products referred to in the content.