

Using Particle Residence Time Distributions as an Experimental Approach for Evaluating the Performance of Different Designs for a Pilot-Scale Spray Dryer

Abstract
:
1. Introduction
2. Materials and Methods
2.1. Chemicals
2.2. Spray Drying Processes
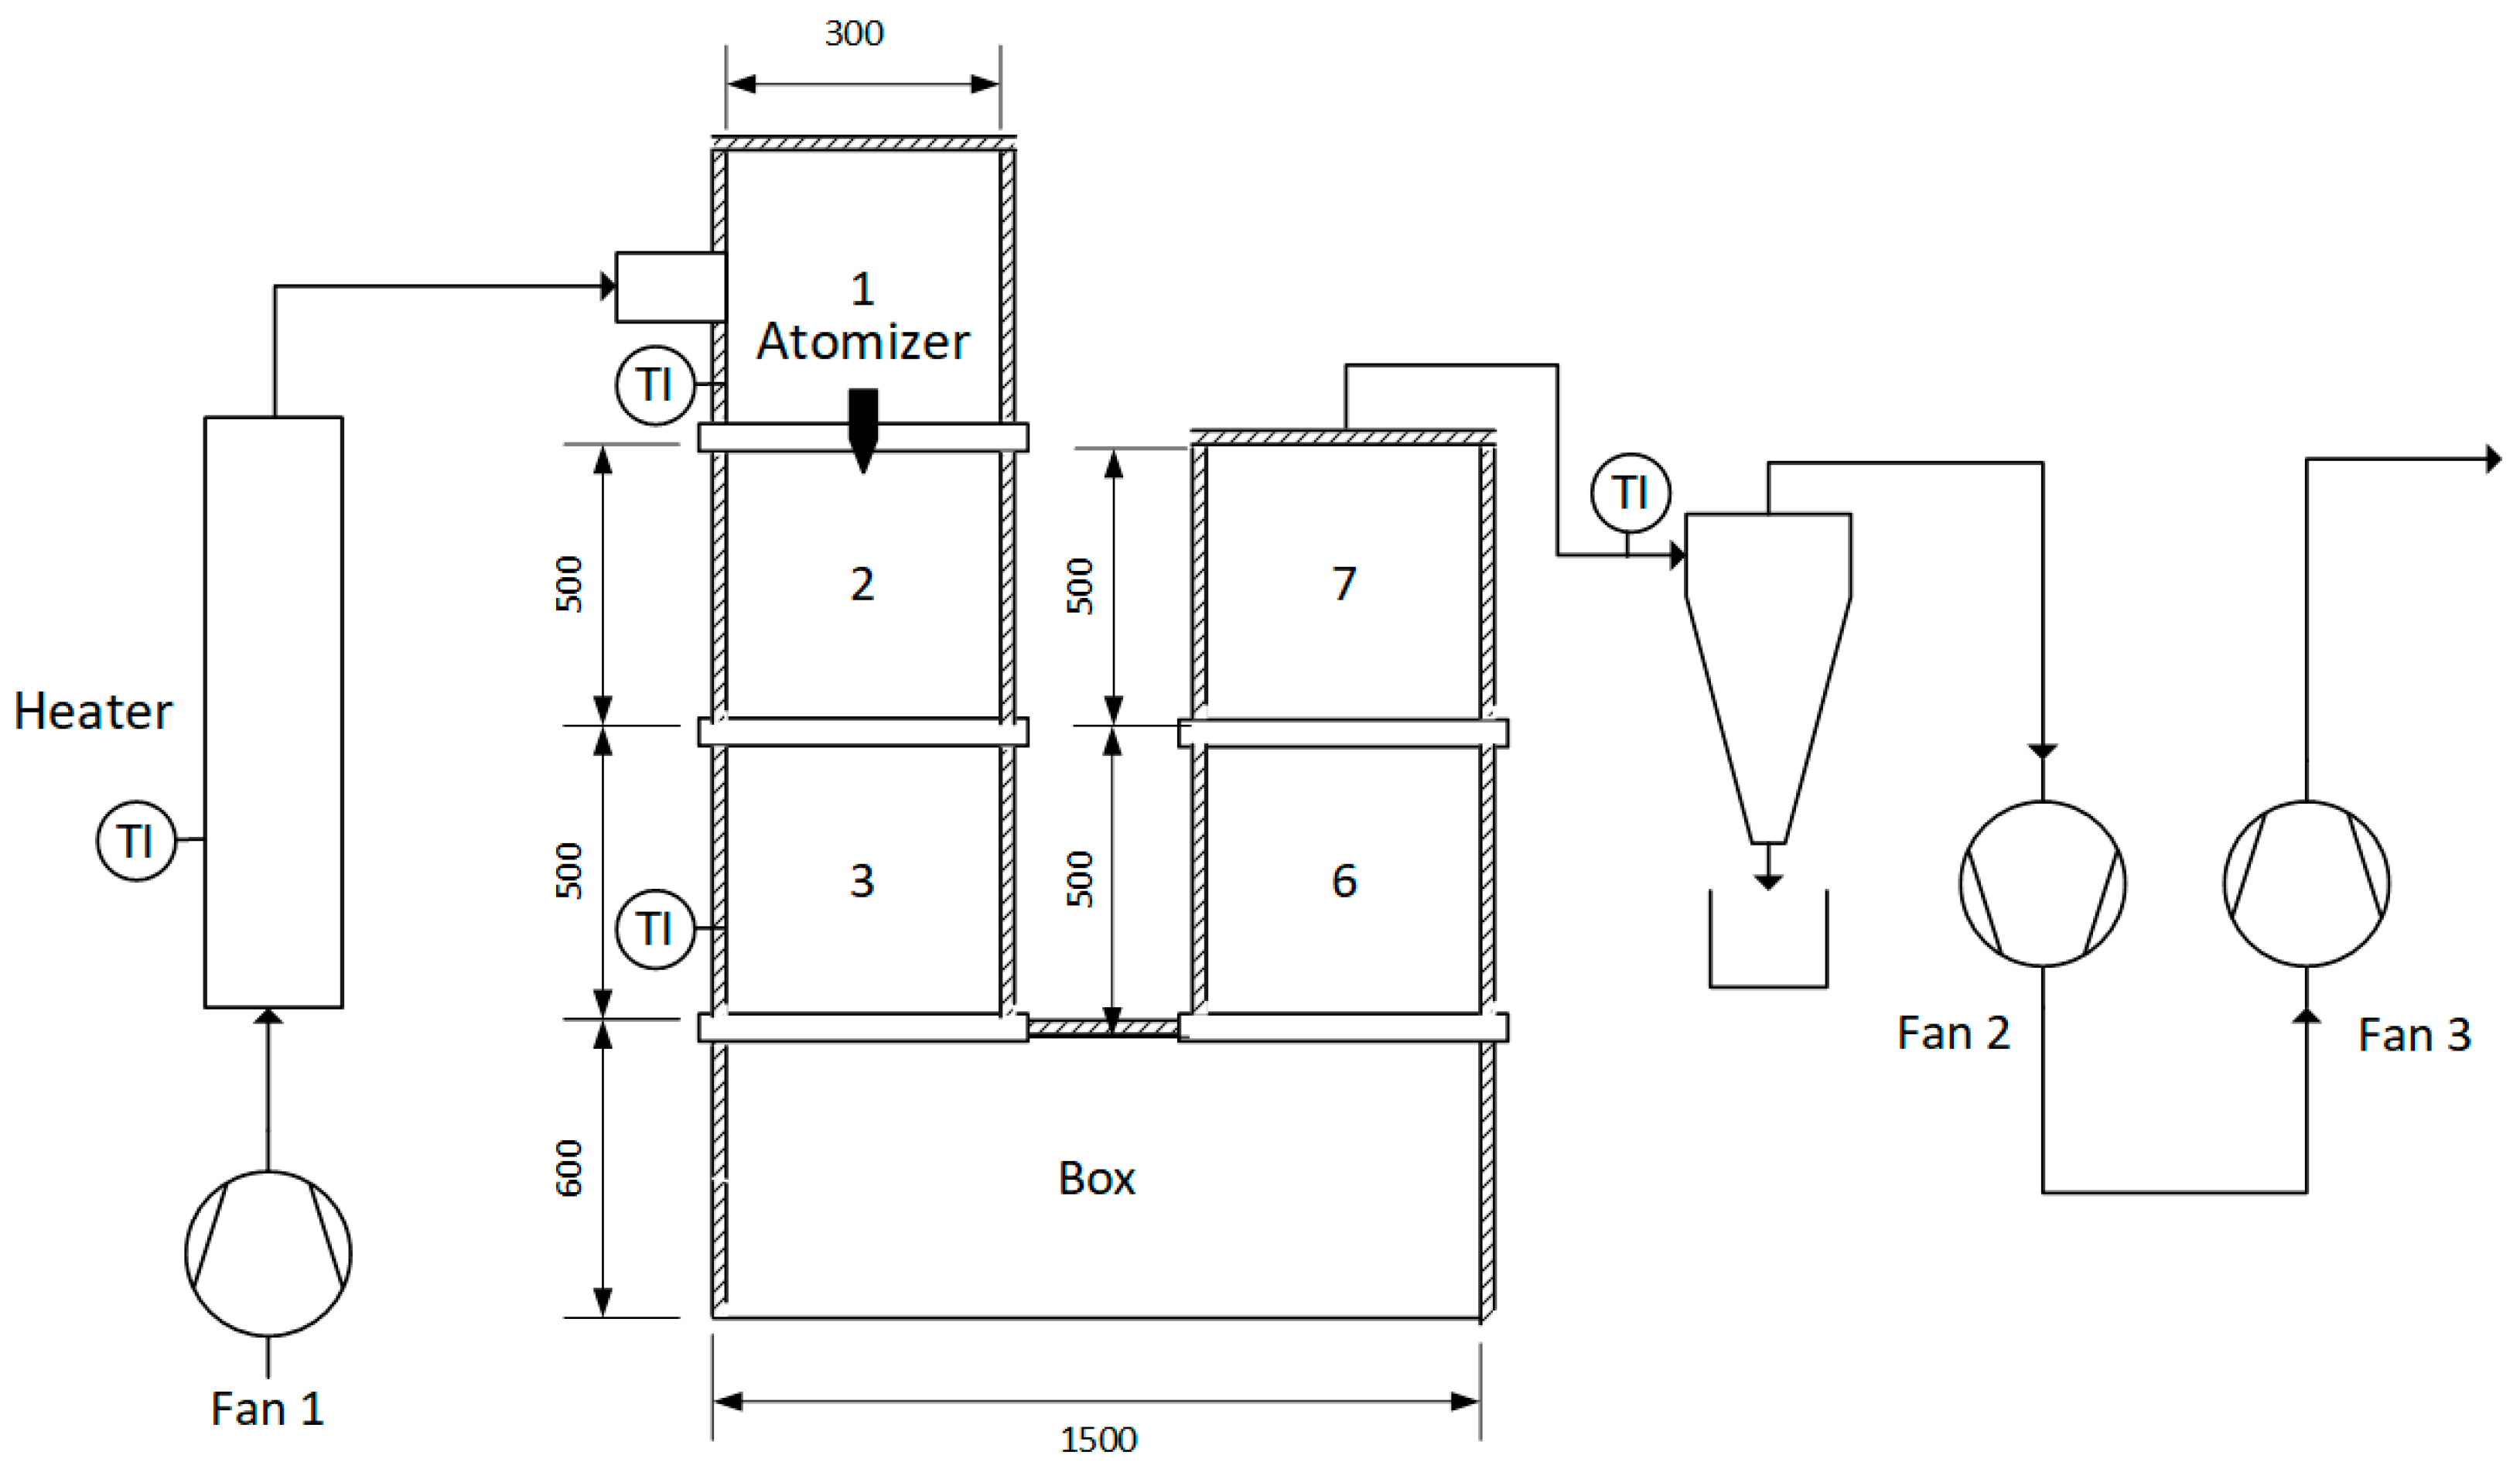
2.3. Designs of the Spray Dryer


2.4. Particle Residence Time Measurement
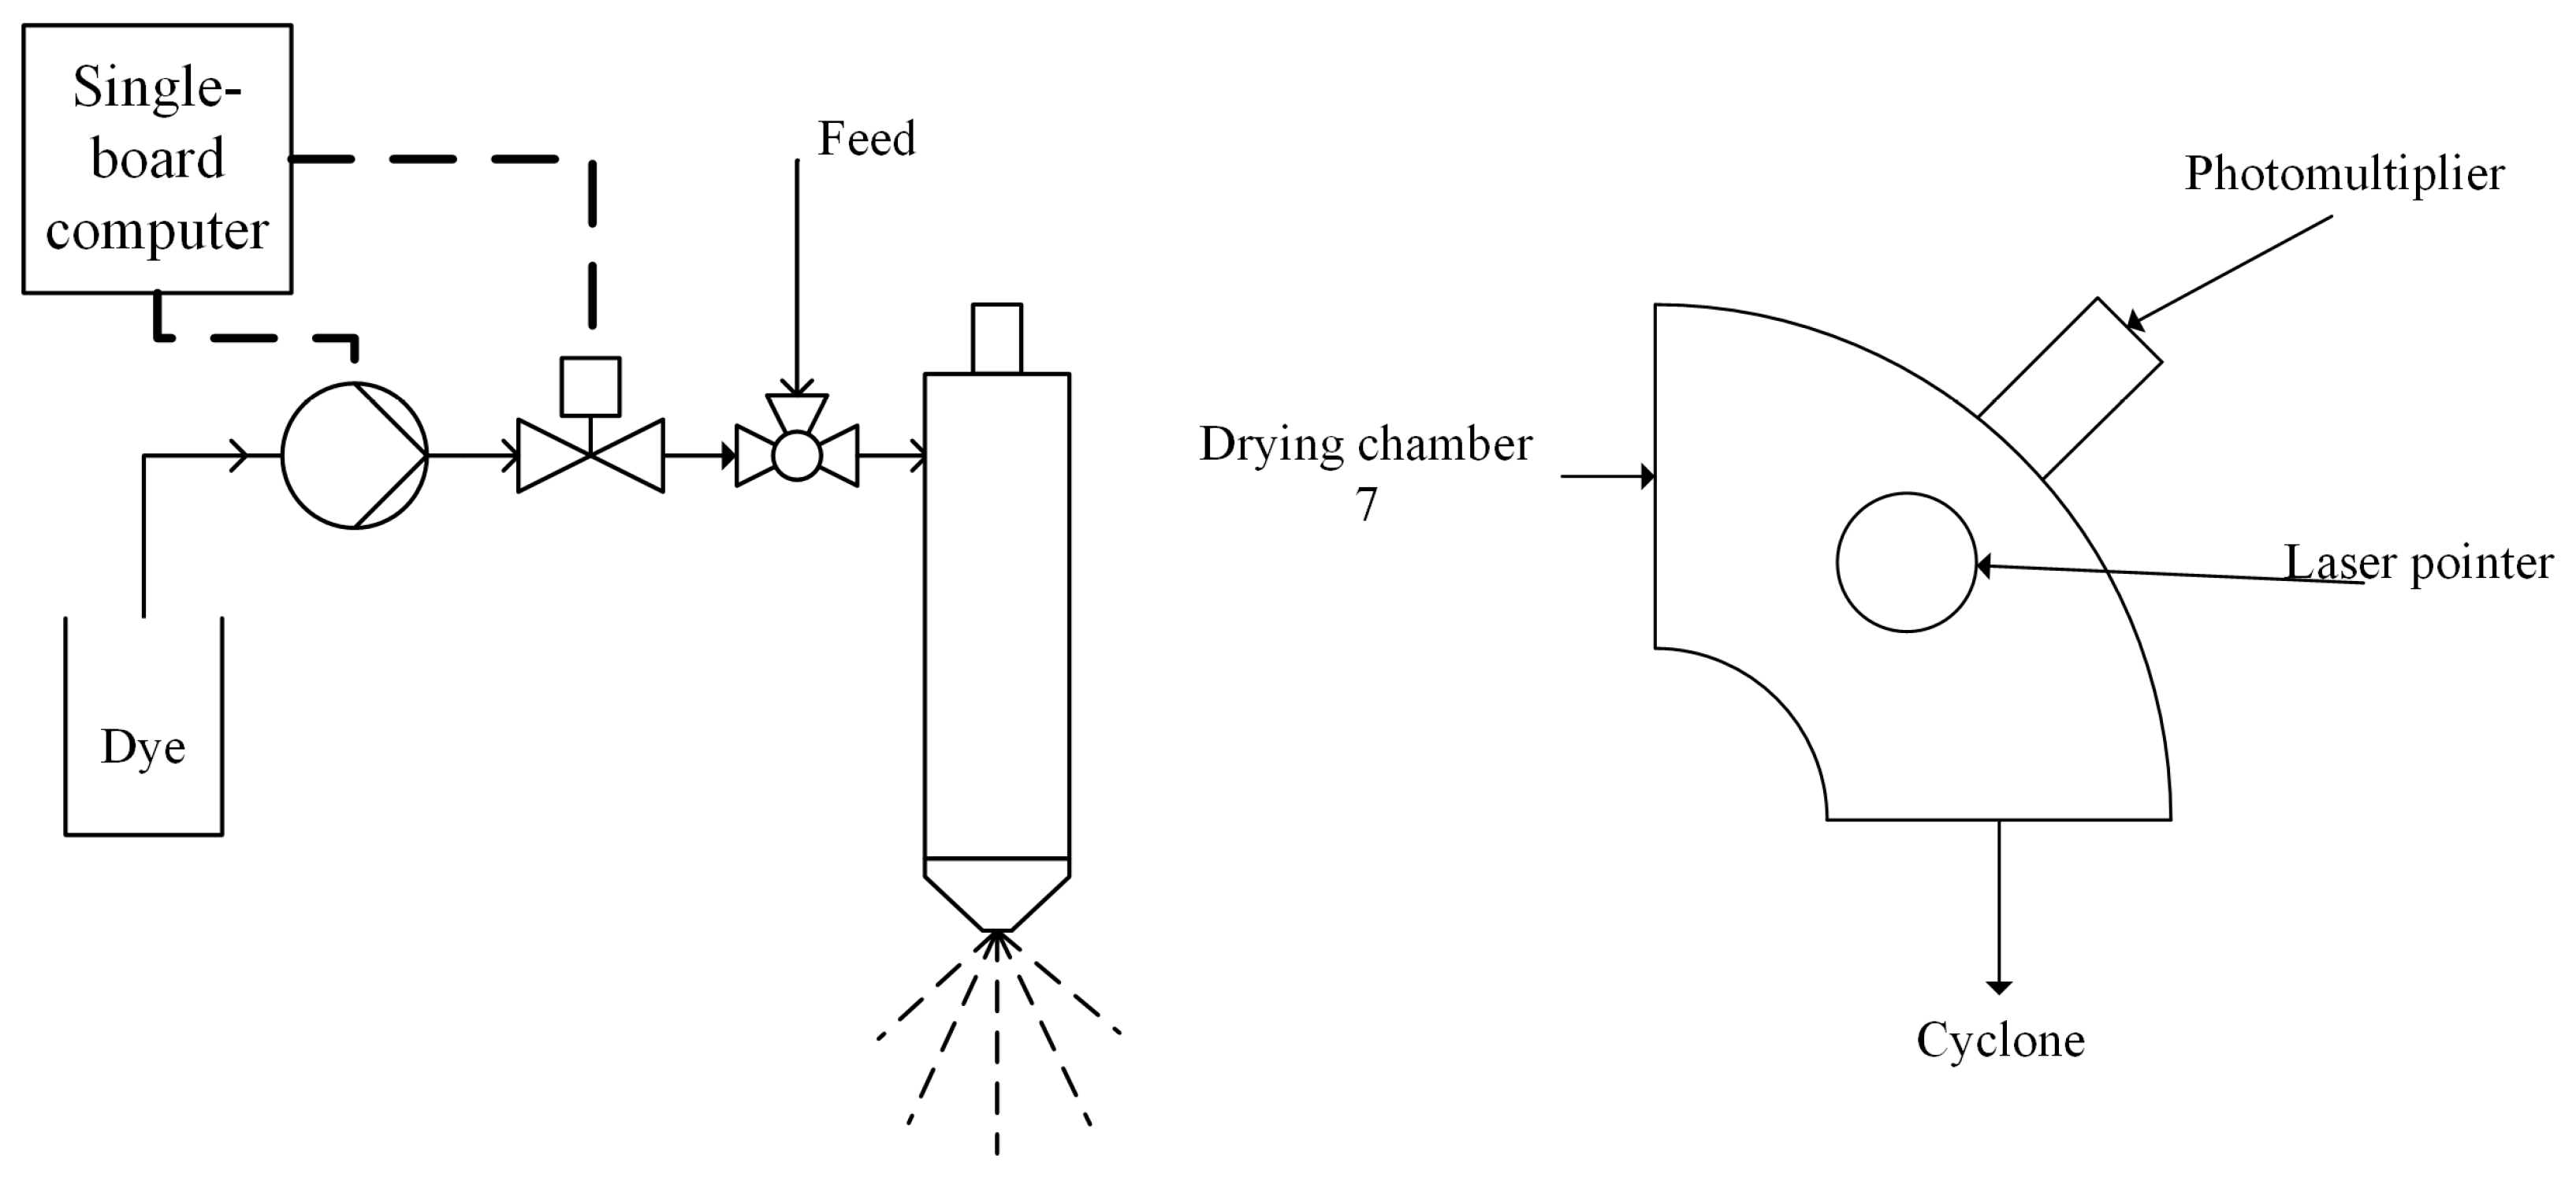
2.4.1. Particle Residence Time Measurement Device
2.4.2. Fitting the Particle Residence Time Distributions
2.4.3. Analysis of the Fluctuations in Signal
2.5. Particle Size Distribution
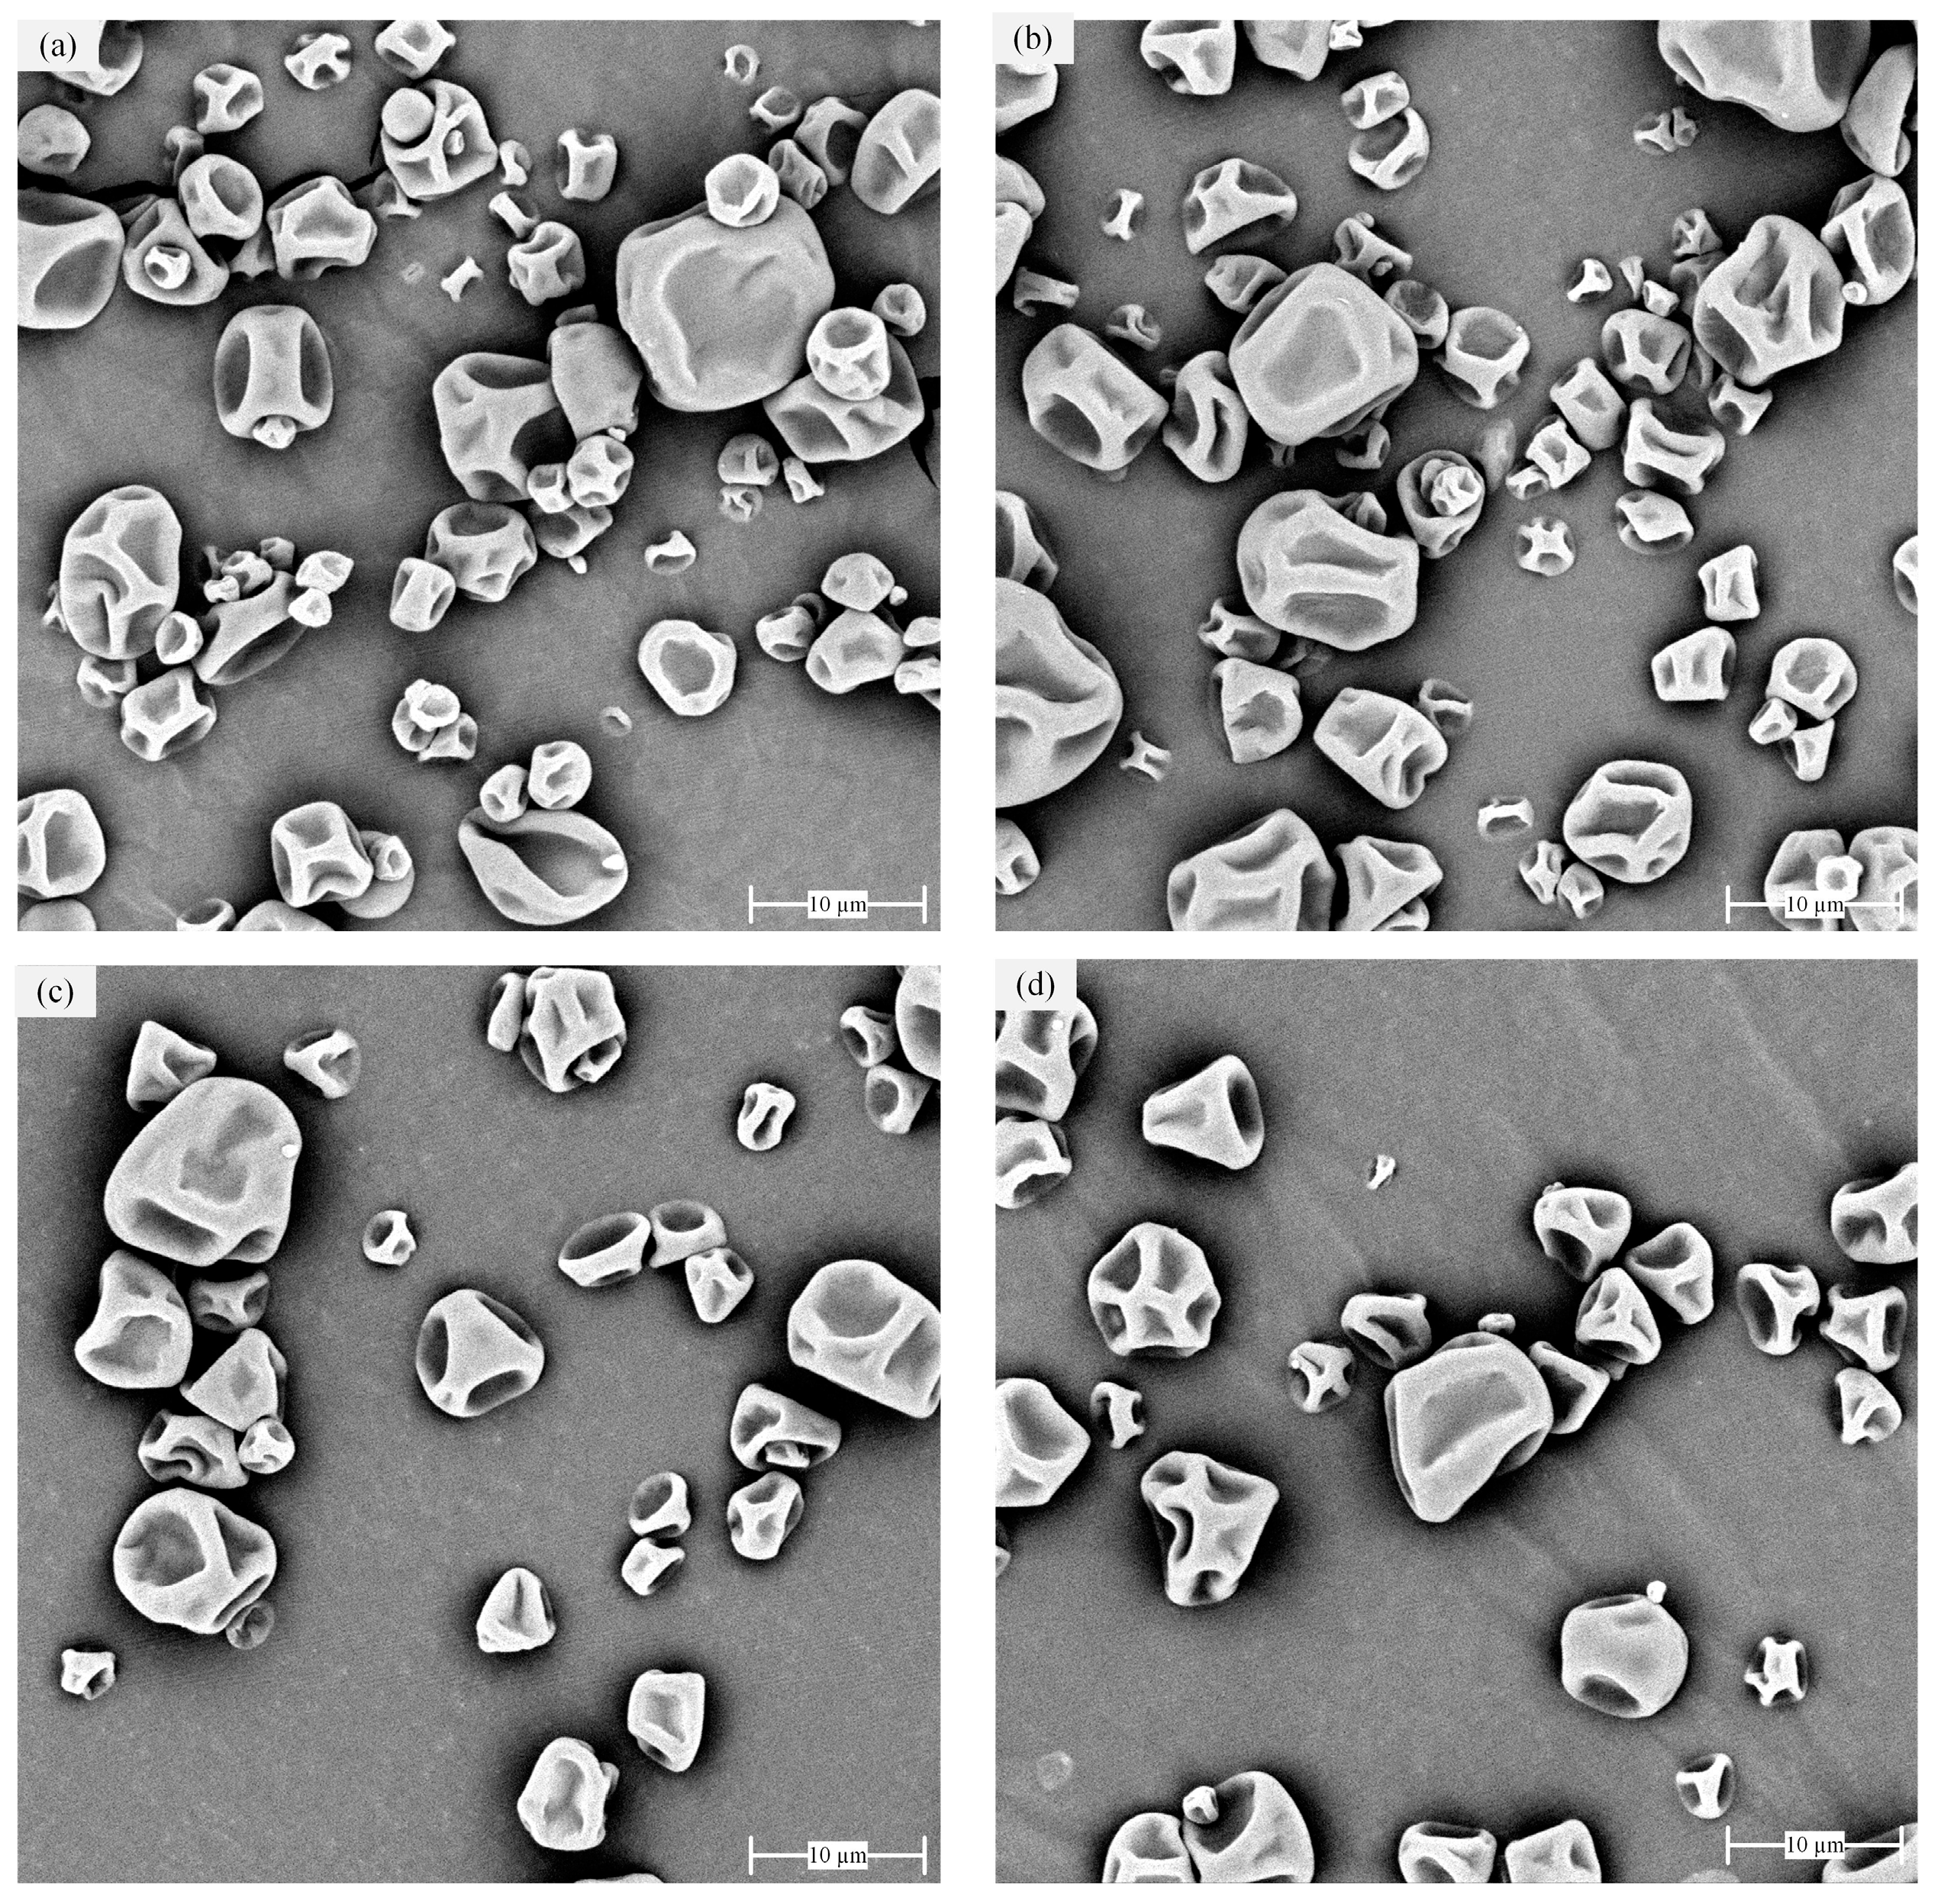
2.6. Scanning Electron Microscopy (SEM)
2.7. Moisture Content Measurement
3. Results and Discussion
3.1. Mean Particle Residence Time—τ
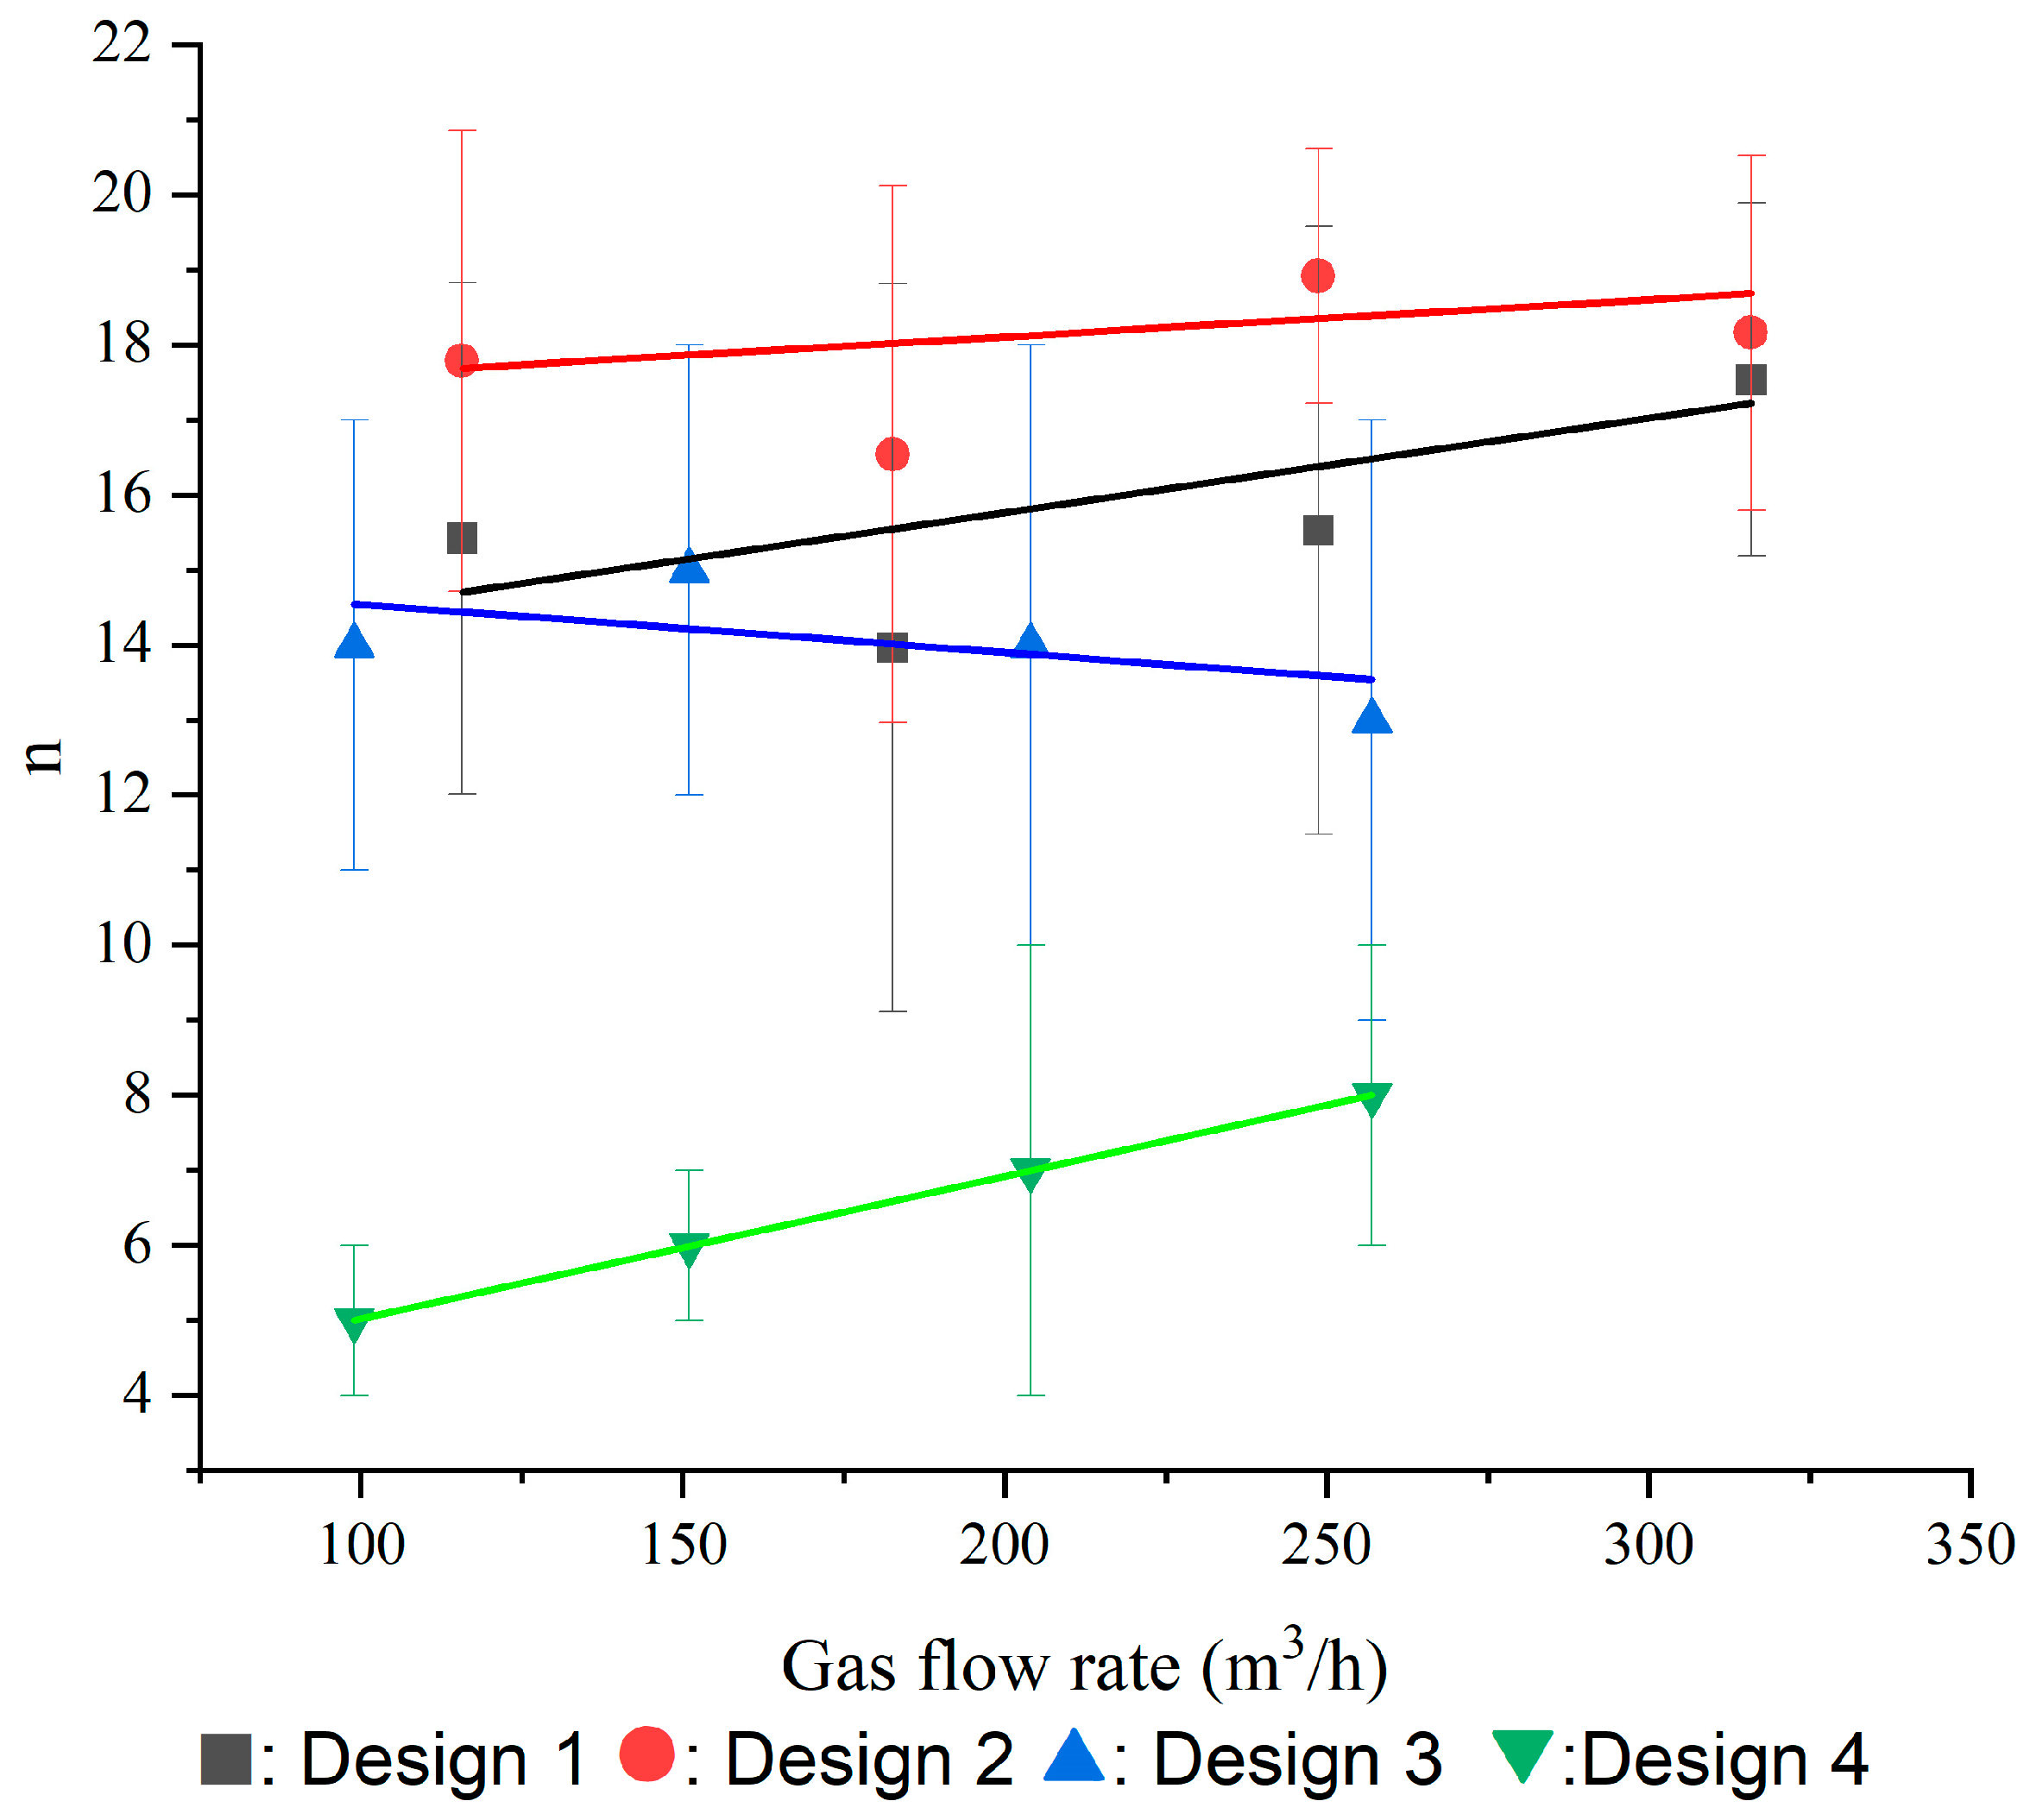
3.2. Spread of Particle Residence Time—n
3.3. Fluctuations in Measured Signals
3.3.1. Flow Related Factors
3.3.2. Wall Deposition and Wall-Deposit Re-Entrainment-Related Factors
3.4. Effects of Feed Properties on Re-Entrainment
3.5. Solid Recovery Rates and Physical Properties of the Spray-Dried Particles
4. Conclusions
Author Contributions
Funding
Institutional Review Board Statement
Informed Consent Statement
Data Availability Statement
Acknowledgments
Conflicts of Interest
References
- Fathi, F.; Ebrahimi, S.N.; Matos, L.C.; Oliveira, M.B.P.P.; Alves, R.C. Emerging Drying Techniques for Food Safety and Quality: A Review. Compr. Rev. Food Sci. Food Saf. 2022, 21, 1125–1160. [Google Scholar] [CrossRef] [PubMed]
- Di Pretoro, A.; Manenti, F. Non-Conventional Unit Operations: Solving Practical Issues, 1st ed.; Springer Briefs in Applied Sciences and Technology; Springer Nature: Cham, Switzerland, 2020; ISBN 9783030345716. [Google Scholar]
- Jeantet, R.; Ducept, F.; Dolivet, A.; Méjean, S.; Schuck, P. Residence Time Distribution: A Tool to Improve Spray-Drying Control. Dairy Sci. Technol. 2008, 88, 31–43. [Google Scholar] [CrossRef] [Green Version]
- Zhou, Z.; Langrish, T. A Review of Maillard Reactions in Spray Dryers. J. Food Eng. 2021, 305, 110615. [Google Scholar] [CrossRef]
- Koca, N.; Erbay, Z.; Kaymak-Ertekin, F. Effects of Spray-Drying Conditions on the Chemical, Physical, and Sensory Properties of Cheese Powder. J. Dairy Sci. 2015, 98, 2934–2943. [Google Scholar] [CrossRef] [Green Version]
- Park, C.W.; Stout, M.A.; Drake, M. The Effect of Spray-Drying Parameters on the Flavor of Nonfat Dry Milk and Milk Protein Concentrate 70. J. Dairy Sci. 2016, 99, 9598–9610. [Google Scholar] [CrossRef] [Green Version]
- Langrish, T.A.G.; Harrington, J.; Huang, X.; Zhong, C. Using CFD Simulations to Guide the Development of a New Spray Dryer Design. Processes 2020, 8, 932. [Google Scholar] [CrossRef]
- Keshani, S.; Daud, W.R.W.; Nourouzi, M.M.; Namvar, F.; Ghasemi, M. Spray Drying: An Overview on Wall Deposition, Process and Modeling. J. Food Eng. 2015, 146, 152–162. [Google Scholar] [CrossRef]
- Francia, V.; Martín, L.; Bayly, A.E.; Simmons, M.J.H. The Role of Wall Deposition and Re-Entrainment in Swirl Spray Dryers. AIChE J. 2015, 61, 1804–1821. [Google Scholar] [CrossRef] [Green Version]
- Ali, M.; Mahmud, T.; Heggs, P.; Ghadiri, M.; Bayly, A.; Crosby, M.; Ahmadian, H.; Martindejuan, L.; Alam, Z. Residence Time Distribution of Glass Ballotini in Isothermal Swirling Flows in a Counter-Current Spray Drying Tower. Powder Technol. 2017, 305, 809–815. [Google Scholar] [CrossRef]
- Masters, K. Scale-up of Spray Dryers. Dry. Technol. 1994, 12, 235–257. [Google Scholar] [CrossRef]
- Kuriakose, R.; Anandharamakrishnan, C. Computational Fluid Dynamics (CFD) Applications in Spray Drying of Food Products. Trends Food Sci. Technol. 2010, 21, 383–398. [Google Scholar] [CrossRef]
- Anandharamakrishnan, C.; Gimbun, J.; Stapley, A.G.F.; Rielly, C.D. A Study of Particle Histories during Spray Drying Using Computational Fluid Dynamic Simulations. Dry. Technol. 2010, 28, 566–576. [Google Scholar] [CrossRef] [Green Version]
- Fletcher, D.F.; Guo, B.; Harvie, D.J.E.; Langrish, T.A.G.; Nijdam, J.J.; Williams, J. What Is Important in the Simulation of Spray Dryer Performance and How Do Current CFD Models Perform? Appl. Math. Model. 2006, 30, 1281–1292. [Google Scholar] [CrossRef] [Green Version]
- Huang, X.; Sormoli, M.E.; Langrish, T.A.G. Review of Some Common Commercial and Noncommercial Lab-Scale Spray Dryers and Preliminary Tests for a Prototype New Spray Dryer. Dry. Technol. 2018, 36, 1900–1912. [Google Scholar] [CrossRef]
- Woo, M.W.; Daud, W.R.W.; Mujumdar, A.S.; Tasirin, S.M.; Talib, M.Z.M. Role of Rheological Characteristics in Amorphous Food Particle-Wall Collisions in Spray Drying. Powder Technol. 2010, 198, 251–257. [Google Scholar] [CrossRef]
- Gianfrancesco, A. Spray Drying Engineering: Particle Stickiness in Relation with Agglomeration; Food and Agriculture Organization: Rome, Italy, 2009. [Google Scholar]
- Schmitz-Schug, I.; Foerst, P.; Kulozik, U. Impact of the Spray Drying Conditions and Residence Time Distribution on Lysine Loss in Spray Dried Infant Formula. Dairy Sci. Technol. 2013, 93, 443–462. [Google Scholar] [CrossRef] [Green Version]
- Kieviet, F.; Kerkhof, P.J.A.M. Measurements of Particle Residence Time Distributions in A Co-Current Spray Dryer. Dry. Technol. 1995, 13, 1241–1248. [Google Scholar] [CrossRef] [Green Version]
- Zbicinski, I.; Strumillo, C.; Delag, A. Drying Kinetics and Particle Residence Time in Spray Drying. Dry. Technol. 2002, 20, 1751–1768. [Google Scholar] [CrossRef]
- Langrish, T.; Huang, X.; Zhong, C. In Proceedings of the 21st International Drying Symposium Proceedings, Valencia, Spain, 11–14 September 2018. [CrossRef]
- Zhou, Z.; Langrish, T. Color Formation and Maillard Reactions during the Spray Drying Process of Skim Milk and Model Systems. J. Food Process Eng. 2021, 45, e13936. [Google Scholar] [CrossRef]
- Ruprecht, N.A.; Kohlus, R. Determination and Modelling of the Particle Size Dependent Residence Time Distribution in a Pilot Plant Spray Dryer. In Proceedings of the 21st International Drying Symposium Proceedings, Valencia, Spain, 11–14 September 2018. [Google Scholar] [CrossRef] [Green Version]
- Ozmen, L.; Langrish, T.A.G. Comparison of Glass Transition Temperature and Sticky Point Temperature for Skim Milk Powder. Dry. Technol. 2002, 20, 1177–1192. [Google Scholar] [CrossRef]
- Langrish, T.A.G. Multi-Scale Mathematical Modelling of Spray Dryers. J. Food Eng. 2009, 93, 218–228. [Google Scholar] [CrossRef]
- Oakley, D.E. Spray Dryer Modeling in Theory and Practice. Dry. Technol. 2004, 22, 1371–1402. [Google Scholar] [CrossRef]
- Huang, L.; Mujumdar, A.S. Development of a New Innovative Conceptual Design for Horizontal Spray Dryer via Mathematical Modeling. Dry. Technol. 2005, 23, 1169–1187. [Google Scholar] [CrossRef]
- Kousaka, Y.; Okuyama, K.; Endo, Y. Re-Entrainment of Small Aggregate Particles from a Plane Surface by Air Stream. J. Chem. Eng. Jpn. 1980, 13, 143–147. [Google Scholar] [CrossRef] [Green Version]
- Shannon, C.E. Communication in the Presence of Noise. Proc. IRE 1949, 37, 10–21. [Google Scholar] [CrossRef]
- Guo, B.; Langrish, T.A.G.; Fletcher, D.F. Numerical Simulation of Unsteady Turbulent Flow in Axisymmetric Sudden Expansions. J. Fluids Eng. 2001, 123, 574–587. [Google Scholar] [CrossRef]
- Katopodes, N.D. Free-Surface Flow: Environmental Fluid Mechanics; Butterworth-Heinemann: Oxford, UK, 2018; ISBN 9780128162514. [Google Scholar]
- Roshko, A. On the Development of Turbulent Wakes from Vortex Streets; No. NACA-TR-1191; Ntrs.Nasa.Gov: Washington, DC, USA, 1954.
- Hanus, M.J.; Langrish, T.A.G. Resuspension of Wall Deposits in Spray Dryers. J. Zhejiang Univ. Sci. A 2007, 8, 1762–1774. [Google Scholar] [CrossRef]
- Kline, S.J.; Reynolds, W.C.; Schraub, F.A.; Runstadler, P.W. The Structure of Turbulent Boundary Layers. J. Fluid Mech. 1967, 30, 741–773. [Google Scholar] [CrossRef]
- Metzger, M.; McKeon, B.; Arce-Larreta, E. Scaling the Characteristic Time of the Bursting Process in the Turbulent Boundary Layer. Phys. D Nonlinear Phenom. 2010, 239, 1296–1304. [Google Scholar] [CrossRef]
- Lu, S.S.; Willmarth, W.W. Measurements of the Structure of the Reynolds Stress in a Turbulent Boundary Layer. J. Fluid Mech. 1973, 60, 481–511. [Google Scholar] [CrossRef]
- Blackwelder, R.F.; Haritonidis, J.H. Scaling of the Bursting Frequency in Turbulent Boundary Layers. J. Fluid Mech. 1983, 132, 87–103. [Google Scholar] [CrossRef]
- Flowers, P.; Langley, R.; Robinson, W.R.; Theopold, K.H. Chemistry 2e; OpenStax: Houston, TX, USA, 2019; ISBN 9781947172623. [Google Scholar]
- Hecht, J.P.; King, C.J. Spray Drying: Influence of Developing Drop Morphology on Drying Rates and Retention of Volatile Substances. 1. Single-Drop Experiments. Ind. Eng. Chem. Res. 2000, 39, 1756–1765. [Google Scholar] [CrossRef]
- Hassan, H.M.; Mumford, C.J. Mechanisms of Drying of Skin-Forming Materials. III. Droplets of Natural Products. Dry. Technol. 1993, 11, 1765–1782. [Google Scholar] [CrossRef]
- Walton, D.E. The Morphology of Spray-Dried Particles a Qualitative View. Dry. Technol. 2000, 18, 1943–1986. [Google Scholar] [CrossRef]
- Nijdam, J.J.; Langrish, T.A.G. The Effect of Surface Composition on the Functional Properties of Milk Powders. J. Food Eng. 2006, 77, 919–925. [Google Scholar] [CrossRef]


| Four/Six-Inch Cylindrical Connection | Box Connection | Conical Drying Chamber | |
|---|---|---|---|
| Drying column 1 | 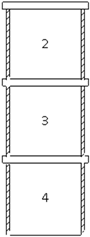 | 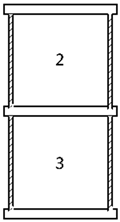 | 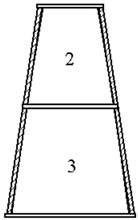 |
| Drying column 2 | 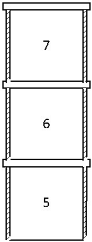 | 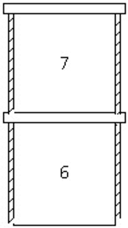 | |
| Type of connection between drying columns |  | 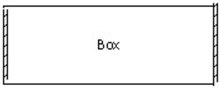 | |
| Internal volume (m3) | 0.228/0.230 | 0.262 | 0.765 |
| τ (s) | n | Injection Volume (mL) | |
|---|---|---|---|
| Manual injection | 11.9 | 15 | 1 |
| 11.4 | 10 | 1.5 | |
| 11.5 | 15 | 2 | |
| Auto injection | 9.3 ± 1 | 13 ± 4 | 2 |
| Gas Flow Rate (m3/h) | Re | f (Hz) |
|---|---|---|
| 315 | 16,104 | 0.76 |
| 257 | 13,139 | 0.58 |
| 249 | 12,730 | 0.50 |
| 204 | 10,429 | 0.38 |
| 183 | 9356 | 0.29 |
| 152 | 7771 | 0.23 |
| 116 | 5930 | 0.13 |
| 99 | 5061 | 0.11 |
| Gas Flow Rate | Measurements | Design 3 | Design 4 |
|---|---|---|---|
| Mean particle residence time (τ, s) | 8.3 | 8.3 | |
| Mean gas time (s) | 3.7 | 3.7 | |
| 257 m3/h | Ratio between particle and air residence time (s/s) | 2.2 | 2.2 |
| Number of equivalent CSTR in series (n) | 15 | 15 | |
| Fluctuation frequency (Hz) | 0.206 | 0.206 | |
| Remin | 15,945 | 15,945 |
| Gas Flow Rate | Measurements | Four-Inch Cylindrical Connection | Six-Inch Cylindrical Connection | Box Connection | Conical Drying Chamber |
|---|---|---|---|---|---|
| 257–315 m3/h | Moisture content | 3% | 2% | 3% | 3% |
| Solids recovery rate | 43% | 51% | 48% | 51% | |
| D × 10 (µm) | 4.2 | 4.7 | 5.2 | 4.9 | |
| D × 50 (µm) | 8.4 | 8.9 | 11.8 | 10.0 | |
| D × 90 (µm) | 16.2 | 13.2 | 19.8 | 25.2 | |
| 204–250 m3/h | Moisture content | 3% | 2% | 4% | 3% |
| Solids recovery rate | 33% | 37% | 41% | 41% | |
| D × 10 (µm) | 3.9 | 4.2 | 5.2 | 5.0 | |
| D × 50 (µm) | 7.0 | 7.3 | 11.5 | 9.6 | |
| D × 90 (µm) | 13.2 | 12.0 | 19.2 | 17.9 | |
| 152–180 m3/h | Moisture content | 3% | 3% | 5% | 4% |
| Solids recovery rate | 14% | 13% | 17% | 23% | |
| D × 10 (µm) | 3.7 | 4.0 | 4.7 | 5.0 | |
| D × 50 (µm) | 6.6 | 6.4 | 9.1 | 9.2 | |
| D × 90 (µm) | 8.9 | 13.2 | 17.2 | 17.0 | |
| 99–116 m3/h | Moisture content | 6% | 4% | 7% | 7% |
| Solids recovery rate | 7% | 11% | 8% | 6% | |
| D × 10 (µm) | 4.4 | 3.8 | 4.8 | 5.1 | |
| D × 50 (µm) | 6.3 | 6.2 | 8.3 | 8.0 | |
| D × 90 (µm) | 10.3 | 8.9 | 14.5 | 12.5 |
Disclaimer/Publisher’s Note: The statements, opinions and data contained in all publications are solely those of the individual author(s) and contributor(s) and not of MDPI and/or the editor(s). MDPI and/or the editor(s) disclaim responsibility for any injury to people or property resulting from any ideas, methods, instructions or products referred to in the content. |
© 2022 by the authors. Licensee MDPI, Basel, Switzerland. This article is an open access article distributed under the terms and conditions of the Creative Commons Attribution (CC BY) license (https://creativecommons.org/licenses/by/4.0/).
Share and Cite
Zhou, Z.; Langrish, T.A.G.; Cai, S. Using Particle Residence Time Distributions as an Experimental Approach for Evaluating the Performance of Different Designs for a Pilot-Scale Spray Dryer. Processes 2023, 11, 40. https://doi.org/10.3390/pr11010040
Zhou Z, Langrish TAG, Cai S. Using Particle Residence Time Distributions as an Experimental Approach for Evaluating the Performance of Different Designs for a Pilot-Scale Spray Dryer. Processes. 2023; 11(1):40. https://doi.org/10.3390/pr11010040
Chicago/Turabian StyleZhou, Zelin, Timothy A. G. Langrish, and Sining Cai. 2023. "Using Particle Residence Time Distributions as an Experimental Approach for Evaluating the Performance of Different Designs for a Pilot-Scale Spray Dryer" Processes 11, no. 1: 40. https://doi.org/10.3390/pr11010040