
Agglomeration of Spray-Dried Milk Powder in a Spray Fluidized Bed: A Morphological Modeling

1
Thermal Process Engineering, Otto von Guericke University Magdeburg, Universitätsplatz 2, 39106 Magdeburg, Germany
2
Institute of Particle Technology (LFG), Friedrich-Alexander University Erlangen-Nuremberg, Cauerstraβe 4, 91058 Erlangen, Germany
*
Authors to whom correspondence should be addressed.
Processes 2022, 10(12), 2718; https://doi.org/10.3390/pr10122718
Submission received: 14 November 2022
/
Revised: 5 December 2022
/
Accepted: 12 December 2022
/
Published: 16 December 2022
(This article belongs to the Special Issue Advances in Drying Technologies—Selected Papers from the 22nd International Drying Symposium (IDS 2022))
Abstract
:The type of solid substrate plays a critical role in determining the kinetics of the spray fluidized bed (SFB) agglomeration process. In the case of porous (also soft) primary particles (PPs), droplet aging is due to imbibition and drying. The surface properties of the substrate also change due to imbibition. The focus of the present work is to simulate the agglomeration of the spray-dried milk powder using the Monte Carlo (MC) method coupled with a drying-imbibition model. In order to extract the morphology of the formed agglomerates, an aggregation model is employed. Further, this aggregation model is employed to predict the number of positions on the PPs (later agglomerates) for droplet deposition; previously, the ‘concept of positions’ was used. The transient growth of different milk powders (whole and skim) is depicted using the enhanced MC model. The enhancement in the droplet deposition model had a prominent influence on the overall kinetics of agglomeration. As expected, this enhanced MC model predicted that the agglomeration rate of skim milk powder is higher than that of whole milk powder.
1. Introduction
Agglomeration in a spray fluidized bed (SFB) is a widely used size enlargement process in various industries, such as food, pharmaceuticals, and chemicals. In this process, solid substrates, i.e., primary particles (PPs), are fluidized with the help of inlet air, which is also used as a drying agent. Water is sprayed from a nozzle onto the surface of the substrates. The substrates adhere to each other as they collide in wet areas. Drying leads to the formation of agglomerates [1].
The type of solid substrate is critical in determining the kinetics of the agglomeration process. In general, droplet aging in the SFB agglomeration of non-porous hard PPs is solely due to the convective drying of the deposited droplets [1,2,3,4,5]. In the case of porous hard PPs, the aging process of the deposited liquid layer is additionally caused by penetration (imbibition) into the pores of the substrate. Furthermore, in the case of the soft (also porous) PPs, such as milk powder or maltodextrin, the substrate’s surface properties also change due to imbibition [6,7,8,9].
The present work aims to simulate the agglomeration of the spray-dried milk powder. These powders are widely produced using a spray dryer; a solution or suspension is atomized, creating small droplets that are dried to form a powder [10,11,12]. Spray-dried milk powder is porous and amorphous (soft) in nature.
Modeling of agglomeration is commonly performed using the Euler/Lagrangian approach in the computational fluid dynamics (CFD) framework [13,14,15]. Due to the several micro-mechanisms involved in the agglomeration process, modeling using CFD is computationally expensive. The stochastic approach is preferred for the SFB agglomeration process [1,2,3,4,5,16,17,18].
A stochastic model, based on the Monte Carlo (MC) method, was first developed by [19] to describe agglomerate growth during SFB agglomeration. The effects of varying the operating parameters on the agglomeration kinetics were analyzed and compared with the experimental results. The operating parameters investigated were binder initial viscosity, binder addition rate, binder initial mass fraction, and inlet gas temperature [20]. This model was further enhanced by Singh and Tsotsas [21] to predict the morphology of the formed agglomerates at various process parameters. Most of the simulations were performed for the agglomeration of non-porous (hard) agglomerates generated in the fluidized bed by spraying a binder.
However, a stochastic model was developed by [7] based on the MC method for binderless (spraying only water) agglomeration of amorphous (soft) primary particles (PPs). The model precisely described the influence of process parameters, such as inlet gas temperature and spray rate, on the agglomeration behavior of amorphous particles in a fluidized bed. Along with the influence of process parameters, soft agglomeration with different configurations of the granulator (i.e., spouted bed, Wurster coater, top spray) was also experimentally investigated by [22]. Agglomerates are inherently polymorphic, and in most studies, the morphology of agglomerates is assumed to remain the same regardless of the changes in operating parameters.
In this study, the Monte Carlo (MC) simulation scheme of Singh and Tsotsas [1] is adapted and coupled with a drying-imbibition model. The morphology is essential for characterizing the product formed. In order to extract the morphology of the formed agglomerates, an aggregation model from [23] is employed. Further, two types of milk powders were investigated, namely, whole milk powder (WMP) and skim milk powder (SMP). The transient growth of soft, porous particles is depicted using the enhanced MC model.
2. Materials and Methods
The agglomeration of soft, porous PPs consists of various micro-scale mechanisms. The Monte Carlo model from Singh and Tsotsas [1], incorporated with most of the relevant micro-scale mechanisms, is adapted in the present work. These micro-scale mechanisms with the MC algorithm are self-programed in MATLAB. The MC model is an event-driven method where collisions between fluidized particles are the main event. It connects the MC representation (simulation cell) and the real particulate system.
The simulation cell represents a sample of the particle population. Initially, the number of particles in the simulation cell is 1000, and it changes depending on the micro-scale mechanisms, such as agglomeration or breakage, that prevail during the simulation. However, breakage of already formed agglomerates is not considered in the present work, to first concentrate on the influence of the different milk powders (SMP and WMP) on growth. The agglomerates produced from the milk powders without a binder by glass transition are expected to be stable, but this assumption will have to be checked experimentally in future work. In the case of agglomeration without breakage, the particle population doubles at regular intervals when the number of particles in the simulation cell is halved. This type of particle regulation MC method is termed a constant volume MC (CVMC) model. The simulation scheme of the CVMC model is shown in Figure 1.
The collisions between PPs and droplet deposition are activated immediately with the start of the simulation. The water droplets deposit randomly on the fluidized particles (first the PPs, then the agglomerates). The deposited droplets penetrate into the pores of the substrates and are absorbed there. The glass transition temperature of the particles changes, and the surface becomes sticky and highly viscous. After a successful collision on those spots of the PPs, an agglomerate is formed. Due to the drying of wet areas, the glass transition is reversed. The morphology of the agglomerates is analyzed using an aggregation model.
2.1. Droplet Drying-Imbibition Model
The type of solid substrate is critical in determining the kinetics of the SFB agglomeration process. In general, droplet aging in the SFB agglomeration of non-porous hard PPs is solely due to the convective drying of the deposited droplets [1,2,3,4,5]. In the case of porous hard PPs, the aging process of the deposited liquid layer is additionally caused by penetration (imbibition) into the pores of the substrate [24,25]. Furthermore, in the case of soft (also porous) PPs, such as milk powder or maltodextrin, the substrate’s surface properties also change due to imbibition [7,26].
In the case of a soft (amorphous) solid substrate, although the droplet height decreases due to drying and imbibition, imbibition also changes the structure of the solid substrate. As can be seen in Figure 2, a “puddle” forms due to the wetting and dissolution of the amorphous solid substrate in water [7]. It is assumed that each droplet deposited on the particle surface penetrates immediately and entirely into the particle, forming a kind of cylindrical puddle with a depth (or height (m)) of:
here, is the volume of a droplet (m3); is the porosity of the substrate (-); is the base area of the droplet cap (m2). When a droplet, with its size relatively small as compared to the particle size, is deposited on the surface of the PP, the particle curvature is neglected. The droplet captured on the surface of a particle will take the shape of a spherical cap with the following area:
here, is the contact angle between the droplet and the PP surface.
It is also assumed that the water is uniformly distributed in the puddle space, with the area of the puddle equal to the droplet cap area and the height remaining unchanged. For hard, porous, and non-porous solid substrates, the kinetics is modeled by the decrease in droplet height [1,3,20,21,23]. For amorphous solids, the kinetics are controlled by the amount of water evaporated from the puddle [7]. The mass fraction of water in the puddle is defined by:
where and are the masses of the solid material (without pores) and water (kg), respectively. The mass of the solid material in the puddle remains constant, but the amount of water changes due to drying,
here, is the initial mass of water (kg) in the puddle (equal to the mass of water in the droplet); is the moisture content of the fluidizing gas at adiabatic saturation (kg/kg); is the moisture content of the fluidizing gas (kg/kg); is the mass transfer coefficient (m/s); t is the time (s).
2.2. Aggregation Model
The aggregation model is vital for analyzing the morphology of the agglomerates by reconstructing them. In order to reconstruct the agglomerates, a morphological model is required. Various morphological models have been used in the past to replicate the structure of real agglomerates. The morphological models are based on assumptions about the agglomerate formation mechanism, simulation lattice, particle trajectories, and tunable properties. The tunable properties are of interest in the present work. The selection of other parameters in order to mimic real agglomerates is explained in detail in [21,23]. The sticking probability and fractal properties, i.e., fractal dimension () and prefactor (), are the two tunable properties. The limitation of the sticking probability model in preserving the morphological descriptors favors the use of a fractal tunable model [2,10,18].
The first fractal-tunable algorithm that takes both fractal properties into account was presented by [27]. However, the radius of gyration definition was incorrectly implemented in the algorithm, and the model also cannot be applied to restructure the aggregates when combining large with low . This limitation was overcome by [21], but the radius of gyration error persisted. Then, Singh and Tsotsas [23] implemented the correct definition of the radius of gyration and extended the model to generate the aggregates with polydisperse spherical PPs.
In the present work, agglomerates are reconstructed with the help of the aggregation model proposed by Singh and Tsotsas [2]. It is an off-lattice particle-cluster modified poly-disperse tunable aggregation (MPTSA) model. The input parameters are number, mean, and standard deviation for the normal distribution of radii of PPs and fractal properties, i.e., fractal dimension () and prefactor (). The algorithm is explained in Appendix A. Further, monodisperse PPs are considered in replicating the milk agglomerates.
2.3. Droplet Deposition Model
The droplets are deposited on the surface of the particles (initially the PPs and later the agglomerates). The surface of the particles is divided into positions at which the droplets will be deposited. The number of positions on the particles is calculated using the surface area of the particle () and the cap area () of the droplet as
In the case of the PPs, where is the mean diameter of the PPs. However, evaluating the surface area of the agglomerates is difficult. Previous studies [1,3,4,5,7,21] use a simplified approach, the ‘concept of positions’ (CoP) to predict the number of positions. In this concept, the positions of PPs are equally grouped into sectors, as shown in Figure 3. A sector of a particle is the part of the surface of the particle facing toward and covered by an adjoining particle. With the notion of six neighbors in a simple cubic packing, each particle is assumed to have six sectors. If one position has been wetted and resulted in successful agglomeration, all remaining positions of the respective sector are inactivated because they can no longer be reached by droplets or other particles. With this simplified version of the CoP though, all the agglomerates formed are treated in the same way, and the morphology of the agglomerates is not captured.
In the present work, this simplified approach is replaced with the help of the aggregation model. The surface of each agglomerate is used in Equation (5) to calculate the number of positions of an agglomerate. The surface area of the agglomerate is obtained with the convex hull (CH) method by constructing the agglomerates using the MPTSA model.
2.4. Coalescence Model
Several criteria are used to determine the outcome of pairwise collisions of particles: coalescence or rebound. The first is the presence of at least one wet position. The second is the difference between the solid particle temperature and the glass transition temperature at the wet position, which should be greater than 20 K. The glass transition temperature at the wet position is determined by the Gordon Taylor equation:
here, and are the glass transition temperatures of dry solid (°C) and water (°C), respectively; is the mass fraction of water (-); and is the Gordon Taylor constant (-). The third and final criterion is the Stokes criterion, which is based on previous work [1,3,4,5,21]. According to the Stokes criterion, the Stokes number,
should be smaller than the critical Stokes number [28],
here, and are the combined diameter and mass, respectively, of two colliding particles of unequal size,
Traditionally, the diameter of agglomerates is calculated by assuming a volume-equivalent sphere with the measured or assumed porosity. However, this approach of calculating the diameter of agglomerates by porosity is outweighed by considering the fractal properties of agglomerates [1]. This can be achieved either by using the correlation developed in [1] or by constructing the agglomerate using fractal properties [21,23]. The diameter of agglomerates (with index i) is calculated here using its surface area equivalent sphere,
where is the surface area obtained with the convex hull (CH) method by constructing the agglomerate (with index i) using the aggregation model.
The coalescence of the colliding binary particles occurs when all three conditions are satisfied. In this study, two different spray-dried PPs, WMP and SMP, are used to investigate the influence of the materials. The Gordon-Taylor constants and glass transition temperatures are taken from [29] and listed in Table 1.
3. Results and Discussion
3.1. Droplet Deposition Model
In order to see the influence of morphology on the droplet deposition model, the number of positions on different agglomerates is calculated using the ‘concept of positions’ and the new approach as per Equation (5). For this purpose, exemplary aggregates with the same , corresponding coarsely to the size of real agglomerates from experiments) are generated using the MPTSA model at different and . The fractal dimension is varied from 2 to 3 with an increment of 0.2. The PPs are monodispersed with a diameter of . The calculated number of positions from both approaches for different agglomerates is shown in Table 2.
It can be seen from Table 2 that the number of positions from the CoP approach is always constant, irrespective of the changes in the morphology of the aggregates at different fractal dimensions. As expected and also evident from the aggregates in Table 2, the compactness of the aggregates increases with an increase in fractal dimension. This in turn leads to a decrease in the surface area of the aggregate and, finally, a decrease in the number of positions in the new approach.
3.2. Fractal Properties of Milk Powder Agglomerates
Experimentally formed agglomerates using skim or whole milk powder show a small but significant difference, as shown in Figure 4 (dots) [30]. The diameter of monodisperse agglomerates (with ) was calculated using Equation (11) by generating the aggregates by means of the MPTSA model at different pairs of fractal dimension and prefactors. The porosity calculated using the radius of gyration methods for agglomerates generated at different fractal values is shown in Figure 4 (lines). It shows that the WMP agglomerates have a fractal dimension of 2.50 and a prefactor of 1.25, while the SMP agglomerates have a fractal dimension of 2.50 and a prefactor of 1.00. The 2D fractal dimensions of milk agglomerates have been extracted by analyzing the 2D images [31]. When converting these 2D fractal dimensions into 3D using the correlation of [32], the resulting fractal dimensions are in agreement with the evaluated fractal dimensions from Figure 4.
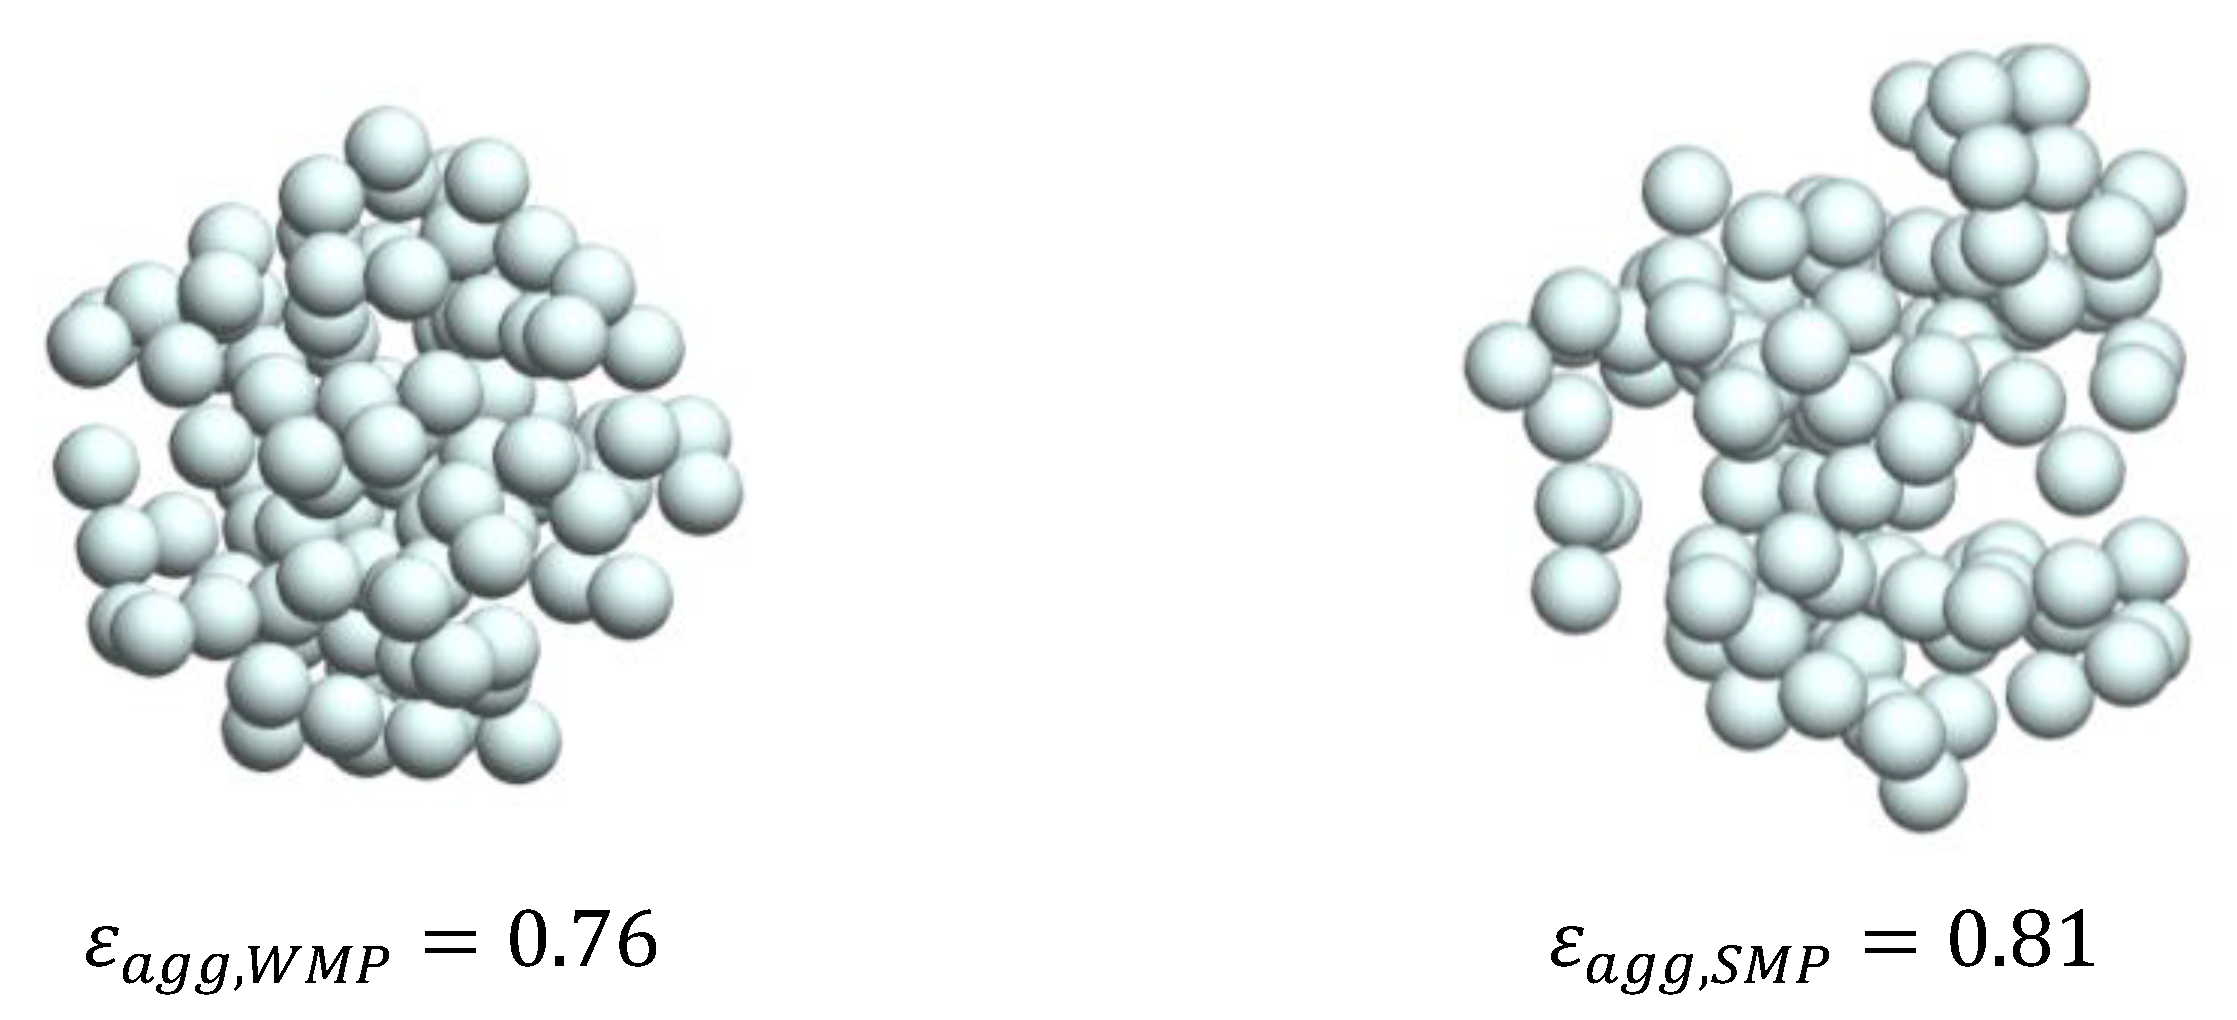
One WMP agglomerate and one SMP agglomerate with 100 PPs (), generated at their respective fractal properties by means of the MPTSA model [23], are exemplarily shown in Figure 5. It was concluded in [30] that the porosity of the WMP agglomerates is lower by 0.05–0.15 than the porosity of the SMP agglomerates. A similar conclusion was drawn regarding the porosity (calculated using the radius of gyration method) of the agglomerated whole and skim milk powders generated using the MPTSA model. The porosity of the WMP agglomerate is lower than that of the SMP agglomerate, as shown in Figure 5.
3.3. MC Model
The simulations were performed with soft, porous PPs using the present extended MC model and the model from [7] (denoted as Rieck MC model) for 10 min. However, breakage of already-formed agglomerates is not considered in either model. In the present MC model, the agglomerates formed are reconstructed using the MPTSA model with a radius of the monodispersed PPs, 100 µm. In the Rieck MC model [7], agglomerates are considered to have the same morphology with porosity equal to 0.5. Moreover, for droplet deposition, CoP is considered in the Rieck MC model, whereas a new approach of considering the morphology is used in the present MC model. Our own experiments were conducted to analyze the effects of the different milk powders on agglomeration. A brief description of the experimental setup is given in Appendix B. The simulation parameters and corresponding experimental parameters are given in Table 3. The temperature of the spray fluidized bed is controlled by the inlet fluidizing gas, which is also used as a drying agent, and is at 50 °C. This prevents the denaturation of the milk protein, which normally occurs in the temperature range of 70 to 100 °C [33].
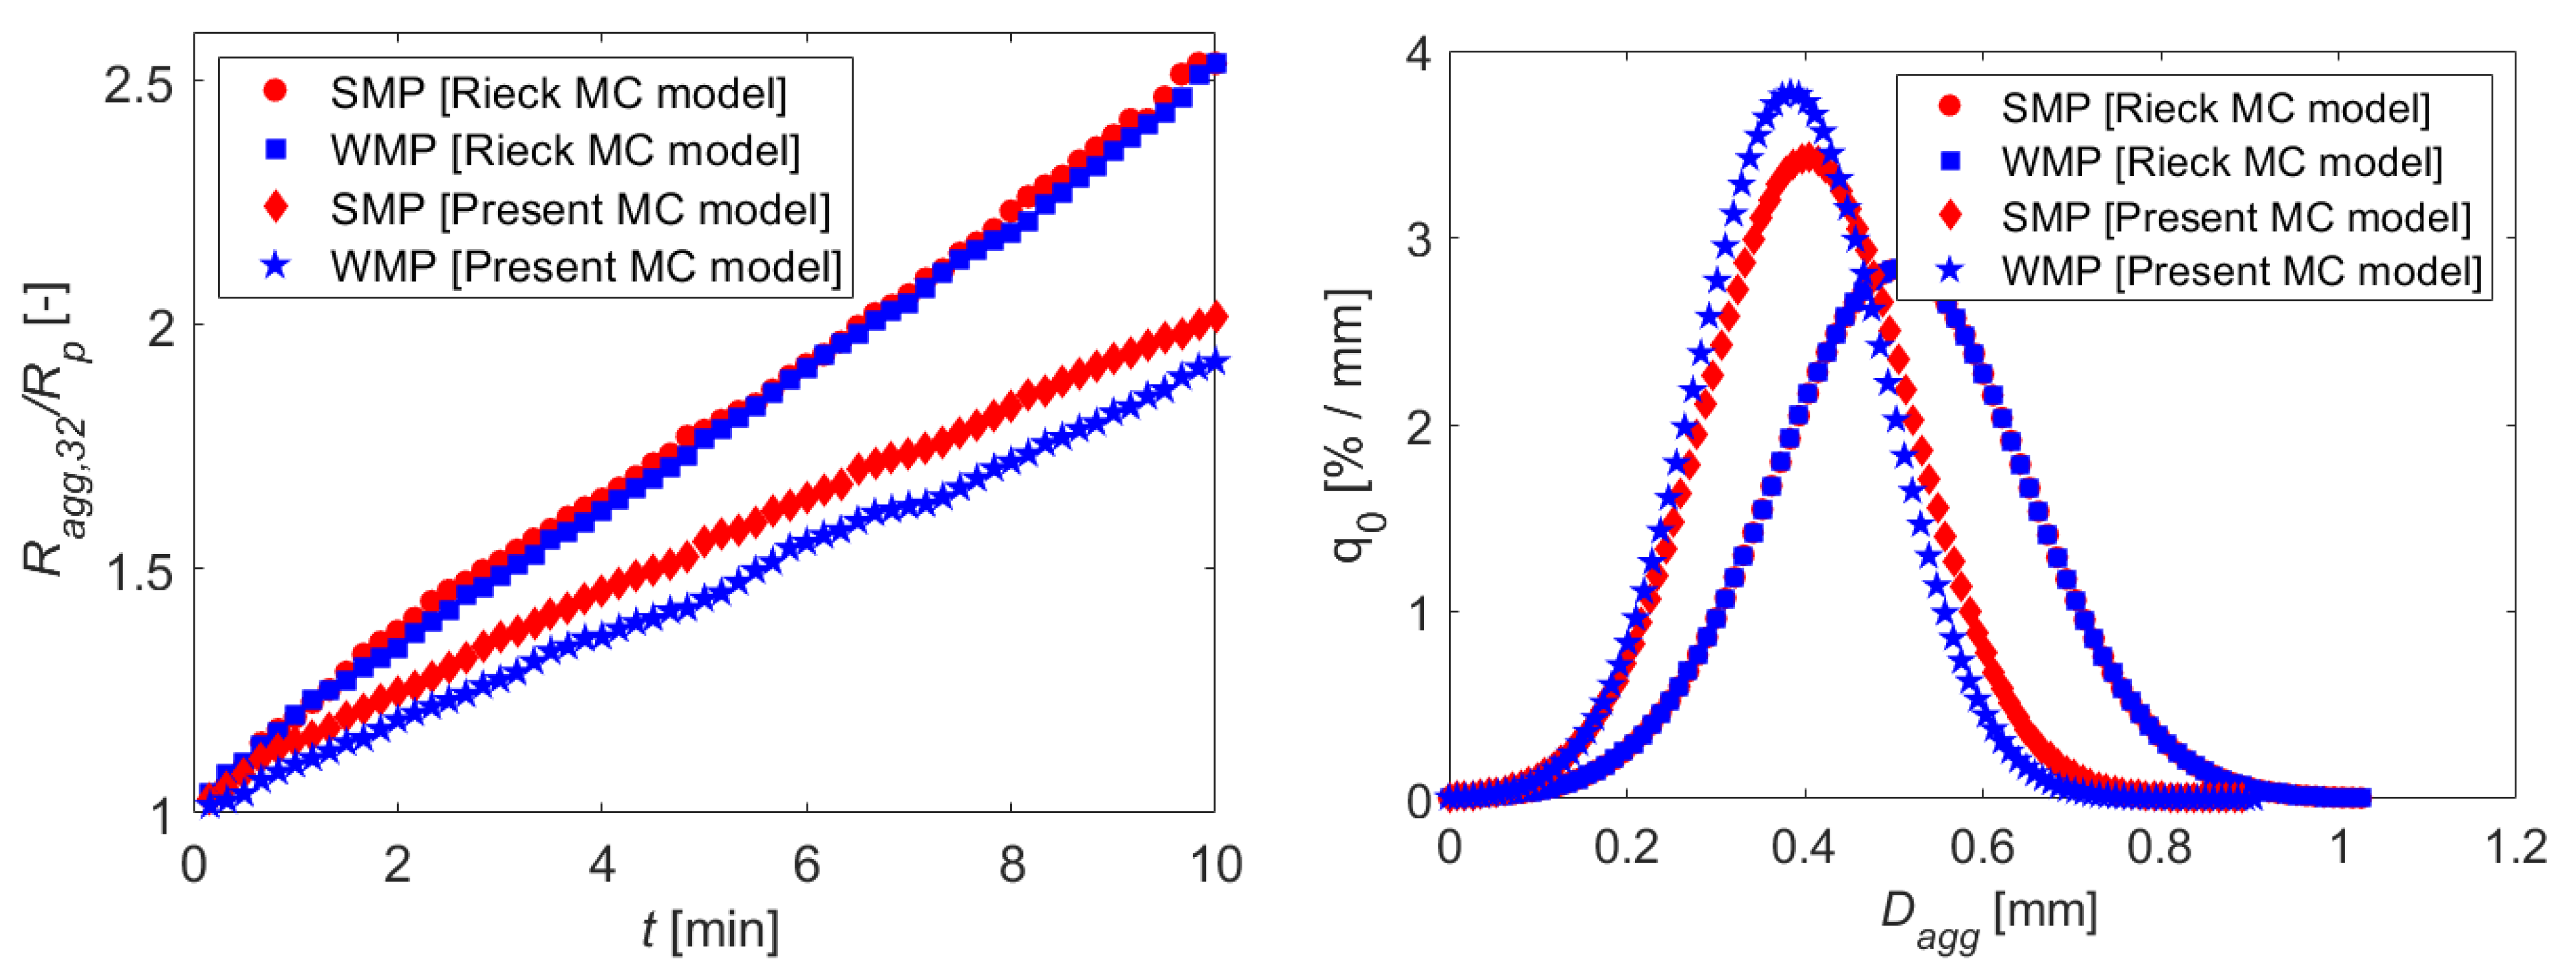
The transient growth of the particles is shown in Figure 6 (left) using the present MC model and the Rieck MC model [7]. The growth rate prediction using the Rieck MC model for the SMP and WMP agglomeration is almost the same and higher as compared to the present MC model. This means that the growth prediction from the Rieck MC model is higher than that predicted from the present MC model. The reason for this is the coarse estimation of the surface area of the agglomerates in the droplet deposition (CoP method) and the calculation of the diameter of the agglomerates at the same porosity of 0.5. Moreover, the growth rate prediction from the present MC model for the SMP agglomeration is faster as compared to the WMP agglomeration. Our experimental investigation of the influences of the process parameters on the agglomeration of the WMP and SMP also revealed that the SMP formed the largest agglomerates. It can be concluded that the present MC model is able to predict the influence of the material on the growth kinetics by incorporating the morphological descriptors of the formed agglomerates.
In addition, the particle size distribution (PSD) at different simulation times for both the whole milk and skim milk powder agglomeration is shown in Figure 6 (right). As expected, in case of the present MC model, the particles become larger for the SMP agglomeration, and the PSD shifts to the right compared to the WMP agglomeration. However, in the Rieck MC model, the PSD for both the SMP and WMP agglomerates is the same and broader as compared to the present MC model.
4. Conclusions
This study presented a stochastic modeling of SFB agglomeration of milk powder incorporating micro-scale mechanisms. These mechanisms are binary collisions between particles, droplet depositions on the particle surface, droplet drying and imbibition, and coalescence. Estimating the surface area correctly is very crucial in predicting the surface mechanisms, such as droplet deposition and particle coalescence. The surface area was determined by constructing the agglomerates using the aggregation model. The modified polydisperse tunable aggregation (MPTSA) model has been shown to be effective in mimicking the morphology of milk agglomerates.
A novel approach to incorporating the dynamic estimation of the number of positions for droplet depositions on a particle surface has been developed. Agglomerates are polymorphic, and this enhancement in the droplet deposition mechanism has a significant influence on the growth kinetics of agglomeration.
MC simulations using the present model have been conducted for two different milk powders and compared with the Rieck MC model. Despite some assumptions, the present MC model appropriately described the influence of the different materials on agglomeration behavior. The simulation results show that agglomeration will be faster for the skim milk powder. Furthermore, the prediction of global process kinetics by means of the present MC model deserves to be appraised by the results of real agglomeration experiments with milk powder. This will be performed in future work.
Author Contributions
Conceptualization, A.K.S. and E.T.; methodology, A.K.S.; software, A.K.S.; validation, A.K.S.; formal analysis, A.K.S.; investigation, A.K.S.; resources, A.K.S.; data curation, A.K.S.; writing—original draft preparation, A.K.S.; writing—review and editing, E.T.; visualization, A.K.S.; supervision, E.T.; project administration, E.T.; funding acquisition, E.T. All authors have read and agreed to the published version of the manuscript.
Funding
This research was funded by the Bundesministerium für Bildung und Forschung (BMBF), as a part of the combined agglomeration technology for food (COAGG) project (03INT609AA) in the frame of the excellence cluster “Wirbelschicht- und Granuliertechnik” (WIGRATEC).
Data Availability Statement
Not applicable.
Conflicts of Interest
The authors declare no conflict of interest.
Appendix A. Modified Polydisperse Tunable Aggregation (MPTSA) Model
The present model is a lattice-independent particle-cluster model. It is a polydisperse aggregation model and requires the mean and standard deviation of the Gaussian (normal) distribution of the radii of the primary particles. However, monodispersed PPs are considered in the present study. In this algorithm, the PPs are added sequentially in the following steps:
- Placing the first PP () at the center.
- Placing the second PP () in contact with the first PP without overlapping.
- From third PP on, , the center of PP is on the sphere with a radius [18]
Here, is the radius of PPs, is fractal dimension, is prefactor and varies from 3 to .
- Overlapping and contact conditions are checked when PP is placed on the sphere of radius R.
- PPs are placed sequentially when the desired number of PPs () is achieved.
Appendix B. Experimental Setup
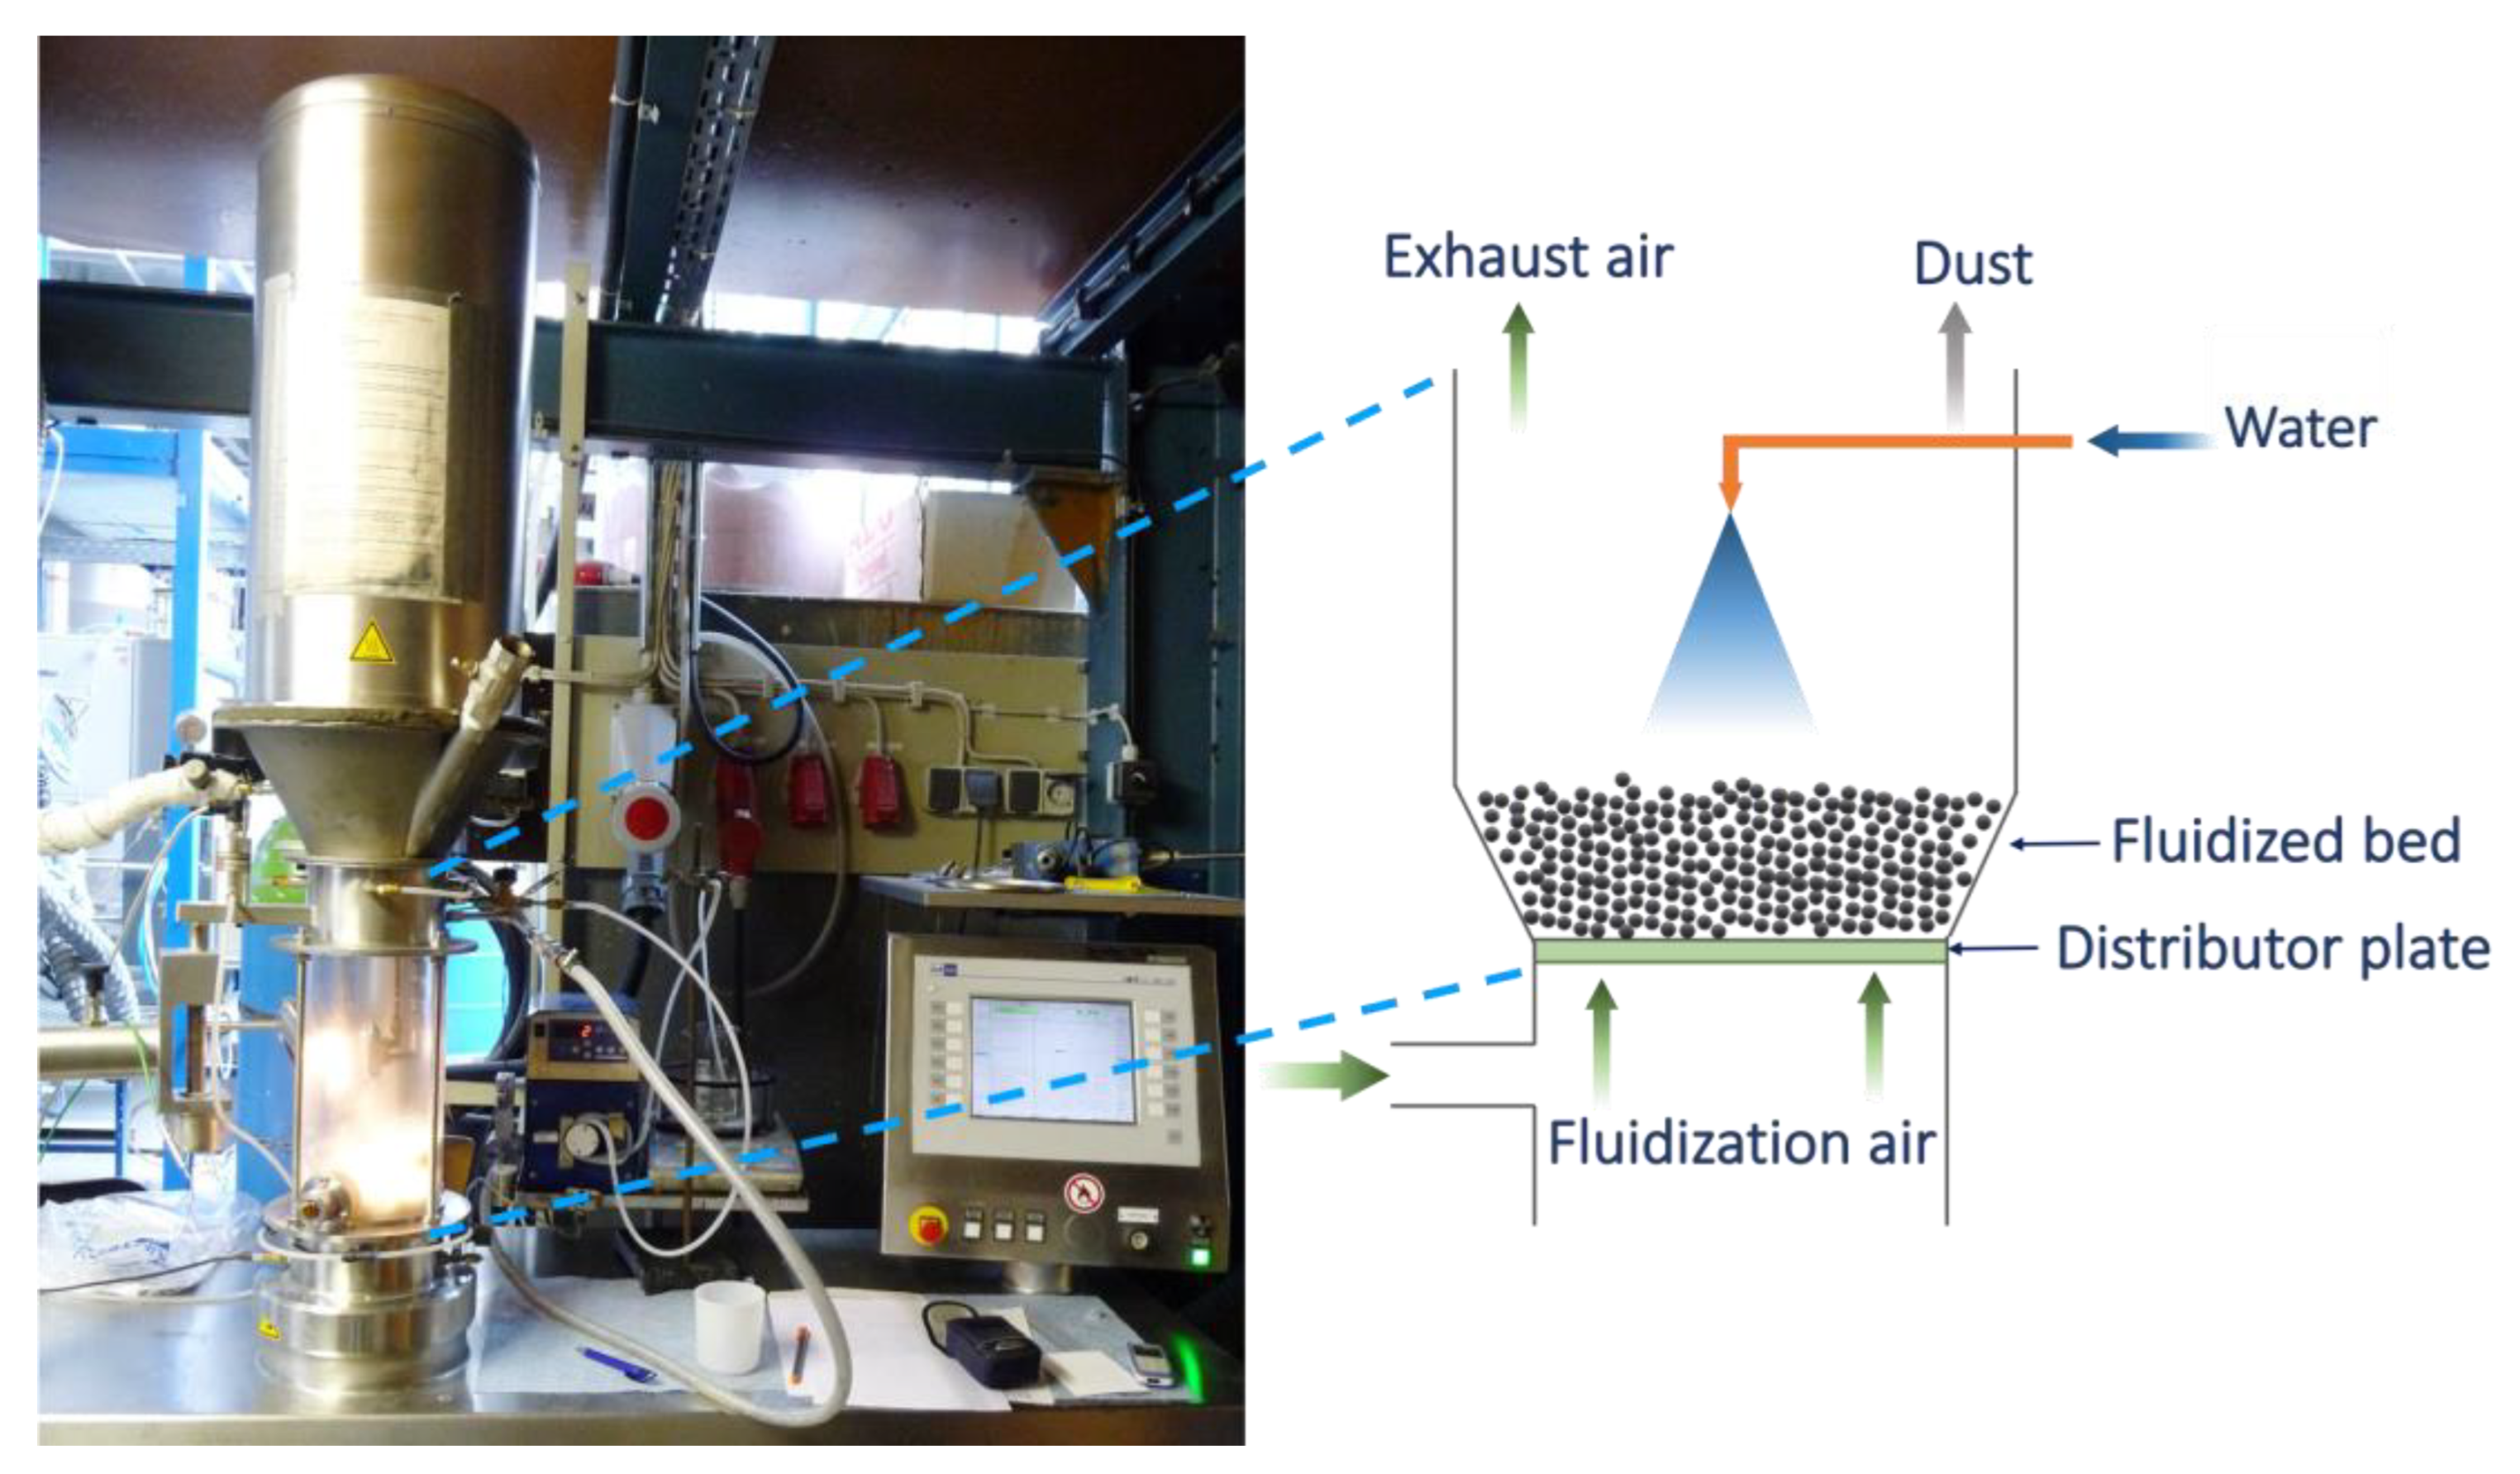
A laboratory-scale fluidized bed agglomerator (WSA 150 from Glatt Ingenieurtechnik GmbH, Weimar, Germany) is used. The chamber of the WSA 150 is composed of Plexiglas with an inner diameter of 152 mm and a height of 450 mm. The use of a transparent glass allows the processes in the fluidized bed chamber to be observed visually. A schematic flow diagram of the laboratory-scale experimental fluidized bed is shown in Figure A1. As a fluidization medium, ambient air is sucked in by a pressure blower. The air flows through the pressure blower and then through the electric heater and enters the fluidization chamber through a perforated sintered metal plate. Water droplets are injected in top spray configuration through a two-fluid nozzle (Model 940, Schlick GmbH, Salzgitter, Germany) located 150 mm above the air distributor plate. A peristaltic pump (manufactured by IKA-Werke, Staufen im Breisgau, Germany) is also used, through which the spray rate can be adjusted.
During the agglomeration process, the filter (at the top of the agglomerator) collects the particles that would be discharged from the top with the fluidization gas. With the help of the filter, the loss rate of the raw material can be reduced. The filter oscillates regularly, and the collected particles fall back into the fluidization chamber to ensure a stable bed mass.
Figure A1.
The experimental setup with a laboratory-scale fluidized bed agglomerator.

References
- Singh, A.K.; Tsotsas, E. Stochastic model to simulate spray fluidized bed agglomeration: A morphological approach. Powder Technol. 2019, 355, 449–460. [Google Scholar] [CrossRef]
- Singh, A.K.; Tsotsas, E. Stochastic simulation of spray fluidized bed agglomeration by modeling the morphology. In Proceedings of the 13th International Conference on Fluidized Bed Technology; Bi, X., Briens, C., Ellis, N.W.M., Eds.; GLAB Reactor and Fluidization Technologies: Vancouver, BC, Canada, 2021; pp. 268–273. [Google Scholar]
- Singh, A.K.; Tsotsas, E. Influence of polydispersity and breakage on stochastic simulations of spray fluidized bed agglomeration. Chem. Eng. Sci. 2022, 247, 117022. [Google Scholar] [CrossRef]
- Singh, A.K. Morphology Based Stochastic Simulation of Spray Fluidized Bed Agglomeration. Ph.D. Thesis, Otto-von-Guericke-Universität, Magdeburg, Germany, 2021. [Google Scholar]
- Terrazas-Velarde, K. Monte Carlo simulation of fluidized bed spray agglomeration. Ph.D. Thesis, Otto von Guericke University, Magdeburg, Germany, 2012. [Google Scholar]
- Pashminehazar, R.; Kharaghani, A.; Tsotsas, E. Three dimensional characterization of morphology and internal structure of soft material agglomerates produced in spray fluidized bed by X-ray tomography. Powder Technol. 2016, 300, 46–60. [Google Scholar] [CrossRef]
- Rieck, C.; Schmidt, M.; Bück, A.; Tsotsas, E. Monte Carlo modeling of binder-less spray agglomeration in fluidized beds. AIChE J. 2018, 64, 3582–3594. [Google Scholar] [CrossRef]
- Both, E.M.; Boom, R.M.; Schutyser, M.A.I. Particle morphology and powder properties during spray drying of maltodextrin and whey protein mixtures. Powder Technol. 2020, 363, 519–524. [Google Scholar] [CrossRef]
- Hazlett, R.; Schmidmeier, C.; O’Mahony, J.A. Influence of mechanical integrity during pneumatic conveying on the bulk handling and rehydration properties of agglomerated dairy powders. J. Food Eng. 2020, 288, 110103. [Google Scholar] [CrossRef]
- Adhikari, B.; Howes, T.; Lecomte, D.; Bhandari, B.R. A glass transition temperature approach for the prediction of the surface stickiness of a drying droplet during spray drying. Powder Technol. 2005, 149, 168–179. [Google Scholar] [CrossRef] [Green Version]
- Chever, S.; Méjean, S.; Dolivet, A.; Mei, F.; Den Boer, C.M.; Le Barzic, G.; Jeantet, R.; Schuck, P. Agglomeration during spray drying: Physical and rehydration properties of whole milk/sugar mixture powders. Lwt 2017, 83, 33–41. [Google Scholar] [CrossRef]
- Jubaer, H.; Xiao, J.; Chen, X.D.; Selomulya, C.; Woo, M.W. Identification of regions in a spray dryer susceptible to forced agglomeration by CFD simulations. Powder Technol. 2019, 346, 23–37. [Google Scholar] [CrossRef]
- Sommerfeld, M.; Stübing, S. A novel Lagrangian agglomerate structure model. Powder Technol. 2017, 319, 34–52. [Google Scholar] [CrossRef]
- Hussain, F.; Jaskulski, M.; Piatkowski, M.; Tsotsas, E. CFD simulation of agglomeration and coalescence in spray dryer. Chem. Eng. Sci. 2022, 247, 117064. [Google Scholar] [CrossRef]
- Malafronte, L.; Ahrné, L.; Innings, F.; Jongsma, A.; Rasmuson, A. Prediction of regions of coalescence and agglomeration along a spray dryer—Application to skim milk powder. Chem. Eng. Res. Des. 2015, 104, 703–712. [Google Scholar] [CrossRef]
- Dernedde, M.; Peglow, M.; Tsotsas, E. Stochastic modeling of fluidized bed agglomeration: Determination of particle moisture content. Dry. Technol. 2013, 31, 1764–1771. [Google Scholar] [CrossRef]
- Dernedde, M.; Peglow, M.; Tsotsas, E. A novel, structure-tracking Monte Carlo algorithm for spray fluidized bed agglomeration. AIChE J. 2012, 58, 3016–3029. [Google Scholar] [CrossRef]
- Hussain, M.; Kumar, J.; Peglow, M.; Tsotsas, E. Modeling spray fluidized bed aggregation kinetics on the basis of Monte-Carlo simulation results. Chem. Eng. Sci. 2013, 101, 35–45. [Google Scholar] [CrossRef]
- Terrazas-Velarde, K.; Peglow, M.; Tsotsas, E. Investigation of the kinetics of fluidized bed spray agglomeration based on stochastic methods. AIChE J. 2011, 57, 3012–3026. [Google Scholar] [CrossRef]
- Terrazas-Velarde, K.; Peglow, M.; Tsotsas, E. Stochastic simulation of agglomerate formation in fluidized bed spray drying: A micro-scale approach. Chem. Eng. Sci. 2009, 64, 2631–2643. [Google Scholar] [CrossRef]
- Singh, A.K.; Tsotsas, E. A tunable aggregation model incorporated in Monte Carlo simulations of spray fluidized bed agglomeration. Powder Technol. 2020, 364, 417–428. [Google Scholar] [CrossRef]
- Fries, L.; Antonyuk, S.; Heinrich, S.; Palzer, S. DEM-CFD modeling of a fluidized bed spray granulator. Chem. Eng. Sci. 2011, 66, 2340–2355. [Google Scholar] [CrossRef]
- Singh, A.K.; Tsotsas, E. A fast and improved tunable aggregation model for stochastic simulation of spray fluidized bed agglomeration. Energies 2021, 14, 7221. [Google Scholar] [CrossRef]
- Terrazas-Velarde, K.; Peglow, M.; Tsotsas, E. Kinetics of fluidized bed spray agglomeration for compact and porous particles. Chem. Eng. Sci. 2011, 66, 1866–1878. [Google Scholar] [CrossRef]
- Dadkhah, M.; Peglow, M.; Tsotsas, E. Characterization of the internal morphology of agglomerates produced in a spray fluidized bed by X-ray tomography. Powder Technol. 2012, 228, 349–358. [Google Scholar] [CrossRef]
- Pashminehazar, R.; Ahmed, S.J.; Kharaghani, A.; Tsotsas, E. Spatial morphology of maltodextrin agglomerates from X-ray microtomographic data: Real structure evaluation vs. spherical primary particle model. Powder Technol. 2018, 331, 204–217. [Google Scholar] [CrossRef]
- Filippov, A.V.; Zurita, M.; Rosner, D.E. Fractal-like aggregates: Relation between morphology and physical properties. J. Colloid Interface Sci. 2000, 229, 261–273. [Google Scholar] [CrossRef]
- Ennis, B.J.; Tardos, G.; Pfeffer, R. A microlevel-based characterization of granulation phenomena. Powder Technol. 1991, 65, 257–272. [Google Scholar] [CrossRef]
- Palzer, S. Agglomeration of dehydrated consumer foods. In Handbook of Powder Technology; Elsevier Science BV: New York, NY, USA, 2007; Volume 11, pp. 591–671. ISBN 9780444518712. [Google Scholar]
- Hogekamp, S.; Pohl, M. Porosity measurement of fragile agglomerates. Powder Technol. 2003, 130, 385–392. [Google Scholar] [CrossRef]
- Smoczyński, M. Fractal analysis of the microstructure of milk powders produced at various temperatures. J. Food Sci. Technol. 2020, 57, 2303–2309. [Google Scholar] [CrossRef] [Green Version]
- Wang, R.; Singh, A.K.; Kolan, S.R.; Tsotsas, E. Fractal analysis of aggregates: Correlation between the 2D and 3D box-counting fractal dimension and power law fractal dimension. Chaos, Solitons and Fractals 2022, 160, 112246. [Google Scholar] [CrossRef]
- Qian, F.; Sun, J.; Cao, D.; Tuo, Y.; Jiang, S.; Mu, G. Experimental and Modelling Study of the Denaturation of Milk Protein by Heat Treatment. Korean J. Food Sci. Anim. Resour. 2017, 37, 44–51. [Google Scholar] [CrossRef]
Figure 1.
Flowchart representation of the MC modeling for SFB agglomeration of milk powder.

Figure 2.
A schematic diagram of a droplet (with diameter, and cap area, ) deposition on the surface of soft PPs and the formation of a puddle (with height ).
Figure 2.
A schematic diagram of a droplet (with diameter, and cap area, ) deposition on the surface of soft PPs and the formation of a puddle (with height ).

Figure 3.
A schematic diagram of the ‘concept of positions’ (with 6 sectors and 24 positions; calculated using Equation (5) for the PP).
Figure 3.
A schematic diagram of the ‘concept of positions’ (with 6 sectors and 24 positions; calculated using Equation (5) for the PP).

Figure 4.
The porosity of the experimentally formed milk powder agglomerates (dots) [30] and the theoretically calculated porosity for monodispersed agglomerates at different pairs of fractal properties (lines) over their diameter.
Figure 4.
The porosity of the experimentally formed milk powder agglomerates (dots) [30] and the theoretically calculated porosity for monodispersed agglomerates at different pairs of fractal properties (lines) over their diameter.

Figure 5.
The agglomerates generated using the MPTSA model with their porosity values for the whole milk powder (left) and the skim milk powder (right).
Figure 5.
The agglomerates generated using the MPTSA model with their porosity values for the whole milk powder (left) and the skim milk powder (right).

Figure 6.
The transient growth (left) at different simulation times and the PSD after 10 min (right) using the present and the Rieck MC models for the WMP and SMP agglomeration.
Figure 6.
The transient growth (left) at different simulation times and the PSD after 10 min (right) using the present and the Rieck MC models for the WMP and SMP agglomeration.


Table 1.
The material properties.
| Materials | [°C] | [-] |
|---|---|---|
| Whole milk powder (WMP) | 101 | 6.5 |
| Skim milk powder (SMP) | 101 | 8.6 |
Table 2.
The aggregates with their diameters (Equation (11)) and the number of positions calculated using the CoP approach and the new approach (Equation (5)).
Table 2.
The aggregates with their diameters (Equation (11)) and the number of positions calculated using the CoP approach and the new approach (Equation (5)).
| Aggregate |  |  |  |  |  |  |
|---|---|---|---|---|---|---|
| (at ) [-] | 2.0 | 2.2 | 2.4 | 2.6 | 2.8 | 3.0 |
| (Equation (11)) [mm] | 2.4 | 2.0 | 1.8 | 1.6 | 1.4 | 1.3 |
| (CoP) [-] | 1608 | 1608 | 1608 | 1608 | 1608 | 1608 |
| (Equation (5)) [-] | 3647 | 2521 | 1976 | 1510 | 1206 | 990 |
Table 3.
The experimental and simulation parameters.
| Parameters | Notation | Value | Unit |
|---|---|---|---|
| Bed mass | 600 | g | |
| Primary particle density | 1300 | kg/m3 | |
| Inlet gas temperature | 50 | °C | |
| Water mass flow rate | 300 | g/h | |
| Gas (dry) mass flow rate | 24 | kg/h | |
| Primary particle radius | 100 | µm | |
| Droplet diameter | 40 | µm | |
| Collision frequency prefactor | 20 | 1/m | |
| Fluidization velocity | 0.34 | m/s | |
| Particle surface asperities height | 10 | µm | |
| Particle restitution coefficient | e | 0.8 | - |
| Droplet contact angle | 40 |
Publisher’s Note: MDPI stays neutral with regard to jurisdictional claims in published maps and institutional affiliations. |
© 2022 by the authors. Licensee MDPI, Basel, Switzerland. This article is an open access article distributed under the terms and conditions of the Creative Commons Attribution (CC BY) license (https://creativecommons.org/licenses/by/4.0/).
Share and Cite
MDPI and ACS Style
Singh, A.K.; Tsotsas, E. Agglomeration of Spray-Dried Milk Powder in a Spray Fluidized Bed: A Morphological Modeling. Processes 2022, 10, 2718. https://doi.org/10.3390/pr10122718
AMA Style
Singh AK, Tsotsas E. Agglomeration of Spray-Dried Milk Powder in a Spray Fluidized Bed: A Morphological Modeling. Processes. 2022; 10(12):2718. https://doi.org/10.3390/pr10122718
Chicago/Turabian StyleSingh, Abhinandan Kumar, and Evangelos Tsotsas. 2022. "Agglomeration of Spray-Dried Milk Powder in a Spray Fluidized Bed: A Morphological Modeling" Processes 10, no. 12: 2718. https://doi.org/10.3390/pr10122718
Note that from the first issue of 2016, this journal uses article numbers instead of page numbers. See further details here.