Article

Computational Fluid Dynamics Modeling of Single Isothermal and Non-Isothermal Impinging Jets in a Scaled-Down High-Temperature Gas-Cooled Reactor Facility

by
Anas M. Alwafi
,
Salman M. Alshehri
* and
Salman M. Alzahrani
*
Nuclear Science Research Institute, King Abdulaziz City for Science and Technology (KACST), P.O. Box 6086, Riyadh 11442, Saudi Arabia
*
Authors to whom correspondence should be addressed.
Processes 2023, 11(1), 46; https://doi.org/10.3390/pr11010046
Submission received: 27 October 2022 / Revised: 16 December 2022 / Accepted: 22 December 2022 / Published: 25 December 2022
(This article belongs to the Section Energy Systems)

Abstract

:
In the current work, the flow characteristics of single isothermal and non-isothermal jets discharging into the upper plenum of a 1/16th scaled-down high-temperature gas-cooled reactor (HTGR) facility were studied. ANSYS Fluent simulations were carried out in the central plane of the jet water flow and the upper plenum for different Reynolds numbers (Re) ranging from 3413 to 12,819. Then, the statistical jet water flow characteristics, such as the mean velocity, root-mean-square fluctuating velocity, Reynolds stress, and the mean temperature in the upper plenum, were computed and presented. The current study’s results showed that the flow maximum velocity occurred far from the jet inlet. Finally, the temperature profiles were plotted, and it was found that the maximum temperature of the flow occurred close to the plume inlet and after that decreased downstream.

1. Introduction

The development of generation IV (GEN IV) technologies is monitored and controlled by an organization, the Generation IV International Forum, which was founded in 2001. The organization publishes guidelines for GEN IV nuclear power plants as a roadmap for nuclear energy systems and a high-temperature gas-cooled reactor (HTGR). The HTGR is considered one of the promising future technologies to be used for reactors [1,2,3,4].
HTGRs can produce heat at high temperatures using hundreds-of-megawatts (MW) reactors. HTGRs are also known as high-temperature reactors (HTRs), and they have potential applications in solving various industrial issues such as process heat, electricity, etc. The elevated temperature from the HTGR allows for considering applications like the production of CO2-free hydrogen or oil refining processes. Processes like desalination or district heating, which require lower temperature heat, may also benefit from the HTGR heat source. It is important to note that the heat residual from HTGRs has higher energy levels than the light water reactor (LWR) [5].
The HTGR uses tristructural isotropic (TRISO), which is coated with particle fuel, has a complete ceramic core structure, and uses helium as a coolant. All these features can withstand high-temperature conditions. In addition, the HGTR has inherent safety features since it uses function requirements like reactivity control, residual heat removal, and radioactive retention. The design features of the next-generation nuclear power plant reactor are based on the concept of modular HTGR. Therefore, the modular HTGR is designed to meet safety and design requirements [6].
Phenomena identification ranking table analysis has been used to identify specific accident scenarios for the HTGR as essential risks to core safety. Therefore, the in-depth analysis is always required for the use of HTGR technology. The two primary accident scenarios are a depressurized conduction cool down (DCC) and a pressurized conduction cool down (PCC) [7]. In the DCC scenario, also known as a loss-of-coolant accident (LOCA), the primary coolant experiences a sudden depressurization which causes a reactor scram. However, when the pump fails, a natural circulation occurs between the reactor vessel and the confinement.
On the other hand, the PCC scenario has been known as a loss of flow accident (LOFA), which occurs when an external force is lost during a reactor scram caused by power failure. In the situation of scram, the blowers and pumps will not function, but the primary system remains operational at full pressure with the natural convection pushing the heat from the reactor core to the cavity cooling system. Mixing hot plumes from the heated coolant channel of the reactor core will occur in the upper plenum [8]. Hot gas flow is usually transferred as a free shear flow from the core area into the upper plenum (hemisphere). A jet will be generated when the flow rate comes from massive heat fluxes and has high momentum-driven steaming. If the flow rate is density-gradient, the gas will flow upward to create a plume in the upper area of the plenum. Sometimes the emergence of the jet flow will change to a plume as it comes from the core coolant channels. The fundamental flow characteristics of jet and plume are different since jet flow involves mixing turbulent fluxes. In contrast, the plume flow consists of the buoyancy forces that cause the mixing. There is a development of warm or hot stratified gas layers in the upper plenum of the HTGR caused by the flow with plume characteristics. However, when the jet flow is largely momentum-driven, it will permeate through the stratified gas layers and negatively affect the upper hemisphere material. This penetration of jet flow and undesirable thermal gradients will result in material cracking since there will be poor cooling due to high-heat transfer rates in the flow. It is observed that the fundamental characteristics of both jet and plume flow in the PCC and DCC accident scenarios are a trade-off between the safety and operational aspects of the process.
Understanding the jet and plume flows in terms of their thermal-hydraulic characteristics, flow behavior, and heat transfers is crucial for studying the HTGR. In addition, high-fidelity experimental data with high spatial and temporal resolutions are essential for assessing and validating the simulation performance using the CFD models and system codes. Recently, the nuclear society utilized such simulations. Several researchers have studied flow experiments and numerical studies to examine the flow behavior for single and multiple jets in a scaled-down HTGR facility [9].
Three fields in the round jet can be defined as the near, intermediate, and far fields. Researchers have focused on turbulence around free jets, and they have studied the far-field areas and the near field of the potential core. Theory, experiments, and/or modelling and experiment were the three investigations used in the previous studies [10,11,12,13,14,15,16,17,18,19]. Moreover, numerous studies have been conducted over the last decade focusing on the flow behavior at different conditions in the scaled models for the lower and upper plenum of the HTGR [20,21,22,23,24]. Several researchers have studied nuclear reactors to examine the behavior of single and multiple jets flows in scaled-down HTGR facilities using CFD models [25,26,27,28,29,30].
The subcommittee for Verification, Validation, and Uncertainty Quantification in Computational Simulation of Nuclear System Thermal Fluids Behavior (VVUQ 30) of the American Society of Mechanical Engineering (ASME) is supporting a series of benchmark problems designed to study the scope and key ingredients of the VVUQ 30 subcommittee’s charter. One of the benchmark problems is the one that this research has investigated. This study used the CFD software ANSYS Fluent in analyzing 1/16th-scaled single isothermal and non-isothermal jets in high-temperature gas-cooled reactors (HTGR) with an upper plenum. The CFD model investigation was used for the measurements, characterization of flow behavior, and temperature distributions of a single jet together with heat transfer in a scaled-down HTGR facility.
There are several research studies on the behavior of a single jet/plume. However, there is no research specific for this geometry. The contribution of this research is an analysis of the characteristics of momentum and buoyancy flows in the hemispherical upper plenum of the reactor to support recent research on the advancement of nuclear technology reactors.

2. Physical Model

A 1/16th scaled-down version of the modular HTGR prototype was used in the current study. The HTGR core design and the scaled-down facility consist of 1020 fuel blocks and 25 pipe blocks, respectively. Both blocks have a hexagonal shape arrangement, and the scaled-down facility blocks simulated the coolant channels. Figure 1a is the visible view of the geometry model for a single jet, while Figure 1b shows the side view of the same jet. In Figure 1b, the coolant enters the lower plenum of the reactor from the inlet pipe (A) and is drawn up to the region of interest, the upper plenum (B). The water exits the upper plenum through the outlet groove (C) and flows downward through pipe (D) until it reaches the outlet pipe (E) [31].
In the numerical simulations, the lower plenum was not considered because a single vertical inlet channel has a total mass flow rate from the lower plenum. A recycling boundary condition was applied to generate a fully developed flow in a long vertical pipe (coolant channel). The model is a 1/16th scaled-down HTGR prototype that has been used in experiments to examine the behavior of single and multiple jet flows. Figure 2 shows the details of the model used in the simulations, and the inlet and outlet jet diameter for the model is 12.6 mm. Water was used as the fluid for the simulations, and the specific heat, thermal conductivity (k), density, and dynamic viscosity (μ) for H2O are given as 4193 J/Kg-K, 0.66 W/m-K, 974.68 kg/m3, and 0.378 × 10⁻³ Kg/m s, respectively. The properties of water were set at the inlet of the coolant channels. This study applied the realizable k-ε turbulence model to accommodate different mesh sizes.

3. Numerical Model

In this present study, the two simulated cases were isothermal and non-isothermal models. The basic governing equations solved by ANSYS/FLUENT 19.1 are continuity, momentum, and energy. Equations (1) and (2) are the continuity and momentum equations. Equations (3)–(5) are the energy equations for the free flow, respectively:
.   μ U = 0 ,
.   μ U U =   p + . τ = + μ g + F ,
.   U μ E f + p = . K f   T ,
.   k s T = 0
.   U μ E f + p = . k e f f     T h j J j + ( τ e f f . U ) ,
All the equations are solved simultaneously by implementing the coupled flow and coupled energy models. The coupled flow gives the choice of integration and discretization methods, for which implicit and second-order upwind were chosen. The second-order upwind method has an advantage over the first method because of its reduced numerical diffusion. The implicit method was selected because it provides a wider stability margin but requires more system storage than the explicit scheme. All models were determined to be in turbulent flow, and the gravity model was implemented as a natural circulation in the non-isothermal model. The effects of gravitation acceleration were needed to model the forces used in a natural circulation flow accurately. However, a steady-state model was chosen to study the problem at the given time options.

3.1. Boundary Conditions

For the isothermal model, the boundary conditions selected in this study corresponded to the details of the experimental facility, operating conditions, and measured data provided in the work of Alwafi et al. [4] as shown in Table 1. The non-isothermal model was used for the natural circulation with inlet temperature up to 75 °C. The Re number was set between 300 and 531 at the inlet. The average pressure was zero at the outlet of all simulated runs in the present study. Lastly, the pipe’s surface was assumed to have no-slip conditions.

3.2. Numerical Solution

The initial conditions were used for the isothermal model to test the numerical convergence at the inlet pipe. The number of iterations was between 3500 and 5000; for a high Re number, it converged between 2000 and 6300 iterations. Convergence criteria were set to be 1 × 10⁻⁵ for velocity, continuity, k, and epsilon. For a tighter criterion, the limit was 1 × 10⁻⁶ of energy to be used. The numerical solution is second-order, as shown in Table 1.
For the non-isothermal model, all the simulations were calculated under gravitational conditions, and flow was assumed to be turbulent. Moreover, several initial and boundary conditions were considered, as shown in Table 2.
Most simulations were completed within 2–8 h in this work, but a high-power computer could improve the computational speed.

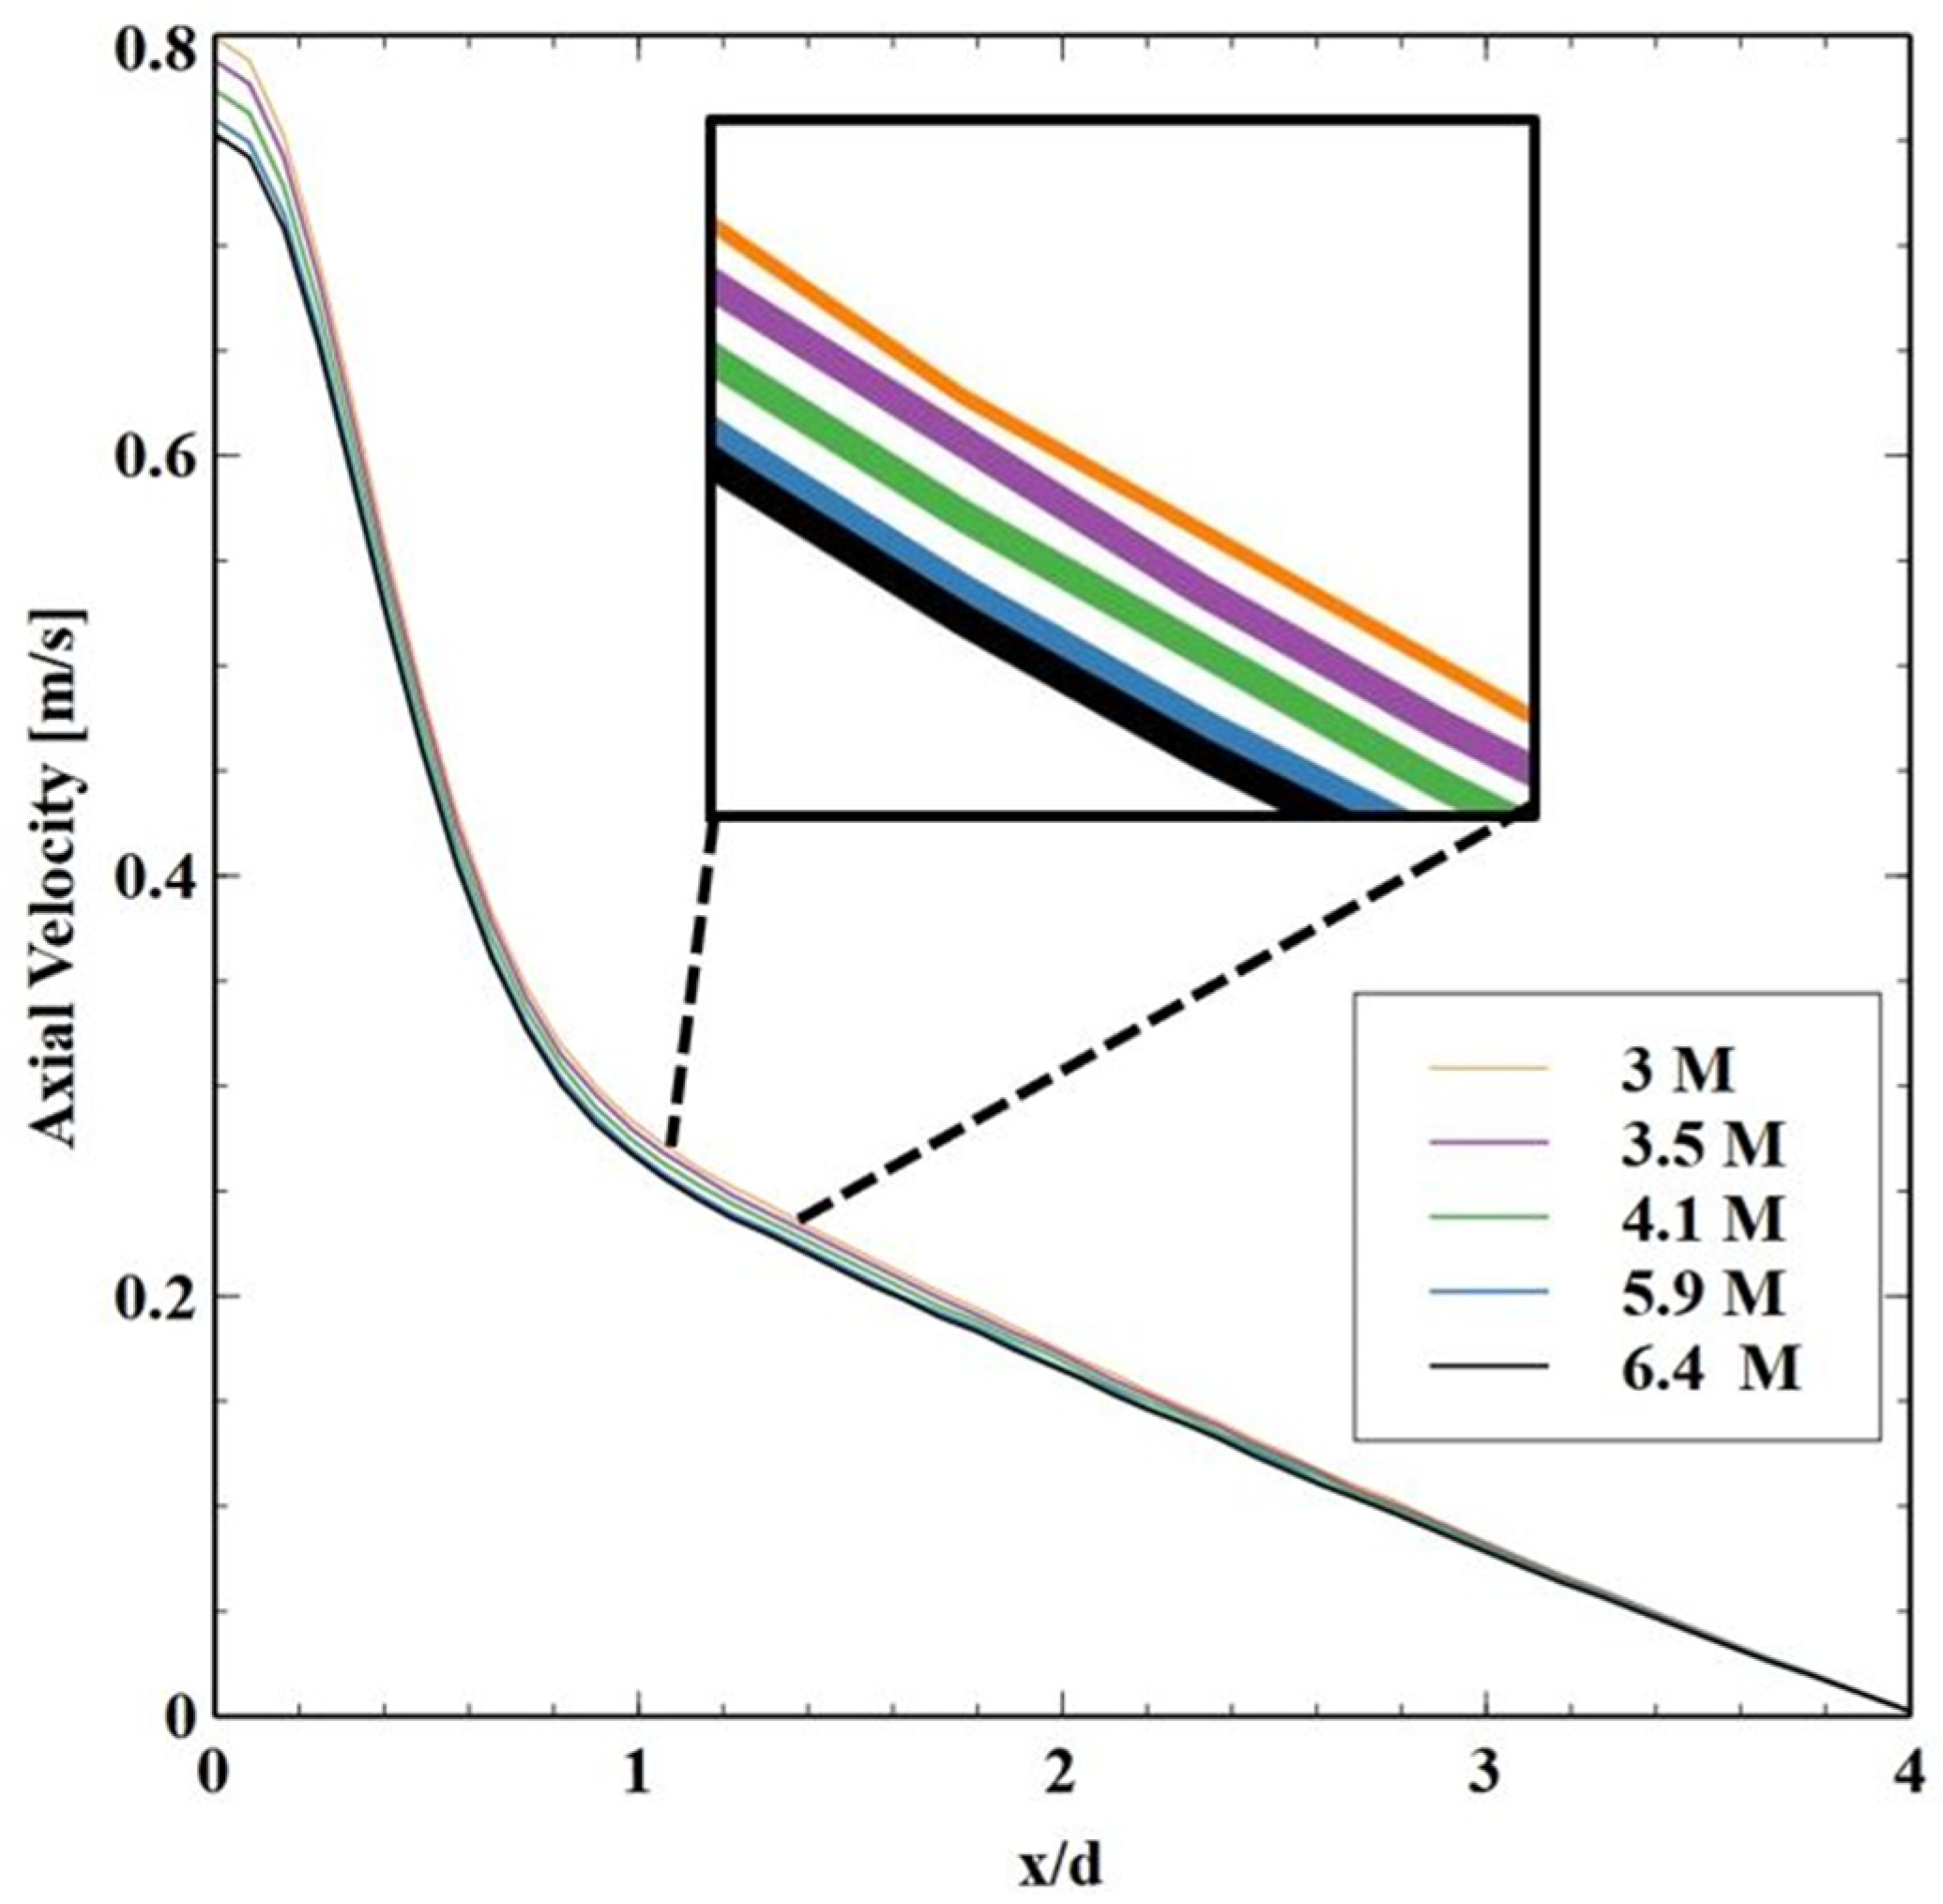
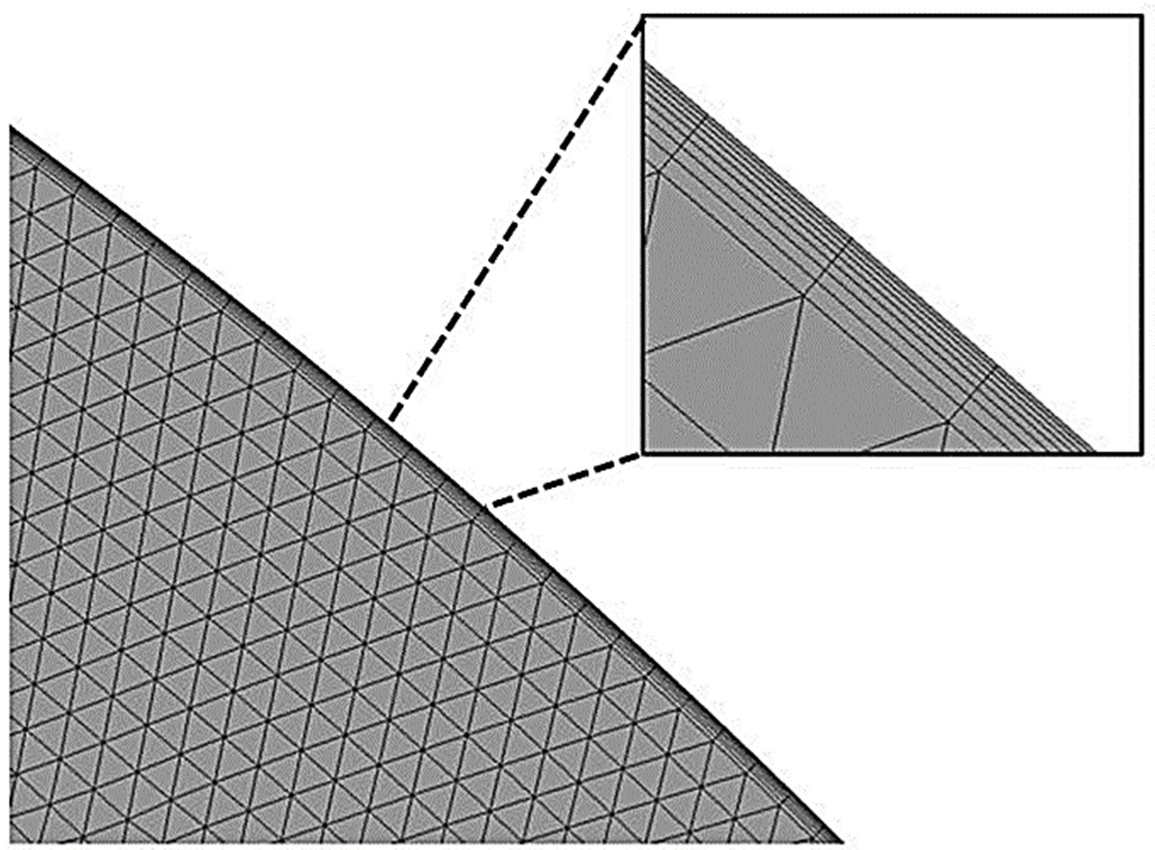
3.3. Mesh Parameters

Proper meshing is essential for the simulation to capture the thermal-hydraulic behavior, so ANSYS meshing was used to mesh the geometry. To ensure that the obtained results do not change according to cell size, five different mesh sizes were generated as follows: 3 M, 3.5 M, 4.1 M, 5.9 M, and 6.4 M for the velocity profiles, as shown in Figure 3. A small grid dependence was observed for 3 M nodes, and all results were identical for 5.9 M nodes and higher. For this reason, grids with 5.9 M nodes were selected for the rest of the simulations.
In the independent study, the number and type of the mesh were 5.9 M and tetrahedral mesh, respectively. The mesh’s geometry with natural circulation models is more complicated than force convection models. However, the fine mesh defined for all meshes had uniform size and slow transition. Moreover, close to the walls of the upper plenum, eight layers of inflated elements with a transition ratio of 0.1 and a growth rate of 1.2 were used. Figure 4 shows the inflation that was used next to the walls.

4. Results and Discussion

The results of the current study are divided into two sections. The isothermal and non-isothermal single-jet models were investigated in the first and second sections of the study, respectively. In the first section, three different single-jet simulations were modeled for given operating conditions, as shown in Figure 2. In addition, ANSYS Fluent was performed and analyzed for other Reynolds numbers from 3413–12,819. The selected Reynolds numbers were based on the operating conditions of the HTGR for the scenario of coolant accident loss. Furthermore, three various axial locations were investigated using ANSYS fluent, as shown in Figure 5 (y/d = 1, 5, and 10).
It is important to group various types of intrusion according to how they inject into the ambient fluid, either momentum, buoyancy, or both. These flows can be classified as partly turbulent as they cause higher turbulence levels in their intrusion vicinity than the surrounding fluid. When incoming fluid is mixed with its dormant fluid body, significant turbulence is created due to the velocity shear. However, when the incoming jet is mixed with the fluid body at rest, the momentum source is caused by the jet itself. Such momentum will remain unchanged along the downstream provided that external forces accelerating or decelerating are either minimal or nonexistent in the jet region [32]. The ANSYS Fluent results for a single-jet mixing in the upper plenum for different axial mean velocities against Reynolds numbers are presented in Figure 6, Figure 7 and Figure 8. The results show that the maximum values for jet velocity are attained at the y/D = 1, followed by a steady decrease downstream with expansion in the transverse direction due to the diagonal movement of the jet. The jet flow showed a higher momentum flux at a higher Re number of 12,819, causing large penetration depths compared to lower Re numbers.
Figure 9 shows the localized velocity decay rates for different Re numbers along the jet centerline. The results showed high fluctuations of the velocity decay profiles inside the jet-flow axial height. Further downstream, Re = 7912 and Re = 12,819 merge into one profile with similar decay rates. From the nozzle exit of y/D = 9.2, there was an exponential increase in the decay profile due to jet impingement on the upper plenum, thus resulting in reduced centerline velocity, which made the decay profiles increase.
Reynolds stress (u′v′) profiles for various horizontal lines, y/D equals 1, 5, and 10, have been shown in Figure 10. In this case, the jet flow was discharged from a circular pipe into the ceiling of the upper plenum, and there was also the development of wall-jet flow before exiting the plenum. The large-scale vortices caused the jet flow momentum to be exchanged within the shear layer. This scenario has shifted the maximum local peaks of the Reynolds stress to lower axial positions. The results showed that counter-rotating vortices in the longitudinal direction create oscillating positive and negative radial fluid patterns.
Figure 11 shows the results of the radial velocity ( U r m s ´ ) along different axial locations. The U r m s ´ has nearly the same shape and peaks similar to the ones near the upper plenum inlet y/D = 1. These peaks were mainly located over shear layers where jet momentum was exchanged with the surrounding fluid. At y/D = 10, the turbulence intensities were anisotropic due to turbulence structure influences [10].
The second section examines the buoyancy flow characteristics of a single non-isothermal plume into the upper plenum of a 1/16th scaled-down HTGR. A heating source would create the plume buoyancy, circulating the flow via a closed loop. Thus, the non-isothermal simulation uses natural circulation and heat, and it will be analyzed by ANSYS Fluent. At the entrance of the jet pipe, the water temperature and Re number were set to 75 °C and 600, respectively. Additionally, the surface of the jet pipe was assumed to have non-slippery conditions. Figure 12, Figure 13 and Figure 14 show the mean velocity vector fields against the velocity magnitude contour v, u´rms, fluctuating transverse velocity (m/s), and Reynolds stress ( U   ´ V   ´ ) (m2/s2), respectively, for the non-isothermal plume 1. The maximum value of the plume velocity was attained at V_Centerline = 0.119 m/s and y/D ≈ 1.85. The plume velocity showed a steady decrease along the axial position till the plume began to rise in a diagonal direction after reaching the upper plenum top wall. The transverse velocity U r m s ´ has the maximum value close to the upper plenum center and after that began to decrease. In the isothermal study, the maximum velocities of the jet and the plume occurred close and away from the inlet. Turbulent regions caused by buoyancy force were observed at the plume center in both directions, and higher flow fluctuation occurred at the plume core. The normal jet flow with increased kinetic energy causes high turbulences close to the upper plenum wall [33]. The Reynolds stress color contour shows the shear layers with positive and negative peaks at similar elevations. The signs of Reynolds stress ( U   ´ V   ´ ) indicate the rotational signs of the counter vortex pairs formed along the axial position of the plume nozzle.
The interpolation and normalization of the statistical profiles were performed along the axial position, y/D = 0–8, and using the plume velocity (V center line), respectively. Figure 15 represents the profile of the normalized mean vertical velocity (V/V_centerline) obtained from the ANSYS Fluent measurements for the upper plenum plume mixing. Moreover, the velocity profiles started to increase from a y/D value of 0 to 5, where maximum velocity is attained, and after that peak began to have a steady decrease until y/D = 8. The velocity of the center line reached ~57% of the jet velocity, and there were minor changes in the axial velocity that occurred for x/D ≥ 3.
The temperature profiles from y/D = 0 to 8 were interpolated horizontally and plotted in Figure 16, which shows the mean temperature profiles for upper plenum plume mixing. The maximum temperature for the profile from y/D = 0 to 5 at the center of the core inlet shows a similar quick drop in temperature at the end of the core. However, there was a gradual drop in temperature from y/D = 2 to 7. The profiles at y/D = 8 show a decrease in a non-monotonic temperature pattern that could be assigned to the high-temperature flow from the upper plenum wall. On the other hand, Figure 17 shows the effects of the temperature profile on the Prandtl number (Pr). The Pr number increases as the fluid temperature is decreasing. Moreover, increasing the Pr number reduces the thermal boundary layer thickness.
Figure 18 shows the mean velocity-vector fields against the mean temperature. The flow moves in a horizontal direction to the heater plane, and there is a transfer of heat to the fluid due to flow molecular motion to form a dome-like temperature boundary layer. A convective jet is formed when the fluid rises at the center because a hot surface has gently heated it. When the convective jet phase has been attained, the plume’s uniform growth continues until the heat wave encounters the upper plenum wall top.

5. Conclusions

CFD simulations were performed to analyze single isothermal and non-isothermal jets in the 1/16th scaled-down HTGR upper plenum at Texas A&M University for different Re numbers from 3413–12,819. The CFD model was used for velocity vector fields for measurements close to the jet inlet and flow reaching the upper plenum wall. The flow characteristics, such as the mean velocity, u´rms fluctuating velocity, and Reynolds stress, were examined and presented in the present study. The study simulated two cases for isothermal and non-isothermal models. The isothermal model corresponds to the details of the experimental facility at Texas A&M University, while the non-isothermal model represents the natural circulation and heat. The isothermal model results showed that the flow characteristics are similar for y/D = 0–5, and flow can be considered free jets. Confinement and impingement effects were observed in the y/D region greater than 5, and close to the upper plenum top wall the flow began to decrease and change its diagonal direction. The Ur.m.s peaks were identified downstream at y/D = 1 and 5 for Reynolds numbers Re1, Re2, and Re3. Decay profiles of local velocities along axial location showed an increase up to y/D = 9.2 and after that exhibited an exponential increase because of jet flow reaching the top wall.
For the non-isothermal case, the measurements, flow field characterizations, and temperature distributions of a jet flow inside the upper plenum with conjugate heat transfer were investigated for Re = 500. ANSYS Fluent was used to analyze the characteristics of momentum and buoyancy-driven flows in the hemispherical upper plenum. From the results of velocity vector fields, flow properties such as mean velocity, u´rms fluctuating velocity, and Reynolds stress, the mean temperatures in the upper plenum were examined and reported in the current study. The results showed that the plume’s maximum velocity was attained away from the inlet, and after that the velocity decreased along the axial location. The flow had high turbulences close to the upper plenum wall. The Reynolds stress displayed the shear layers with positive and negative peaks that occurred at similar elevations. The signs of the Reynolds stress (u´v´) show the rotational signs of the counter vortex pair created downstream of the plume nozzle. These simulation results will be used as verification and validation tools for the system codes and CFD models. However, additional experimental measurements will be needed.
In the future, the standard k-ε turbulence model can be substituted for with the large eddy simulation (LES) model to analyze the flow mixing near the impingement region. Moreover, the current study can be extended to investigate the upper plenum surfaces with different accident scenarios. Furthermore, multiple jets for various flow configurations could be studied in the upper plenum for this geometry.

Author Contributions

Conceptualization, A.M.A., S.M.A. (Salman M. Alshehri) and S.M.A. (Salman M. Alzahrani); modeling and software coding, S.M.A. (Salman M. Alzahrani); formal analysis, A.M.A. and S.M.A. (Salman M. Alshehri); investigation A.M.A., S.M.A. (Salman M. Alshehri) and S.M.A. (Salman M. Alzahrani); writing—original draft preparation, S.M.A. (Salman M. Alzahrani); writing—review and editing, A.M.A. and S.M.A. (Salman M. Alshehri). All authors have read and agreed to the published version of the manuscript.

Funding

This research received no external funding.

Institutional Review Board Statement

Not applicable.

Informed Consent Statement

Not applicable.

Data Availability Statement

Not applicable.

Acknowledgments

The authors would like to acknowledge King Abdulaziz City for Science and Technology (KACST), Saudi Arabia, for its support.

Conflicts of Interest

The authors declare no conflict of interest.

Nomenclature

SymbolsDescription
xHorizontal (transverse) directions
yVertical (axial) directions
DPlume diameter (mm)
U, VHorizontal and axial time-averaged velocities (m/s)
ReReynolds number
VmLocal velocity along the jet center line (m/s)
VcMaximum axial velocity (m/s)
U r m s ´ Root-mean-square fluctuating horizontal velocity (m/s)
V r m s ´ Root-mean-square fluctuating vertical velocity (m/s)
U   ´ V   ´ Reynolds stress
CPUCentral processing unit
μDensity (kg/m3)
KThermal conductivity (W/m K)
ηDynamic viscosity (Kg/m-s)
U Velocity
pPressure
τ = Stress tensor
g Gravity acceleration
TTemperature,
CpSpecific heat (j/kg-k)
PrPrandtl number
HTGRHigh temperature gas-cooled reactor
CFDComputational fluid dynamics
DCCDepressurized conduction cool down
LOCALoss of coolant accident
PCCPressurized conduction cool down

References

  1. DOE, U.S. Nuclear Energy Research Advisory Committee and Gen IV International Forum (GIF). In A Technology Roadmap for Generation IV Nuclear Energy Systems; Generation IV International Forum; DOE: Washington, DC, USA, 2002; pp. 10–55. [Google Scholar]
  2. DOE, U.S. Nuclear Energy Research Advisory Committee and Gen IV International Forum (GIF). In GIF R&D Outlook for Generation IV Nuclear Energy Systems; Generation IV International Forum; DOE: Washington, DC, USA, 2009; pp. 4–8. [Google Scholar]
  3. GIF. Proceedings of the GIF Symposium. In Proceedings of the GIF Symposium, Paris, France, 9–10 September 2009; pp. 77–121.
  4. Kelly, J.E. Generation IV International Forum: A decade of progress through international cooperation. Prog. Nucl. Energy 2014, 77, 240–246. [Google Scholar] [CrossRef]
  5. Herranz, L.E.; Linares, J.I.; Moratilla, B.Y. Power cycle assessment of nuclear high temperature gas-cooled reactors. Appl. Therm. Eng. 2009, 29, 1759–1765. [Google Scholar] [CrossRef] [Green Version]
  6. U.S. Nuclear Regulatory Commission. Next Generation Nuclear Plant Phenomena Identification and Ranking Tables (PIRTs); U.S. Nuclear Regulatory Commission: Washington, DC, USA, 2008; Volume 6. [Google Scholar]
  7. Schultz, R.R.; Ougouag, A.M.; Nigg, D.W.; Gougar, H.D.; Johnson, R.W.; Terry, W.K.; Oh, C.H.; McEligot, D.W.; Johnsen, G.W.; McCreery, G.E.; et al. Next Generation Nuclear Plant Methods Technical Program Plan; INL/EXT-06-11804, PLN-2498; Idaho National Lab. (INL): Idaho Falls, ID, USA, 2010. [Google Scholar]
  8. Alwafi, A.; Nguyen, T.; Hassan, Y.; Anand, N.K. Time-resolved particle image velocimetry measurements of a single impinging jet in the upper plenum of a scaled facility of high temperature gas-cooled reactors. Int. J. Heat Fluid Flow. 2019, 76, 113–129. [Google Scholar] [CrossRef]
  9. Alwafi, A.; Nguyen, T.; Hassan, Y.; Anand, N.K. Experimental analysis of a non-isothermal confined impinging single plume using time-resolved particle image velocimetry and planar laser induced fluorescence measurements. Int. J. Heat Mass Transfer. 2022, 193, 122952. [Google Scholar] [CrossRef]
  10. Fellouah, H.; Ball, C.G.; Pollard, A. Reynolds number effects within the development region of a turbulent round free jet. Int. J. Heat Mass Transfer. 2009, 52, 3943–3954. [Google Scholar] [CrossRef]
  11. Webster, D.R.; Roberts, P.J.; Ra'ad, L. Simultaneous DPTV/PLIF measurements of a turbulent jet. Exp. Fluids 2001, 30, 65–72. [Google Scholar] [CrossRef]
  12. Angioletti, M.; Nino, E.; Ruocco, G. CFD turbulent modelling of jet impingement and its validation by particle image velocimetry and mass transfer measurements. Int. J. Therm. Sci. 2005, 44, 349–356. [Google Scholar] [CrossRef]
  13. Keramaris, E.; Pechlivanidis, G. The behaviour of a turbulent buoyant jet into flowing environment. Procedia Eng. 2016, 162, 120–127. [Google Scholar] [CrossRef] [Green Version]
  14. Qin, S.; Krohn, B.; Downing, J.; Petrov, V.; Manera, A. High-resolution velocity field measurements of turbulent round free jets in uniform environments. Nucl. Technol. 2019, 205, 213–225. [Google Scholar] [CrossRef]
  15. Hussein, H.J.; Capp, S.P.; George, W.K. Velocity measurements in a high-Reynolds-number, momentum-conserving, axisymmetric, turbulent jet. J. Fluid Mech. 1994, 258, 31–75. [Google Scholar] [CrossRef]
  16. Kim, J.; Choi, H. Large eddy simulation of a circular jet: Effect of inflow conditions on the near field. J. Fluid Mech. 2009, 620, 383–411. [Google Scholar] [CrossRef]
  17. Wang, H.; Lee, S.; Hassan, Y.A.; Ruggles, A.E. Laser-Doppler measurements of the turbulent mixing of two rectangular water jets impinging on a stationary pool. Int. J. Heat Mass Transfer. 2016, 92, 206–227. [Google Scholar] [CrossRef] [Green Version]
  18. Wang, M.B.; Wang, R.H.; Liu, X.Y. Numerical simulation of a semi-confined slot turbulent impinging jet. In Advanced Materials Research; Trans Tech Publications Ltd.: Stafa-Zurich, Switzerland, 2011; Volume 268, pp. 345–350. [Google Scholar]
  19. Wang, S.J.; Mujumdar, A.S. A numerical study of flow and mixing characteristics of three-dimensional confined turbulent opposing jets: Unequal jets. Chem. Eng. Process. Process Intensif. 2005, 44, 1068–1074. [Google Scholar] [CrossRef]
  20. Gradecka, M.J.; Woods, B.G. Development of thermal mixing enhancement method for lower plenum of the High Temperature Test Facility. Nucl. Eng. Des. 2016, 305, 81–103. [Google Scholar] [CrossRef]
  21. Richard, W.J. Modeling Strategies for Unsteady Turbulent Flows in the Lower Plenum of the VHTR; INL/CON-06-01371; Idaho National Laboratory (United States): Idaho Falls, ID, USA, 2006. [Google Scholar]
  22. Alwafi, A.; Nguyen, T.; Hassan, Y. Investigation of the flow near the wall of a single impinging jet at the scaled upper plenum of HTGR using Tr-PIV. In Proceedings of the International Conference on Nuclear Engineering (ICONE), Ibaraki, Japan, 19–24 May 2019; p. 1616. [Google Scholar]
  23. Jin, H.G.; No, H.C.; Park, B.H. Effects of the onset time of natural circulation on safety in an air ingress accident involving a HTGR. Nucl. Eng. Des. 2012, 250, 626–632. [Google Scholar] [CrossRef]
  24. King, B.M. Natural Circulation Scaling of a Pressurized Conduction Cooldown Event in the Upper Plenum of the Modular High Temperature Gas Reactor. Master’s Thesis, Oregon State University, Corvallis, OR, USA, 2012. [Google Scholar]
  25. Johnson, R.W.; Gallaway, T.; Guillen, D.P. Investigations of the Application of CFD to Flow Expected in the Lower Plenum of the Prismatic VHTR; INL/EXT-06-11756; Idaho National Lab. (INL): Idaho Falls, ID, USA, 2006. [Google Scholar]
  26. Anderson, N.; Hassan, Y.; Schultz, R. Analysis of the hot gas flow in the outlet plenum of the very high temperature reactor using coupled RELAP5-3D system code and a CFD code. Nucl. Eng. Des. 2008, 238, 274–279. [Google Scholar] [CrossRef]
  27. Tung, Y.-H.; Johnson, R.W. CFD calculations of natural circulation in a high temperature gas reactor following pressurized circulator shutdown. In Proceedings of the ASME International Mechanical Engineering Congress and Exposition, Denver, CO, USA, 11–17 November 2011; Volume 54969, pp. 1169–1177. [Google Scholar]
  28. McEligot, D.M.; Condie, K.G.; Mc Creery, G.E.; Mc Ilroy, H.M. Development of an Experiment for Measuring Flow Phenomena Occurring in a Lower Plenum for VHTR CFD Assessment; INL/EXT-05-00603; Idaho National Lab. (INL): Idaho Falls, ID, USA, 2005. [Google Scholar]
  29. Reyes, J., Jr.; Groome, J.T.; Woods, B.G.; Jackson, B.; Marshall, T.D. Scaling analysis for the high temperature gas reactor test section (GRTS). Nucl. Eng. Des. 2010, 240, 397–404. [Google Scholar] [CrossRef]
  30. Wang, H.; Dominguez-Ontiveros, E.; Hassan, Y.A. Computational fluid dynamics analysis of core bypass flow and crossflow in a prismatic very high temperature gas-cooled nuclear reactor based on a two-layer block model. Nucl. Eng. Des. 2014, 268, 64–76. [Google Scholar] [CrossRef]
  31. McVay, K.L.; Park, J.H.; Lee, S.; Hassan, Y.A.; Anand, N.K. Preliminary tests of particle image velocimetry for the upper plenum of a scaled model of a very high temperature gas cooled reactor. Prog. Nucl. Energy 2015, 83, 305–317. [Google Scholar] [CrossRef] [Green Version]
  32. Wang, X.K.; Tan, S.K. Environmental fluid dynamics-jet flow. J. Hydrodyn. Ser. B 2010, 22, 1009–1014. [Google Scholar] [CrossRef]
  33. Grafsrønningen, S.; Jensen, A.; Reif, B.A. PIV investigation of buoyant plume from natural convection heat transfer above a horizontal heated cylinder. Int. J. Heat Mass Transf. 2011, 54, 4975–4987. [Google Scholar] [CrossRef]
Figure 1. Model geometry for a single jet: (a) visible view; (b) side view to show flow direction.
Processes 11 00046 g001
Figure 2. Dimensional details of the model.
Processes 11 00046 g002
Figure 3. Different meshes for velocity fields (m/s).
Processes 11 00046 g003
Figure 4. Mesh cross section near the walls of the upper plenum.
Processes 11 00046 g004
Figure 5. Comparison of velocities over the measured plane (XY plane) in Fluent for Re = 12,819, velocity magnitude at the temperature of 292.74 K.
Processes 11 00046 g005
Figure 6. Profiles of axial mean velocities across x-position at various axial for Re = 3413.
Processes 11 00046 g006
Figure 7. Profiles of axial mean velocities across x-position at various axial for Re = 7912.
Processes 11 00046 g007
Figure 8. Profiles of axial mean velocities across x-position at various axial for Re = 12,819.
Processes 11 00046 g008
Figure 9. Decay profiles of local velocity along the jet centerline for Re = 3413, Re = 7912, and Re = 12,819.
Processes 11 00046 g009
Figure 10. Reynolds stress across x-position at various axial locations for Re = 3413, Re = 7912, and Re = 12,819.
Processes 11 00046 g010
Figure 11. The U r m s ´ fluctuations across x-position at various axial locations for Reynolds numbers ranging from Re = 3413 to Re = 12,819.
Processes 11 00046 g011
Figure 12. The velocity magnitude contour (m/s) with velocity vector fields.
Processes 11 00046 g012
Figure 13. The transverse velocity u ´ r m s in the upper plenum.
Processes 11 00046 g013
Figure 14. The Reynolds stress (u´v´) in the upper plenum.
Processes 11 00046 g014
Figure 15. Profile of the normalized mean vertical velocity V/VCenter line of a single plume mixing in the upper plenum.
Processes 11 00046 g015
Figure 16. The mean temperature of a single plume mixing in the upper plenum.
Processes 11 00046 g016
Figure 17. The mean temperature of a single plume with Prandtl number in the upper plenum.
Processes 11 00046 g017
Figure 18. The mean velocity vector fields and mean temperature of a single plume mixing in the upper plenum.
Processes 11 00046 g018
Table 1. Setup and solver settings for the isothermal model.
ModelK-epsilon
SolverPressure-Based
Working FluidWater
OutletPressure Boundary
Density ModelConstant (998.2)
Spatial DiscretizationPressure Solver2nd Order Upwind
Momentum2nd Order Upwind
Turbulent Kinetic Energy2nd Order Upwind
Energy2nd Order Upwind
Turbulent Dissipation Rate and2nd Order Upwind
GradientLeast Squares Cell-Based
Pressure–Velocity CouplingSIMPLE
Table 2. Setup and solver settings for the non-isothermal model.
ModelEnergy, K-epsilon
SolverPressure-Based
Gravity−9.8
Working FluidWater
Density ModelBoussinesq
Coefficient of Thermal Expansion0.0034
Spatial DiscretizationPressure SolverBody Force Weighted
Momentum2nd Order Upwind
Turbulent Kinetic Energy2nd Order Upwind
Energy2nd Order Upwind
Turbulent Dissipation Rate and2nd Order Upwind
GradientLeast Squares Cell-Based
Pressure–Velocity CouplingPISO
Disclaimer/Publisher’s Note: The statements, opinions and data contained in all publications are solely those of the individual author(s) and contributor(s) and not of MDPI and/or the editor(s). MDPI and/or the editor(s) disclaim responsibility for any injury to people or property resulting from any ideas, methods, instructions or products referred to in the content.

