Article

A Simultaneous Design and Optimization Framework for the Reaction and Distillation Sections of Methanol to Olefins Process

1
School of Chemical Engineering and Technology, Xi’an Jiaotong University, Xi’an 710049, China
2
Inner Mongolia Electric Power Survey & Design Institute Co., Ltd., Hohhot 010011, China
*
Authors to whom correspondence should be addressed.
Processes 2023, 11(1), 58; https://doi.org/10.3390/pr11010058
Submission received: 30 November 2022 / Revised: 15 December 2022 / Accepted: 20 December 2022 / Published: 26 December 2022
(This article belongs to the Section Energy Systems)

Abstract

:
The reaction and separation sections are the keys to the methanol-to-olefins (MTO) chemical processes, and they should be optimized to reduce the cost of production. This work develops a framework for the simultaneous design and optimization of the reaction and distillation sections. An optimization model with shortcut and rigorous methods combined is established for distillation columns to improve accuracy and efficiency. With the auxiliary devices and the selection of utilities considered, the reaction and distillation sections are integrated to maximize profits. The genetic algorithm targets the optimal parameters, including the catalyst’s coke content and reaction temperature, each column’s operating pressure, and the allocation of utilities and auxiliary devices. For the studied MTO process, the optimal reaction temperature and catalyst’s coke content were identified to be 496 °C and 7.8%, respectively. The maximum profit is 15.3% greater than that identified with only the separation section optimized, and the minimum total annual cost (TAC) of the separation section is 3.73% less.

1. Introduction

The methanol-to-olefin (MTO) process [1] transfers methanol to ethylene and propylene, and is an important way to produce olefin independently of petroleum. It can help to improve the stable supply of olefin in China [2], as methanol can be derived from coal or natural gas. The MTO reaction was first proposed in the 1970s, with ZSM-5 as the catalyst [3]. Currently, the primary catalyst used in the MTO process is SAPO-34, the total selectivity of ethylene and propylene can reach 80%, and their ratio is adjustable in the interval 0.5~1.5 [4]. Three leading MTO technologies which have been successfully applied in industries [5] are the DMTO developed by Dalian Institute of Chemical Physics (DICP), the SMTO by Sinopec Shanghai Research Institute of Petrochemical Technology, and the MTO technology developed by UOP/Norsk Hydro. The reaction and separation sections are the keys to these processes.
The conversion of methanol and the selectivity to olefin are two key parameters to evaluate the MTO reactor’s performance, and are expected to be as high as possible. However, the reactor parameters might have different influences on them. For example, multiple reactions are in progress, and their reaction rates increase along with the reactor’s temperature as does the conversion. In comparison, the variation trend of selectivity might differ depending on all reaction rates and their ratios. For the distillation columns of the separation section, lower energy consumption and capital cost are expected while ensuring the purification of olefin products. Many parameters, such as pressure, reflux ratio, and the number of stages, affect these costs. In addition, the utilities selected for condensers and reboilers directly affect the heat exchange areas and energy costs. The costs of heat exchangers, pumps, and compressors arranged between two adjacent columns are related to the neighboring columns’ feeds, products, and operating parameters. All of these columns and auxiliary devices are affected by the separation section’s feed and, thus, the reactor parameters. For the optimization of the MTO process, the reaction and separation sections should be considered together with the primary parameters optimized.
For the MTO reactors, the cracking of C4+ was promoted in order to increase the production of ethylene and propylene by improving the reactor and optimizing the coke distribution on the catalyst [6]. Moreover, much research on the MTO reaction’s mechanism has been carried out [7], including the MTO reactions with the conversions between alkanes and alkenes [8], the kinetic parameters, the relationships between temperature and reaction rates [9], an eight-lumped kinetic model [10] and a seven-lumped kinetic model [11]. The kinetic mechanism models are complex, require much calculation for simulation and optimization, and sometimes cannot converge.
In the separation section, the optimization of distillation is of great significance for energy savings and pollution reductions, and can be achieved based on shortcut and rigorous methods. The Fenske–Underwood–Gilliland (FUG) method is well-known for its simplification and efficiency [12], and is widely applied. Ye et al. [13] extended the Underwood equation to columns with side streams and optimized the distillation sequence considering the condensers and reboilers. Cui [14] established the optimization procedure based on the FUG model and determined the operating pressure according to the minimum annual cost. For the thermally coupled reactive distillation, Gomez-Castro [15] proposed a method to minimize the heat load of columns and illustrated its performance for targeting the optimal design. The boundary value method (BVM) was proposed by Fidkowski [16] to design a distillation column and check the feasibility of the design. Lucia et al. [17] proposed the shortest stripping line approach to target the minimum energy demand. However, shortcut models are usually based on the assumptions of constant molar overflow and constant relative volatilities, which might cause significant errors.
Rigorous models can identify accurate and detailed results for the distillation columns [18]. They are based on material balances (M), equilibrium relationships (E), summation of compositions (S), and enthalpy balances (H), and are known as MESH equations. These equations have been embedded in commercial software, such as Aspen Plus and Unisim, for the design and sensitive analysis of distillation columns [19]. However, distillation sequences with multiple columns can only be designed sequentially, and poor results might be obtained [20].
All columns should be optimized simultaneously, considering their interactions. Viswanathan et al. [21] used the mixed integer nonlinear programming (MINLP) method to optimize a distillation column with the number of theoretical stages as the decision variable. The MESH equations are used in the optimization model as the constraints, and other process parameters are taken as decision variables [22]. The model includes thousands of equations and variables or more, and the challenges are concentrated on the initialization and convergence of the model. In some methods, the MESH equations are pre-solved to establish the mappings among different variables. Seidel et al. [23] proposed an approach for infeasible path optimization of distillation-based flowsheets. Although this method can significantly reduce the number of decision variables, the difficulty lies in establishing an appropriate solution model.
Some research has been carried out for the optimization of the MTO process. Based on Aspen Plus software, Yu [24] simulated the process, proposed an improved design with lower cost, and compared different methods of separating propane and propylene [25]. Dimian [26] studied the heat integration of the MTO process and provided an energy-efficient design. Chen et al. [27] optimized the refrigeration cycle of the MTO process and proposed an alternative arrangement with better economic performance. Although these studies optimized the MTO processes to some extent, the interactions between the reaction and separation sections were left out of consideration.
Different methods and models have been developed to integrate the reaction and separation systems. Yin et al. [28] proposed a method to automatically identify the optimal distillation sequences and generate the appropriate solutions according to different reaction parameters. Hentschel et al. [29] combined the kinetic reaction model with the FUG model to minimize the total cost of the reaction–distillation process. Both methods can analyze and sort multiple alternative schemes efficiently. Kong et al. [30] proposed an optimization framework for biofuel production based on the superstructure model for synthesizing the process and allocating utilities simultaneously. Based on the generalized model description, critical characteristic identification, and model integration, Ryu et al. [31] proposed a general model for simultaneously optimizing the reaction, separation, and heat exchanger network. Although the MINLP model was generally used to optimize the reaction–separation system [32], it is not easy to solve and target its global optimum. In addition, stochastic optimization algorithms can be used to solve large-scale MINLP problems efficiently, such as genetic algorithm [33], simulated annealing algorithm [34], and particle swarm optimization [35]. Among these, the genetic algorithm is widely used for optimizing complex systems.
Although some researchers have studied the optimization of the MTO process and the integration of the reaction and separation systems, there are no reports about the systematic integration of the reaction and separation sections in the available literature. In the MTO reactor, coke is formed at high temperatures. It attaches to the catalyst’s surface and affects its activity, hence the reactor’s conversion and selectivity, the separation section, and the energy consumption. Among the parameters affecting the total cost of distillation columns, the pressure is significantly important, as it affects components’ activity, the reflux ratio, and the number of stages.
This work develops an efficient method for integrating the reaction and separation sections considering the auxiliary devices. The reactor model will be established based on the lumped model, and the column will be modeled with the combined shortcut and the rigorous model. A procedure based on the genetic algorithm will be proposed to solve the model efficiently. This manuscript is organized as follows: Section 2 will analyze the interaction between the reaction and distillation sections of the MTO process; in Section 3, the building of the optimization model is described, considering the optimization of the catalyst’s coke content, reaction temperature, each column’s operating pressure, and the allocation of utilities, etc. In Section 4, a case is studied to illustrate the application of the proposed method. The proposed method is summarized in the Conclusions section.

2. Interaction between the Reaction and Distillation Sections

MTO Process

The general MTO process with a front-end dethanizer is shown in Figure 1. In this process, the fluidized bed reactor (R1101) is the core of the entire process. The methanol, preheated to 300 °C, reacts quickly in the reactor, generating a significant amount of heat. Some coke will form and deposit on the catalysts’ surface and cause the catalyst’s deactivation. The deactivated catalyst is regenerated in regenerator R1102 to remove the coke. After preheating the methanol, the reactor effluent is sent to a quench column (T1101) and scrubber (T1102) to decrease its temperature and remove the water and catalyst. The high-temperature gas countercurrent makes contact with the water in column T1101. The gas product exiting the scrubber (T1102) mainly consists of low-carbon olefins (C1–C5).
The gas is compressed by compressors (C1101, C1102) in the separation section and then fed to the alkali column (T1103) to remove the oxides and acids. Then, it passes through the compressor (C1103), dryer (D1101), and inlets into the distillation sequence with five columns. The dethanizer (T1201) performs the split between C2 and C3. Its top product is separated in the demethanizer (T1202) and ethylene column (T1203) to remove C1 and ethane, respectively, and pure ethylene is obtained at the top of T1203. The bottom product of T1201 is fed to the depropanizer (T1204) to separate C3 from the top, which is further separated by the propylene column (T1205) to obtain pure propylene. The bottom product of T1204 consists of C4 and C5, and is sent out of the separating section.
In this process, the reactor effluent is separated in the separation section. The reactor parameters, such as feed composition, temperature, catalyst, etc., affect the product, operation, and energy consumption of distillation columns. Optimizing the reaction and separation sections together is necessary to reduce energy consumption.
In the reactor, methanol conversion and the selectivity to olefin are expected to be as high as possible. However, different parameters might have different influences on them. For example, the reaction rates and conversion increase along with the reactor’s temperature. The selectivity to olefin depends on each reaction rate and their ratios, and its variation might be different. Furthermore, coke is formed at high temperatures, attaches to the catalyst’s surface, and affects the catalyst’s activity as well as the selectivity of desired products. Therefore, the reactor temperature (T) and coke content of the catalyst (CC) are the key parameters influencing the products’ flowrates and compositions. In the separation section, parameters such as the operating pressure, reflux ratio, and number of stages affect the total cost. The utilities selected for condensers and reboilers directly affect the heat exchange area and energy costs. For units arranged between two adjacent columns, such as heat exchangers, pumps, and valves, their expenses are related to the neighboring columns. These columns and auxiliary devices are affected by the feed of the separation section and, thus, the reactor parameters.
In this work, an efficient method is developed to integrate the reaction and separation sections. The reactor temperature (T) and the coke content of the catalyst (CC) will be optimized together with the parameters of all distillation columns, considering the auxiliary devices arranged between two adjacent columns, such as heat exchangers, pumps, and valves. Both the energy cost and capital cost will be considered in the optimization. An MTO process is optimized based on the proposed method.

3. Optimization Model

3.1. Model of Physical Properties

Most of the components involved in the MTO process, such as methanol, ethylene, and propylene, have low polarity. The SRK equations can be used to estimate their P-V-T relations, and are shown in Equations (1)–(4). For mixtures, am and bm, estimated based on the mixing rules shown in Equations (5) and (6), should be used in these equations instead of the a and b of pure components.
p = R T V b a V V + b
a = 0.42748 R 2 T c 2 p c 1 + f ω 1 T r 2
f ω = 0.48 + 1.574 ω 0.176 ω 2
b = 0.08664 R T c p c
a m = i j x i x j a i a j 1 k i , j
b m = i x i b i
where p C is the critical pressure, T C is the critical temperature, ω is the acentric factor, a and b are the relevant parameters, and ki,j is the binary interaction parameter.
The SRK equations can be solved efficiently with the compressibility factor (Z) introduced. Z equals p V R T , and can be identified by solving the unitary cubic equation shown in Equation (7). One or two real solutions exist, and correspond to a single-phase or two-phase fluid, respectively.
f ( Z ) = Z 3 Z 2 + A B B 2 Z A B = 0
where A = a p R 2 T 2 , B = b p R T .
The vapor–liquid equilibrium (VLE) is the basis for the analysis and optimization of distillation. The fugacity of vapor and liquid can be calculated according to Equations (8)–(10).
f i V = f i L
f i V = p y i φ i V
f i L = p x i φ i L
where φ is the fugacity coefficient; p represents the system’s pressure; and y i and x i are the mole fractions of component i in gas and liquid, respectively.
The fugacity coefficient can be obtained according to Equations (11)–(13). The gas–liquid equilibrium constant (K) and relative volatilities (α) are calculated by Equations (14) and (15), respectively.
ln φ i = b i b m Z 1 ln Z B + A B b i b m δ i ln Z + B Z
b i b m = T i c / p i c j x j T j c / p j c
δ i = 2 a i a m j x j a i 1 k i , j
K i = y i x i = φ i L φ i V
α i , j = K i K j = φ i L φ i V φ j V φ j L
Loads of condensers, reboilers, and heat exchangers are calculated according to the enthalpy difference of the involved stream. The enthalpy change at the real condition (∆H) is the sum of that at the ideal value (∆Hid) and deviation value (HR). For each component, ∆Hid could be calculated based on Equation (16) [36], and HR could be calculated by Equations (17) and (18).
Δ H i id = a i + b i T + c i T 2 + d i T 3 + e i T 4 R Δ T
H R = a m T a m T 1 b m ln Z Z + B + R T Z 1
a m T = R 2 0.42748 T i j x i x j 1 k i . j f ω , j a i T j c p j c + f ω , i a j T i c p j c
where a, b, c, d, and e are constants related to component i.

3.2. Model of Distillation

For a distillation column separating the mixture with m components, the material balance is shown by Equations (19) and (20). The minimum number of theoretical stages (Nmin) can be calculated according to the Fenske equation shown in Equation (21). The composition of products can be estimated based on Equation (22). The minimum reflux ratio can be calculated by the Underwood equation, which is shown in Equations (23) and (24) [37].
F = B + D
F z i , F = B i x i , B + D i x i , D
N min = log r l , D 1 r l , D r h , B 1 r h , B log α l , h
x i , D x j , D = α i , j N min x i , B x j , B
i = 1 m α i , j x i , F α i , j θ = 1 q
R min + 1 = i = 1 m α i , j x i , D α i , j θ
where q represents the feed condition, θ is the root of the Underwood equation, and its value lies between the relative volatilities of light and heavy key components.
The actual reflux ratio (R) and the number of theoretical stages (N) can be estimated according to the empirical formulas shown in Equations (25)–(29) [37].
R = R F R min
Y = N N min N + 1 , X = R R min R + 1
Y = 0.2788 1.3154 X + 0.4114 X 0.291 + 0.8268 ln X + 0.902 ln X + 1 X
N r e c N s t r i = B D x h , F x l , F x l , B x h , D 0.206
N = N r e c + N s t r i + 1
where RF is the ratio of R to Rmin, and Nrec and Nstri are the numbers of theoretical stages in rectifying and stripping sections.
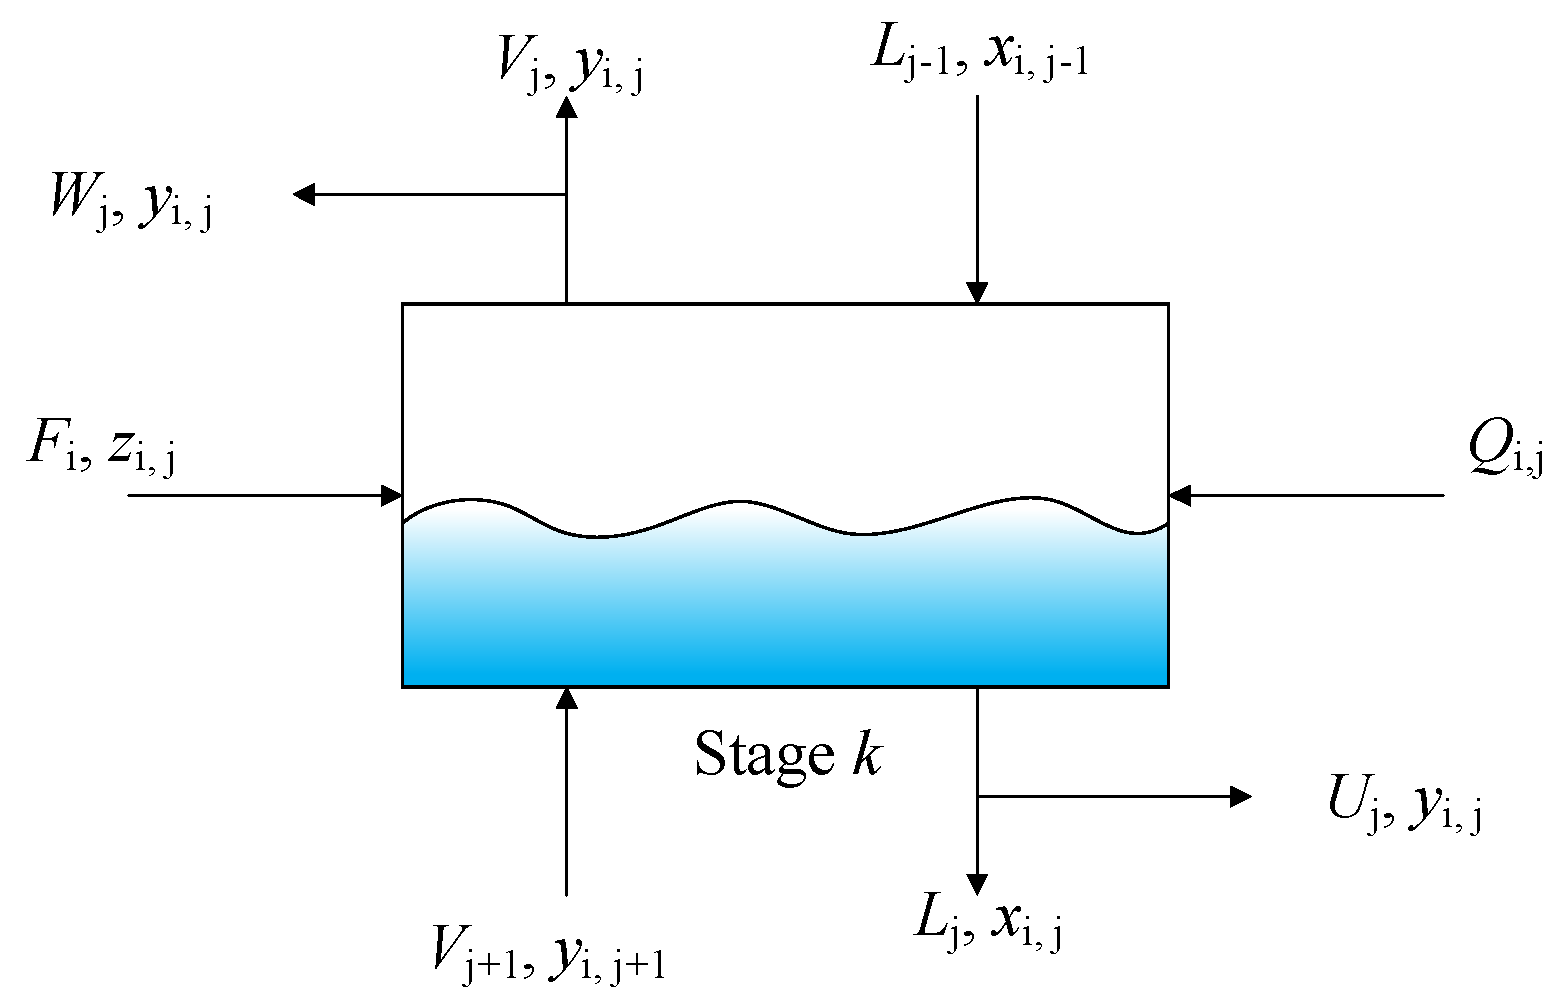
For each theoretical stage shown in Figure 2, the MESH equations shown by Equations (30)–(33) can be used to describe its material balances, equilibrium relationships, summation of compositions, and enthalpy balances [37].
0 = V j + 1 y i , j + 1 + L j 1 x i , j 1 + F j z i , j V j + V j i , j L j + L j x i , j
0 = y i , j K i , j x i , j
0 = i = 1 m y i , j 1 , 0 = i = 1 m x i , j 1
0 = V j + 1 H j + 1 V + L j 1 H j 1 L + F j H j F V j + V j H j V L j + L j H j V Q j
where V and L are the flowrates (kmol∙h−1) of vapor and liquid through the plates; V and L are the flowrates (kmol∙h−1) of vapor and liquid leaving the column; subscript i and j are component and theoretical stage, respectively; the first stage is the condenser; and the last stage is the reboiler. H and Q are enthalpy (kW) and heat load (kW), respectively.

3.3. Models of Optimization

3.3.1. Evaluation of Distillation Columns

In this work, the total annual cost (TAC), which includes the operating cost (Cope) and the capital cost (Ccap), is used to evaluate the columns. The operating cost consists of steam, cooling water, electricity, etc. The capital cost mainly includes that of the columns and heat exchangers, while the costs of the other units are much lower and only change slightly during the optimization; hence, they are neglected. The TAC is calculated by Equation (34).
T A C = C ope + C cap P B P
where PBP is the payback period, and the operating cost is determined by the total energy consumption (Ci) and the utility price (Qi). Cope is calculated by Equation (35).
C ope = A O T C i Q i
Ccap includes the expenses of shells (Cshell) and plates (Cplate), and can be estimated by Equations (36)–(40) [38].
C shell = 17640 D c 1.066 H c 0.802
C plate = 229 D c 1.55 N η
D c = 4 π v D R + 1 22.4 T D 273 1 P 1 3600 0.5
v = 0.761 1 P 0.5
H c = 0.61 N η + 4.27
where Dc is the diameter of column (m); Hc is the height of column (m); ν is the vapor velocity (m∙s−1); TD is the top temperature (K); P is the operating pressure (atm); N is the number of theoretical stages; and η is the Murphree’s plate efficiency.
The capital costs of heat exchangers (Chex), including condensers and reboilers, are estimated based on the heat exchange area, as shown in Equations (41) and (42).
C hex = 7269 A 0.65
A r e a = Q U L M T D
where Area represents the heat exchange area (m2), and LMTD is the logarithmic mean temperature difference, which can be calculated by Equations (43)–(45). U is the overall coefficient of heat transfer (kW∙°C−1∙m−2), and its value depends on the properties of both hot and cold streams. The heat transfer coefficients for different media are shown in Table 1.
L M T D = Δ T 1 Δ T 2 Δ T 1 + Δ T 2 / 2 1 3
Δ T 1 = T H , out T C , in
Δ T 2 = T H , in T C , out
where ∆T1 and ∆T2 are the temperature differences at the cold and hot ends; TH,in and TH,out are the inlet and outlet temperatures of the hot stream; and TC,in and TC,out are the inlet and outlet temperatures of the cold stream.

3.3.2. Optimization of Distillation Columns

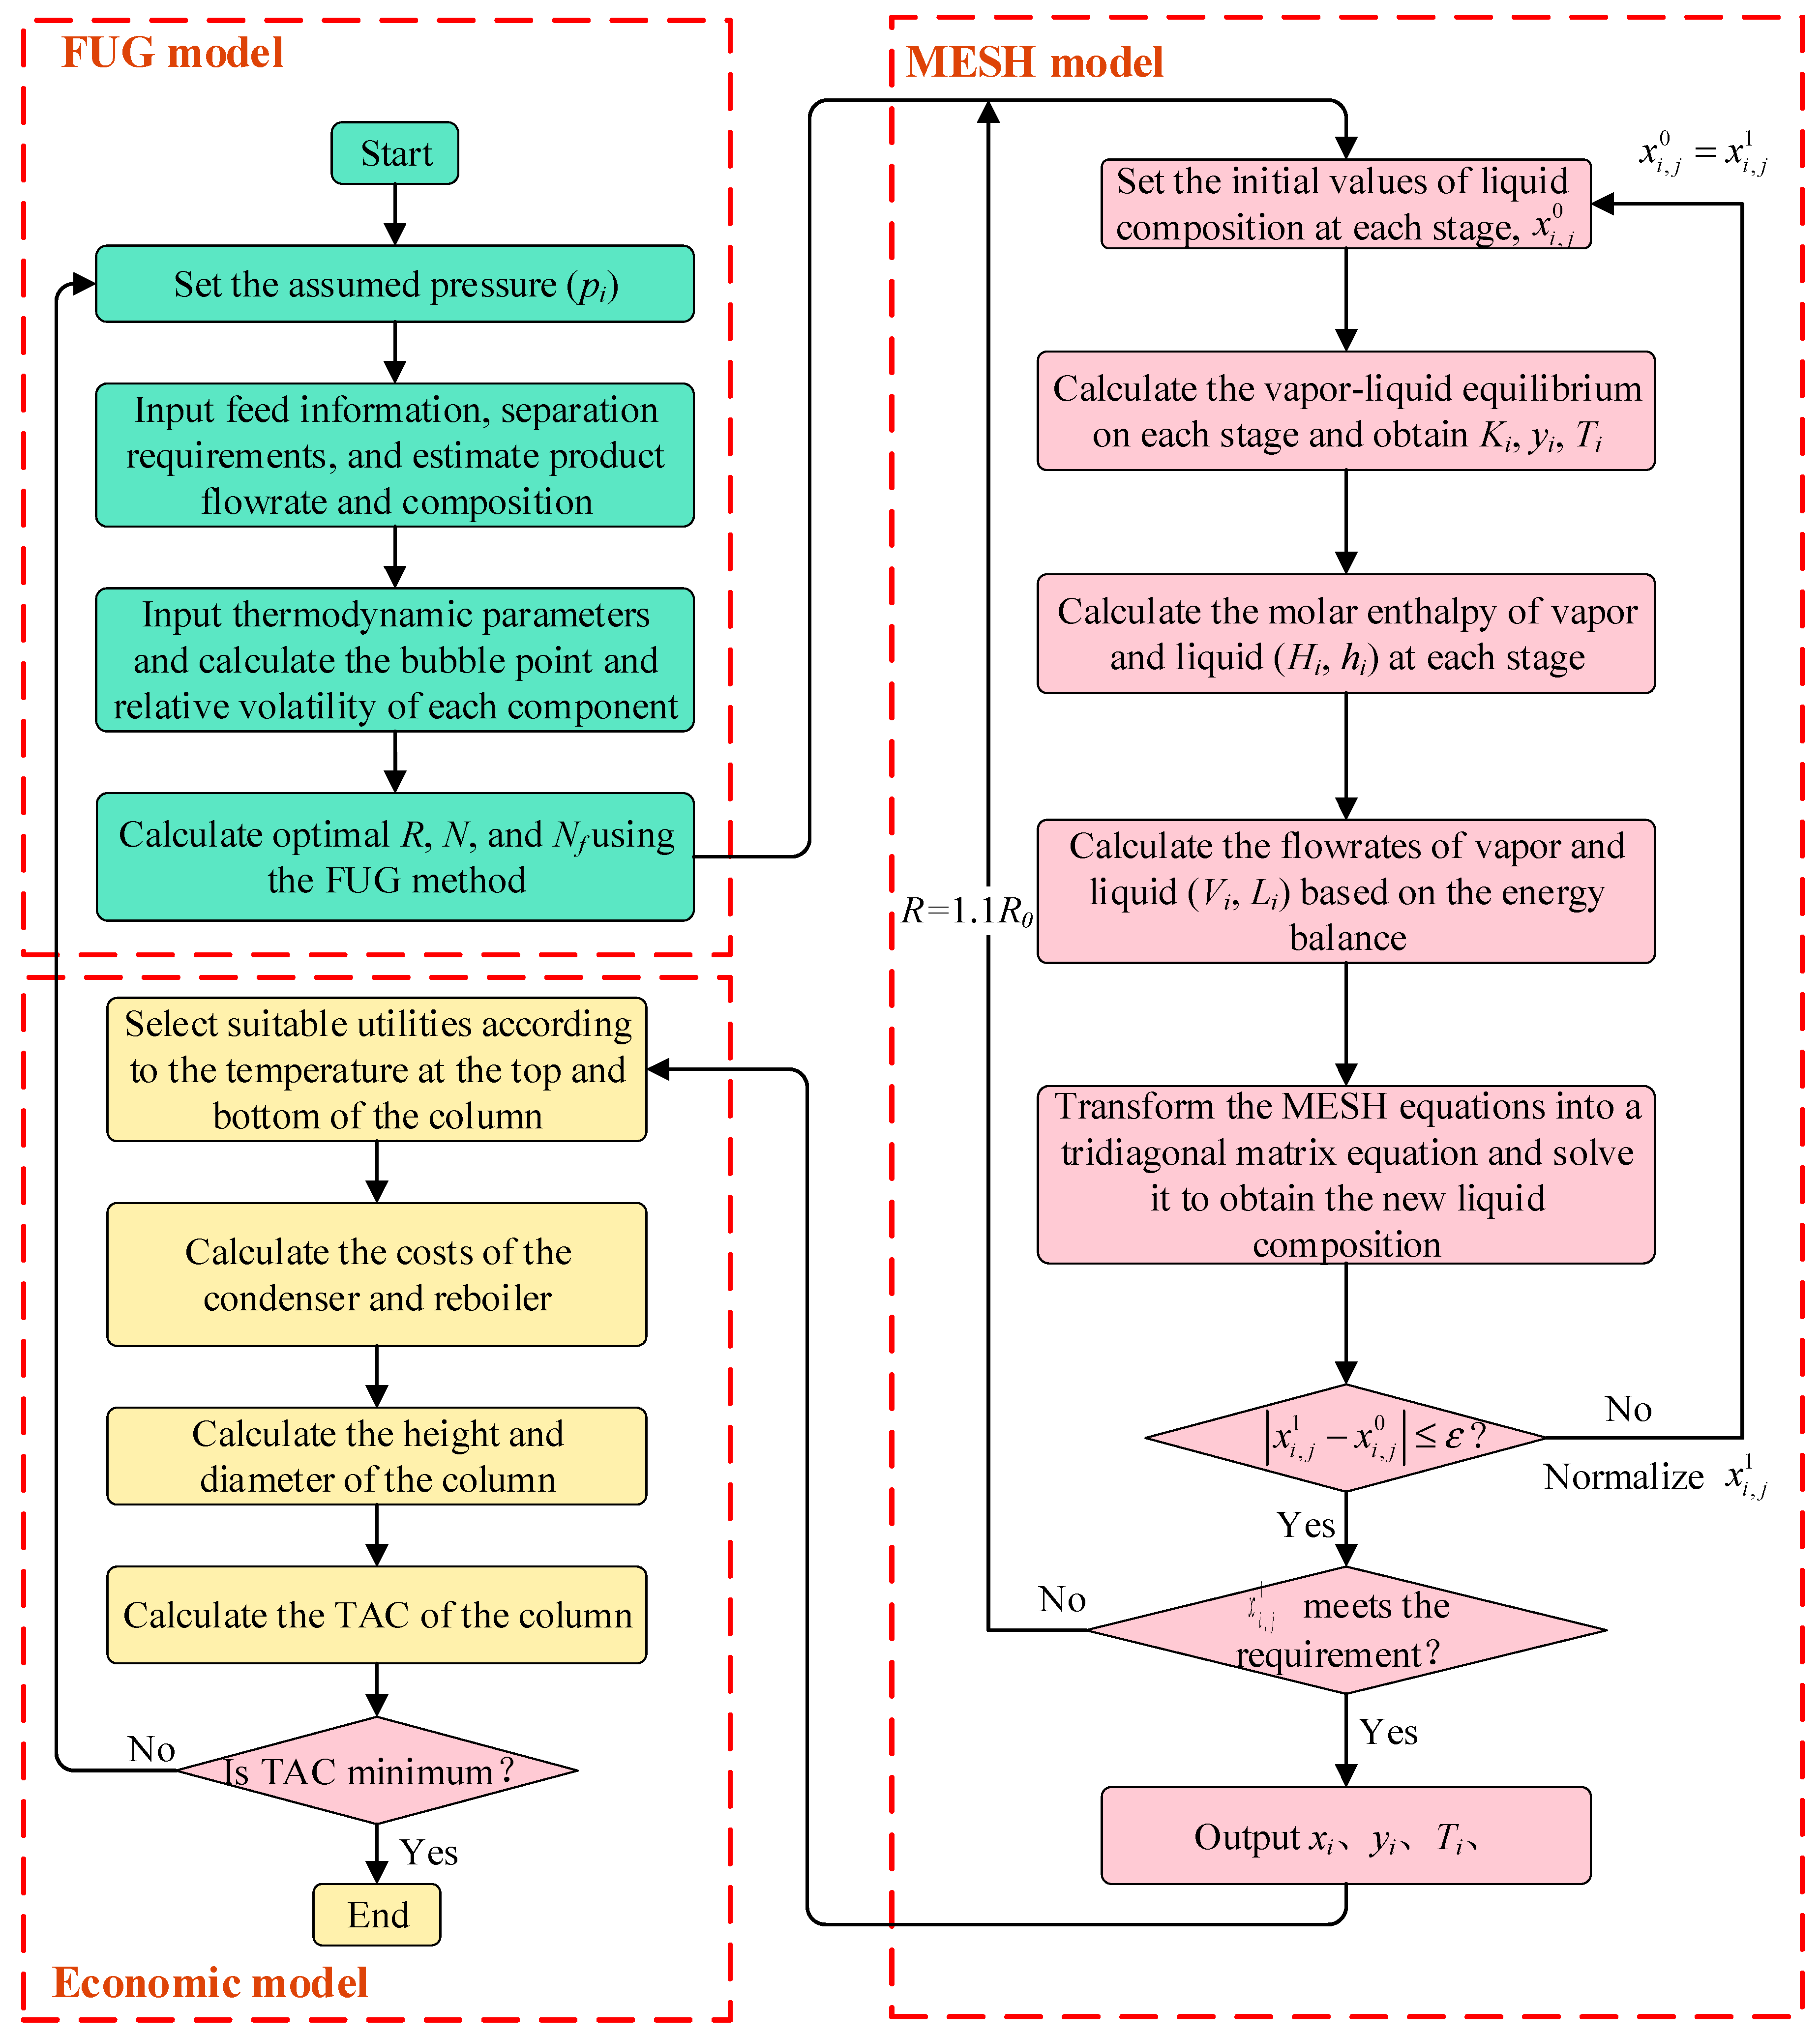
For distillation columns, their performance and energy consumption are affected by the number of stages (N), reflux ratio (R), pressure (p), feed location (Nf), etc. These parameters can be optimized simultaneously based on a rigorous model. However, the optimization is a complex MINLP problem; its solving is difficult and time-consuming. Sometimes, infeasible solutions might be obtained, especially for the simultaneous optimizations of multiple columns. Both shortcut and rigorous models are applied in this work to increase the efficiency and accuracy of the optimization. The operating pressure of each column is optimized, and the detailed optimization steps are shown in Figure 3.
In this procedure, the relative volatilities are calculated by SRK equations, and the shortcut model is applied to estimate N, R, and Nf. The rigorous model is used to obtain the detailed parameters of the column. The combination of shortcut and rigorous models is an integrated consideration of the calculation speed and accuracy, and it has advantages over using either method alone. The TAC of the column is estimated based on the equations introduced in Section 3.3.1. In the procedure, the appropriate heating and cooling utilities are selected automatically based on the limitation of the minimum temperature difference between the cold and hot streams. The utilities are divided into different grades according to their prices. For streams that need to be cooled or heated, inexpensive utilities are preferred. They are selected according to the temperatures of the streams as well as the temperature differences between the streams and utilities. When the operating pressure of each column is set, the TAC of the entire separation section can be calculated, and the optimal operating pressures corresponding to the minimum TAC can be targeted based on the genetic algorithm.

3.3.3. Optimization of Reaction—Distillation System

In the optimization of the reaction–distillation system, the influences of reactor and distillation parameters on the flowrates and compositions of products are considered, as well as the TAC of the columns and other devices. The seven-lumped kinetic model proposed by Ying [11] is used to predict the reactor performance and the influence of reactor parameters. The lumped components are CH4, C2H4, C3H6, C3H8, C4, C5, and coke. The lumped component CH4 contains a small amount of H2, CO, and CO2; the lumped component C5 contains some ethane. The formation rate of seven lumped components is shown in Equation (46) [11]. Water is generated simultaneously, and its formation rate is shown in Equation (47).
r i = ν i k i θ W ϕ i C MeOH M i
r H 2 O = i = 1 7 k i θ W C MeOH M H 2 O
where i (i = 1, 2, …, 7) refers to the lumped components, which are CH4, C2H4, C3H6, C3H8, C4, C5, and coke, respectively. ri (ggcat−1∙min−1) represents the formation rate of component i. νi is the stoichiometric number, and their values are 1, 1/2, 1/3, 1/3, 1/4, 1/5, and 1, respectively. ki is the kinetic constant of component i, as shown in Equation (48). θW is the parameter describing the influence of water. ϕi is a parameter reflecting the catalyst deactivation, as shown in Equation (52). CMeOH is the concentration of methanol (mol∙L−1), and Mi is the molecular weight of component i.
k i = k i 0 exp E a , i R 1 T 1 723.5
ϕ i = 1 1 + A exp B 100 C C D exp 100 β i C C
where ki0 is the kinetic constant in the reference state; Ea,i is the activation energy. A, B, D, and βi are empirical values and can be found in Ying’s work [11]. CC is the coke content of the catalyst.
In the actual MTO processes developed by DICP, the conversion of methanol is greater than 99% [5], and is taken as 1 in this study to simplify the optimization. The reaction products consist of hydrocarbons, coke, and water. According to the reaction rate of methanol, the mole fractions (zmole,i) of the lumped components are shown in Equation (50). The total flowrate of the seven lumped components (Fr, kmol∙h−1) can be identified based on Equation (51). The coke is removed after leaving the reactor; the mole fraction (zi) and flowrate (F, kmol∙h−1) of the stream inlet into the separation section are calculated by Equations (52) and (53).
z m o l e , i = r i / M i i = 1 7 r i / M i = ν i k i ϕ i i = 1 7 ν i k i ϕ i
F r = F 0 i = 1 7 z m o l e , i ν i
z i = r i / M i i = 1 6 r i / M i = ν i k i ϕ i i = 1 6 ν i k i ϕ i
F = F r i = 1 6 z m o l e , i
The yield of component i (Yi) equals the flowrate of i (g∙s−1) in the products when unit methanol (1 g∙s−1) is consumed. As methanol converts at a rate of nearly 100%, the consumption rate of methanol equals the sum of the lumped components and water. Yi is calculated by Equation (54).
Y i = r i i = 1 7 r i + r H 2 O = ν i k i ϕ i M i i = 1 7 k i ϕ i ν i M i + M H 2 O
The reaction temperature (T) and coke content of the catalyst (CC) influence the distillation system. T can be controlled by adjusting the flowrates of utilities. CC can be controlled by adjusting the temperature or flowrate of the gas inlet into the regenerator.
In the separation section, multiple distillation columns interact with each other. Some auxiliary devices, such as heat exchangers, pumps, and valves, are used to guarantee the feed conditions in order to satisfy the requirement. These units are related to two adjacent columns, and will be selected automatically in the optimization. For example, when both the pressure and temperature of the downstream column are higher than those of the upstream one, a pump and heater should be used to pressurize and preheat the stream connecting these two columns. On the contrary, the valve and cooler should also be placed.
The TAC of these auxiliary devices is calculated based on the following simplifications: (1) the feed of each column is saturated liquid; (2) the temperature of the stream is unchanged when passing through pumps or valves; (3) the heat load of these units equals the enthalpy changes of the related streams. The electricity consumed by the pump is calculated by Equation (55).
W e = F feed A O T H feed , 2 H feed , 1 3600 η pump
where We is the annual electricity consumption (kWh); Ffeed is the feed flowrate (kmol·h−1); AOT is the annual operating time (h); Hfeed is the enthalpy of feed; subscripts 1 and 2 are the inlet and outlet streams, respectively; and ηpump is the efficiency of the pump.
In the MTO process, the expected products are ethylene and propylene, and the byproducts are other hydrocarbons and coke. The total yield of ethylene and propylene is usually maximized in the practical plant. However, different processes might have different ethylene-to-propylene ratios and energy consumption. Maximizing the total yield of ethylene and propylene cannot guarantee that the minimum TAC will be achieved. The total yield of the target products and the TAC should be considered simultaneously in order to optimize the MTO processes. In this work, the models of reaction and distillation sections are integrated to optimize the reaction and distillation sections. The object is to maximize the profit calculated by Equation (56). In this equation, the capital and energy costs of the reaction section are not considered, as they change slightly according to the coke content and are not affected by the pressure of distillation columns.
P = P sale T A C P material P other
where P represents the annual profit (USD/year); Psale is the revenue of target products (USD/year); TAC is the total annual cost of the distillation section; Pmaterial is the cost of methanol (USD/year); and Pother is the total cost of others, which has little influence on the system and is taken unchanged.
The primary optimization steps are listed below:
(1)
Calculate the flowrate and composition of the products.
(2)
Estimate the flowrates and compositions of the feed and product according to the separation requirements and mass conservation.
(3)
Optimize columns according to the steps mentioned in Section 3.3.2, and target optimal parameters and utilities.
(4)
Select the units between adjacent columns and calculate their TACs.
(5)
Calculate the profit of the MTO process.
The genetic algorithm can optimize the operating pressures and reaction parameters until the profit is at its maximum.
Based on this procedure, the reaction and separation sections can be integrated, considering the market prices of products, the allocation of utilities, the total cost of the distillation system, and auxiliary devices together, and the profit can be maximized.

4. Case Study

4.1. Optimization of Distillation Columns

In this section, the distillation columns shown in Figure 1 are optimized based on the shortcut and rigorous models in terms of minimizing the TAC. In the reactor model, T and CC were taken as 490 °C and 7.0%, respectively. The lumped component C5 consisted of equimolar n-butene and ethane; the lumped component C4 was taken as i-butylene. The reactor effluent was sent to the distillation system after the coke and water were removed; its flowrate was 2456.1 kmol∙h−1, and the composition is shown in Table 2. The parameters of each lumped component are listed in Appendix A, including binary interaction parameters, critical temperature, critical pressure, Pitzer eccentricity factor, Antoine constants, and correlation parameters of enthalpy.
In the optimization, the payback period (PBP) was set as three years, the total production time (AOT) was 8000 h per year, and the prices of utilities are listed in Table 3. When selecting the utilities, the minimum temperature difference between the cold and hot streams was set as 5 °C.
C ope = A O T C i Q i
The dethanizer (T1201) was selected to verify the accuracy of the distillation model mentioned in Section 3. The operating pressure was initially set as 2800 kPa. The calculation began with the shortcut model shown by Equations (19)–(24), and the minimum reflux ratio and the number of theoretical stages were identified to be 0.48 and 22.8, respectively. Based on Equations (25)–(29), the operational reflux ratio (R), the number of theoretical stages (N), and the feed stage were identified to be 0.57, 60, and 22, respectively. With these parameters taken as the initial values, each stage’s liquid composition (xi,j) was identified according to the steps listed in Figure 3. The R, N, and feed stages of T1201 were determined to be 0.74, 60, and 22, and other detailed parameters were obtained. The selected heating and cooling utilities were quench water and propylene refrigerant (−50 °C), respectively. The TAC was USD 2.797 × 10⁶, and the total capital and annual operating costs were USD 1.135 × 10⁶ and USD 2.418 × 10⁶, respectively.
Matlab 2020b software was used to perform the calculation, and the results were obtained in 4 s (Computer configuration: Windows 10 64-bit operating system; Intel(R) Core (TM) I5-7500 CPU @ 3.40GHz). The obtained distillation parameters were input into Aspen Plus software and simulated based on the Radfrac module. The errors between the simulation results and those obtained by the proposed method were less than 6%, as shown in Table 4. Thus, the results identified by the proposed method are accurate.
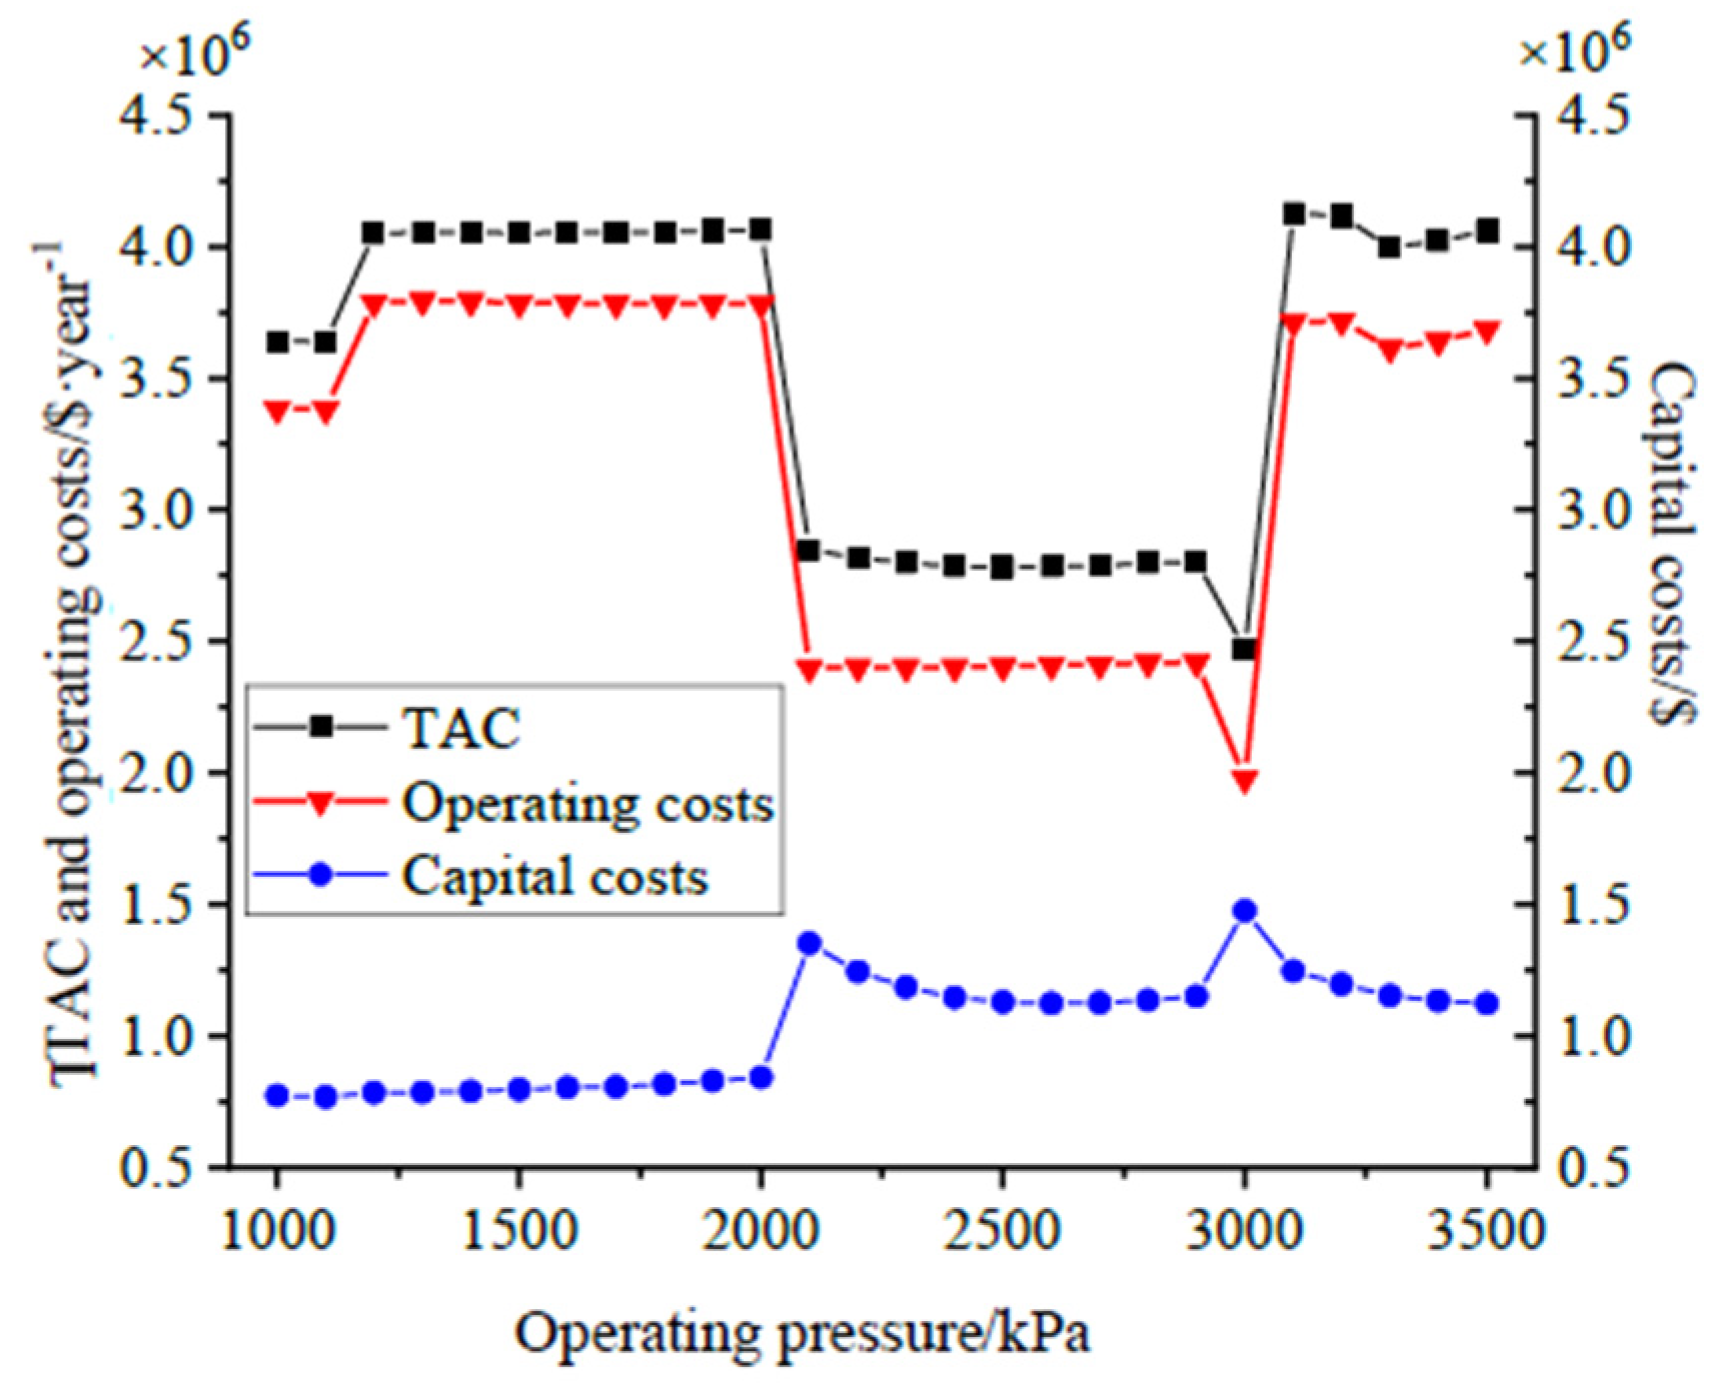
The detailed parameters and cost changed along with the operating pressure. The parameters and costs of the separation section were optimized at different pressures, and the dethanizer’s minimum cost is shown in Figure 4.
Due to the changes of utilities according to the operating pressure of columns, there were sharp changes in the curves corresponding to TAC, operating cost, and capital cost. In Figure 4, there are two sharp changes with a large margin. One lies in the pressure interval of 2000 kPa~2100 kPa, and the other corresponds to the pressure of 3000 kPa. When the pressure was lower than 2000 kPa, the top temperature of the dethanizer was lower than −46.4 °C, and in this case, the cooling utility of the condenser should be ethylene (liquid, −101 °C). Otherwise, the heat transfer temperature difference was lower than the minimum value (5 °C). When the pressure was increased to 2100 kPa, the top temperature rose to −44.4 °C, and in this scenario, the cooling utility can be replaced by propylene (liquid, −50 °C), which is cheaper and leads to lower energy costs. At the same time, the heat transfer area increases, leading to higher capital costs. When the pressure was 2900 kPa, the top and bottom temperatures were −30.2 °C and 76.6 °C, and the cooling and heating utilities in this case should be propylene (−50 °C) and quench water, respectively. When the pressure rose to 3000 kPa, the top temperature reaches −28.6 °C, and the cheaper propylene refrigerant (−35 °C) can be selected in this case. Correspondingly, the annual operating cost was reduced, and the capital cost was increased. When the pressure rose to 3100 kPa, the bottom temperature rose to 80.4 °C, and since quenched water cannot be used as a heating utility, the more expensive LP-steam should be used here. Hence, the annual operating cost increased, and the capital cost decreased. The changes in the heating and cooling utilities in different pressure ranges are shown in Table 5.
For other columns of the distillation section, the changes in the costs along with the operating pressures are shown in Figure 5.
According to Figure 4 and Figure 5, the optimal operating pressures of the five columns could be identified based on the models introduced in Section 3. In the optimization, not only the column parameters (such as operating pressures, reflux ratio, the number of stages) were considered, but also the selection of utilities for the condensers and reboilers. The optimal results are listed in Table 6. With these columns optimized, the TAC of the separation section (including the units between the columns) was 1.27 × 10⁷ USD/year, and the profit of the process was 5.47 × 10⁷ USD/year.

4.2. Optimization for Reaction–Distillation System

The reaction and separation systems are optimized simultaneously to maximize the profit and target the corresponding parameters. The decision variables are reaction temperature (T), coke content of catalyst (CC), and the operating pressures of the dethanizer (p1), demethanizer (p2), ethylene column (p3), depropanizer (p4), and propylene column (p5). The reactor temperature and coke content should satisfy 450 °C ≤ T ≤ 550 °C, 3% ≤ CC ≤ 7.8%. Otherwise, the formation rates of main products will decrease. The operating pressure constraints are selected according to the actual MTO process: 800 kPa ≤ p1 ≤ 3500 kPa, 2700 kPa ≤ p2 ≤ 3500 kPa, 800 kPa ≤ p3 ≤ 3500 kPa, 800 kPa ≤ p4 ≤ 2500 kPa, and 800 kPa ≤ p5 ≤ 2500 kPa. The prices of the products are taken as the average values in the past year in China, which are 1227 USD/t for ethylene and 1242 USD/t for propylene, respectively. The price of methanol is the production cost from coal to methanol, 343 USD/t.
The influences of the two reaction parameters on the reaction–separation system were studied. With the reactor temperature taken as 450 °C, 470 °C, 490 °C, 510 °C, 530 °C, and 550 °C, and with CC taken as 0.03, 0.04, 0.05, 0.07, and 0.078, respectively, the reaction–separation system’s profit and the minimum TACs of separation section were obtained, and are shown in Figure 6.
Figure 6 shows that the profit is negative when T is lower than 450 °C, and CC is less than 3%. With the increment of T, the profit of the MTO process increases at first and then decreases. The maximum profit is achieved when T lies between 490 °C and 510 °C. In addition, with the increment of T and CC, the minimum TAC of the separation section has an increasing trend overall, although it may fluctuate locally. This is because the minimum TAC of the separation section is significantly affected by the distillation parameters, some of which are discontinuous variables, such as the number of stages, feed position, and utilities.
At different reaction conditions (T and CC), the optimal operating pressures are different, and these are listed in Appendix B. These data show that the optimal pressures change slightly and remain within a certain range at different reaction conditions: 2540 kPa ≤ p1 ≤ 3127 kPa, 2759 kPa ≤ p2 ≤ 3303 kPa, 2972 kPa ≤ p3 ≤ 3345 kPa, 893 kPa ≤ p4 ≤ 1146 kPa, and 1763 kPa ≤ p5 ≤ 2113 kPa.
In order to obtain the optimum reaction and distillation parameters more accurately, a genetic algorithm was used to optimize the reaction–distillation system. The genetic algorithm was configured as follows: fitness function—Equation (54); max iterations—40; mutation—0.2; crossover fraction—0.8. Matlab® was used to solve the problem, and the total calculating time was 5 h. The optimal reaction temperature and catalyst’s coke content were identified to be 496 °C and 7.8%, respectively. The maximum profit was 6.28 × 10⁷ USD/year, 15.3% greater than that identified in Section 4.1; the minimum TAC of the separation section was 1.29 × 10⁷ USD/year (including the costs of the units lying between the columns), 3.73% less than that identified in Section 4.1. Other optimal parameters are listed in Table 7.
Comparing the optimization results of the reaction–distillation system with those obtained in Section 4.1, it is evident that simultaneous optimization of the reaction and separation sections can result in a better outcome.

5. Conclusions

For the reaction and separation sections of the MTO process, a framework was developed for the simultaneous design and optimization of the reaction and distillation sections. Multiple parameters were able to be optimized simultaneously to target the minimum TAC and maximum profit. With the shortcut and rigorous distillation models combined, the separation section could be analyzed and optimized efficiently, with detailed column parameters identified, utilities selected, and the TAC minimized. The integration of the reaction and separation sections could consider the reactor parameters, the market prices of products, and the total cost of the distillation system and auxiliary devices together, and thus maximize the profit. For the studied MTO process, the reactor temperature and catalyst’s coke content were optimized, together with the column pressure and each column’s utility, using a genetic algorithm. Their optimal values were 496 °C and 7.8%, respectively. The maximum profit was 6.24 × 10⁷ USD/year, 15.3% greater than that identified with only the separation section optimized, and the minimum TAC of the separation section was 3.73% less.

Author Contributions

Conceptualization, N.L. and H.S.; methodology, N.L. and L.Z.; validation, D.L. and H.S.; writing—original draft preparation, N.L.; writing—review and editing, L.Z. and D.Z.; visualization, L.Z. and D.L.; project administration, D.Z. and G.L.; funding acquisition, G.L. All authors have read and agreed to the published version of the manuscript.

Funding

This research was funded by the National Natural Science Foundation of China (22078259 and 21736008).

Data Availability Statement

Not applicable.

Conflicts of Interest

The authors declare no conflict of interest.

Nomenclature

a, bthe relevant parameters of the component
am, bmthe relevant parameters of the mixture
Areathe heat exchange area (m2)
AOTthe annual operating time (h)
CCcoke content of the catalyst
Ccapcapital cost (USD/year)
Chexcapital costs of heat exchanger (USD/year)
Citotal energy consumption (kW)
CMeOHthe concentration of methanol (mol∙L−1)
Copeoperating cost (USD/year)
Cplatethe expenses of plates (USD/year)
Cshellthe expenses of shell (USD/year)
Dcthe diameter of column (m)
Ea,Ithe activation energy (J∙mol−1)
f L fugacity of liquid
f i V fugacity of vapor
Fflowrate of the stream inlet into the separation section (kmol∙h−1)
Ffeedthe feed flowrate (kmol·h−1)
Frtotal flowrate of the seven lumped components (kmol∙h−1)
Henthalpy (kW)
HRdeviation value of enthalpy (kW)
Hcthe height of column (m)
Hfeedthe enthalpy of feed
kithe kinetic constant of component i
ki0kinetic constant at the reference state
ki,jbinary interaction parameter
Kgas–liquid equilibrium constant
Lflowrate of liquid through the plate, kmol∙h−1
L flowrate of liquid leaving the column, kmol∙h−1
LMTDthe logarithmic mean temperature difference, K
Mithe molar mass of component i
Nthe number of theoretical stages
ppressure (kPa)
Prepresents the annual profit (USD/year)
Pmaterialthe cost of methanol (USD/year)
Psalethe revenue of target products (USD/year)
PBPthe payback period (year)
qfeed condition
Qheat load (kW)
Qithe utility price (USD∙GJ−1)
rithe formation rate of component I (ggcat−1∙min−1)
Rreflux ratio
RFthe ratio of R to Rmin
Ttemperature (K)
TDtop temperature (K)
TACthe total annual cost of the distillation section (USD/year)
Uthe overall coefficient of heat transfer (kW∙°C−1∙m−2),
νIthe stoichiometric number
Vflowrate of vapor through the plate, kmol∙h−1
V flowrate of vapor leaving the column, kmol∙h−1
Wethe annual electricity consumption (kWh)
y i ,   x i the mole fractions of component i in gas and liquid, respectively.
Yiyield of component i
zithe mole fractions of the stream inlet into the separation section
Zcompressibility factor
αrelative volatility
Henthalpy change (kW)
T1temperature difference at the hot end (K)
T2temperature difference at the cold end (K)
ηMurphree plate efficiency
ηpumppump’s efficiency
θthe root of the Underwood equation
θWparameter describing the influence of water content in the feed
νthe vapor velocity in the column (m∙s−1)
φthe fugacity coefficient
ϕiparameter reflecting the catalyst deactivation
ωthe acentric factor
Subscripts
ccritical state
Ccold stream
Hhot stream
icomponent
ininlet stream
jtheoretical stage
outoutlet stream
recrectifying section
stristripping section
Superscript
idideal state

Appendix A

Table A1. Binary interaction parameters.
CH4C2H4C2H6C3H6C3H8i-C4H8n-C5H10
CH400.010.010.0210.0230.02750.041
C2H40.01000.0030.00310.0040.006
C2H60.01000.0030.00310.0040.006
C3H60.0210.0030.003000.0030.0045
C3H80.0230.00310.0031000.0030.0045
i-C4H80.02750.0040.0040.0030.00300.0008
n-C5H100.0410.0060.0060.00450.00450.0080
Table A2. Thermodynamic parameters of each component.
ParametersCH4C2H4C2H6C3H6C3H8i-C4H8n-C5H10
Tc/K190.56282.34305.32364.90369.83407.85469.70
pc/bar45.9950.4148.7246.0042.4836.4033.70
ω0.0110.0870.0990.1420.1520.1860.252
A5.9646.4026.1076.6516.8096.2745.969
B438.5800.9720.81186134810951044
C−0.939414.04−8.92432.0053.76−9.441−39.70
H0/kJ∙kmol−1−75,40251,461−85,11018,650−106,481−137,353−149,685
a4.5684.2214.1783.8343.8473.3517.554
b × 103−8.975−8.782−4.2273.8935.13117.883−0.368
c × 1053.6315.7955.6604.6886.0115.47711.85
d × 108−3.047−6.729−6.651−6.013−7.893−8.009−14.94
e × 10111.0912.5112.4872.2833.0793.2435.753

Appendix B

Table A3. Detailed results at different T and CC values.
TCCProfit
(107$/Year)
Min TAC
(107$/Year)
p1 (kPa)p2 (kPa)p3 (kPa)p4 (kPa)p5 (kPa)
4503.0%−0.561.182540284133459161973
4703.0%0.071.2026002896305111201796
4903.0%0.521.1828282890303311091855
5103.0%0.821.192888287930239981763
5303.0%0.931.232832313930909811814
5503.0%0.921.2327802840309410361790
4504.0%0.881.1925922768311610561866
4704.0%1.471.212841283530539981856
4904.0%1.901.2028662894297210171827
5104.0%2.151.2129843072319110181839
5304.0%2.211.2529673040320110932013
5504.0%2.121.263069316932149931778
4505.0%2.221.2125522941325711291835
4705.0%2.791.2227452998303510152011
4905.0%3.161.252871302129788931879
5105.0%3.381.2430073079313111131788
5305.0%3.371.2730563198324610161918
5505.0%3.191.2830613104311710451853
4506.0%3.471.252642275932389011809
4706.0%4.021.252762294730869871903
4906.0%4.361.2430133015315910141808
5106.0%4.501.2630612996314511171787
5306.0%4.401.3029663041303611071769
5506.0%4.111.3530823193318610331844
4507.0%4.671.2526702994304911461886
4707.0%5.161.2628922951317411181814
4907.0%5.441.2730072990307611291793
5107.0%5.451.3228232934297510501865
5307.0%5.301.3230603109314610991831
5507.0%4.891.3530773303334110751924
4507.8%5.551.272827290331279451796
4707.8%6.001.2829603104315010001934
4907.8%6.221.2929703223315011001928
5107.8%6.171.3329392927307510501867
5307.8%5.951.3529872927307410491867
5507.8%5.411.3831273280320011062113

References

  1. Gogate, M.R. Methanol-to-olefins process technology: Current status and future prospects. Pet. Sci. Technol. 2019, 37, 559–565. [Google Scholar] [CrossRef]
  2. Amghizar, I.; Vandewalle, L.A.; Van Geem, K.M.; Marin, G.B. New Trends in Olefin Production. Engineering 2017, 3, 171–178. [Google Scholar] [CrossRef]
  3. Chang, C. The conversion of methanol and other O-compounds to hydrocarbons over zeolite catalysts. J. Catal. 1977, 47, 249–259. [Google Scholar] [CrossRef]
  4. Chen, J.Q.; Bozzano, A.; Glover, B.; Fuglerud, T.; Kvisle, S. Recent advancements in ethylene and propylene production using the UOP/Hydro MTO process. Catal. Today 2005, 106, 103–107. [Google Scholar] [CrossRef]
  5. Tian, P.; Wei, Y.X.; Ye, M.; Liu, Z.M. Methanol to Olefins (MTO): From Fundamentals to Commercialization. ACS Catal. 2015, 5, 1922–1938. [Google Scholar] [CrossRef]
  6. Ye, M.; Tian, P.; Liu, Z. DMTO: A Sustainable Methanol-to-Olefins Technology. Engineering 2021, 7, 17–21. [Google Scholar] [CrossRef]
  7. Yarulina, I.; Chowdhury, A.D.; Meirer, F.; Weckhuysen, B.M.; Gascon, J. Recent trends and fundamental insights in the methanol-to-hydrocarbons process. Nat. Catal. 2018, 1, 398–411. [Google Scholar] [CrossRef]
  8. Mihail, R.; Straja, S.; Maria, G.; Musca, G.; Pop, G. Kinetic model for methanol conversion to olefins. Ind. Eng. Chem. Process Des. Dev. 2002, 22, 532–538. [Google Scholar] [CrossRef]
  9. Fatourehchi, N.; Sohrabi, M.; Royaee, S.J.; Mirarefin, S.M. Preparation of SAPO-34 catalyst and presentation of a kinetic model for methanol to olefin process (MTO). Chem. Eng. Res. Des. 2011, 89, 811–816. [Google Scholar] [CrossRef]
  10. Bos, A.N.R.; Tromp, P.J.J.; Akse, H.N. Conversion of Methanol to Lower Olefins-Kinetic Modeling, Reactor Simulation, and Selection. Ind. Eng. Chem. Res. 1995, 34, 3808–3816. [Google Scholar] [CrossRef]
  11. Ying, L.; Yuan, X.S.; Ye, M.; Cheng, Y.W.; Li, X.; Liu, Z.M. A seven lumped kinetic model for industrial catalyst in DMTO process. Chem. Eng. Res. Des. 2015, 100, 179–191. [Google Scholar] [CrossRef]
  12. Cui, C.T.; Yin, H.; Yang, J.; Wei, D.M.; Sun, J.S.; Guo, C.N. Selecting suitable energy-saving distillation schemes: Making quick decisions. Chem. Eng. Process.-Process Intensif. 2016, 107, 138–150. [Google Scholar] [CrossRef]
  13. Ye, H.T.; Zou, X.; Zhu, W.X.; Yang, Y.; Dong, H.G.; Bi, M.S. Synthesis framework for distillation sequence with sidestream columns: Application in reaction-separation-recycle system. Chem. Eng. Res. Des. 2021, 166, 172–190. [Google Scholar] [CrossRef]
  14. Cui, C.T.; Liu, S.Y.; Sun, J.S. Optimal selection of operating pressure for distillation columns. Chem. Eng. Res. Des. 2018, 137, 291–307. [Google Scholar] [CrossRef]
  15. Gómez-Castro, F.I.; Rico-Ramírez, V.; Segovia-Hernández, J.G.; Hernández-Castro, S.; González-Alatorre, G.; El-Halwagi, M.M. Simplified Methodology for the Design and Optimization of Thermally Coupled Reactive Distillation Systems. Ind. Eng. Chem. Res. 2012, 51, 11717–11730. [Google Scholar] [CrossRef]
  16. Fidkowski, Z.T.; Doherty, M.F.; Malone, M.F. Feasibility of Separations for Distillation of Nonideal Ternary Mixtures. AIChE J. 1993, 39, 1303–1321. [Google Scholar] [CrossRef]
  17. Lucia, A.; Amale, A.; Taylor, R. Distillation pinch points and more. Comput. Chem. Eng. 2008, 32, 1342–1364. [Google Scholar] [CrossRef]
  18. Ramapriya, G.M.; Selvarajah, A.; Cucaita, L.E.J.; Huff, J.; Tawarmalani, M.; Agrawal, R. Short-Cut Methods versus Rigorous Methods for Performance-Evaluation of Distillation Configurations. Ind. Eng. Chem. Res. 2018, 57, 7726–7731. [Google Scholar] [CrossRef]
  19. Kraemer, K.; Kossack, S.; Marquardt, W. Efficient Optimization-Based Design of Distillation Processes for Homogeneous Azeotropic Mixtures. Ind. Eng. Chem. Res. 2009, 48, 6749–6764. [Google Scholar] [CrossRef]
  20. Chen, Y.; Eslick, J.C.; Grossmann, I.E.; Miller, D.C. Simultaneous process optimization and heat integration based on rigorous process simulations. Comput. Chem. Eng. 2015, 81, 180–199. [Google Scholar] [CrossRef] [Green Version]
  21. Viswanathan, J.; Grossmann, I.E. A Combined Penalty-Function and Outer-Approximation Method for Minlp Optimization. Comput. Chem. Eng. 1990, 14, 769–782. [Google Scholar] [CrossRef]
  22. Dowling, A.W.; Biegler, L.T. A framework for efficient large scale equation-oriented flowsheet optimization. Comput. Chem. Eng. 2015, 72, 3–20. [Google Scholar] [CrossRef]
  23. Seidel, T.; Hoffmann, A.; Bortz, M.; Scherrer, A.; Burger, J.; Asprion, N.; Küfer, K.-H.; Hasse, H. A novel approach for infeasible path optimization of distillation-based flowsheets. Chem. Eng. Sci. X 2020, 7, 100063. [Google Scholar] [CrossRef]
  24. Yu, B.Y.; Chien, I.L. Design and Optimization of the Methanol-to-Olefin Process—Part I: Steady-State Design and Optimization. Chem. Eng. Technol. 2016, 39, 2293–2303. [Google Scholar] [CrossRef]
  25. Yu, B.Y.; Chien, I.L. Design and Optimization of the Methanol-to-Olefin Process—Part II: Comparison of Different Methods for Propylene/Propane Separation. Chem. Eng. Technol. 2016, 39, 2304–2311. [Google Scholar] [CrossRef]
  26. Dimian, A.C.; Bildea, C.S. Energy efficient methanol-to-olefins process. Chem. Eng. Res. Des. 2018, 131, 41–54. [Google Scholar] [CrossRef]
  27. Chen, Y.H.; Hsieh, W.; Chang, H.; Ho, C.D. Design and economic analysis of industrial-scale methanol-to-olefins plants. J. Taiwan Inst. Chem. Eng. 2022, 130, 103893. [Google Scholar] [CrossRef]
  28. Yin, C.; Sun, H.; Lv, D.; Liu, G. Integrated design and optimization of reactor-distillation sequence-recycle-heat exchanger network. Energy 2022, 238, 121796. [Google Scholar] [CrossRef]
  29. Hentschel, B.; Peschel, A.; Freund, H.; Sundmacher, K. Simultaneous design of the optimal reaction and process concept for multiphase systems. Chem. Eng. Sci. 2014, 115, 69–87. [Google Scholar] [CrossRef]
  30. Kong, L.X.; Sen, S.M.; Henao, C.A.; Dumesic, J.A.; Maravelias, C.T. A superstructure-based framework for simultaneous process synthesis, heat integration, and utility plant design. Comput. Chem. Eng. 2016, 91, 68–84. [Google Scholar] [CrossRef] [Green Version]
  31. Ryu, J.; Kong, L.X.; de Lima, A.E.P.; Maravelias, C.T. A generalized superstructure-based framework for process synthesis. Comput. Chem. Eng. 2020, 133, 106653. [Google Scholar] [CrossRef]
  32. Trespalacios, F.; Grossmann, I.E. Review of Mixed-Integer Nonlinear and Generalized Disjunctive Programming Methods. Chem. Ing. Tech. 2014, 86, 991–1012. [Google Scholar] [CrossRef]
  33. Su, Y.; Jin, S.M.; Zhang, X.P.; Shen, W.F.; Eden, M.R.; Ren, J.Z. Stakeholder-oriented multi-objective process optimization based on an improved genetic algorithm. Comput. Chem. Eng. 2020, 132, 106618. [Google Scholar] [CrossRef]
  34. Yang, X.L.; Ward, J.D. Extractive Distillation Optimization Using Simulated Annealing and a Process Simulation Automation Server. Ind. Eng. Chem. Res. 2018, 57, 11050–11060. [Google Scholar] [CrossRef]
  35. Qian, X.; Jia, S.K.; Huang, K.J.; Chen, H.S.; Yuan, Y.; Zhang, L. Optimal design of Kaibel dividing wall columns based on improved particle swarm optimization methods. J. Clean. Prod. 2020, 273, 123041. [Google Scholar] [CrossRef]
  36. Frenkel, M.; Kabo, G.J.; Marsh, K.N.; Beganov, G.N.; Wilboit, R.C. Thermodynamics of Organic Component in the Gas State; TRC: College Station, TX, USA, 1994. [Google Scholar]
  37. Smith, R.; Jobson, M. Distillation; Academic Press: Oxford, UK, 2000; pp. 84–103. [Google Scholar] [CrossRef]
  38. Luyben, W.L. Principles and Case Studies of Simultaneous Design; John Wiley & Sons: Hoboken, NJ, USA, 2011. [Google Scholar]
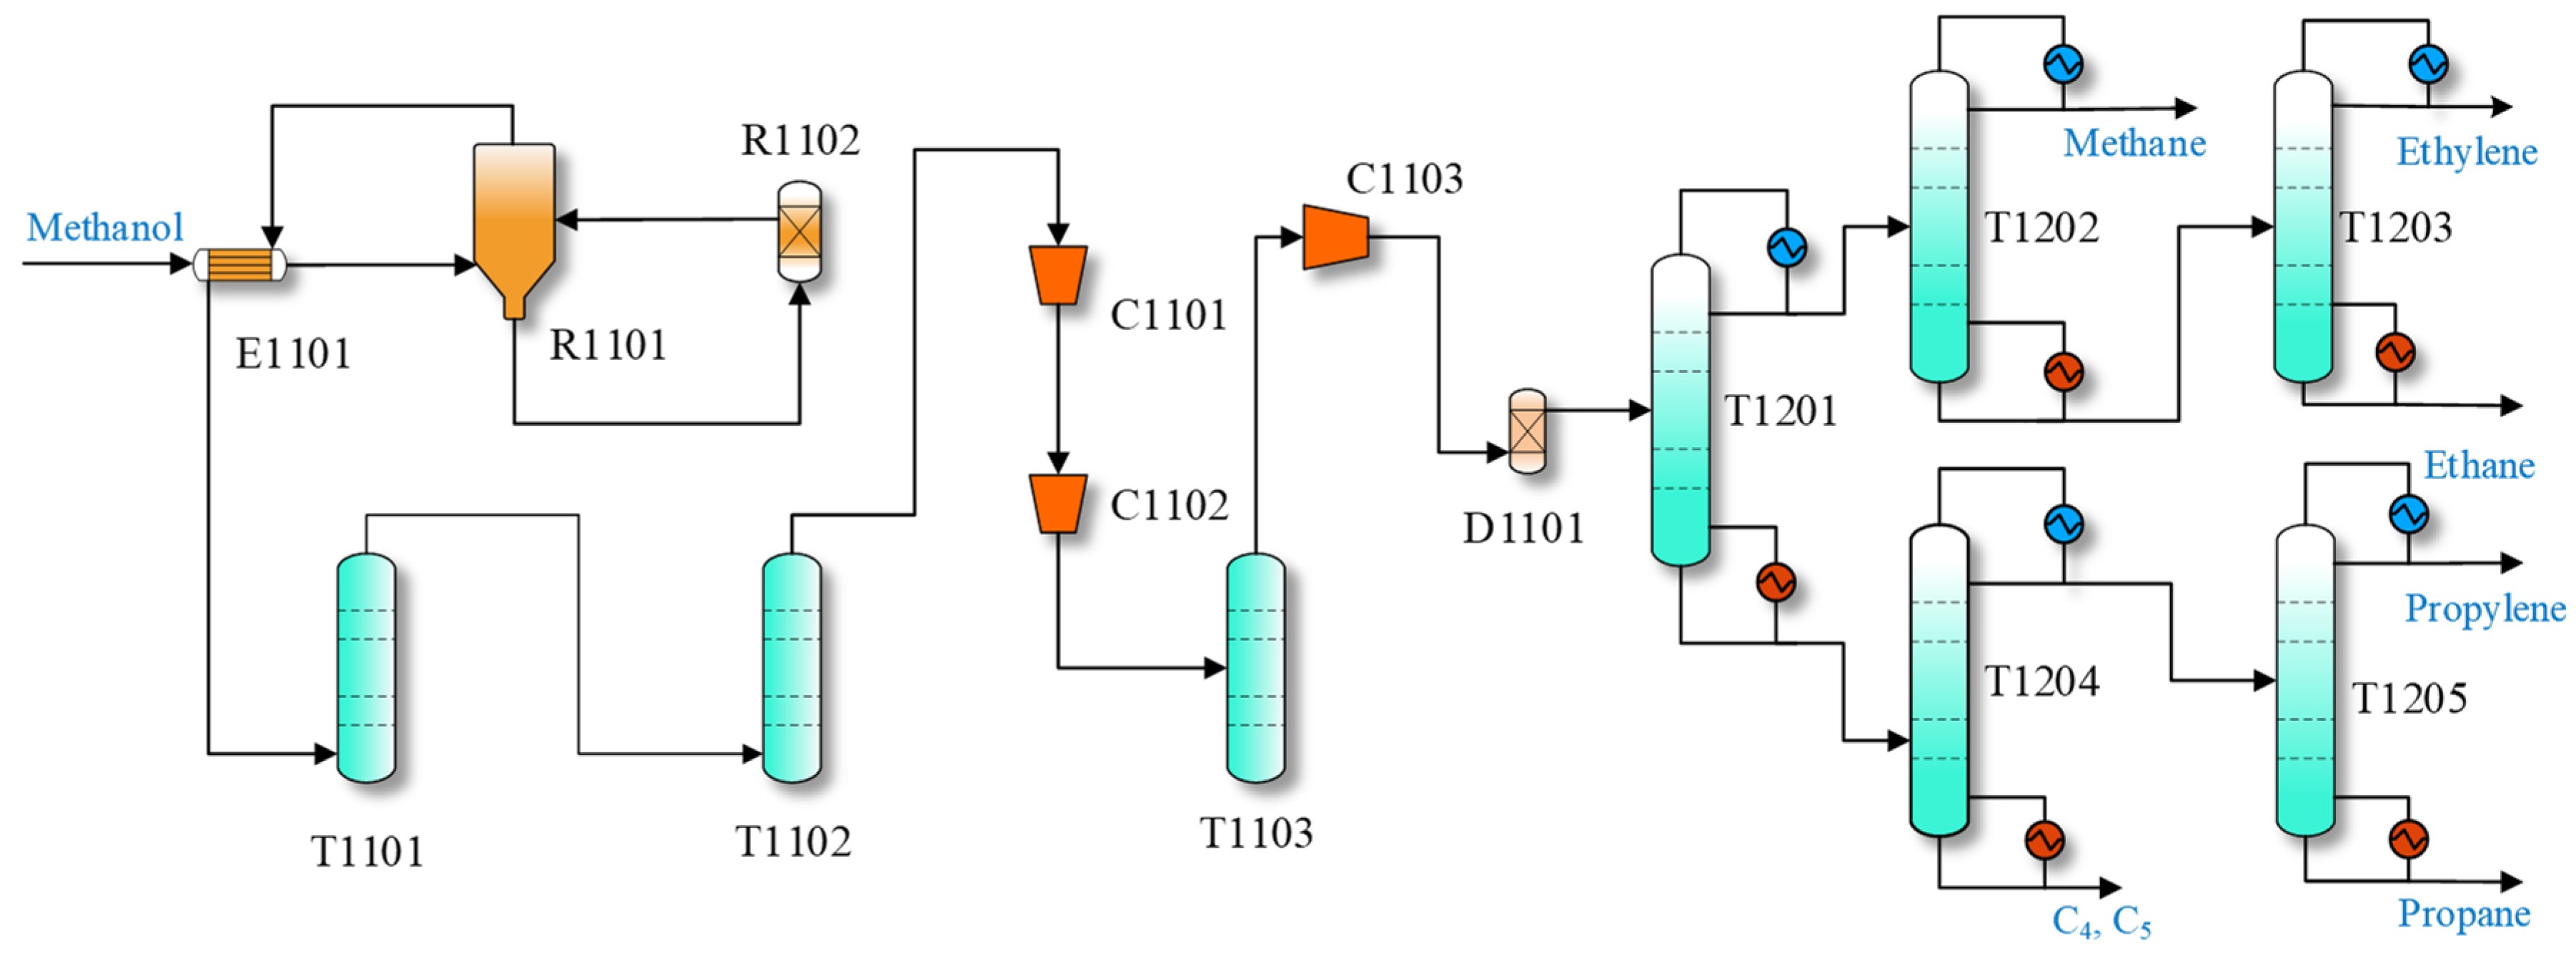
Figure 1. MTO process with front-end dethanizer.
Processes 11 00058 g001
Figure 2. Schematic diagram of the theoretical stage.
Processes 11 00058 g002
Figure 3. Optimization steps of a column.
Processes 11 00058 g003
Figure 4. The costs of the dethanizer at different pressures.
Processes 11 00058 g004
Figure 5. Changes of costs according to the operating pressure: (a) demethanizer; (b) ethylene column; (c) depropanizer; (d) propylene column.
Processes 11 00058 g005
Figure 6. The maximum profit and the minimum TAC at different reaction parameters. (a) Maximum profit of the reaction–separation system (b) Minimum TAC of separation section.
Processes 11 00058 g006
Table 1. Heat transfer coefficients for different mediums.
Types of FluidU (kW∙°C−1∙m−2)
Gas—Gas0.17
Gas—Condensing gas0.28
Gas—Evaporating liquid0.28
Liquid—Liquid0.57
Liquid—Condensing gas0.85
Liquid—Evaporating liquid0.85
Table 2. Feed composition of the separation section.
ComponentsCH4C2H4C2H6C3H6C3H8i-C4H8n-C5H10
Molar fraction0.06850.54600.00800.29430.01700.05830.0080
Table 3. Prices of different utilities.
UtilityInlet
Temperature (°C)
Outlet
Temperature (°C)
AbbreviationPrice ($∙GJ−1)
Refrigerant (Ethylene)−101 (l)−101 (g)RE21
Refrigerant (Propylene)−50 (l)−50 (g)−50 RP13.11
Refrigerant (Propylene)−35 (l)−35 (g)−35 RP10.6
Refrigerant (Propylene)−20 (l)−20 (g)−20 RP8.2
Chilled water515CHW4.43
Cooling water2535CW0.354
Quench water12090QW0.445
LP-steam160 (g)160 (l)LP7.78
Electricity--EL16.8
Table 4. Comparison of results obtained by the proposed methods and rigorous simulation.
Proposed MethodAspen PlusError
Recovery of ethane0.990.95124.1%
Recovery of ethylene0.99990.99990
Recovery of propylene0.9990.99560.3%
Top temperature/°C−31.8−31.3−1.6%
Bottom temperature/°C74.774.9−0.3%
Duty of condenser/kW61296491−5.6%
Duty of reboiler/kW81178621−5.8%
Table 5. The heating and cooling utilities in different pressure ranges.
Pressure/kPa1000~20002100~290030003100~3500
Cooling utilityRE−50 RP−35 RP−35 RP
Heating utilityQWQWQWLP
Table 6. Optimal parameters of columns.
ParametersT1201T1202T1203T1204T1205
Operating pressure/kPa30002800310011001800
Top temperature/°C−28.6−98.3−12.423.343.3
Bottom temperature/°C78.5−15.610.778.653.9
Reflux ratio0.824.914.860.9514.77
Number of stages624614683121
Feed stage2321244452
Duty of condenser/kW6137120614,988587238,533
Duty of reboiler/kW8152157914,975562438,616
Cooling utilities−35 RPRE−20 RPCHWCW
Heating utilitiesQWQWQWQWQW
Capital cost/USD 1061.47391.13953.24791.66325.7811
Operating cost/106 USD/year1.97800.74993.51120.81620.8878
TAC/106 USD/year2.46931.12974.59391.37062.8148
Table 7. Distillation parameters corresponding to the maximum profit.
ParametersDethanizerDemethanizerEthylene
Column
DepropanizerPropylene Column
Operating pressure/kPa30513058316711341934
Top temperature/°C−29.9−95.6−11.524.546.6
Bottom temperature/°C79.2−12.011.779.957.2
Reflux ratio0.764.804.980.9615.4
Number of stages624914984126
Feed stage2321284454
Duty of condenser/kW6342131115,717567837,669
Duty of reboiler/kW8390175015,694545637,749
Cooling utilities−35 RPRE−20 RPCHWCW
Heating utilitiesQWQWQWLPQW
Capital cost/USD 1061.58221.01983.26151.64855.7462
Operating cost/106 USD/year2.04360.81543.68210.78950.8678
TAC/106 USD/year2.57101.15544.76931.33902.7832
Disclaimer/Publisher’s Note: The statements, opinions and data contained in all publications are solely those of the individual author(s) and contributor(s) and not of MDPI and/or the editor(s). MDPI and/or the editor(s) disclaim responsibility for any injury to people or property resulting from any ideas, methods, instructions or products referred to in the content.