
Mechanical Impurities Carry-Over from Horizontal Heavy Oil Production Well
 ,
,
Abstract
:1. Introduction
- Selection of deep samples of sand from the field;
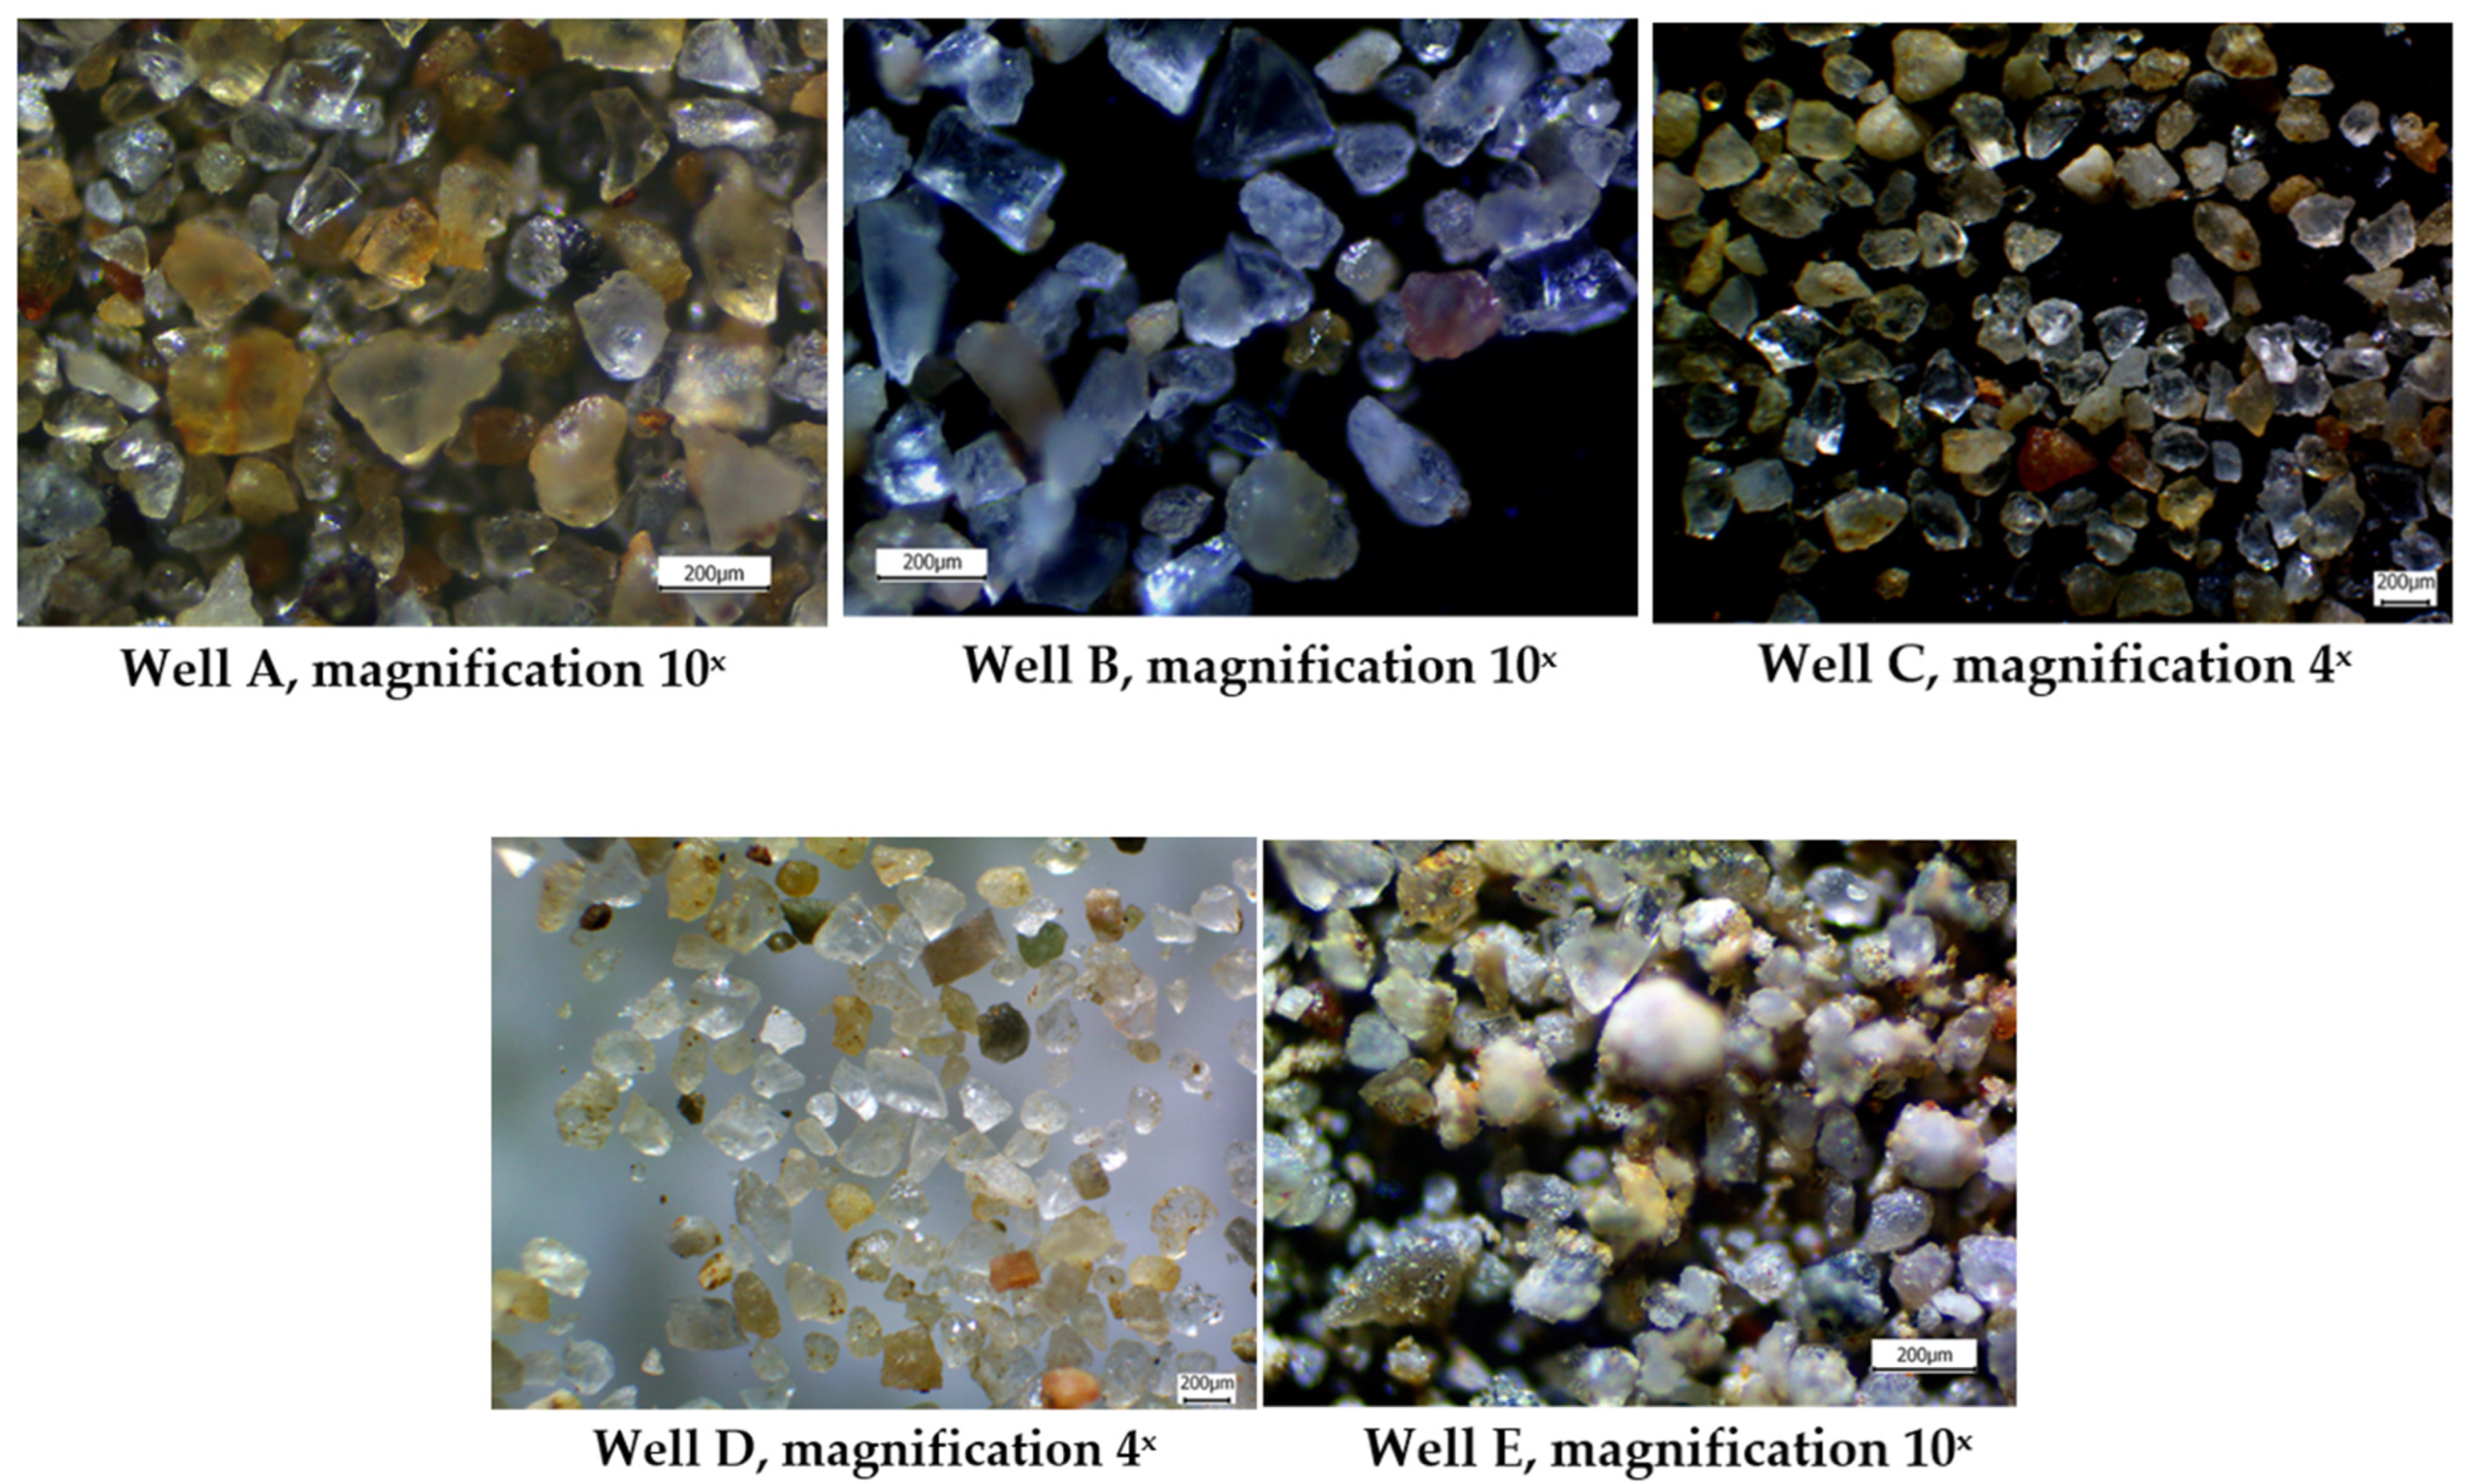
- Studying of the selected samples with a microscope;
- Analysis of the results;
- Comparison of calculated values with field data;
- Summing up.
2. Materials and Methods
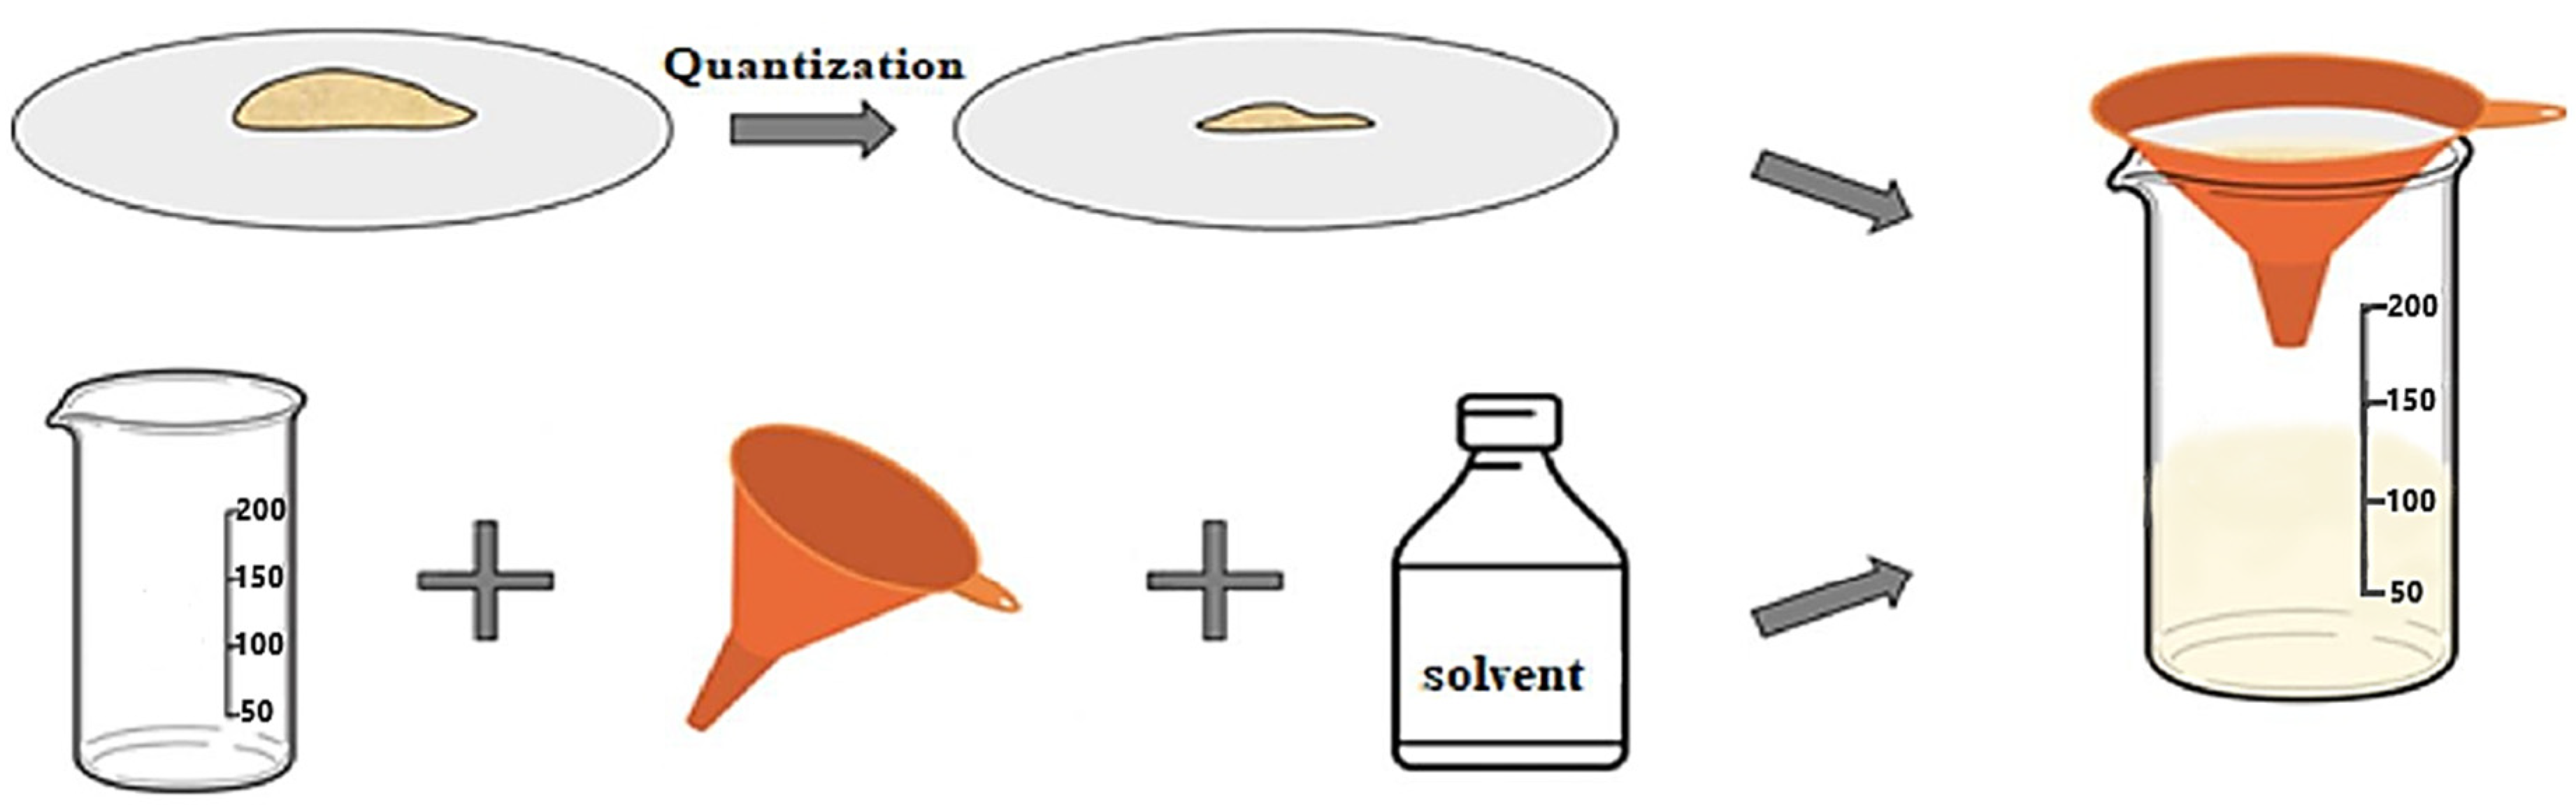
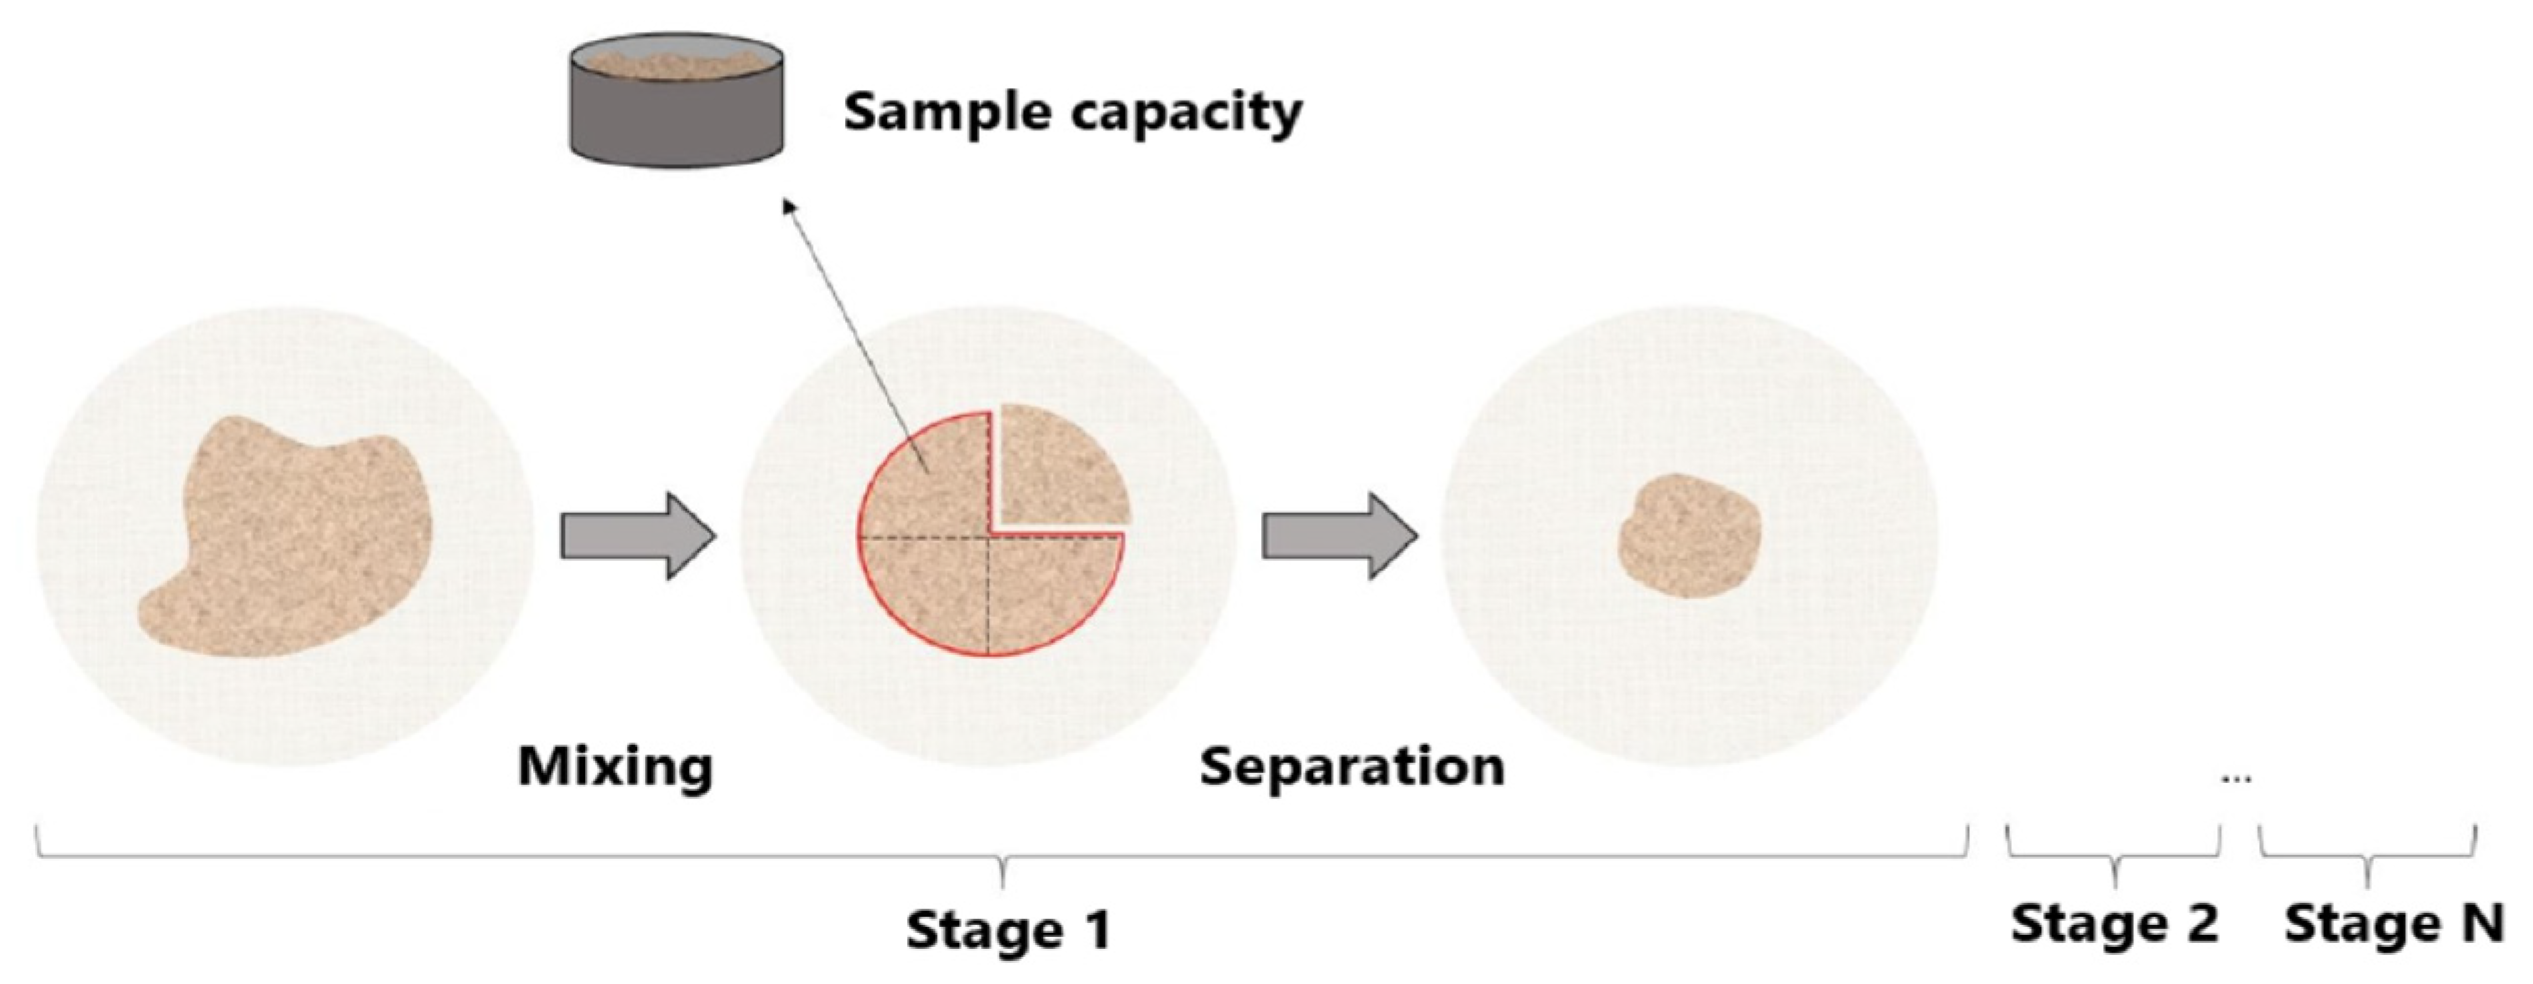
Method for Determining the Granulometric Composition of Sand Samples
3. Results
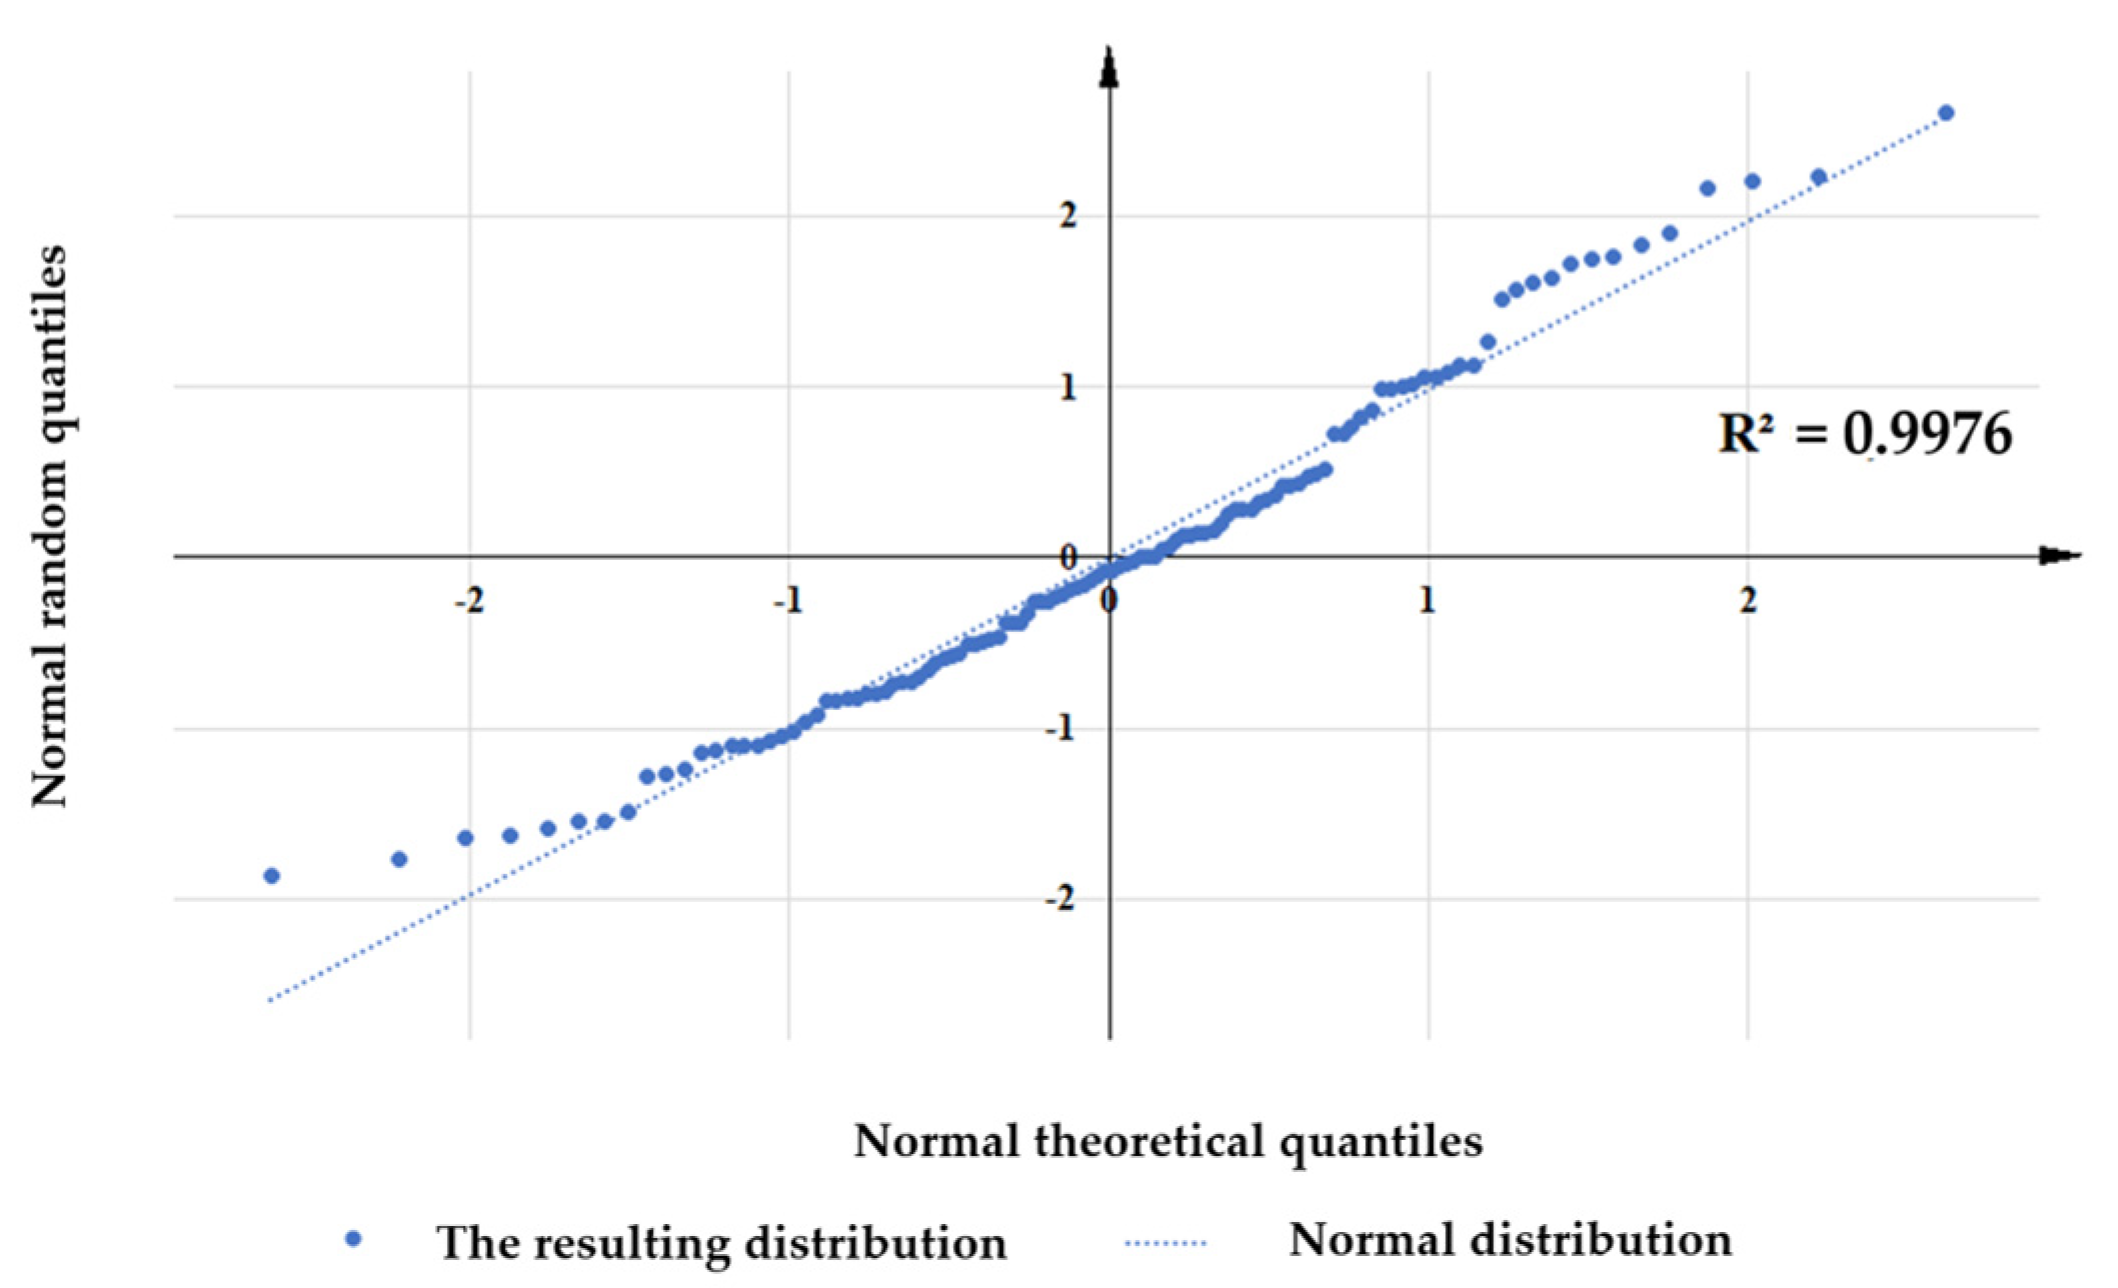
- The error in determining the particle size distribution due to the use of the microscopic method [34,35,36,37]. In fact, this method is one of the most inaccurate due to the error in determining the size of the particles, which does not take into account the shape of the particles when viewed in different planes, inaccuracies are possible due to the setting of the device and its error (less than 5%);
- Particles deposited on the bottom of the borehole when the borehole is stopped for flushing. A certain amount of time elapses during which the small size particles removed have time to settle on the bottom of the well [38];
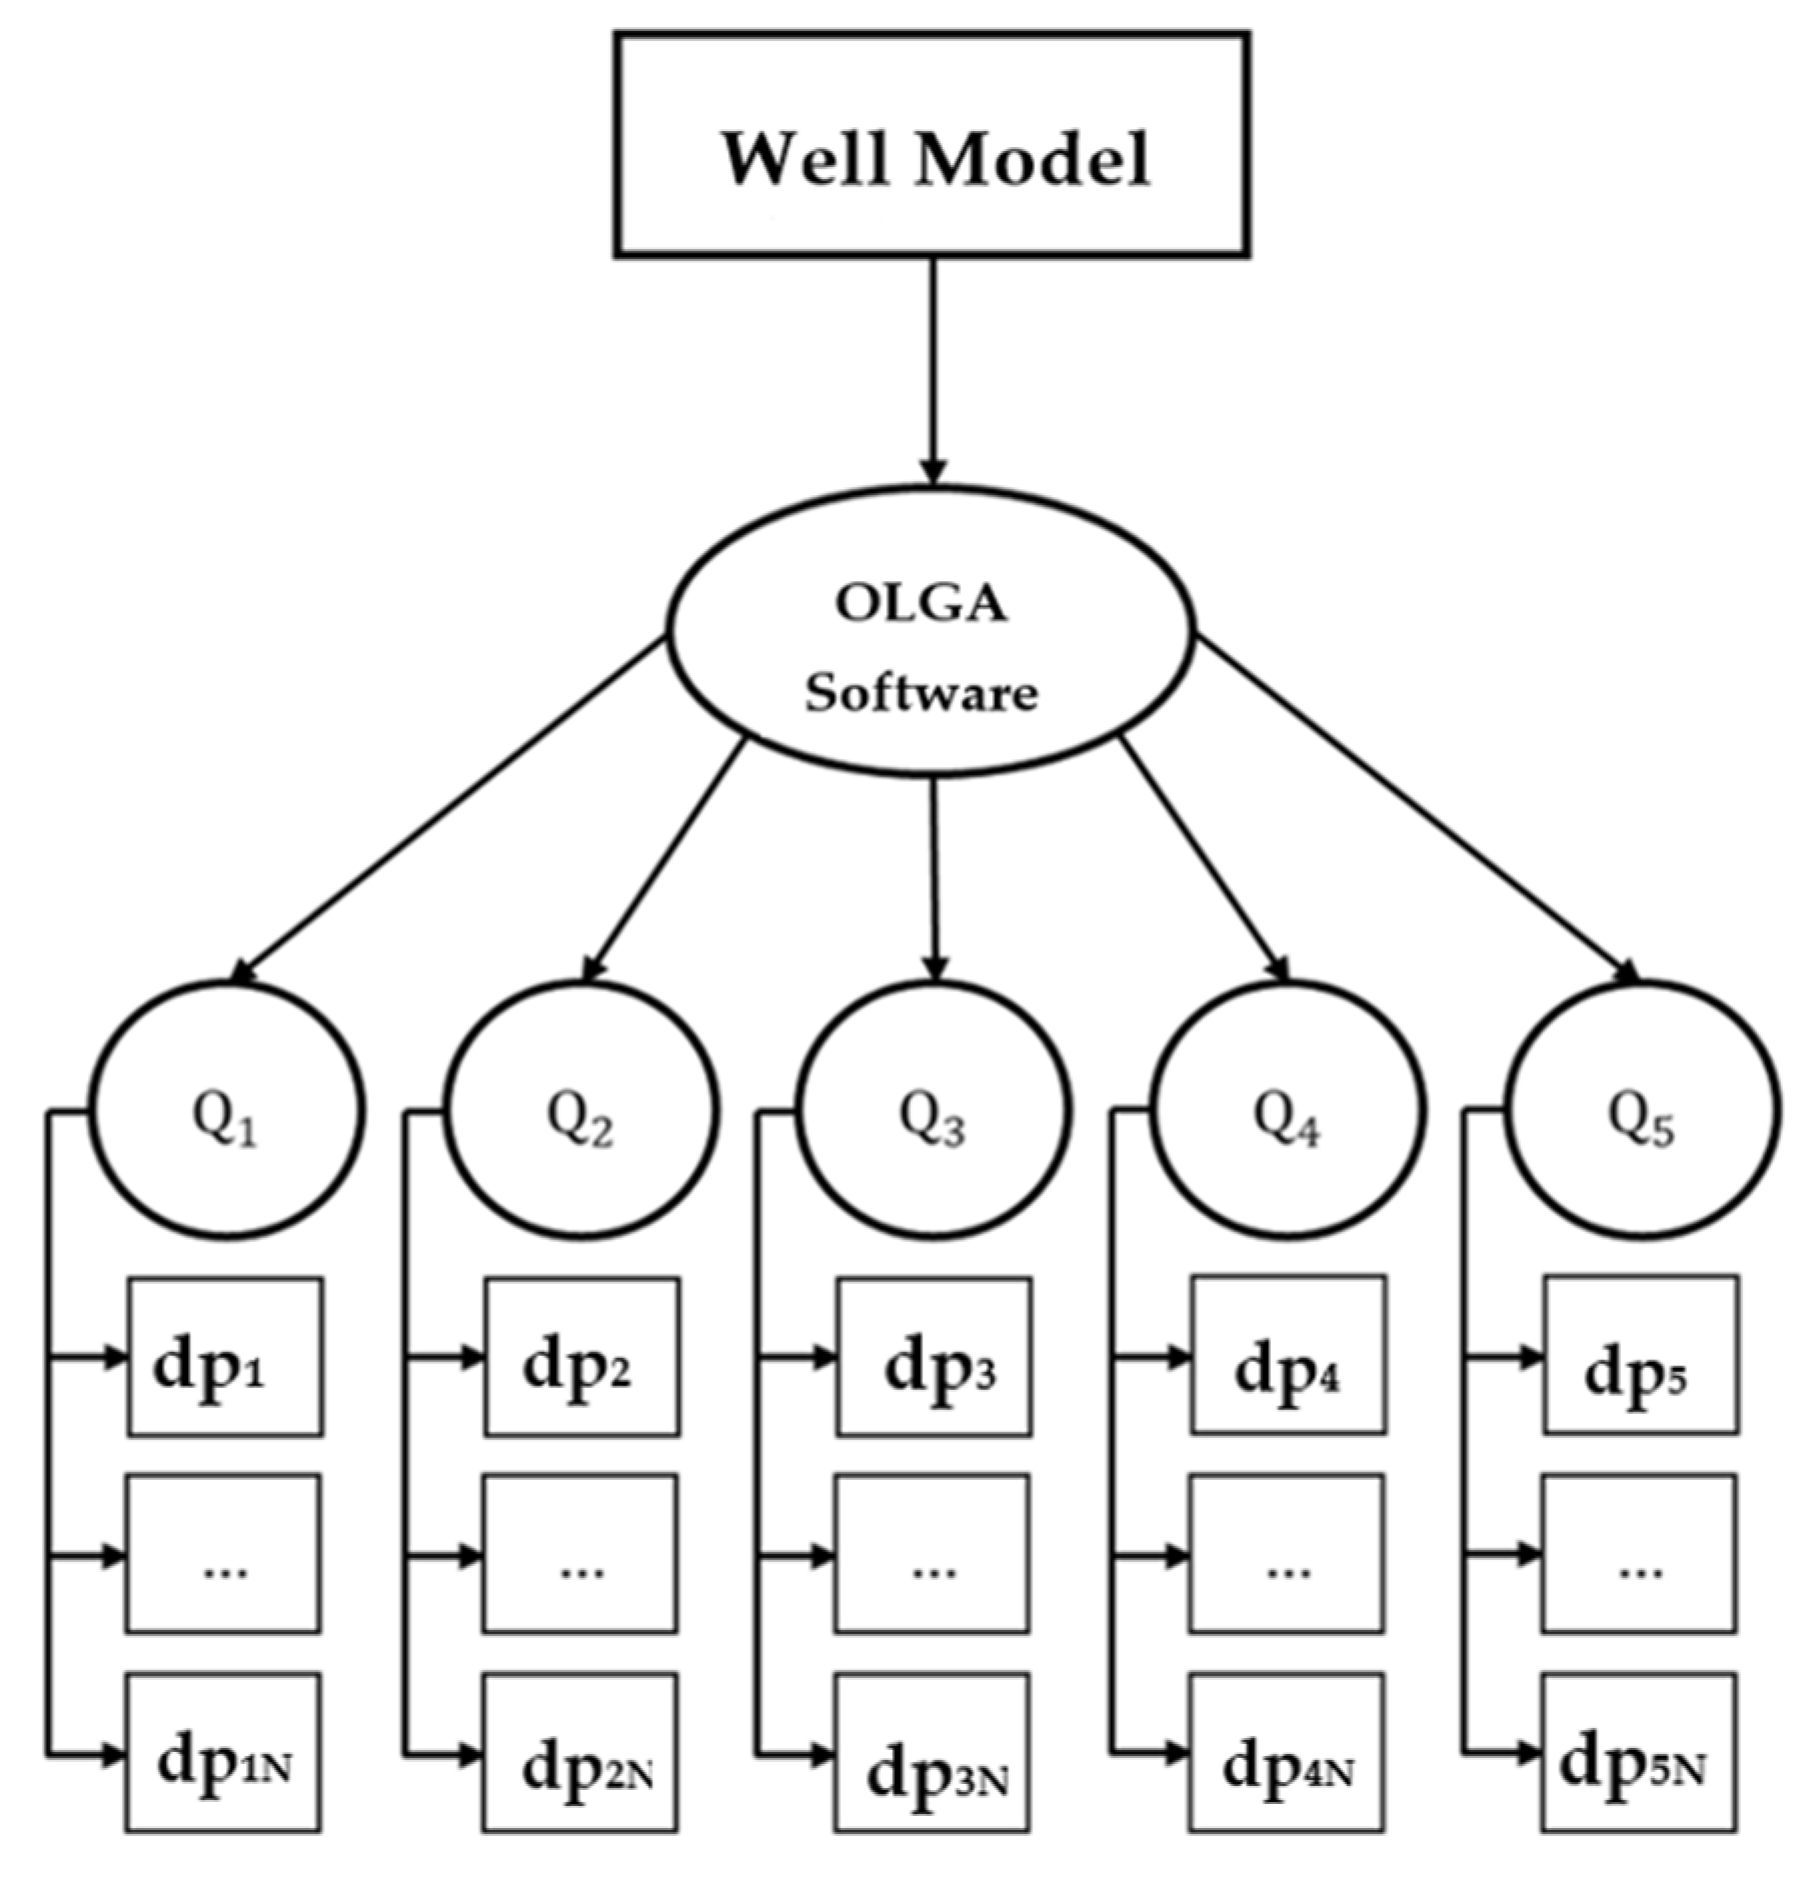
- The error in the oil model [39] used for the calculations, i.e., it is an error in setting the oil-gas saturation pressure of less than 5% and the dynamic viscosity of less than 10%.
- Introduction of the assumption that all particles have the same density.
4. Discussion
5. Summary
Author Contributions
Funding
Institutional Review Board Statement
Informed Consent Statement
Data Availability Statement
Conflicts of Interest
References
- Kupavykh, K.S. Development of wells in complicated conditions. Notes Min. Inst. 2013, 206, 93–98. [Google Scholar]
- Liu, Y.; Zhang, X.; Guo, W. An Approach for Predicting the Effective Stress Field in Low-Permeability Reservoirs Based on Reservoir-Geomechanics Coupling. Processes 2022, 10, 633. [Google Scholar] [CrossRef]
- Grigorev, M.B.; Tananykhin, D.S.; Poroshin, M.A. Sand management approach for a field with high viscosity oil. J. Appl. Eng. Sci. 2020, 18, 64–69. [Google Scholar] [CrossRef]
- Tananykhin, D.S.; Petukhov, A.V.; Shagiakhmetov, A.M. Chemical method of fixing weakly cemented sandstones in production wells of underground gas storage. Sci. Notes Min. Inst. 2013, 206, 107–111. [Google Scholar]
- Li, Y.; Zhuang, L.; Jiang, Z. Study of the Two-Phase Flow and Wear of a Pump with Mixed-Size Particles. Processes 2022, 10, 565. [Google Scholar] [CrossRef]
- Alsawi, K.; Hegazy, M.; Elhady, K.; Sayed, M. Challenging sand producer well handling with PCP in Eastern desert, Egypt. In Proceedings of the Presentation at the SPE Artificial Lift Conference and Exhibition, The Woodlands, Texas, USA, 28–30 August 2018. [Google Scholar]
- Jaimes, M.G.; Quintero, Y.A.; Contreras, G.Y. Drawdown management: A technical and economic alternative for sand control in wells: A Colombian field application. In Proceedings of the Presentation at the SPE Latin American and Caribbean Petroleum Engineering Conference, Maracaibo, Venezuela, 21–23 May 2014. [Google Scholar]
- Betekhtin, A.N.; Kostin, D.K.; Tikhomirov, E.V.; Nikolaev, M.N. Laboratory studies of sand control systems used for heavy oil production from unconsolidated rocks. In Proceedings of the Presentation at the SPE Russian Petroleum Technology Conference, Moscow, Russia, 16–18 October 2017. [Google Scholar]
- Drozdov, I.M. Peculiarities of oil wells operation in conditions of sand-eruption. Energies 2022, 15, 5182. [Google Scholar]
- Slepyan, F.B.; Cremaski, S.; Starika, S.; Subramani, H.J.; Cuba, G.E.; Gao, H. Confidence in critical velocity predictions for solid transport. In Proceedings of the Annual SPE Technical Conference and Exhibition, Amsterdam, The Netherlands, 27–29 October 2014. [Google Scholar] [CrossRef]
- Oroskar, A.R.; Turian, R.M. The Critical Velocity in Pipeline Flow of Slurries. AIChE J. 1980, 26, 550–558. [Google Scholar] [CrossRef]
- Salama, M.M. Sand Production Management. J. Energy Resour. Technol. 2000, 122, 29–33. [Google Scholar] [CrossRef]
- Danielson, T.J. Sand Transport Modeling in Multiphase Pipelines. In Proceedings of the 2007 Offshore Technology Conference, Houston, TX, USA, 30 April–3 May 2007. [Google Scholar]
- Davies, J.T. Calculation of critical velocities to maintain solids in suspension in horizontal pipes. Chem. Eng. Sci. 1986, 42, 1667–1670. [Google Scholar] [CrossRef]
- Musi, A.; Larrey, D.; Monsma, J.; Paran, M.A.; Dekrin, M.K. Selection, implementation and validation of a sand transportation model within a commercial multiphase dynamic simulator for effective sand management. In Proceedings of the 19th BHR International Conference on Multiphase Production Technology, Cannes, France, 5–7 June 2019. [Google Scholar]
- Tananykhin, D.S.; Grigoriev, M.B.; Korolev, M.I.; Solovyov, T.I.; Mikhailov, N.N.; Nesterov, M.I. Experimental Evaluation of the Multiphase Flow Effect on Sand Production Process: Prepack Sand Retention Testing Results. Energies 2022, 15, 4657. [Google Scholar] [CrossRef]
- Islamov, S.R.; Bondarenko, A.V.; Mordashov, D.V. A selection of emulsifiers for preparation of invert emulsion drilling fluids. In Topical Issues of Rational Use of Natural Resources; Tailor & Francis: Abingdon, UK, 2020; pp. 487–494. [Google Scholar] [CrossRef]
- Bondarenko, A.V.; Islamov, S.R.; Mordashov, D.V. Features of oil well jamming in abnormal operating conditions of carbonate reservoirs. In Proceedings of the Engineering and Mining Geophysics 15th Conference, Gelendzhik, Russia, 22–26 April 2019; pp. 629–633. [Google Scholar] [CrossRef]
- Wills, B.A.; Finch, J.A. Particle Size Analysis. In Wills’ Mineral Processing Technology. An Introduction to the Practical Aspects of Ore Treatment and Mineral Recovery; Butterworth-Heinemann: Boston, MA, USA, 2015; pp. 91–107. [Google Scholar] [CrossRef]
- MATLAB Documentation. User Manual; MathWorks, Inc.: Portola Valley, CA, USA, 2020; p. 44. [Google Scholar]
- Besler, H. Chapter Four: The Granulometric Analysis. Dev. Sedimentol. 2008, 59, 73–98. [Google Scholar] [CrossRef]
- Bruce, P. Practical Statistics for Data Science Professionals: SPb; BHV-Peterburg: Saint Petersburg, Russia, 2018; 304p. [Google Scholar]
- Dengaev, A.; Shishulin, V.; Safiullina, E.; Palyanitsina, A. Modeling Results for the Real Horizontal Heavy-Oil-Production Well of Mechanical Solids. Energies 2022, 15, 5182. [Google Scholar] [CrossRef]
- Pershin, I.M.; Papush, E.G.; Kukharova, T.V.; Utkin, V.A. Modeling of Distributed Control System for Network of Mineral Water Wells. Water 2023, 15, 2289. [Google Scholar] [CrossRef]
- Martyushev, D.A. Improvement of the geological and hydrodynamic model of a carbonate oil facility by taking into account the parameter of anisotropy of permeability. Notes Min. Inst. 2020, 243, 313–318. [Google Scholar] [CrossRef]
- Ilyushin, Y.V. Development of a Process Control System for the Production of High-Paraffin Oil. Energies 2022, 15, 6462. [Google Scholar] [CrossRef]
- Gloria, I. López Grain Size Analysis. In Encyclopedia of Geoarchaeology; Springer: Berlin/Heidelberg, Germany, 2016; pp. 341–348. [Google Scholar] [CrossRef]
- Dvoynikov, M.V.; Budovskaya, M.E. Development of a system for completing hydrocarbon wells with low bottom-hole temperatures for the conditions of oil and gas fields in Eastern Siberia. Notes Min. Inst. 2022, 253, 12–22. [Google Scholar]
- Dabirian, R.; Mohammadiharkeshi, M.; Mohan, R.; Shoham, O. The critical rate of sand deposition in the evaluation of intermittent flow models. In Proceedings of the SPE Annual Technical Conference and Exhibition, Calgary, AB, Canada, 30 September–2 October 2019. [Google Scholar] [CrossRef]
- Votinov, A.S.; Seredin, V.V.; Kolychev, I.Y.; Galkin, S.V. Possibilities of taking into account fracturing of kashiro-verey carbonate objects when planning propane hydraulic fracturing. Notes Min. Inst. 2021, 252, 861–871. [Google Scholar] [CrossRef]
- Zhigarev, D.B.; Lekomtsev, A.V.; Gorlov, A.E.; Dengaev, A.V. Experimental studies of the efficiency of high-speed ESPs. E3S Web Conf. 2021, 266, 8. [Google Scholar] [CrossRef]
- Dabirian, R.; Mohan, R.; Shoham, O.; Kouba, G. Critical sand deposition velocity for gas-liquid stratified flow in horizontal pipes. J. Nat. Gas Sci. Eng. 2016, 33, 527–537. [Google Scholar] [CrossRef]
- Dvoynikov, M.V.; Kuchin, V.N.; Mintsaev, M.S. Development of viscoelastic systems and technology of isolation of aquifers with abnormal reservoir pressures during drilling of oil and gas wells. Notes Min. Inst. 2021, 247, 57–65. [Google Scholar]
- Dabirian, R.; Mohan, R.S.; Shoham, O.; Kouba, G. Sand Transport in Stratified Flow in a Horizontal Pipeline. In Proceedings of the SPE Annual Technical Conference and Exhibition, Houston, TX, USA, 28–30 September 2015; pp. 2–4. [Google Scholar] [CrossRef]
- Van Thang, N.; Thang Vinh, P.; Rogachev, M.; Korobov, G.; Zhurkevich, A.; Islamov, S.A. Comprehensive method for determining the dewaxing interval period in gas lift wells. J. Pet. Explor. Prod. Technol. 2023, 13, 1163–1179. [Google Scholar] [CrossRef]
- Urazakov, K.R.; Timashev, E.O.; Molchanova, V.A. Modeling of the operation of submersible pumping units. Proc. Tomsk. Polytech. Univ. Georesource Eng. 2020, 331, 51–59. [Google Scholar]
- Yang, Y.; Peng, H.; Wen, C. Sand transport and deposition behaviour in subsea pipelines for flow assurance. Energies 2019, 12, 4070. [Google Scholar] [CrossRef]
- Brill, J.P.; Mukherjee, H.K. Multiphase Flow in Wells; SPE: Richardson, TX, USA, 1999; 164p. [Google Scholar]
- Marinina, O.; Nechitailo, A.; Stroykov, G.; Tsvetkova, A.; Reshneva, E.; Turovskaya, L. Technical and Economic Assessment of Energy Efficiency of Electrification of Hydrocarbon Production Facilities in Underdeveloped Areas. Sustainability 2023, 15, 9614. [Google Scholar] [CrossRef]


| Parameter/ Methodology | Particle Shape | |||||||||||
|---|---|---|---|---|---|---|---|---|---|---|---|---|
| Oroskar and Turian (1980) | + | + | + | + | + | − | − | − | + | − | + | − |
| Salama (1998) | − | + | + | + | + | + | + | + | − | * | − | − |
| Danielson (2007) | − | + | + | + | + | − | − | + | − | − | − | − |
| Davies (1987) | + | + | + | + | + | − | − | + | − | − | − | − |
| OLGA software | + | + | + | + | + | + | + | − | + | ** | − | + |
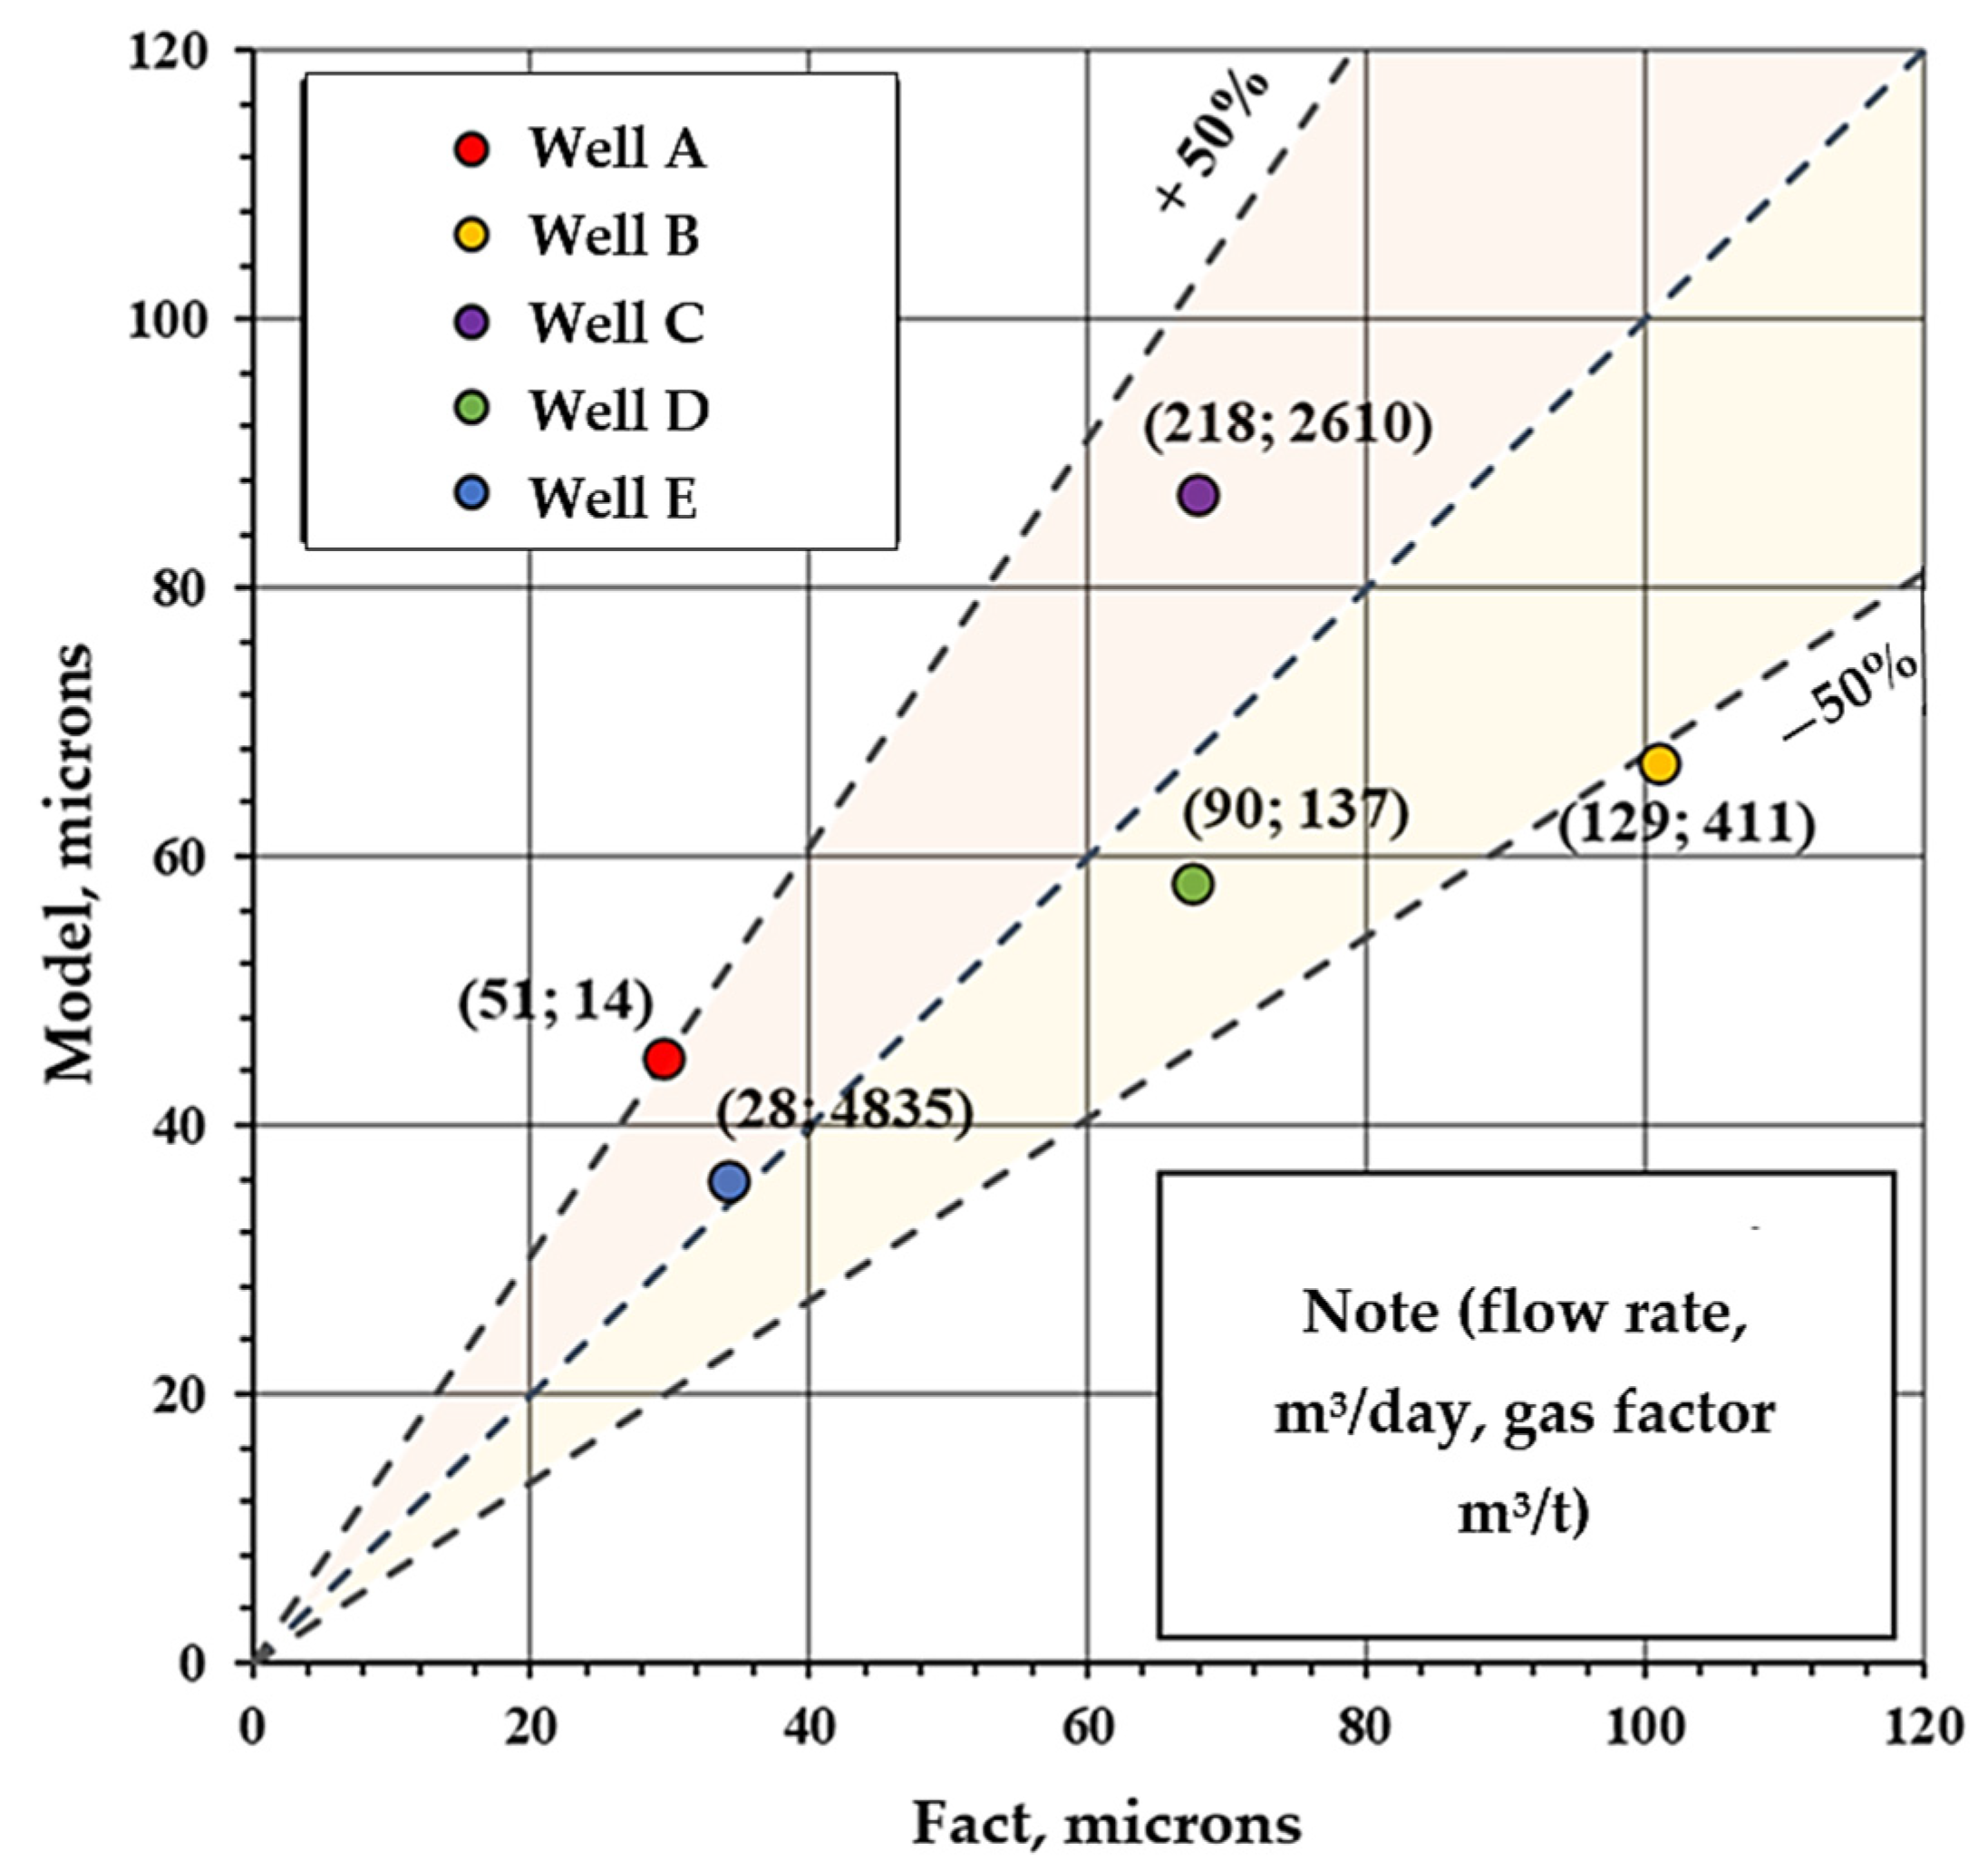
| Well | Model, Micron | Fact, Micron | Deviation of the Model from the Fact, % | ||
|---|---|---|---|---|---|
| A | 51 | 14.06 | 45 | 29.4 | 53.1 |
| B | 129 | 411.07 | 67 | 101 | −33.7 |
| C | 218 | 2610.06 | 87 | 67.9 | 28.1 |
| E | 28 | 4835.46 | 36 | 34.2 | 5.3 |
| D | 90 | 136.55 | 58 | 67.4 | −13.9 |
Disclaimer/Publisher’s Note: The statements, opinions and data contained in all publications are solely those of the individual author(s) and contributor(s) and not of MDPI and/or the editor(s). MDPI and/or the editor(s) disclaim responsibility for any injury to people or property resulting from any ideas, methods, instructions or products referred to in the content. |
© 2023 by the authors. Licensee MDPI, Basel, Switzerland. This article is an open access article distributed under the terms and conditions of the Creative Commons Attribution (CC BY) license (https://creativecommons.org/licenses/by/4.0/).
Share and Cite
Dengaev, A.; Shishulin, V.; Drozdov, I.; Novikova, A.; Eremenko, O.; Safiullina, E.; Vakhin, A.V. Mechanical Impurities Carry-Over from Horizontal Heavy Oil Production Well. Processes 2023, 11, 2932. https://doi.org/10.3390/pr11102932
Dengaev A, Shishulin V, Drozdov I, Novikova A, Eremenko O, Safiullina E, Vakhin AV. Mechanical Impurities Carry-Over from Horizontal Heavy Oil Production Well. Processes. 2023; 11(10):2932. https://doi.org/10.3390/pr11102932
Chicago/Turabian StyleDengaev, Alexey, Vladimir Shishulin, Ilya Drozdov, Anna Novikova, Olga Eremenko, Elena Safiullina, and Alexey V. Vakhin. 2023. "Mechanical Impurities Carry-Over from Horizontal Heavy Oil Production Well" Processes 11, no. 10: 2932. https://doi.org/10.3390/pr11102932