Article

Numerical Study on the Flow and Structural Characteristics of a Large High Head Prototype Pump-Turbine under Different Operating Conditions

1
Fujian Xiamen Pumped Storage Co., Ltd., Xiamen 361000, China
2
State Key Laboratory of Hydroscience and Engineering, Department of Energy and Power Engineering, Tsinghua University, Beijing 100084, China
3
S.C.I.Energy GmbH, Future Energy Research Institute, Seidengasse 17, 8706 Zurich, Switzerland
*
Author to whom correspondence should be addressed.
Processes 2023, 11(10), 2970; https://doi.org/10.3390/pr11102970
Submission received: 28 August 2023 / Revised: 27 September 2023 / Accepted: 29 September 2023 / Published: 13 October 2023

Abstract

:
During the operation of pumped storage power stations, complex operating conditions can lead to different internal flow characteristics, which can cause different vibration characteristics or even damage to the structural components of the pump-turbine units. The time–frequency characteristics of the structural components’ response are of great significance for the safe operation of the unit. In this study, a three-dimensional flow field and structural field model of a large high head prototype pump-turbine is built in order to study the flow and the flow-induced dynamic response characteristics in different turbine operating conditions. The analyzed results show that the maximum deformation occurs at the inner head cover, and the maximum value of stress is located at the fillets on the outlet side of the stay vanes. Under the 50% load condition, the vortices in the runner caused by changes in the opening of the guide vanes result in the main response frequency of 4  f n  of the stationary components. The research results can provide references for the structural optimization design of other pump-turbine units.

1. Introduction

In recent years, pumped storage units have been widely promoted because they can absorb additional electricity generated by unstable renewable energy sources such as wind and solar energy, and they can help solve the problems of frequency modulation, phase modulation, and peak regulation in the power grid. With the demand for flexible regulation of the power grid, pumped storage units have the characteristics of frequent start-up and shutdown as well as complex and variable operating conditions. Due to unreasonable design and operation, hydroelectric generator sets have experienced many serious accidents and structural damage such as fatigue damage of the runner [1] and the bolts connecting [2]. The damaged components can go through the unit [3] and even cause further damage [4]. Therefore, it is required to conduct more in-depth research on the flow and structural response of pumped-storage units under different operating conditions.
With the development of computational theory and hardware capabilities, numerical simulation has become an important method for studying the internal flow characteristics of hydraulic turbine units. The complex and unstable flow characteristics of various prototype hydraulic turbine units under different operating conditions have been studied by computational fluid dynamics (CFD) calculations. He et al. investigated the causes of resonance of a model pump-turbine unit during the startup process, discovering that the hydraulic excitation frequency due to the rotor–stator interaction (RSI) is the main cause of resonance [5]. Zhang et al. formulated a stochastic dynamic model of a pump-turbine in the load-rejection process to study the effects of the stochastic intensity on the dynamic behavior [6]. Mao et al. also investigated a pump-turbine in the load-rejection process and found that flow-induced noise radiation is consistent with internal fluid characteristics [7]. Guo et al. found the transient characteristic of the pump-turbine can be improved with the enhancement of the hysteresis effect [8]. Liu et al. simulated a pump-turbine operating at different conditions with guide vanes opening at an angle of 6 degrees and revealed that the maximum amplitude of pressure fluctuation occurs when the pump turbines run at a runaway point [9]. Jacquet et al. focused on the numerical analysis of the flow in a pump-turbine in the S-shape region to improve the behavior of the pump-turbine in such operating conditions [10]. Some studies focus on flow mechanisms and improvement of flow performance. Zhang et al. established a dynamic model for the full flow passages of a pump-turbine for reverse-pump operation conditions and revealed the law of energy loss and pressure fluctuation [11]. Shang et al. studied the flow characteristics and pressure pulsation characteristics of a variable-speed pump turbine at three speeds and proved that reducing the speed will not affect the safety and stability of the equipment [12]. Ono et al. investigated the relation between the leading edge radius and the S-shaped characteristics and found that the leading edge vorticity causes the inner blade loss [13]. Yuan et al. analyzed vortex flow characteristics and vortex control methods in both modes to reduce hydraulic loss [14]. Fu et al. used the single- and two-phase flow models to demonstrate the influence of cavitation on pressure fluctuation in a pump-turbine [15]. Liu et al. analyzed the evolution and influence of cavitation cavities during the load rejection transient process and revealed the mechanism of the dynamic cavitation phenomenon [16]. Many scholars have conducted research combining CFD methods and on-site experiments. Huang et al. investigated the static and dynamic stresses on the prototype high head Francis runner based on site measurements and numerical simulations [17]. Ciocan et al. studied the dynamics of the rotating vortex by carrying out both experimental flow survey and numerical simulations [18]. Ansari et al. carried out an experimental and numerical investigation to study the feasibility of applying a pump as a turbine in a hydropower system and its performance on the oil transmission lines [19]. Magnoli and Necker simulated the pressure pulsations for pumped-storage units with a wide operating range and compared them to experiments [20]. Yang et al. studied a high-head pump-turbine in the turbine mode of operation by means of site measurement and full three-dimensional unsteady simulations to analyze the variation law of RSI [21]. The accuracy of the CFD method has been verified by comparing it with the results of the field measurements.
The study of the dynamic response characteristics of structural components such as the head cover and stay ring of a pump-turbine unit is a complex fluid–structure interaction (FSI) problem. Researchers [22,23] have found that the influence of structural deformation on fluid flow in hydraulic machinery is negligible, and the method of one-way FSI simulation is feasible. Researchers have also found that the internal flow is considered one of the main reasons for structural dynamic responses [5,24]. Jiang et al. simulated the vibration of the pump’s structure using a parallel explicit dynamic FEM code and clarified the mechanisms of resonant noise generation and propagation [25]. He et al. investigated the corresponding unsteady flow-induced dynamic behavior of the head cover, stay vanes and bottom ring during load rejection [26]. Huang et al. calculated the flow-induced stresses on the head cover, stay ring, bottom ring, head cover bolts and bottom ring bolts and found that the the maximum stresses of the head cover bolts are higher than the maximum stresses of the bottom ring bolts, and the maximum stresses of the bolts are above two-thirds of the yield strength of the bolt material [27]. Luo et al. studied the relationship between pressure pulsations and fatigues of key parts of a Kaplan turbine and revealed that the dynamic stresses in the runner body parts are small for high heads with large guide vane openings but are large for high heads with small guide vane openings [28]. Mao et al. studied the axial hydraulic force of the pump-turbine during the starting up of pump mode, and the stress concentration of the support bracket is found on the connection between the thrust seating and support plates [29]. The accuracy of the flow-induced stress calculation method has been validated through the above-listed research. In summary, previous research has provided appropriate theoretical and methodological support for the analysis of flow-induced dynamic response. However, the time–frequency characteristics of the response of stationary components of prototype pump-turbine units caused by flow under different turbine operating conditions need to be further studied.
In this investigation, three-dimensional unsteady CFD simulations of the flow passage of the unit at 100% loading and 50% load conditions are first conducted using the data of inlet discharges, outlet pressures, rotating speeds and guide vane openings obtained from model experiments. Next, the one-way FSI method is used to transfer the pressure data from the flow passage to the finite element model of the stationary components of the pump-turbine unit. Finally, a detailed analysis and discussion are conducted on the flow-induced stress distribution, deformation distribution and time–frequency characteristics of the head cover, stay ring, and bottom ring. The research results can provide references for the structural optimization design of pump-turbine units under different operating conditions.

2. Methods

The internal flow of the prototype pump-turbine is simulated by the CFD numerical simulation method. The dynamic response of unit structures is solved using the finite element method (FEM).

2.1. Fluid Governing Equations and Turbulence Model

The flow in the unit is considered to be a three-dimensional incompressible unsteady turbulent flow. The Reynolds-averaged Navier–Stokes (RANS) equations are used to approximate and simplify the turbulent flow. The governing equations are described as follows:
· u = 0
t u + · uu = p ρ + ν 2 u · u u ¯ + f
where  u  is flow velocity, t is time, p is fluid pressure,  ρ  is water density,  ν  is kinematic viscosity and  f  is body force. In the RANS method, the fluctuating instantaneous component ( u u ¯ ) requires additional equations to be closed. In this paper, the Shear-Stress Transport (SST) k- ω  turbulence model is applied to close the RANS equations.

2.2. Structural Governing Equations

After discretizing by using finite elements, the matrix formulation of the governing equations for the structural dynamics can be expressed as follows:
M d ¨ + C d ˙ + K d = F s
where  M C  and  K  are the structure mass matrix, damping matrix and stiffness matrix,  d d ˙  and  d ¨  are the solid domain displacement, velocity and acceleration vectors, and  F s  is the load vector.
By solving Equation (3), the static stress  σ  can be calculated by the displacement vector  d  as follows:
σ = D s B s d
where  D s  is the elastic matrix based on the material Young’s modulus and Poisson’s ratio, and  B s  is the strain-displacement matrix based on the element shape functions.
The equivalent von Mises stress  σ e  is used to analyze the stress characteristics of the structure. It characterizes the elastic deformation energy of the material and can be expressed as follows:
σ e = 1 2 σ 1 σ 2 2 + σ 2 σ 3 2 + σ 3 σ 1 2
where  σ 1 σ 2  and  σ 3  are the first, second and third principal stress.

2.3. The Fluid–Structure Coupling Model

Since the structural deformation caused by water flow is very small, the influence of structural deformation on the flow field is negligible. The influence of flow on the structural dynamic response is analyzed by the one-way FSI method. The coupling process is as follows.
The first step is flow simulation to obtain the hydraulic loads. The second step is data transferring. The hydraulic loads per timestep are loaded onto locations associated with structure mesh by the interpolation method. Since it is not a two-way FSI simulation, the mesh of the flow field and the structure field do not need to be strictly corresponding, which simplifies mesh partitioning and avoids a too-fine mesh in modeling the structure field. The last step is performing structure simulation with the same timestep as flow simulation.

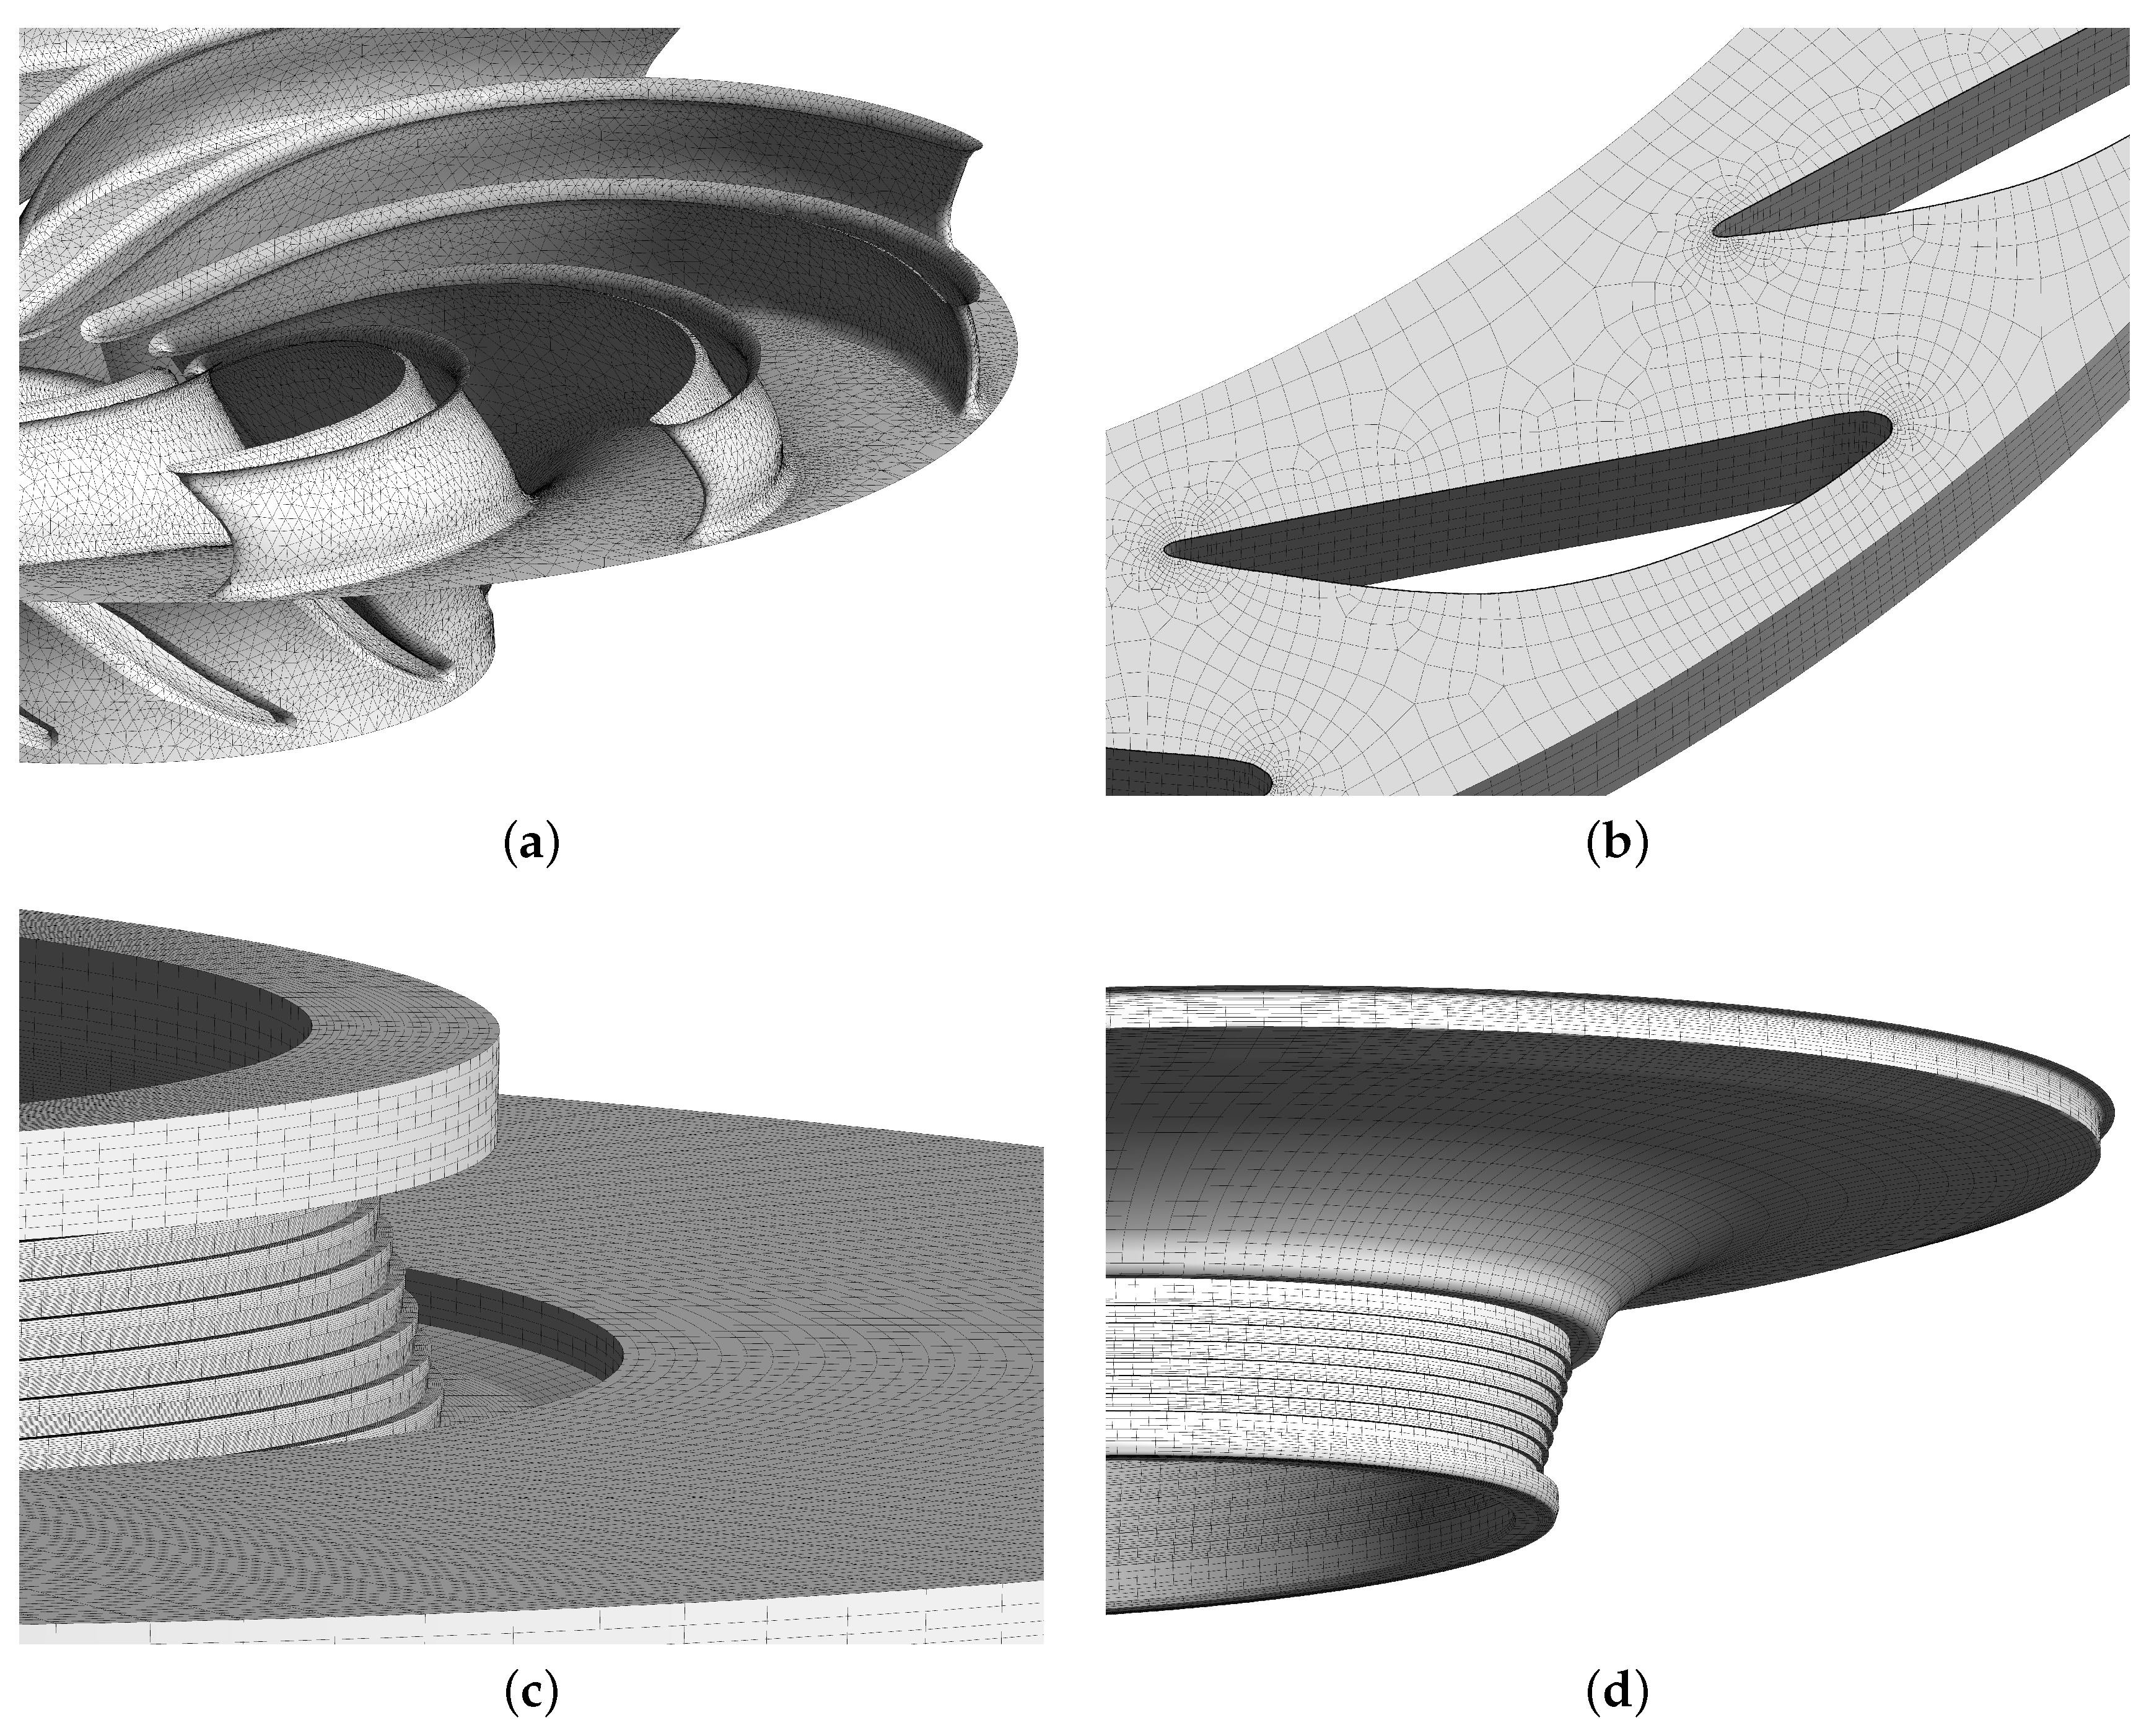
3. Calculation Model and Mesh Independence Analysis

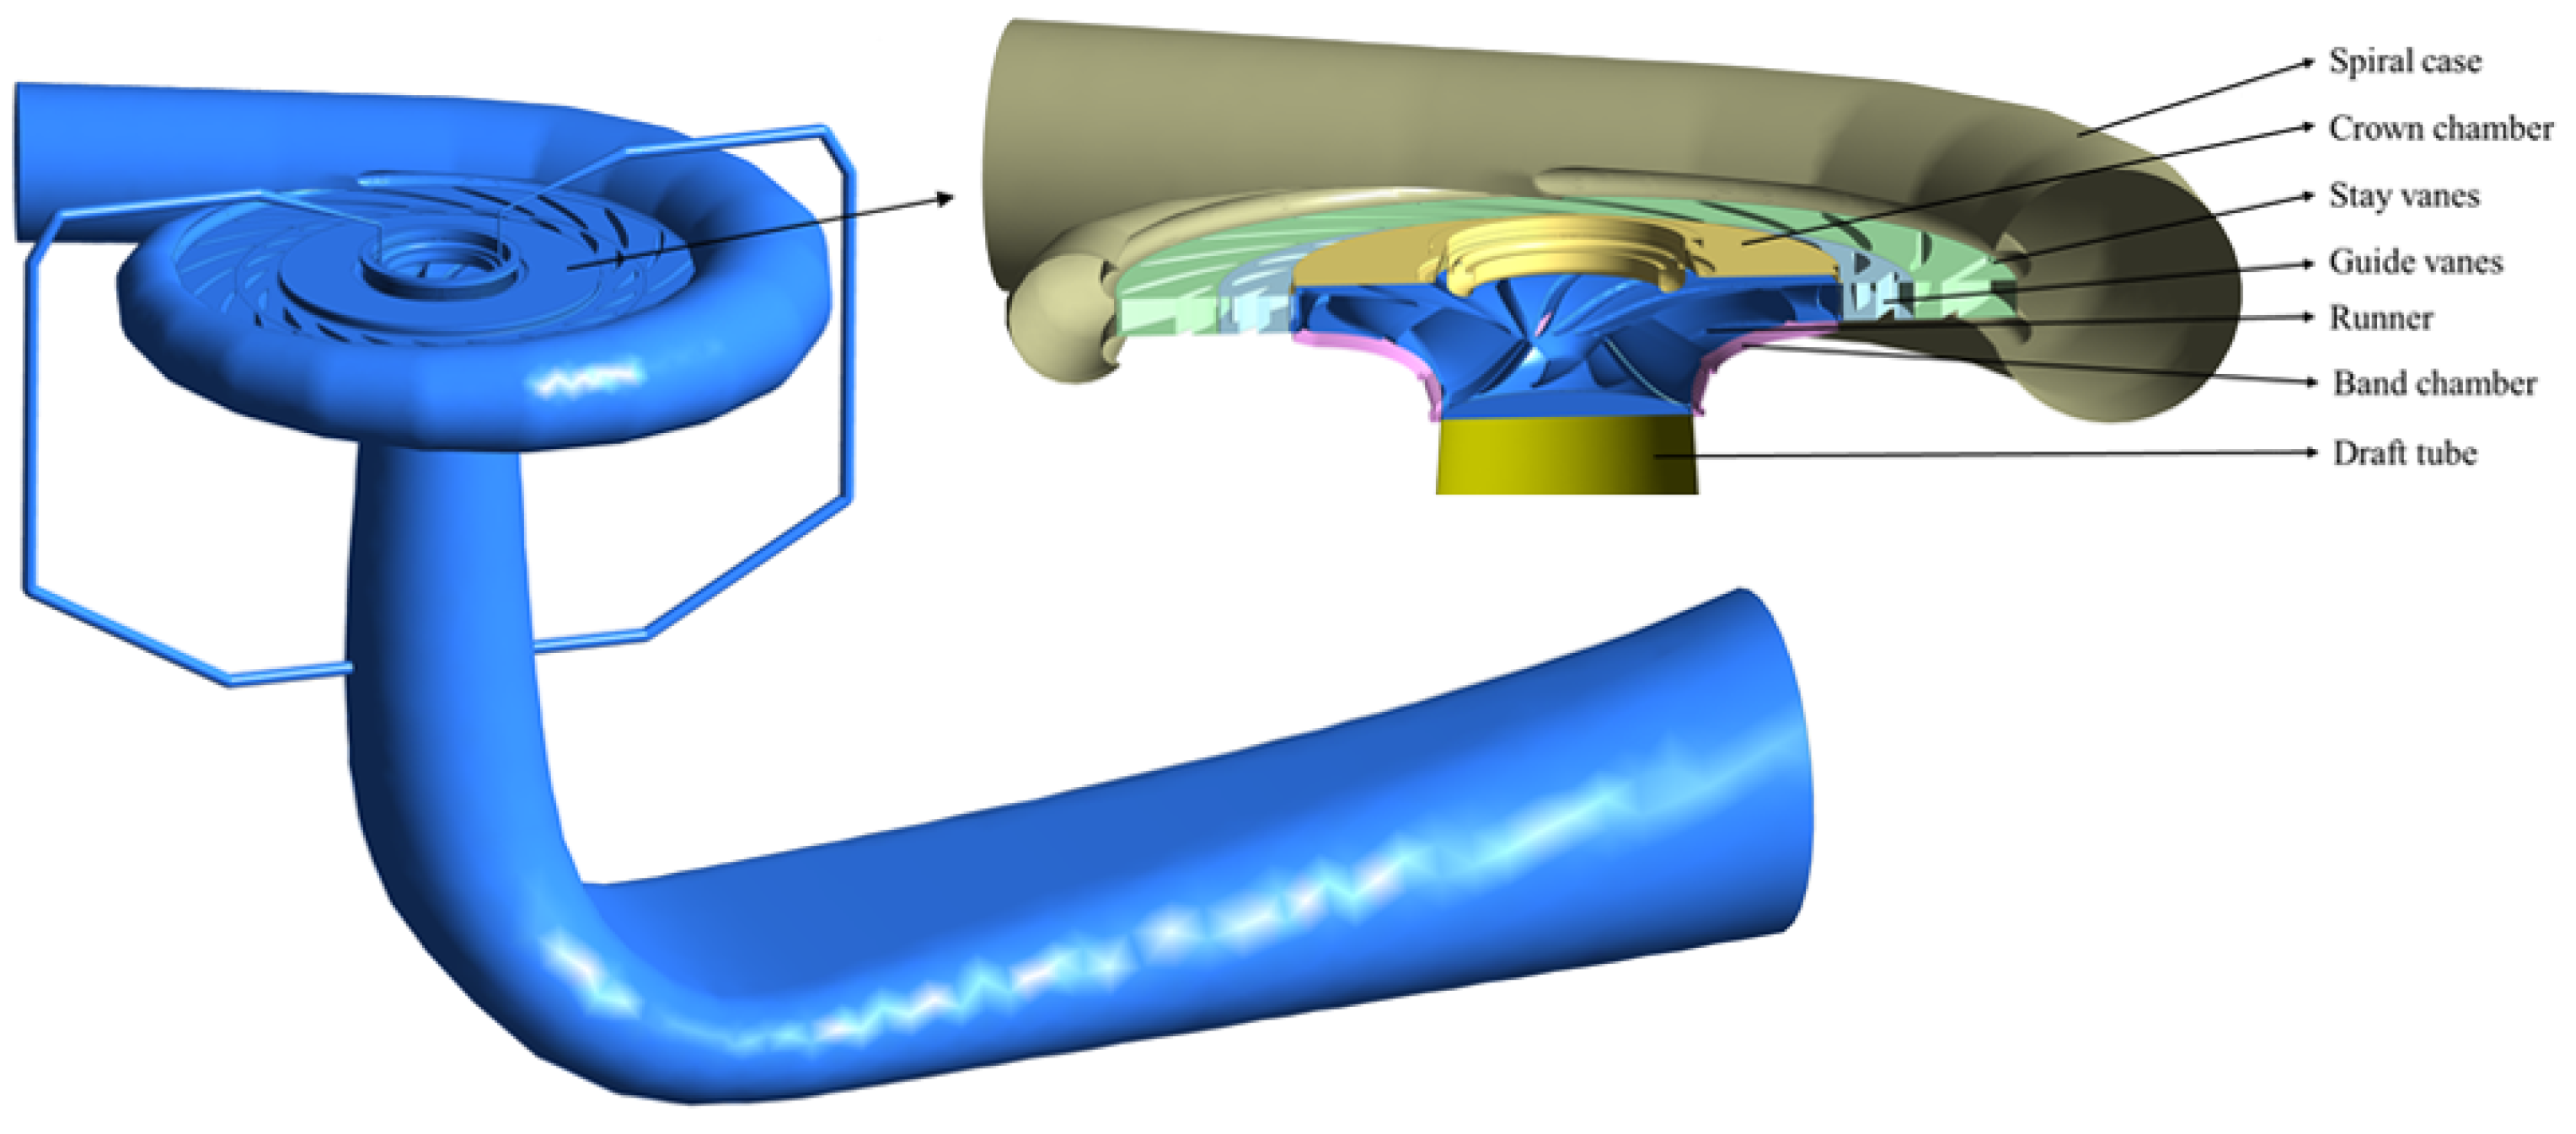
3.1. Pump-Turbine Flow Model

A large high-head prototype pump-turbine unit is studied in this paper. The three-dimensional flow domain model of the pump-turbine consists of the spiral case, stay vanes, guide vanes, runner, draft tube, crown chamber, band chamber, and balance pipes, as shown in Figure 1. The spiral case provides a uniform and constant flow rate of water in the circumferential direction of the stay vanes inlet. The stay vanes guide water flow to guide vanes with minimal hydraulic loss. The guide vanes can control the angle of water flow entering the runner by changing the opening angle and adjusting the flow rate while the unit output changes. Under the turbine operating condition, the runner converts most of the hydraulic energy into rotating mechanical energy and transmits it to the generator through the main shaft. The draft tube is mainly used to guide the water flow out of the runner. The crown chamber is the clearance between the runner and the head cover. The band chamber is the clearance between the runner and the bottom ring. The balance pipes are designed to reduce the axial thrust from controlling the pressure of the crown chamber.
The rated head of this pump-turbine is 545 m, and the rated rotational speed is 428.6 rpm. The rated power of turbine operating conditions at the rated head is 357.1 MW. The pump-turbine unit has 20 guide vanes and 20 stay vanes, and the runner has 11 blades. The main parameters of this pump-turbine are shown in Table 1.
Considering the computational cost and simulation accuracy, the flow domain is meshed by tetrahedral and hexahedral elements with the ANSYS mesh tool. All the faces of the spiral case wall, stay vane blades, guide vane blades and runner blades are meshed into boundary layers with the inflation method. The obtained mesh of the pump-turbine unit is shown in Figure 2, and the element numbers of each flow domain are summarized in Table 2.
The transient flow calculations are performed by ANSYS CFX. According to the unit design and model test data, the opening of the guide vanes under the rated head and rated loading is 100% of the rated opening angle. When the load is 50%  P r , the opening angle is 50% of the rated opening angle. These two working conditions are taken as the main calculation conditions. The total analysis time is set to 1.4 s, including ten rotations of the runner, with 180 substeps set for each rotation, and each substep has a time step size of 7.8 ×  10 4  s.  Q i n  is the total discharge at the spiral case inlet, and  P o u t  is the static pressure at the draft tube outlet. These are calculated through model tests and used as inlet and outlet boundary conditions.  Q i n  is 72.51 m 3 /s with the inlet diameter 2.29 m under the rated head and rated loading.. All walls are defined as no-slip walls. The runner domain and the walls on the runner side of the clearances rotate at the rated rotational speed of 428.6 rpm. The interfaces between the guide vanes and the runner region and between the runner and the draft tube region are set as transient rotor–stator interfaces. The convergence criterion is set to  10 4 .
Three sets of meshes are constructed to verify the mesh independence and the calculation accuracy. The mesh size of the runner, stay vanes, guide vanes and draft tube can be adjusted with different values. The efficiency is selected as the comparison parameter for calculations and model tests. The results shown in Figure 3 indicate that the mesh with 2.96 ×  10 6  elements is sufficient for this calculation. The consistency between simulation and experiment validates the reliability of the calculation model.

3.2. Pump-Turbine Structural Model

The structural model of the pump-turbine includes the stationary components of the head cover, stay ring, and bottom ring. The structural model is mainly meshed by tetrahedral mesh elements, and the element type is SOLID186. The structural mesh is shown in Figure 4 with 2.01 ×  10 6  nodes and 1.29 ×  10 6  elements. For the accuracy of the stress concentration calculation, the mesh of the stay vanes of the stay ring and the reinforcing plates of the head cover is refined.
Three sets of mesh with different numbers of elements are plotted for the structural field. The calculation meshes are checked with the maximum  σ e . Define the relative equivalent stress  σ r  as follows:
σ r = σ e m a x σ e
where  m a x σ e  is the maximum  σ e  over all calculated conditions. In this paper,  m a x σ e  is located at the stay vanes of the stay ring at the 100% load condition. The comparison results are shown in Figure 5. Considering both the calculation accuracy and the calculation time, the mesh with 1.29 ×  10 6  elements is selected for subsequent analysis.

4. Results and Discussions

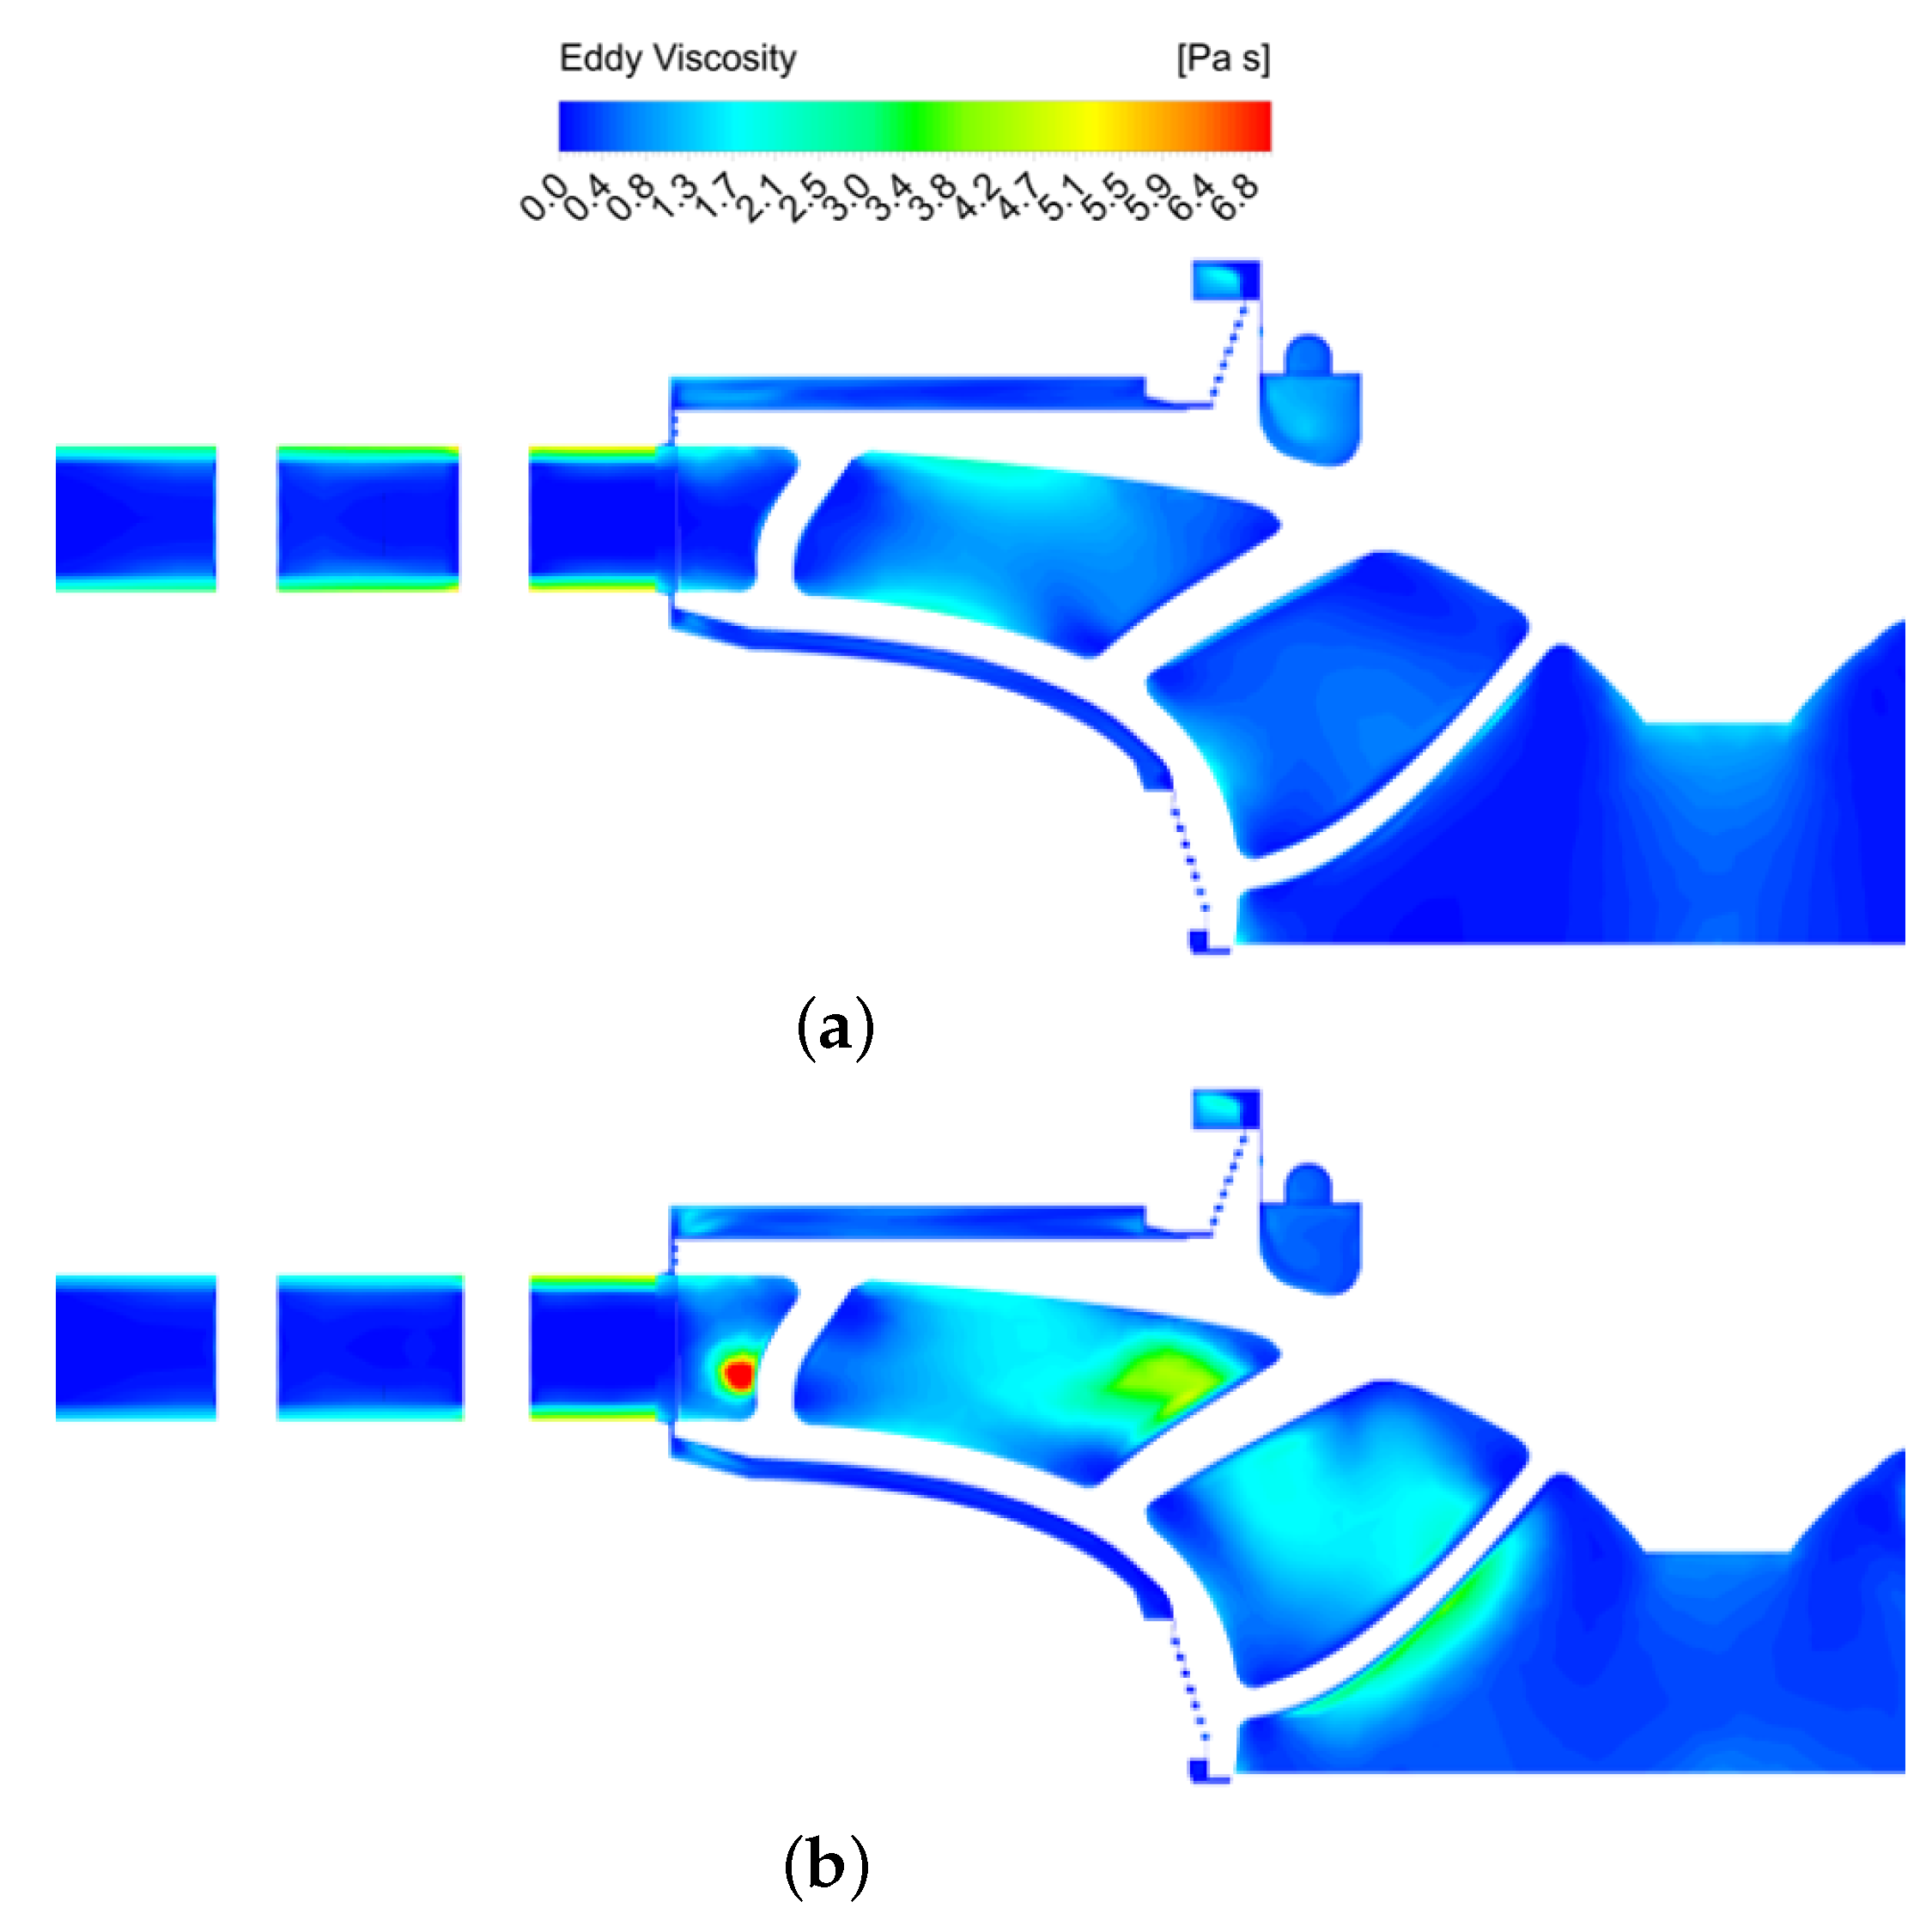
4.1. Flow Characteristics of Unit

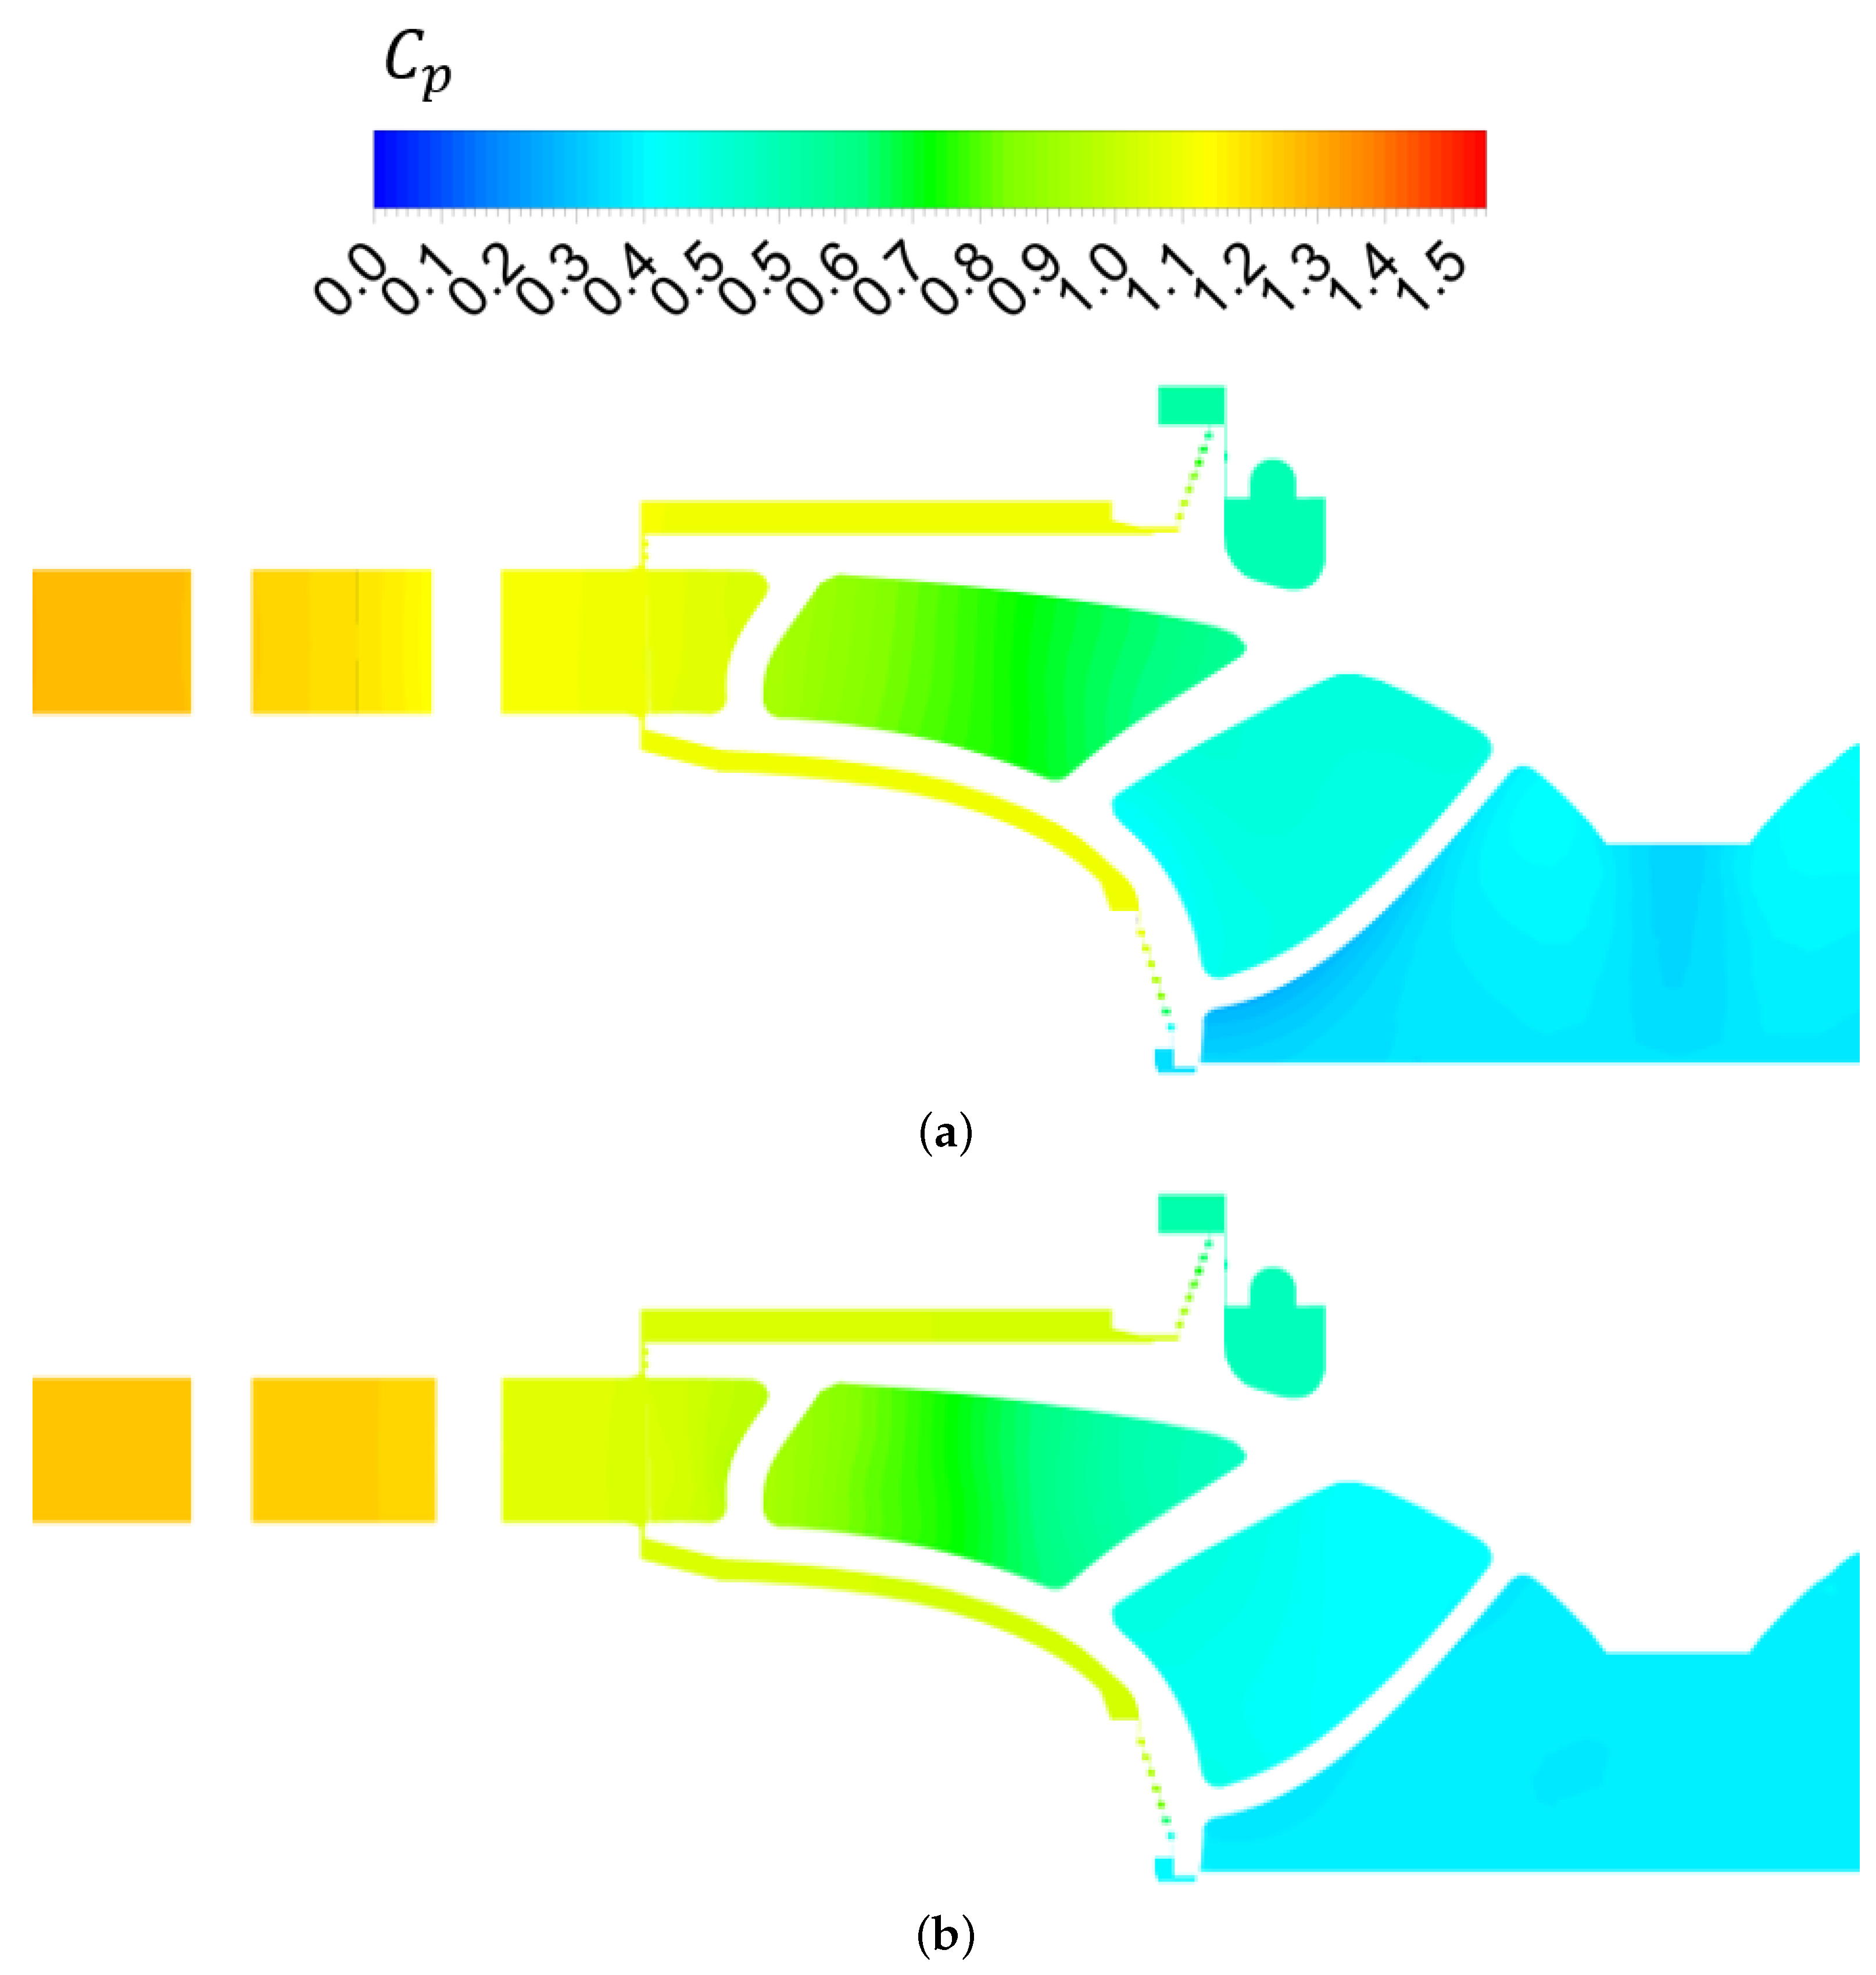
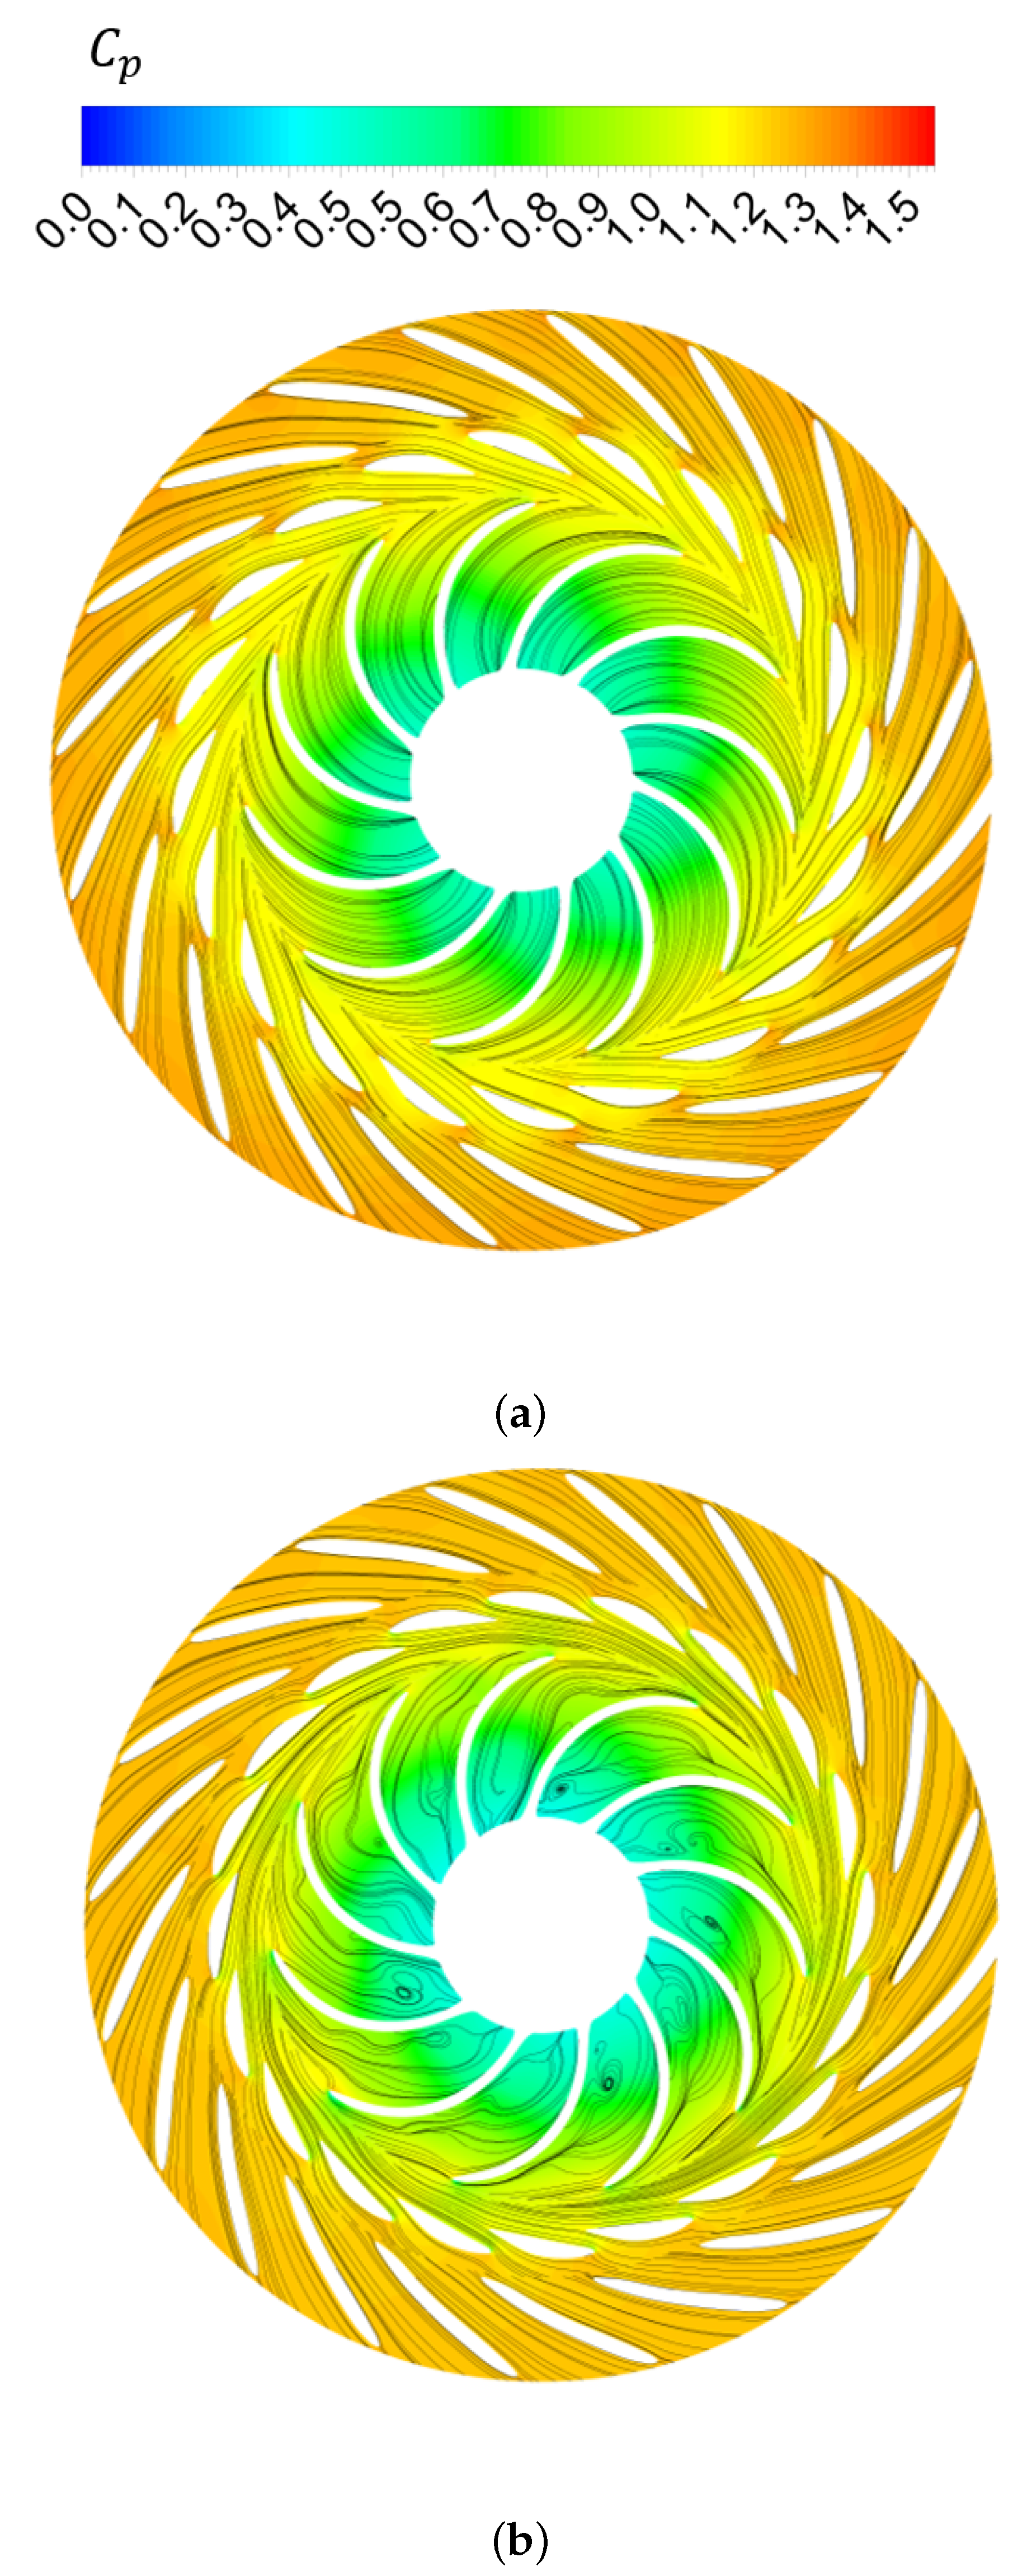
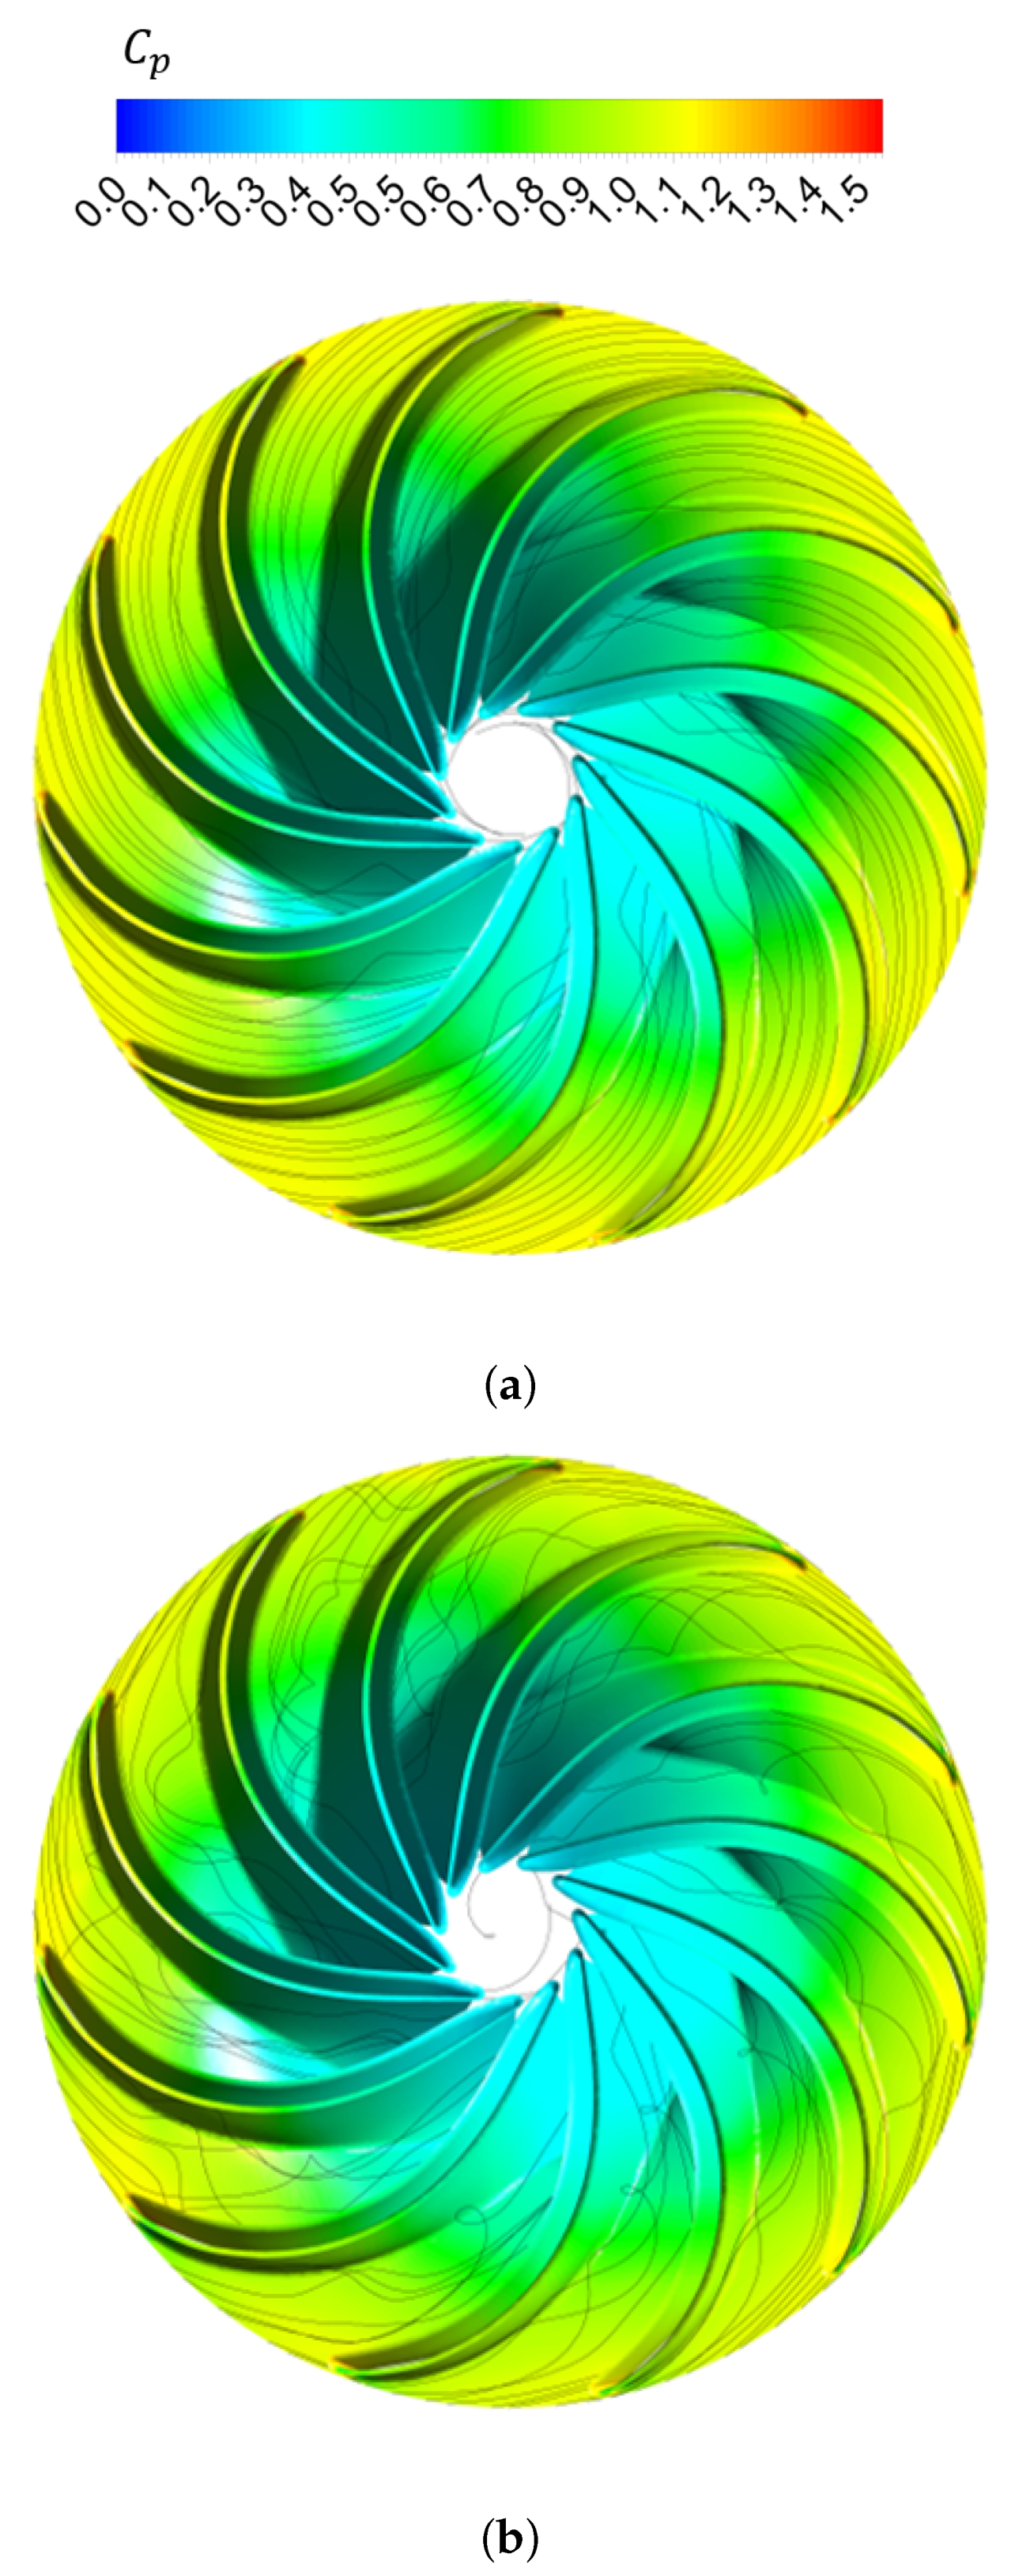
4.1.1. Pressure Change in the Flow Passages

Define the relative pressure coefficient  C p  as follows:
C p = p ρ g H r
Figure 6 provides the  C p  distribution of the stay vanes, guide vanes, the runner, and the clearance domains under the 100% and 50% load conditions. The operation conditions of 100% loading and 50% are at the rated head and same submergence depth, while the pressure at the stay vanes is basically the same. The pressure distribution from stay vanes to guide vanes is similar, which suggests that the change in guide vane opening angle does not cause additional energy loss in these areas. The differences in the pressure distribution in the runner are significant. The  C p  and streamline distribution are shown in Figure 7 and Figure 8.
As the guide vanes opening angle decreases from the rated opening angle to half of it, the tangential velocity of the flow at the outlet of the guide vanes increases, which forms a water ring in the vaneless space. The water ring blocks smooth flow and reduces the flow rate at the 50% load condition. As it can be seen from the vortex intensity distribution in Figure 9, the vortex characteristics before the outlet of the guide vanes are similar, which indicates that the energy loss of disturbances in these regions has little relationship with the guide vanes’ opening angle. However, the vortices in the runner and clearances are significantly stronger at the 50% load condition. The vortices in the clearances cause a decrease in pressure and additional pressure fluctuation components. The flow separation, backflow and vortex structure are generated in the runner passages, resulting in irregular low-pressure zones and reducing efficiency and power output.
The Q criterion is used to identify the vortex zone of the runner, and the Q value is set to 5 ×  10 3  s 2 . As shown in Figure 10, due to the change in flow direction caused by the adjustment of the guide vanes, significant vortices are generated at the inlet side of several runner blades at the 50% load condition. The circumferential distribution of the vortices indicates that it leads to differences in the time–frequency distribution of pressure fluctuations, resulting in different structural excitations. The following section will discuss this phenomenon in detail.

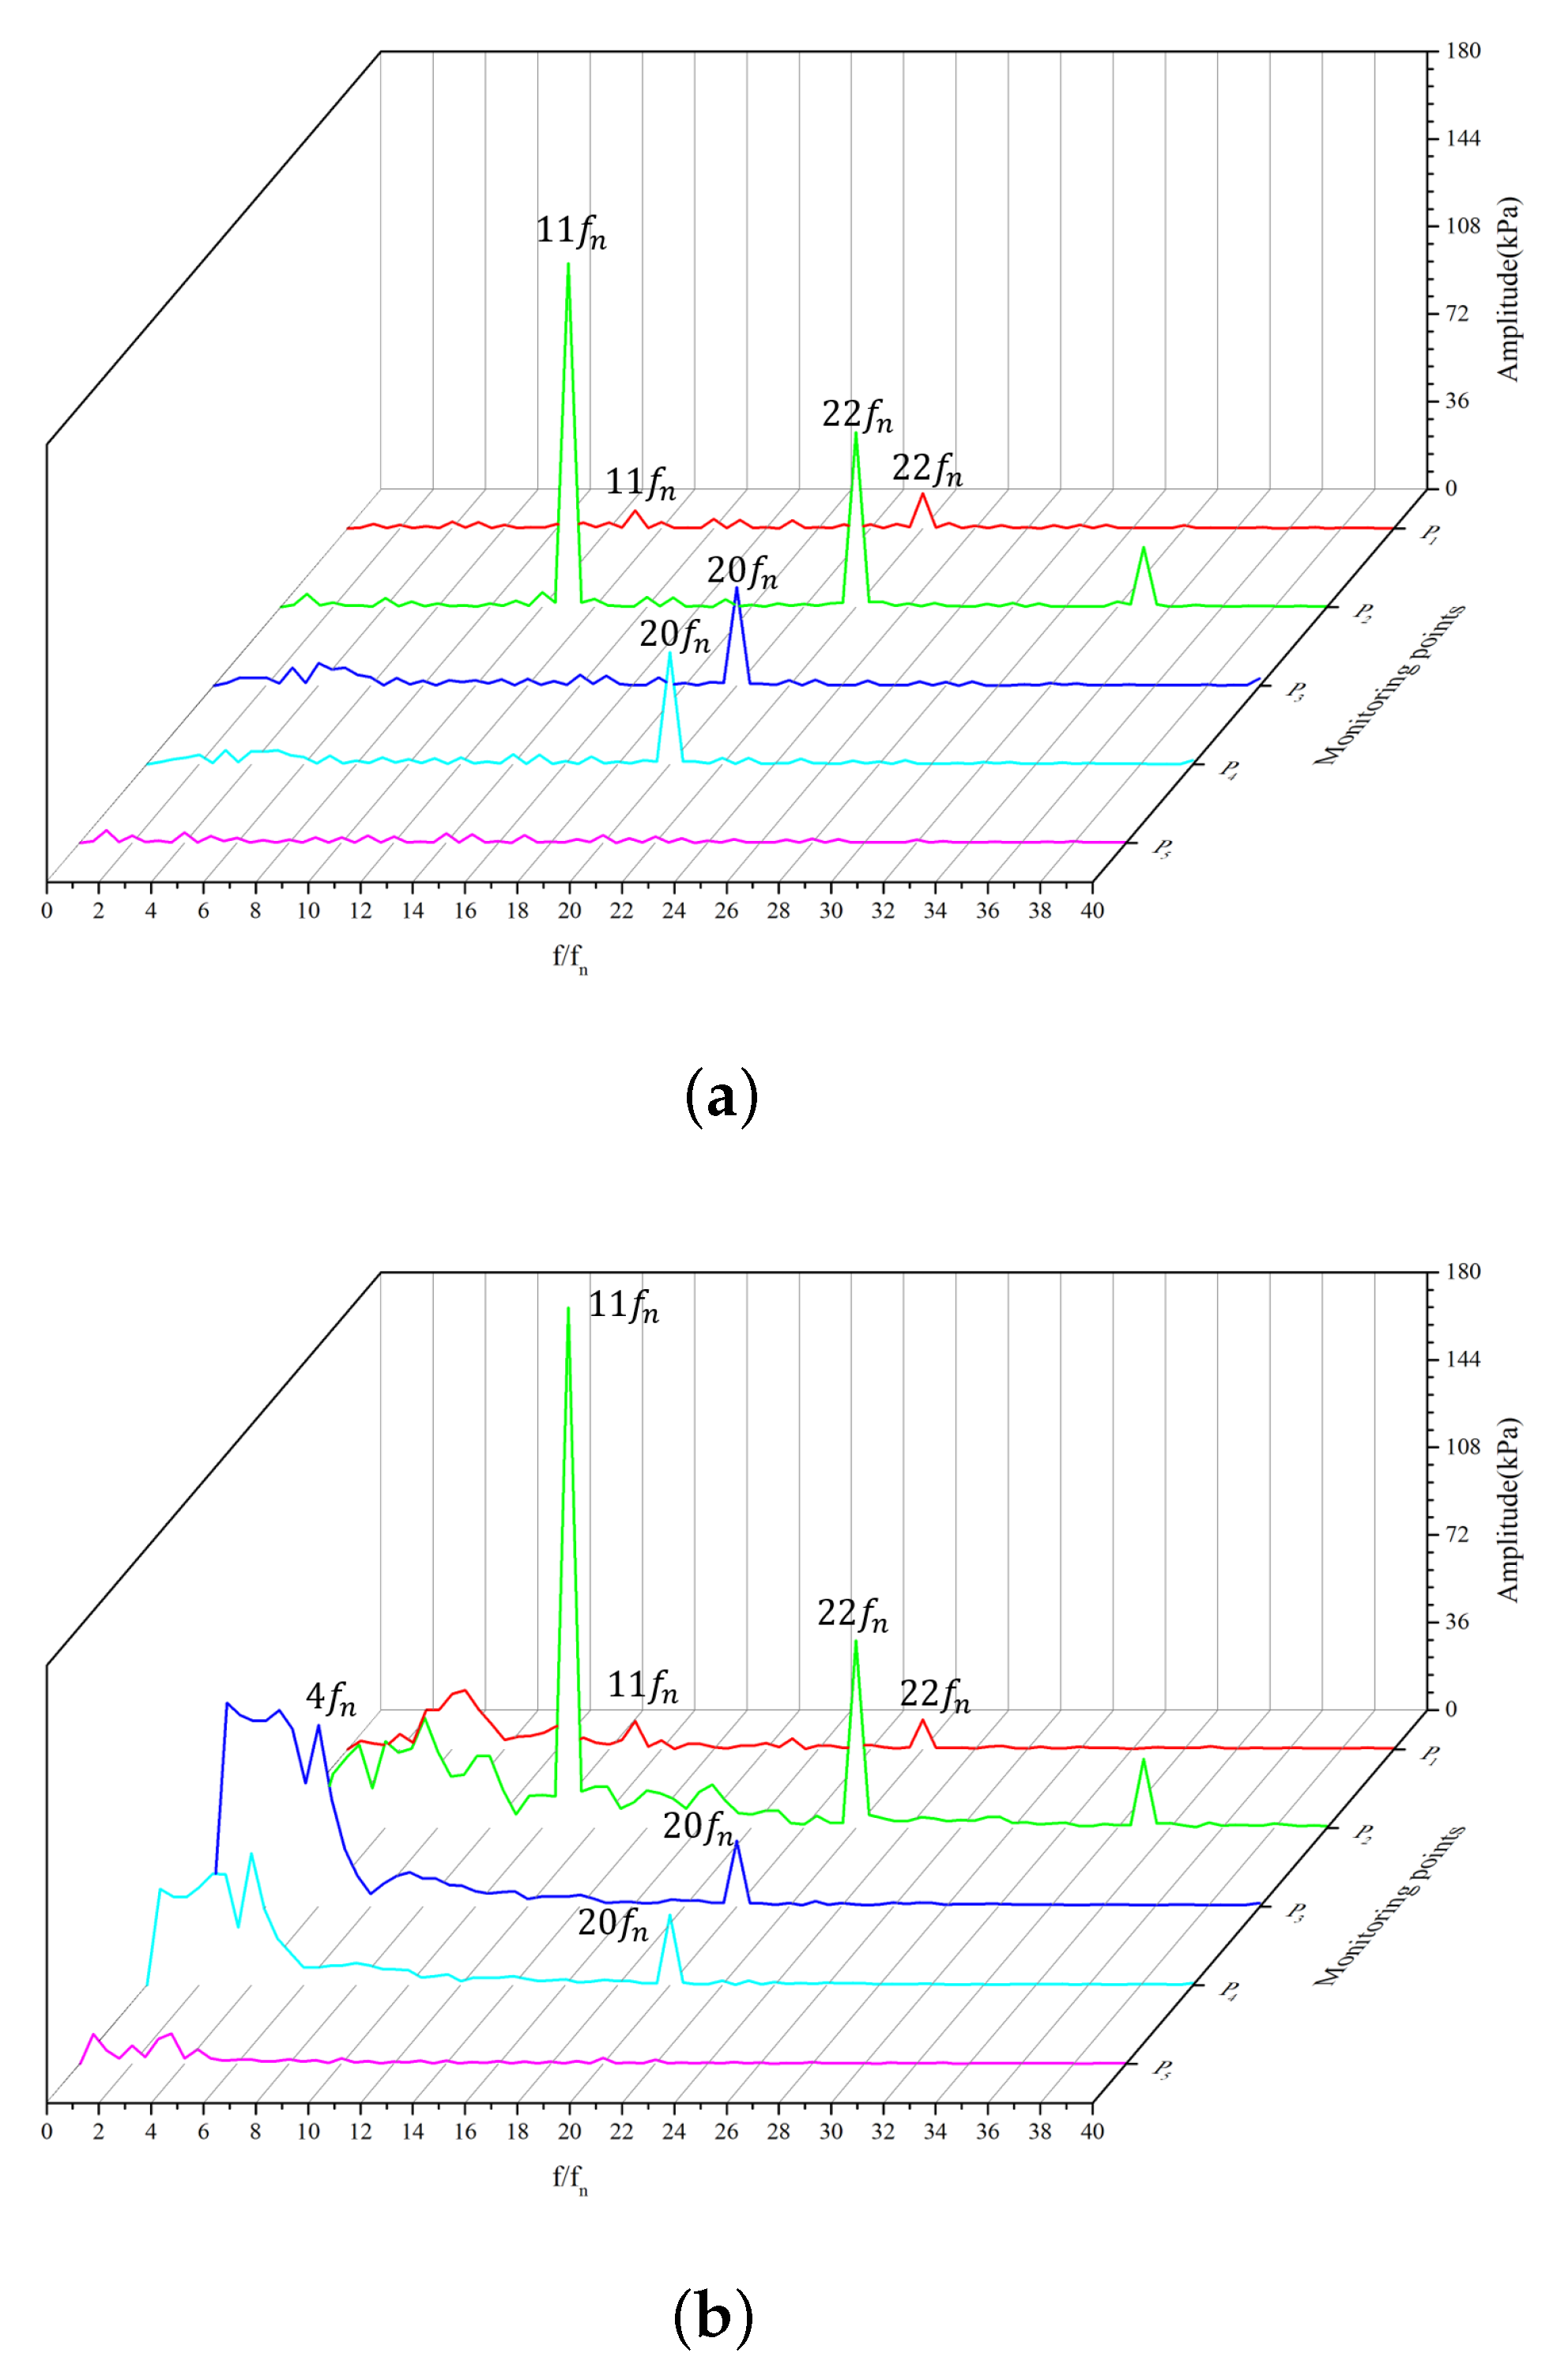
4.1.2. Pressure Fluctuation Characteristics

Figure 11 shows the distribution of monitoring points in the flow domain, where  P 1  is located at the outlet side of the stay vanes,  P 2  is located in the vaneless space,  P 3  and  P 4  are located at the inlet side of the runner blades, and  P 5  is located at the outlet side of the runner blades.
Figure 12 shows the main pressure fluctuation frequency of  P 1  and  P 2  as 11  f n  and its multiple conversions under the influence of RSI by the 11 runner blades. The main pressure fluctuation frequency of  P 3  and  P 4  is 20  f n  under the influence of RSI by the 20 guide vanes. The dominant pressure fluctuation frequency of  P 5  is  f n  since the influence of RSI is weakened at the runner outlet.
Comparing the two conditions, the low-frequency components of pressure fluctuation at the 50% load condition are significantly increased, especially at monitoring point  P 3 . It can be explained from Figure 9 and Figure 10 that the vortices at the bottom of the inlet side of the runner blades represent a fluctuation frequency of 4  f n  and cause pressure changes to transfer upstream and downstream. There are also differences in fluctuation amplitude, which is due to changes in the flow direction of the runner inlet affecting the pressure distribution in the high-pressure zone of the runner blades flow.

4.2. Structural Characteristics of the Stationary Components

The pressure load obtained through flow field simulation is mapped onto the structural field. Gravity, elastic support of the bearing and fixed constraints are applied to the surface of the structure, and stresses and deformations are calculated. The diagram of boundary conditions for stationary components is shown in Figure 13.

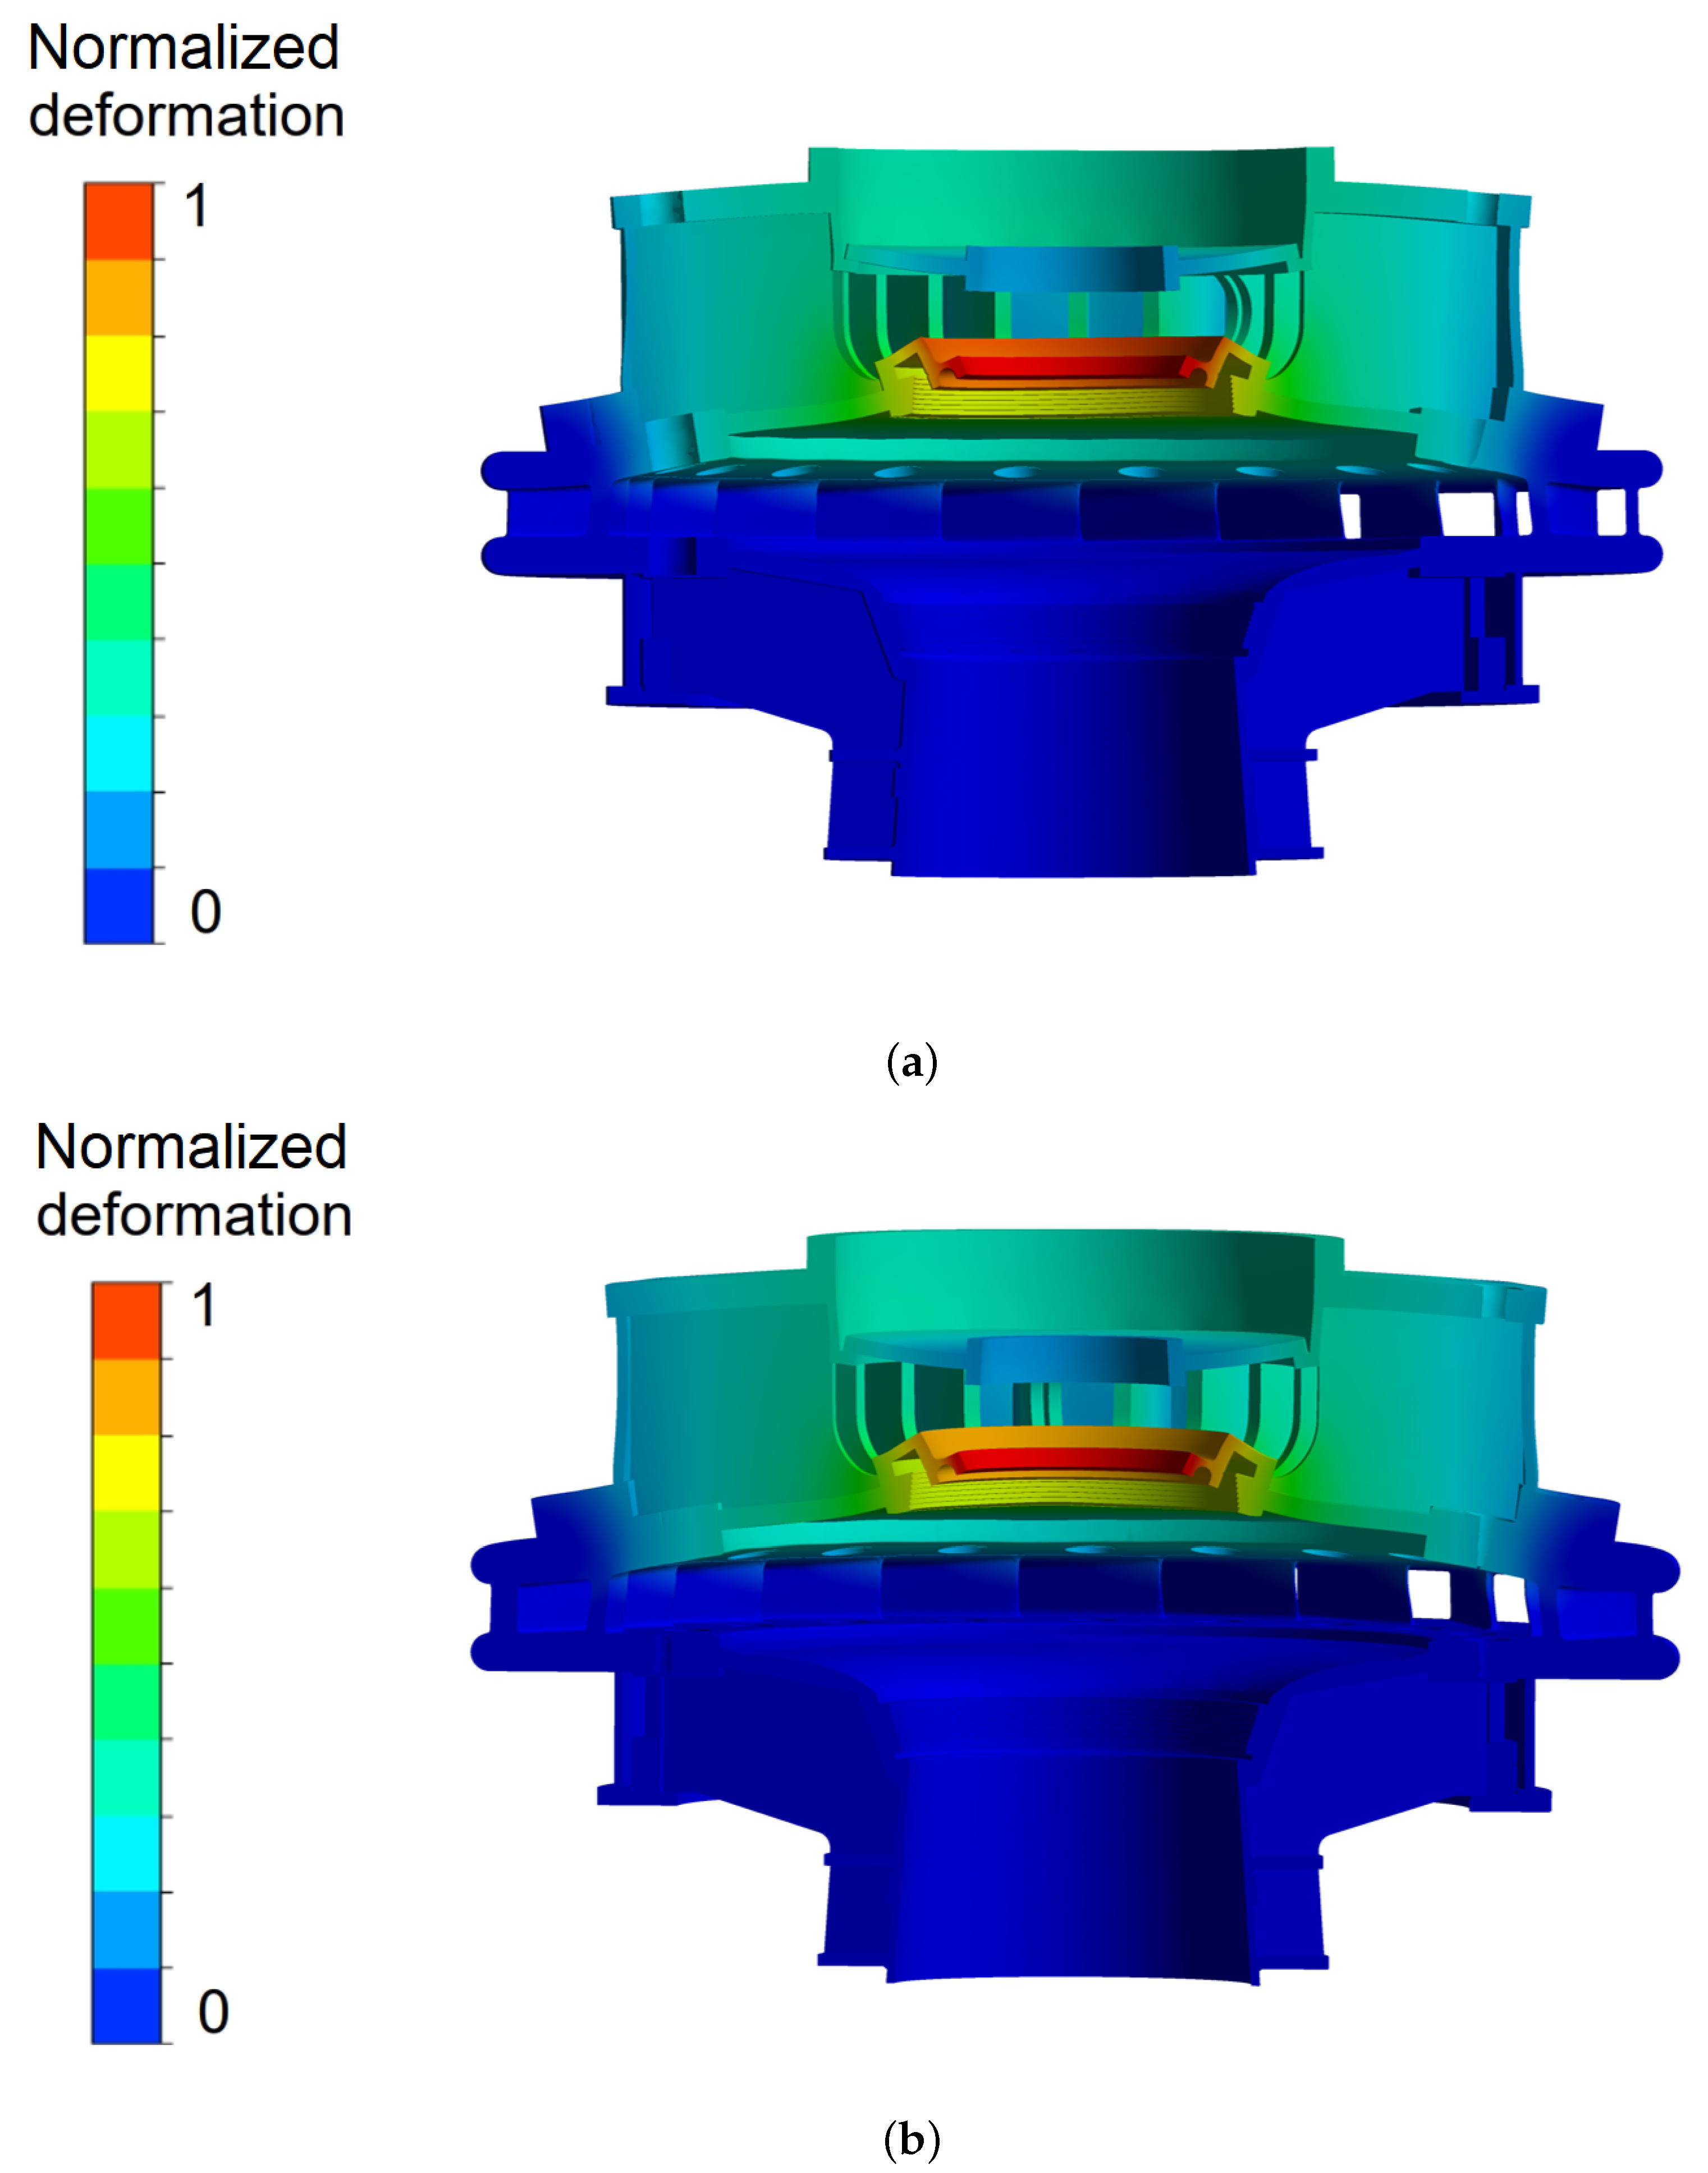
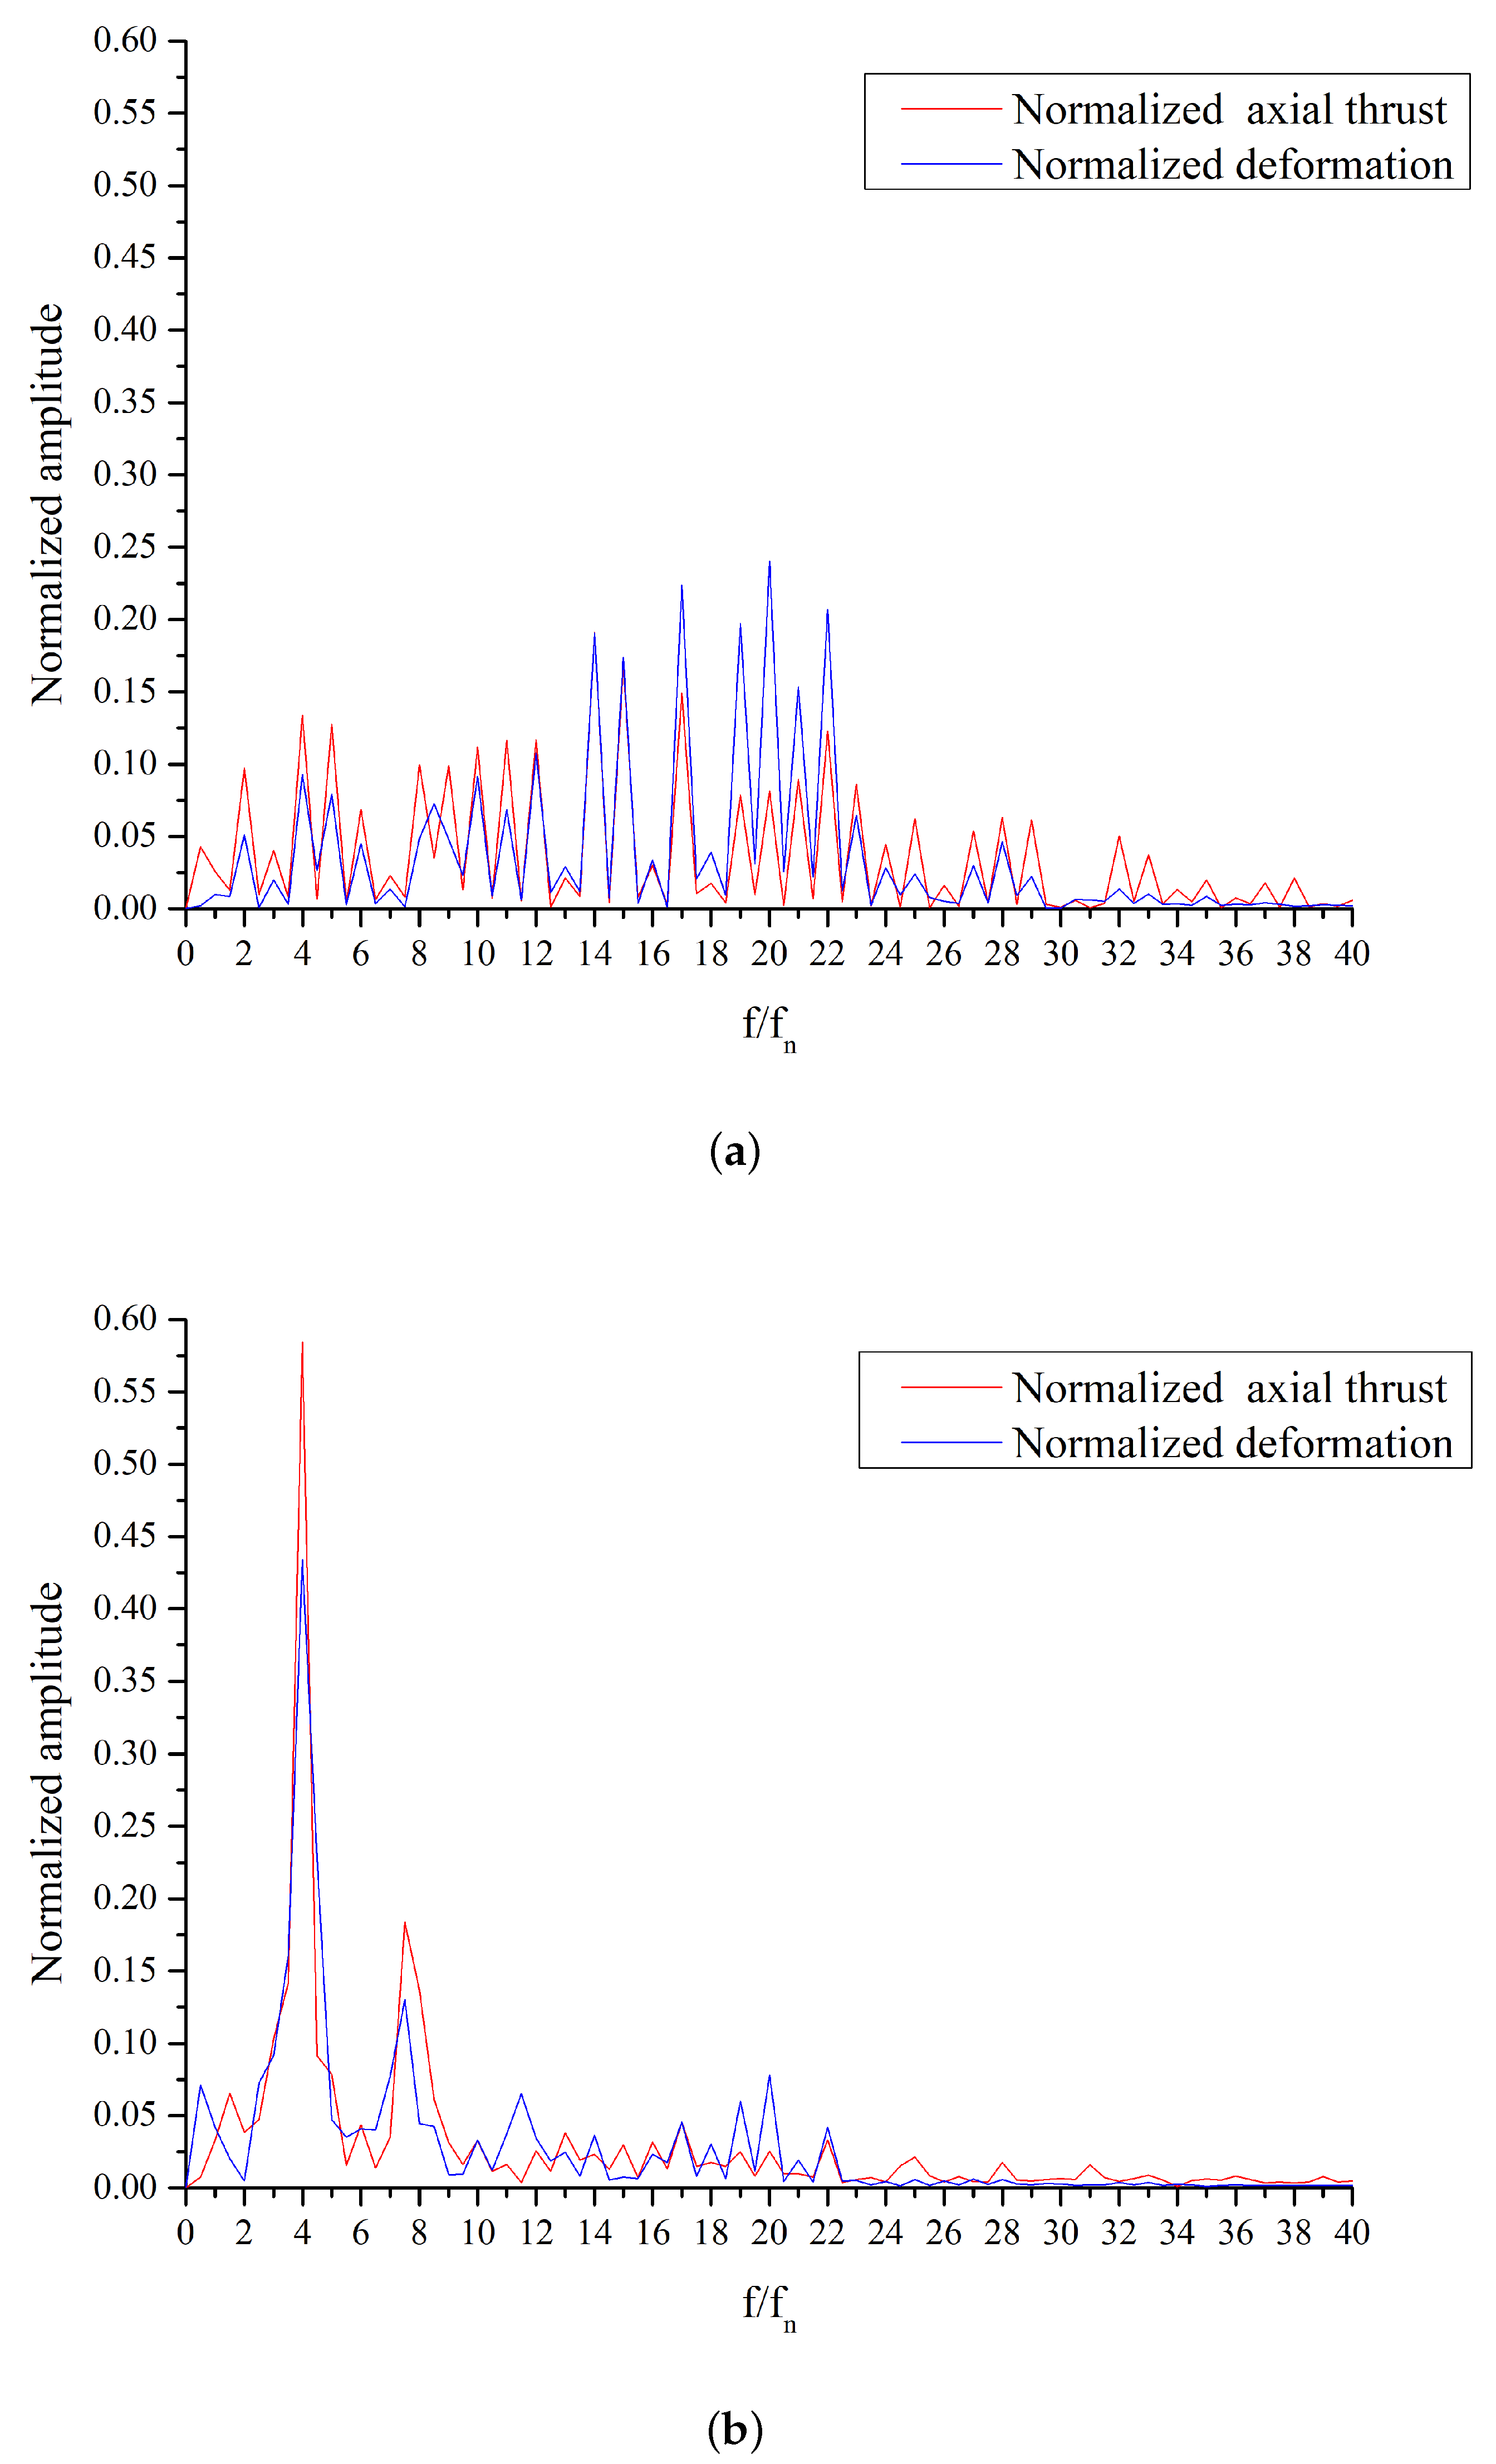
4.2.1. Deformation Characteristics

The deformation distribution of the unit stationary components is shown in Figure 14. The deformation distribution patterns of the two working conditions are consistent, and the maximum displacement is close. Since the bottom ring and the lower part of the stay ring are constrained by the concrete of the powerhouse building, the deformation caused by downward fluid pressure is relatively small. The maximum deformation occurs at the inner side of the head cover, which is the source of noise and vibration of the pump-turbine unit.
As shown in Figure 15 and Figure 16, the normalized deformation of the inner head cover and the normalized axial thrust of the head cover exhibit consistent variation patterns, indicating that upward fluid pressure is the main reason for the displacement of the head cover. Due to the overall linear elasticity of the structure, the upward thrust load and deformation are close to a linear relationship. At 100% load condition, the frequency of axial thrust fluctuation and vibration deformation is relatively dispersed, while at the 50% load condition, there is a clear dominant fluctuation frequency of 4  f n . Due to the vortex motion at 4  f n  frequency shown in Figure 12, it is speculated that the vortex inside the runner is the dominant factor in the deformation and fluid axial thrust distribution.

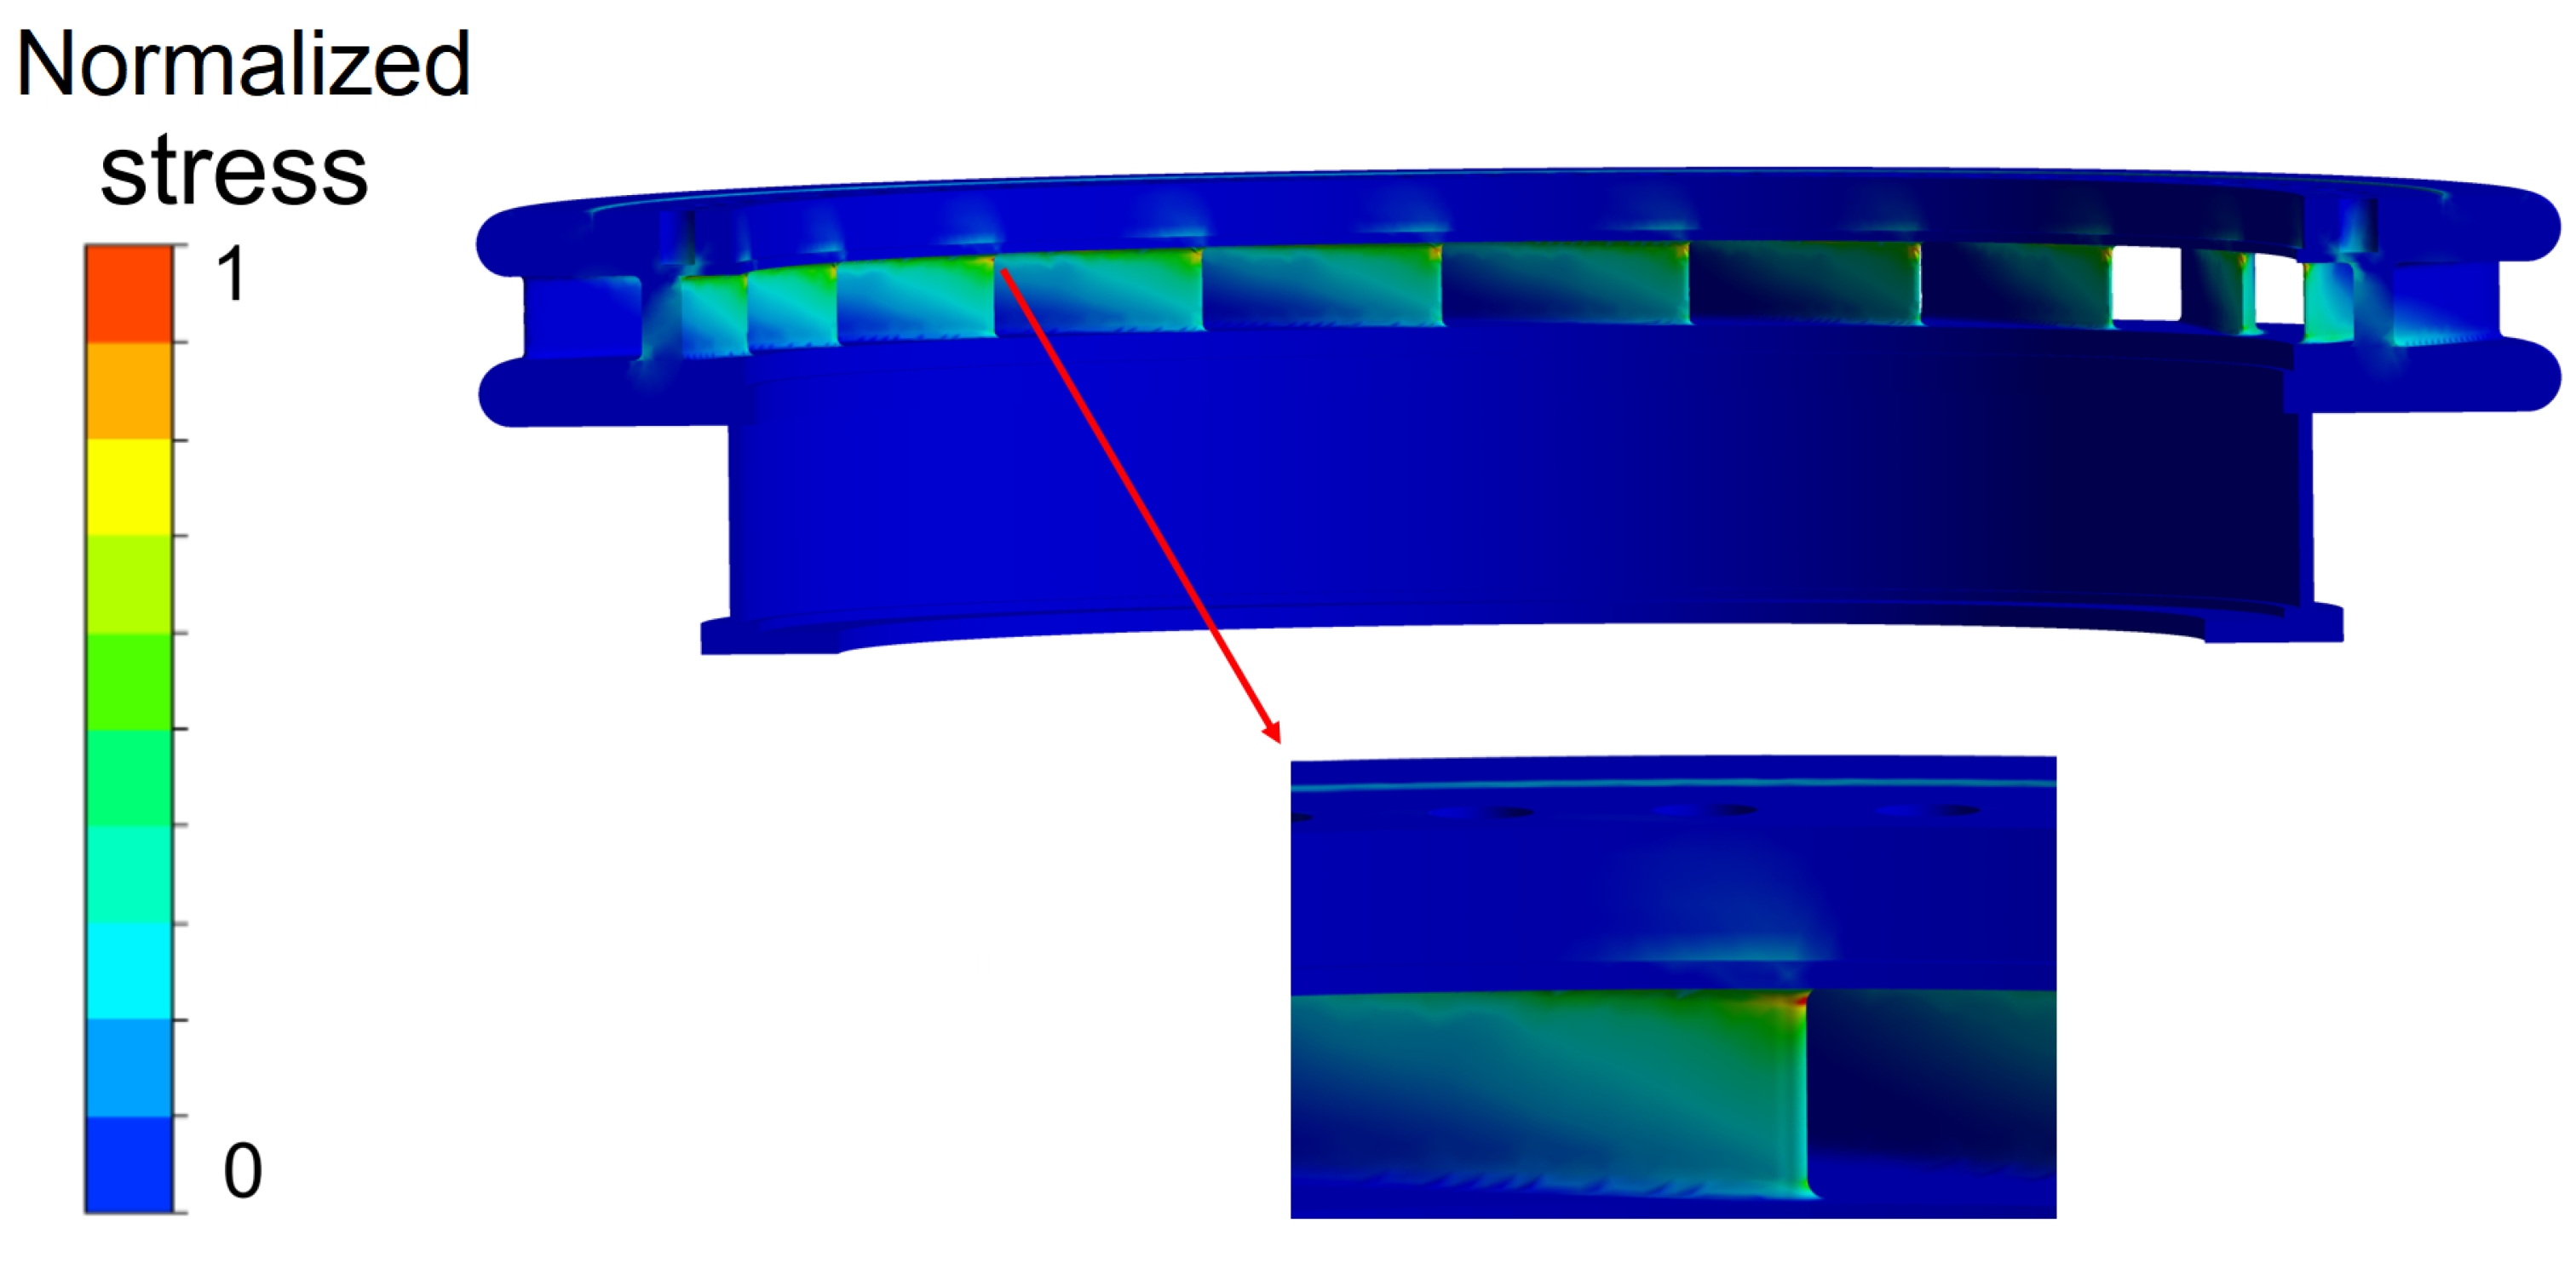
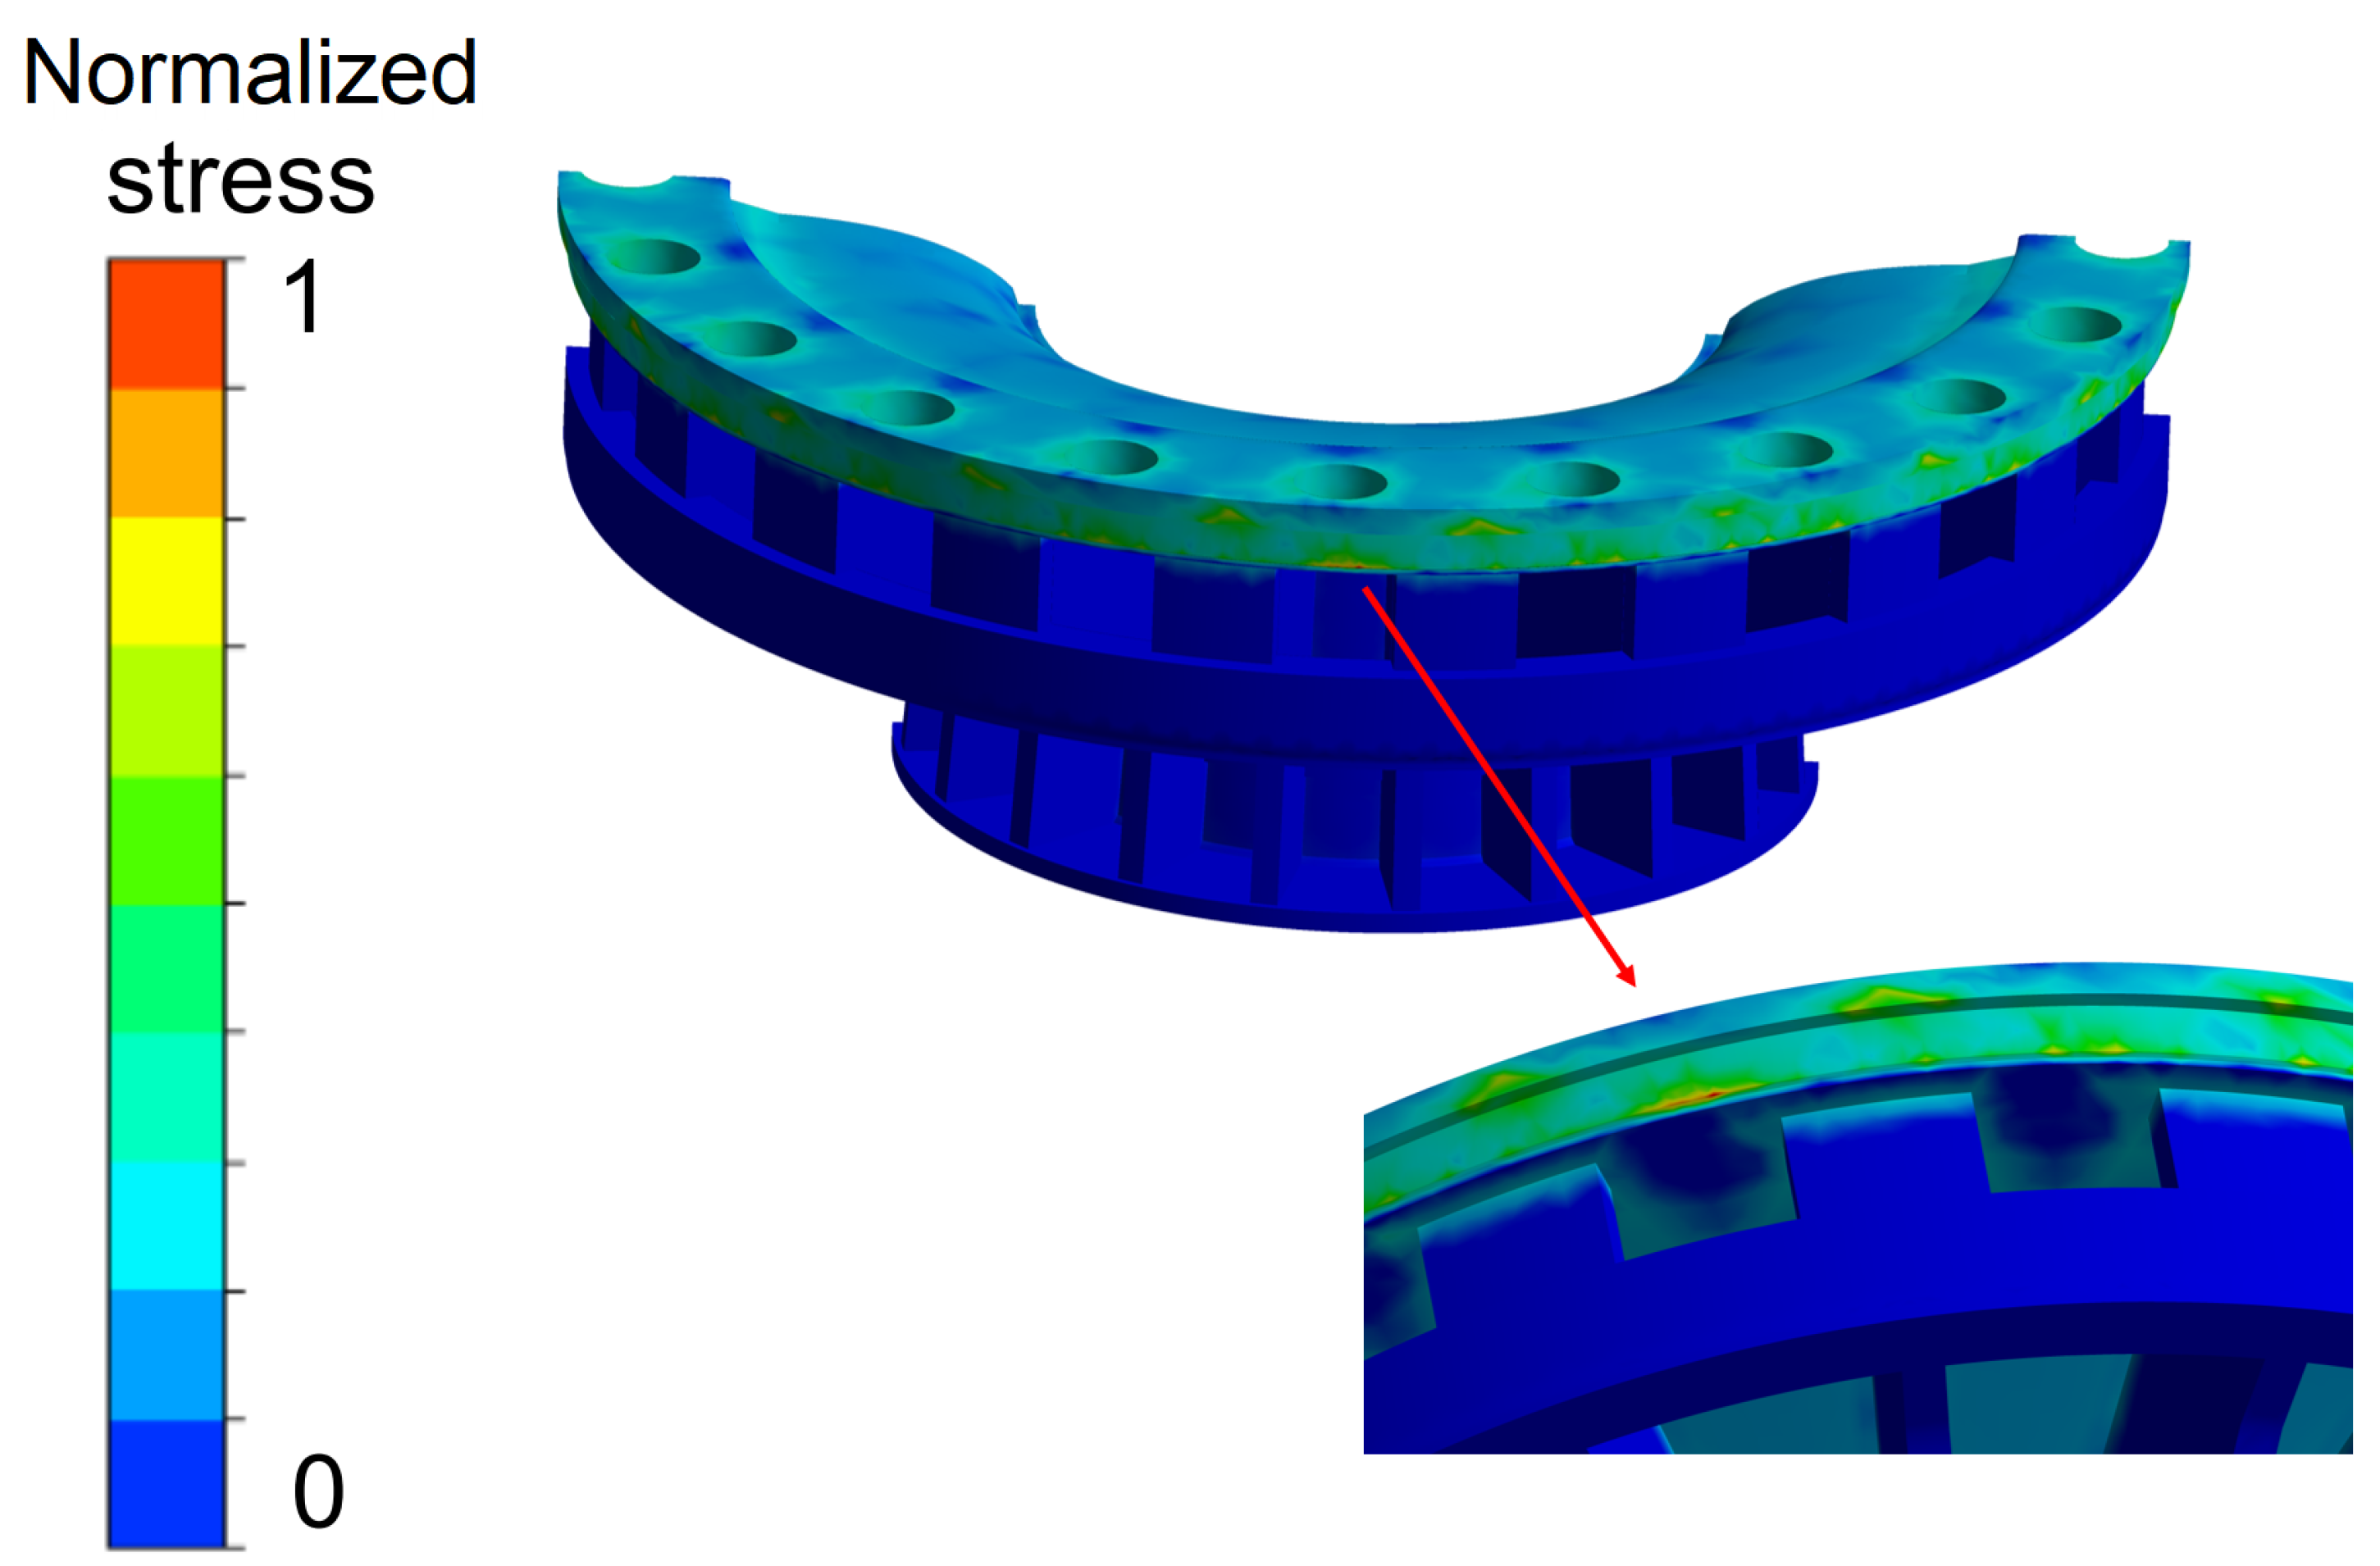
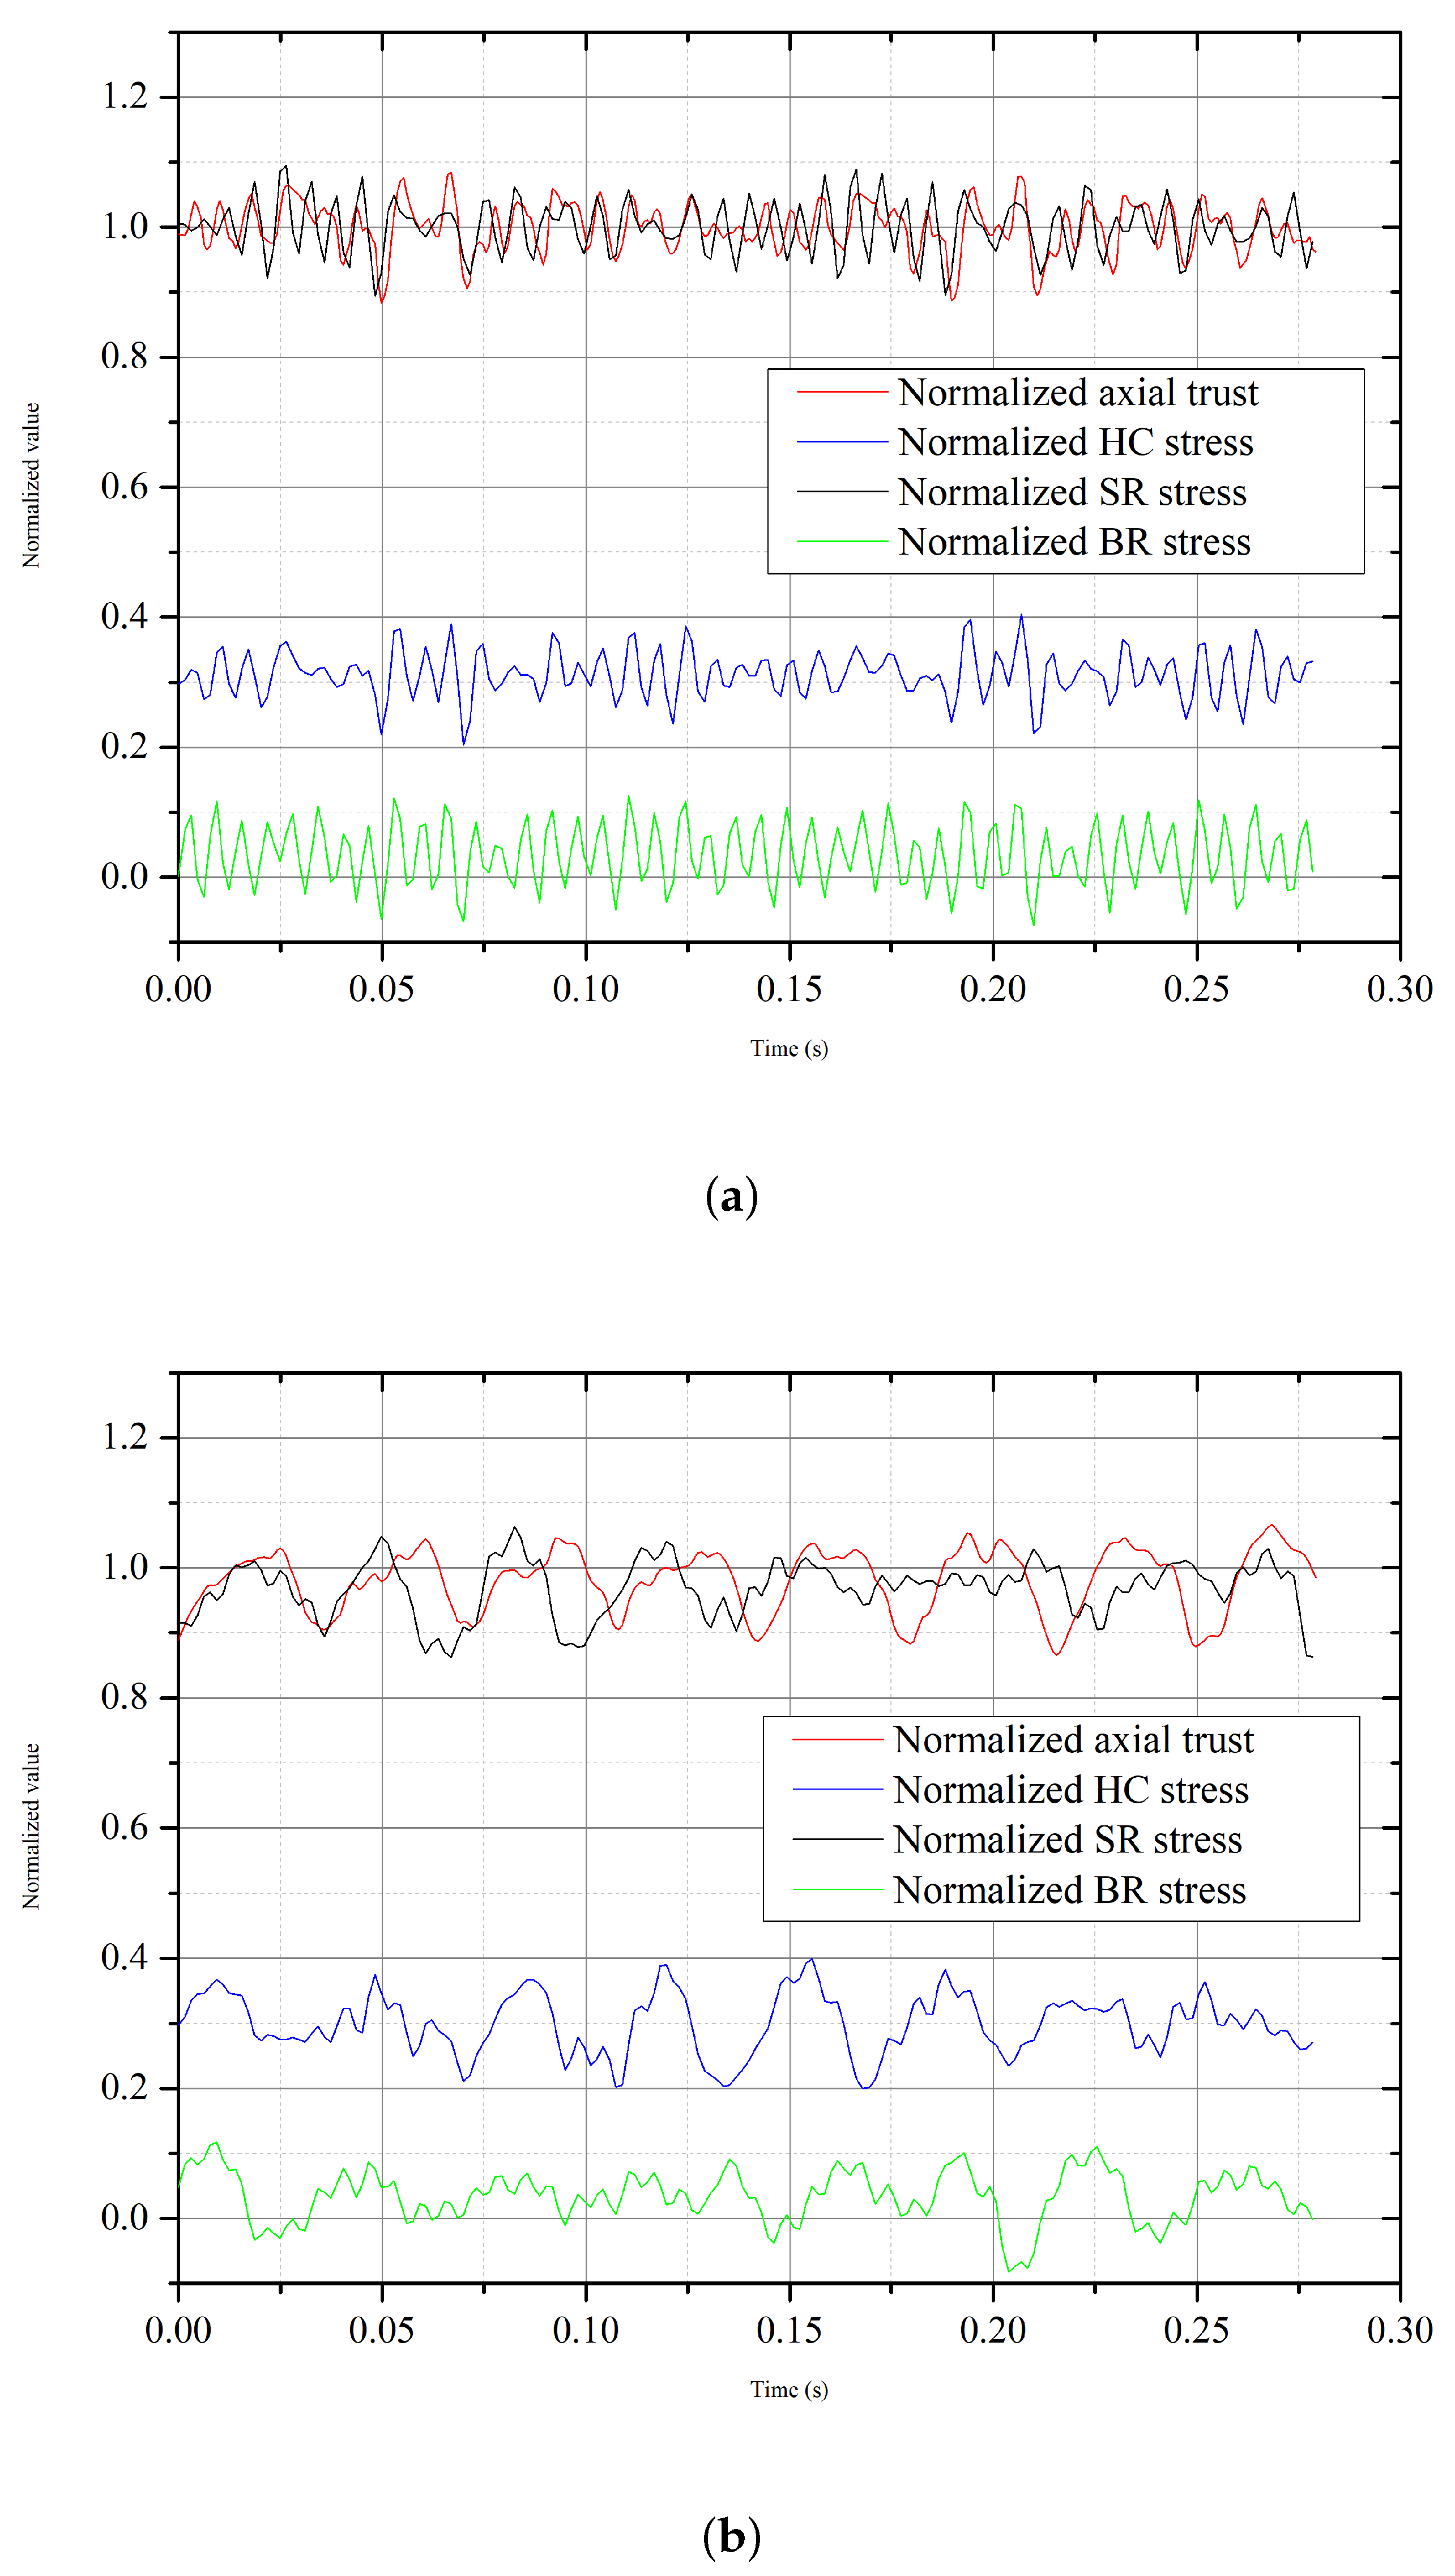
4.2.2. Stress Characteristics

As shown in Figure 17, the stress distribution of the two working conditions is similar. The head cover is axially supported by the stay ring, and the radial force is transmitted to the main axis by bearings. The stress distribution of the head cover is shown in Figure 18. The maximum value of  σ e  is located at the bottom of the reinforcing plates, where the maximum absolute value of principal stress is  σ 3 , indicating that it is subjected to compressive stress.
The upward hydraulic thrust is transmitted to the stay ring through the head cover, resulting in stress concentration at the rounded corners on the outlet side of the stay vane, as shown in Figure 19. Because the structure mainly bears tensile stress, the maximum absolute value of principal stress is  σ 1 . The maximum value of  σ e  is much larger than the value on the head cover due to the need to balance almost all upward thrust for stay vanes, which means the stay vanes require higher tensile strength materials.
Most of the hydraulic thrust loaded onto the bottom ring is balanced by the concrete support, and therefore, the overall stress is relatively small. Figure 20 shows the stress distribution normalized by the maximum stress of the bottom ring.
The comparison of the upward thrust on the head cover and the normalized  σ e  of the stress concentration area on the stationary components is shown in Figure 21. The maximum value of  σ e  is located at the stay ring with the head cover approximately 0.3 times its value and the bottom ring 0.05 times its value. The trends of these parameters are basically the same, with only the bottom ring curve having a slight difference mainly due to the different components of fluid pressure loaded. The relationship between stress and deformation in Equation (4) suggests that if  u  does not change direction, the stress and displacement will maintain a linear relationship, which indicates that the structure exhibits a single vibration form throughout the condition.

5. Conclusions

This paper studied the flow characteristic and flow-induced structural behavior in a high head prototype pump-turbine during the 100% and 50% load conditions of the turbine mode. The conclusions follow.
From the special case to guide vanes flow passage, there is no significant difference in the flow characteristics between the two operating conditions. Under the RSI influence, the main pressure fluctuation frequency of the stay vanes and guide vanes area is 11  f n  and the main pressure fluctuation frequency of the runner area is 20  f n .
The decrease in the guide vane opening angle at the 50% load condition leads to an increase in the flow tangential velocity at the guide vanes outlet and the formation of a water ring in the vaneless space. Flow separation, reflux and vortex structures are generated in the flow channel, resulting in irregular low-pressure zones that reduce efficiency and power output. The vortex generated at the bottom of the inlet side of the runner blades makes the low-frequency components 4  f n  of pressure fluctuation significantly increase. The vortex frequency at 4  f n  affects the axial hydraulic thrust at the 50% load condition and causes deformation and stress to exhibit corresponding dominant frequencies.
The vibration deformation patterns and the stress distribution of stationary components caused by pressure load in the two conditions are similar. The maximum deformation occurs at the inner head cover. The maximum value of stress is located at the stay ring with the head cover approximately 0.3 times its value and the bottom ring 0.05 times its value. The maximum stress of the head cover occurs at the bottom of the reinforcing plates. The maximum stress of the stay ring occurs at the fillets on the outlet side of the stay vanes.
The normalized maximum deformation and maximum stress exhibit a similar pattern to the normalized axial thrust of the head cover, indicating that the upward fluid pressure is the main reason for structural response and the structure exhibits a single vibration form throughout the condition.
In this paper, the structure of the runner and the connected main shaft are not taken into consideration. Further work is needed to investigate their impact on the dynamic response.

Author Contributions

Conceptualization, X.H. and Z.W.; Investigation, S.R., S.Z., K.Z. and W.H.; Methodology, S.R. and S.Z.; Software, S.Z., K.Z. and W.H.; Supervision, Z.W.; Validation, S.R., S.Z. and X.H.; Writing—original draft, S.Z.; Writing—review and editing, S.R. and X.H. All authors have read and agreed to the published version of the manuscript.

Funding

This research was funded by the State Grid Xinyuan Company LTD. of China.

Data Availability Statement

Not applicable.

Conflicts of Interest

The authors declare no conflict of interest.

References

  1. Liu, X.; Luo, Y.; Wang, Z. A review on fatigue damage mechanism in hydro turbines. Renew. Sustain. Energy Rev. 2016, 54, 1–14. [Google Scholar] [CrossRef]
  2. Casanova, F.; Mantilla, C. Fatigue failure of the bolts connecting a Francis turbine with the shaft. Eng. Fail. Anal. 2018, 90, 1–13. [Google Scholar] [CrossRef]
  3. Egusquiza, E.; Valero, C.; Huang, X.; Jou, E.; Guardo, A.; Rodriguez, C. Failure investigation of a large pump-turbine runner. Eng. Fail. Anal. 2012, 23, 27–34. [Google Scholar] [CrossRef]
  4. Kuznetsov, N.; Yuldashev, M.; Yuldashev, R. Analytical-numerical analysis of closed-form dynamic model of Sayano-Shushenskaya hydropower plant: Stability, oscillations, and accident. Commun. Nonlinear Sci. Numer. Simul. 2021, 93, 105530. [Google Scholar] [CrossRef]
  5. He, L.Y.; Wang, Z.W.; Kurosawa, S.; Nakahara, Y. Resonance investigation of pump-turbine during startup process. IOP Conf. Ser. Earth Environ. Sci. 2014, 22, 032024. [Google Scholar] [CrossRef]
  6. Zhang, H.; Su, D.; Guo, P.; Zhang, B.; Mao, Z. Stochastic dynamic modeling and simulation of a pump-turbine in load-rejection process. J. Energy Storage 2021, 35, 102196. [Google Scholar] [CrossRef]
  7. Mao, X.; Chen, X.; Lu, J.; Liu, P.; Zhang, Z. Improving internal fluid stability of pump turbine in load rejection process by co-adjusting inlet valve and guide vane. J. Energy Storage 2022, 50, 104623. [Google Scholar] [CrossRef]
  8. Guo, P.C.; Zhang, H.; Sun, L.G. Transient dynamic analysis of a pump-turbine with hysteresis effect. Mod. Phys. Lett. B 2020, 34, 2050125. [Google Scholar] [CrossRef]
  9. Liu, J.T.; Wu, Y.L.; Li, Y. Numerical Predictions of Pressure Fluctuations in a Model Pump Turbine with Small Guide Vane Opening based on Partial Averaged Navier Stokes Approach. J. Appl. Fluid Mech. 2016, 9, 2661–2669. [Google Scholar] [CrossRef]
  10. Jacquet, C.; Fortes-Patella, R.; Balarac, L.; Houdeline, J.B. CFD Investigation of Complex Phenomena in S-Shape Region of Reversible Pump-Turbine. In Proceedings of the 28th IAHR Symposium on Hydraulic Machinery and Systems (IAHR), Grenoble, France, 4–8 July 2016. [Google Scholar] [CrossRef]
  11. Zhang, F.; Fang, M.; Tao, R.; Liu, W.; Gui, Z.; Xiao, R. Investigation of energy loss patterns and pressure fluctuation Spectrum for pump-turbine in the reverse pump mode. J. Energy Storage 2023, 72, 108275. [Google Scholar] [CrossRef]
  12. Shang, L.; Cao, J.; Jia, X.; Yang, S.; Li, S.; Wang, L.; Wang, Z.; Liu, X. Effect of Rotational Speed on Pressure Pulsation Characteristics of Variable-Speed Pump Turbine Unit in Turbine Mode. Water 2023, 15, 609. [Google Scholar] [CrossRef]
  13. Ono, K.; Tsuru, W.; Yokota, K. Influence of runner leading edge radius on the pump-turbine performance. J. Physics Conf. Ser. 2022, 2217, 012062. [Google Scholar] [CrossRef]
  14. Yuan, Z.; Zhang, Y.; Zhou, W.; Wang, C. Hydraulic loss analysis in a pump-turbine with special emphasis on local rigid vortex and shear. Phys. Fluids 2022, 34, 125101. [Google Scholar] [CrossRef]
  15. Fu, X.; Li, D.; Wang, H.; Zhang, G.; Wei, X. Cavitation mechanism in turbine runaway process of a pump-turbine. J. Hydraul. Res. 2022, 60, 750–769. [Google Scholar] [CrossRef]
  16. Liu, K.; Liu, Z.R.; Yang, Z.Y.; Zhang, X.X.; Tai, R.; Cheng, Y.G. Evolution and influence of pump-turbine cavitation during load rejection transients of a pumped-storage plant. J. Hydraul. Res. 2022, 60, 527–542. [Google Scholar] [CrossRef]
  17. Huang, X.; Oram, C.; Sick, M. Static and dynamic stress analyses of the prototype high head Francis runner based on site measurement. In Proceedings of the 27th IAHR Symposium on Hydraulic Machinery and Systems (IAHR), Montreal, QC, Canada, 22–26 September 2014. [Google Scholar] [CrossRef]
  18. Ciocan, G.D.; Iliescu, M.S.; Vu, T.C.; Nennemann, B.; Avellan, F. Experimental Study and Numerical Simulation of the FLINDT Draft Tube Rotating Vortex. J. Fluids Eng. 2006, 129, 146–158. [Google Scholar] [CrossRef]
  19. Ansari, B.; Aligholami, M.; Rostamzadeh Khosroshahi, A. An experimental and numerical investigation into using hydropower plant on oil transmission lines. Energy Sci. Eng. 2022, 10, 4397–4410. [Google Scholar] [CrossRef]
  20. Magnoli, M.V.; Necker, J. Simulation of pressure pulsations for pumped-storage units with wide operating range and comparison to experiments. In Proceedings of the 31st IAHR Symposium on Hydraulic Machinery and Systems, Trondheim, Norway, 26 June–1 July 2022. [Google Scholar]
  21. Yang, H.; He, Q.; Huang, X.; Yang, M.; Bi, H.; Wang, Z. Experimental and Numerical Investigation of Rotor-Stator Interaction in a Large Prototype Pump-Turbine in Turbine Mode. Energies 2022, 15, 5523. [Google Scholar] [CrossRef]
  22. Munch, C.; Ausoni, P.; Braun, O.; Farhat, M.; Avellan, F. Fluid-structure coupling for an oscillating hydrofoil. J. Fluids Struct. 2010, 26, 1018–1033. [Google Scholar] [CrossRef]
  23. Benra, F.K.; Dohmen, H.J. Comparison of pump impeller orbit curves obtained by measurement and FSI simulation. In Proceedings of the Joint Conference of the ASME Pressure Vessels and Piping Division/8th International Conference on Creep and Fatigue at Elevated Temperatures, San Antonio, TX, USA, 22–26 July 2007; pp. 41–48. [Google Scholar]
  24. Li, D.Y.; Gong, R.Z.; Wang, H.J.; Wei, X.Z.; Liu, Z.S.; Qin, D.Q. Analysis of Rotor-Stator Interaction in Turbine Mode of a Pump-Turbine Model. J. Appl. Fluid Mech. 2016, 9, 2559–2568. [Google Scholar] [CrossRef]
  25. Jiang, Y.Y.; Yoshimura, S.; Imai, R.; Katsura, H.; Yoshida, T.; Kato, C. Quantitative evaluation of flow-induced structural vibration and noise in turbomachinery by full-scale weakly coupled simulation. J. Fluids Struct. 2007, 23, 531–544. [Google Scholar] [CrossRef]
  26. He, Q.; Huang, X.; Yang, M.; Yang, H.; Bi, H.; Wang, Z. Fluid-Structure Coupling Analysis of the Stationary Structures of a Prototype Pump Turbine during Load Rejection. Energies 2022, 15, 3764. [Google Scholar] [CrossRef]
  27. Huang, X.; Chen, L.; Wang, Z.; Li, H.; Chen, S.; Hu, K.; Li, C.; Qiu, L. Stress Characteristic Analysis of Pump-Turbine Head Cover Bolts during Load Rejection Based on Measurement and Simulation. Energies 2022, 15, 9496. [Google Scholar] [CrossRef]
  28. Luo, Y.; Wang, Z.; Zhang, J.; Zeng, J.; Lin, J.; Wang, G. Vibration and fatigue caused by pressure pulsations originating in the vaneless space for a Kaplan turbine with high head. Eng. Comput. 2013, 30, 448–463. [Google Scholar] [CrossRef]
  29. Mao, Z.; Tao, R.; Chen, F.; Bi, H.; Cao, J.; Luo, Y.; Fan, H.; Wang, Z. Investigation of the Starting-Up Axial Hydraulic Force and Structure Characteristics of Pump Turbine in Pump Mode. J. Mar. Sci. Eng. 2021, 9, 158. [Google Scholar] [CrossRef]
Figure 1. Flow domain model of pump-turbine.
Processes 11 02970 g001
Figure 2. The flow domain mesh of the pump-turbine unit. (a) Runner; (b) Guide vanes; (c) Crown chamber; (d) Band chamber.
Processes 11 02970 g002
Figure 3. Fluid mesh independence analysis.
Processes 11 02970 g003
Figure 4. Structural mesh of the pump-turbine unit.
Processes 11 02970 g004
Figure 5. Mesh sensitivity study.
Processes 11 02970 g005
Figure 6. Longitudinal section view of  C p  distribution. (a) 100% load condition; (b) 50% load condition.
Processes 11 02970 g006
Figure 7. Cross-section view of  C p  and streamlines distribution. (a) 100% load condition; (b) 50% load condition.
Processes 11 02970 g007
Figure 8. C p  and streamlines distribution in runner domain. (a) 100% load condition; (b) 50% load condition.
Processes 11 02970 g008
Figure 9. Longitudinal section view of Eddy viscosity distribution. (a) 100% load condition; (b) 50% load condition.
Processes 11 02970 g009
Figure 10. Vortex zone of the runner. (a) 100% load condition; (b) 50% load condition.
Processes 11 02970 g010aProcesses 11 02970 g010b
Figure 11. Diagram of monitoring points distribution.
Processes 11 02970 g011
Figure 12. The pressure fluctuation of the monitoring points. (a) 100% load condition; (b) 50% load condition.
Processes 11 02970 g012
Figure 13. Diagram of boundary conditions for stationary components.
Processes 11 02970 g013
Figure 14. The deformation distribution of the unit stationary components. (a) 100% load condition; (b) 50% load condition.
Processes 11 02970 g014
Figure 15. Normalized time−domain deformation and fluid axial thrust. (a) 100% load condition; (b) 50% load condition.
Processes 11 02970 g015
Figure 16. Normalized frequency−domain deformation and fluid axial thrust. (a) 100% load condition; (b) 50% load condition.
Processes 11 02970 g016
Figure 17. The stress distribution of the unit stationary components. (a) 100% load condition; (b) 50% load condition.
Processes 11 02970 g017
Figure 18. The stress distribution of the head cover.
Processes 11 02970 g018
Figure 19. The stress distribution of the stay ring.
Processes 11 02970 g019
Figure 20. The stress distribution of the bottom ring.
Processes 11 02970 g020
Figure 21. The comparison of the normalized thrust and stress. (a) 100% load condition; (b) 50% load condition.
Processes 11 02970 g021
Table 1. Main parameters of the pump-turbine unit.
ParameterUnitValue
Rated head  H r m545
Rated rotational speed  N r rpm428.6
Rated output at rated head  P r MW357.1
Rated rotational frequency  f n Hz7.14
Number of guide vanes-20
Number of stay vanes-20
Number of runner blades-11
Table 2. Element number of flow domains.
Flow DomainElements ( × 10 6 )
Spiral case0.32
Stay vanes0.12
Guide vanes0.25
Runner1.08
Draft tube0.21
Crown chamber0.48
Band chamber0.10
Pressure-balanced pipes0.40
Total2.96
Disclaimer/Publisher’s Note: The statements, opinions and data contained in all publications are solely those of the individual author(s) and contributor(s) and not of MDPI and/or the editor(s). MDPI and/or the editor(s) disclaim responsibility for any injury to people or property resulting from any ideas, methods, instructions or products referred to in the content.

