Article

Calibration and Experiments on the Parameters of the Bonding Particle Model of Eucommia ulmoides Oliver Samara Based on the Discrete Element Method

1
College of Mechanical and Electronic Engineering, Northwest A&F University, Xianyang 712100, China
2
Northwest Research Center of Rural Renewable Energy Exploitation and Utilization of M.O.A, Northwest A&F University, Xianyang 712100, China
3
Artificial Intelligence, Fan Gongxiu Honor College, Beijing University of Technology, Beijing 100124, China
*
Authors to whom correspondence should be addressed.
Processes 2023, 11(10), 2971; https://doi.org/10.3390/pr11102971
Submission received: 19 September 2023 / Revised: 4 October 2023 / Accepted: 9 October 2023 / Published: 13 October 2023

Abstract

:
The calibration of the discrete element model of EUO samara was conducted in response to the lack of discrete element simulation models and parameters in the development of mechanical hulling technology and equipment of EUO samara. The EUO samara was modeled based on the Hertz–Mindlin with bonding model, and its relevant parameters were measured by physical experiments. Among them, maximum shear force was used as the evaluation index, virtual calibration experiments were conducted for the bonding parameters by the single-factor experiments, and the two-level factorial experiment, the steepest climb experiment, and the Box–Behnken response surface experiment were also used. The results showed that the relative error between the simulated and measured maximum shear force is 0.93%; the model and parameter calibration results established by this research can be used for discrete element simulation research, which is of guiding significance for the research and development of hulling equipment of EUO samara.

Graphical Abstract

1. Introduction

Eucommia ulmoides Oliver (EUO) is a traditional medicinal resource in China; it is widely grown in many provinces in China, including Shaanxi, Sichuan, Yunnan, Guangxi, Zhejiang, and Guizhou [1]. As a part of EUO, the EUO samara shell is rich in EUO rubber, and its kernel is rich in EUO seed oil, which is widely used in the fields of national health, industrial raw materials, and medical devices and materials, and it has a high development value [2,3,4]. At present, the demand for EUO samara is urgent, but its industrialization is low. Generally, this is because EUO samara generally grows on arbor trees of 15–20 m in height, and most of these EUO trees are located in mountainous areas, making harvesting difficult. More importantly, the low degree of mechanization in the hulling and separation of EUO samara restricts its industrialization [5]. In order to improve the mechanization of hulling and separation of EUO samara, it is crucial to optimize the relevant equipment. The optimization process usually includes bench and simulation experiments. However, for agricultural equipment, optimization by simulation tests is easier to achieve and more economical [6].
Recently, the application of the discrete element method (DEM) and its simulation software in the field of agriculture has provided a new way to study the contact characteristics between agricultural materials and machinery components, which has contributed to the development of agricultural machinery [7,8]. In general, parameter calibration and discrete element modeling of the target material are essential aspects of discrete element simulation. The agricultural material parameters mainly consist of geometric parameters, contact property parameters, and mechanical property parameters [9]. Most of the material properties’ parameters can be directly measured or calculated by bench experiments, such as geometry, moisture content, density, Poisson’s ratio, modulus of elasticity, etc. [10]. However, contact property parameters, such as recovery of the coefficient and friction of the coefficient, and some mechanical property parameters are generally difficult to measure directly and often need to be calibrated by bench experiments combined with simulation experiments [11,12].
Normally, DEM calibration studies center on contact property parameters, and many researchers have completed calibrations of the coefficient of friction and coefficient of restitution for materials such as corn [13,14,15], wheat [16,17], rice [18,19], peanuts [20], soybeans [21], soil [22], and urea [23]. The calibration of these contact characteristics is based on the Hertz–Mindlin (no slip) model. The material model is considered as a whole in DEM, and the calibrated model can be used for simulation analysis and optimization design of transport, seeding, and other processes [24,25]. However, in processes that require the destruction of material such as hulling, a discrete element model that can be broken is required; this is when a bonding particle model (BPM) based on the Hertz–Mindlin with bonding principle is required [26]. The BPM uses a dense accumulation of circular particles of arbitrary size that are bonded together at the point of contact and simulated with DEM [27]. This model has been used to simulate rocks as a direct particle model approach to simulate inelastic deformation and fracture of rocks [28]. The BPM of rocks directly simulates the behavior of rocks like a complexly shaped particle cemented granular material, where both the particles and the cement are distortable and may be destroyed [29]. In principle, the principles of BPM can explain all of the aspects of the relevant behavioral mechanisms. The system is very accurate in predicting sudden behavior changes between particles and corresponds well to real application scenarios. It offers the possibility to study the microscopic mechanisms that generate these complex macroscopic behaviors and to predict them in DEM [30].
The particle-based part of the force–displacement behavior at each contact is described by six parameters, and a detailed description of the contact force–displacement calculation is provided in Figure 1a [31]. According to the theory of beams, the formulae for the maximum tensile and maximum shear stresses acting on the parallel bonded edges are as follows [32]:
σ ¯ m a x = F ¯ n A + M ¯ s R ¯ I
τ ¯ m a x = F ¯ n A + M ¯ n R ¯ I
If the maximum tensile stress exceeds the tensile strength σ ¯ m a x σ ¯ c or the maximum shear stress exceeds the shear strength τ ¯ m a x τ ¯ c , the parallel bonds break and are removed from the model along with their accompanying forces, bending moments, and stiffness. Based on these principles, the model can also be used to reveal the mechanism of action when the material and mechanical components come into contact, which can guide the development and design of the device. Zhang et al. [33] developed a discrete element model of water chestnut through reverse engineering techniques and calibrated the bonding parameters of the model, using the results to guide the design of water chestnut peeling and dicing equipment. Li et al. [10] calibrated the bonding parameters of corncobs by combining physical bending experiments and simulated bending experiments using a segmental modeling approach for corncobs. Liao et al. [34] addressed the simulation of the chopping aspect of mechanical harvesting of fodder rape by conducting a simulation experiment on the bending damage of fodder rape stalks and conducting a calibration of the bonding parameters of fodder rape to guide the optimization of chopping equipment.
EUO samara has a high exploitation value, and the relative relationship between the hulling equipment and EUO samara in the exploitation process should not be ignored. To date, few studies have also been reported on the discrete element modeling and relevant parameter calibration of EUO Samara. Therefore, in this paper, geometric parameters and contact property parameters of EUO samara were obtained by physical experiments, the shape profile of EUO samara was obtained by three-dimensional (3D) scanning technology, and the discrete element model of EUO samara was established by importing DEM discrete element simulation software. Moreover, the maximum shear force of the blade on EUO samara was obtained by a Texture Analyzer. Using this as a reference, a virtual calibration experiment of the bonding parameters of the discrete element model was conducted to obtain the bonding parameters of EUO samara that can be used in the discrete element simulation.

2. Materials and Methods

2.1. Experimental Materials and Geometric Parameters

EUO samara from the EUO arborescent tree was used in the experiment as the material, which has a rough and dark brown surface and is usually flattened with a prismatic or linear structure [35,36]. In this study, 100 randomly selected samples of EUO samaras were measured by using vernier calipers, with dimensions ranging from 29.2 mm to 39.6 mm in length, 8.8 mm to 12.5 mm in width, 1–3 mm in thickness, and a fruit shape index of 2.6 to 3.8. The average moisture content was determined to be 7.51% by using the drying method.
The density   ρ is measured by the specific gravity bottle method and is calculated as
ρ = A A + B C ρ 1
where A is the mass of the EUO samara, B is the mass of the specific gravity bottle filled with water, C is the total mass of the remaining water and samara, and ρ 1 is the density of the water [37].
The weighing of the masses in the above equation was carried out using a high-precision electronic balance (0.0001 g) and randomly selected 200 EUO samaras for 10 replicate experiments with a density measurement of 0.67 g/cm3.

2.2. Mechanical Property Parameters

The mechanical property parameters include Poisson’s ratio, modulus of elasticity, and intrinsic mechanical parameters.
Poisson’s ratio μ , also called the transverse deformation coefficient, is the ratio of transverse positive strain to axial positive strain when the EUO samara is subjected to unidirectional tension or compression, and the μ is the elastic constant reflecting the transverse deformation of the EUO samara. The Poisson’s ratio of juniper winged fruits was measured experimentally using the definition method, which was calculated as
μ = ε x ε y = L / L H / H
where ε x is the samara transverse strain and ε y is the samara axial strain; L is the absolute samara transverse deformation and L is the samara transverse original length; H is the absolute samara axial deformation and H is the samara axial original length [38].
The Poisson’s ratio was determined by the uniaxial compression experiment of the Texture Analyzer (TA.XTC-1803061210), as shown in Figure 2a, with a flat indenter at the end of the Texture Analyzer and a loading rate of 0.5 mm/s. The experiment was repeated 20 times, and the Poisson’s ratio of the EUO samara was obtained as 0.403.
The modulus of elasticity E is a measure of the magnitude of the ability of the EUO samara to resist elastic deformation and was determined by a uniaxial compression experiment with a universal testing machine (DDL1003050301), with a flat indenter selected at the end of the universal testing machine and a loading rate of 0.5 mm/s. The experiment was repeated 20 times, and the modulus of elasticity of the EUO samara was obtained as 19.98 MPa.

2.3. Contact Property Parameters

2.3.1. Coefficient of Restitution

The coefficient of restitution e characterizes the ability of a material to recover after a collision and is only relevant to the material itself. Its value is the ratio of the normal relative separation velocity to the normal relative approach velocity of the two objects at the point of contact before and after the collision. This study involves the contact between the EUO samara and the contact between the EUO samara and stainless steel, and the parameter is measured with the aid of a high-speed camera (I-SPEED TR 4 GB MONO05020701) and coordinate paper [39].
Drop experiment was used to measure the coefficient of restitution e 1 between the EUO samara and stainless steel, as shown in Figure 2c, the EUO samara was lifted to = 3 0 mm so that it was released in free-fall motion and collided with the stainless steel plate radially, then the rebound height H 1 was recorded after the rebound. The formula for calculating the coefficient of restitution e 1 between the EUO samara and stainless steel were
e 1 = H 1 / H 0
The experiment was repeated 20 times, and the coefficient of restitution e 1 was measured to be 0.335 between the EUO samara and stainless steel.
The drop experiment was used to measure the coefficient of restitution e 2 between the EUO samaras. A binder was used to bond the EUO samaras into seeds on a stainless steel plate for the drop experiments, which were repeated 20 times as above, and the coefficient of restitution e 2 between the EUO samaras were measured to be 0.373.

2.3.2. Coefficient of Static Friction

The coefficient of static friction was determined by the inclined plane method. As shown in Figure 2b, a digital inclinometer was used to measure the inclination angle of the inclined plane during the experiment.
To measure the coefficient of static friction between the EUO samara and stainless steel, we used a binder to bond the stainless steel plate to the inclined surface, then put the EUO samara on the stainless steel plate, slowly turned the angle adjuster to increase the inclined angle of the inclined surface until the EUO samara was observed to slide on the stainless steel plate, then we stopped turning, and recorded the angle α displayed by the digital display inclination measuring instrument [40]. The formula for calculating the coefficient of static friction γ 1 between the EUO samara and stainless steel is
γ 1 = t a n   α
The experiment was repeated 20 times, and the coefficient of static friction between the EUO samara and stainless steel was measured at 0.442.
To measure the coefficient of static friction γ 2 between the EUO samaras, the stainless steel plate was simply replaced with one bonded with EUO samaras stock. The experiment was repeated 20 times, and the coefficient of static friction between the EUO samaras was measured to be 0.676.

2.3.3. Coefficient of Rolling Friction

A multi-functional friction and wear test system (MFT-500003050903) was used for the measurement of the coefficient of rolling friction (as shown in Figure 2d). The coefficient of rolling friction was measured by pair grinding of the materials to be measured, and the experiment was repeated 20 times, and the coefficient of rolling friction γ 3 was measured to be 0.254 between the EUO samara and the stainless steel.
The coefficient of rolling friction γ 4 between the EUO samaras was obtained as 0.05 with reference to similar materials [41].

2.4. Bonding Parameters and Calibration Experiments

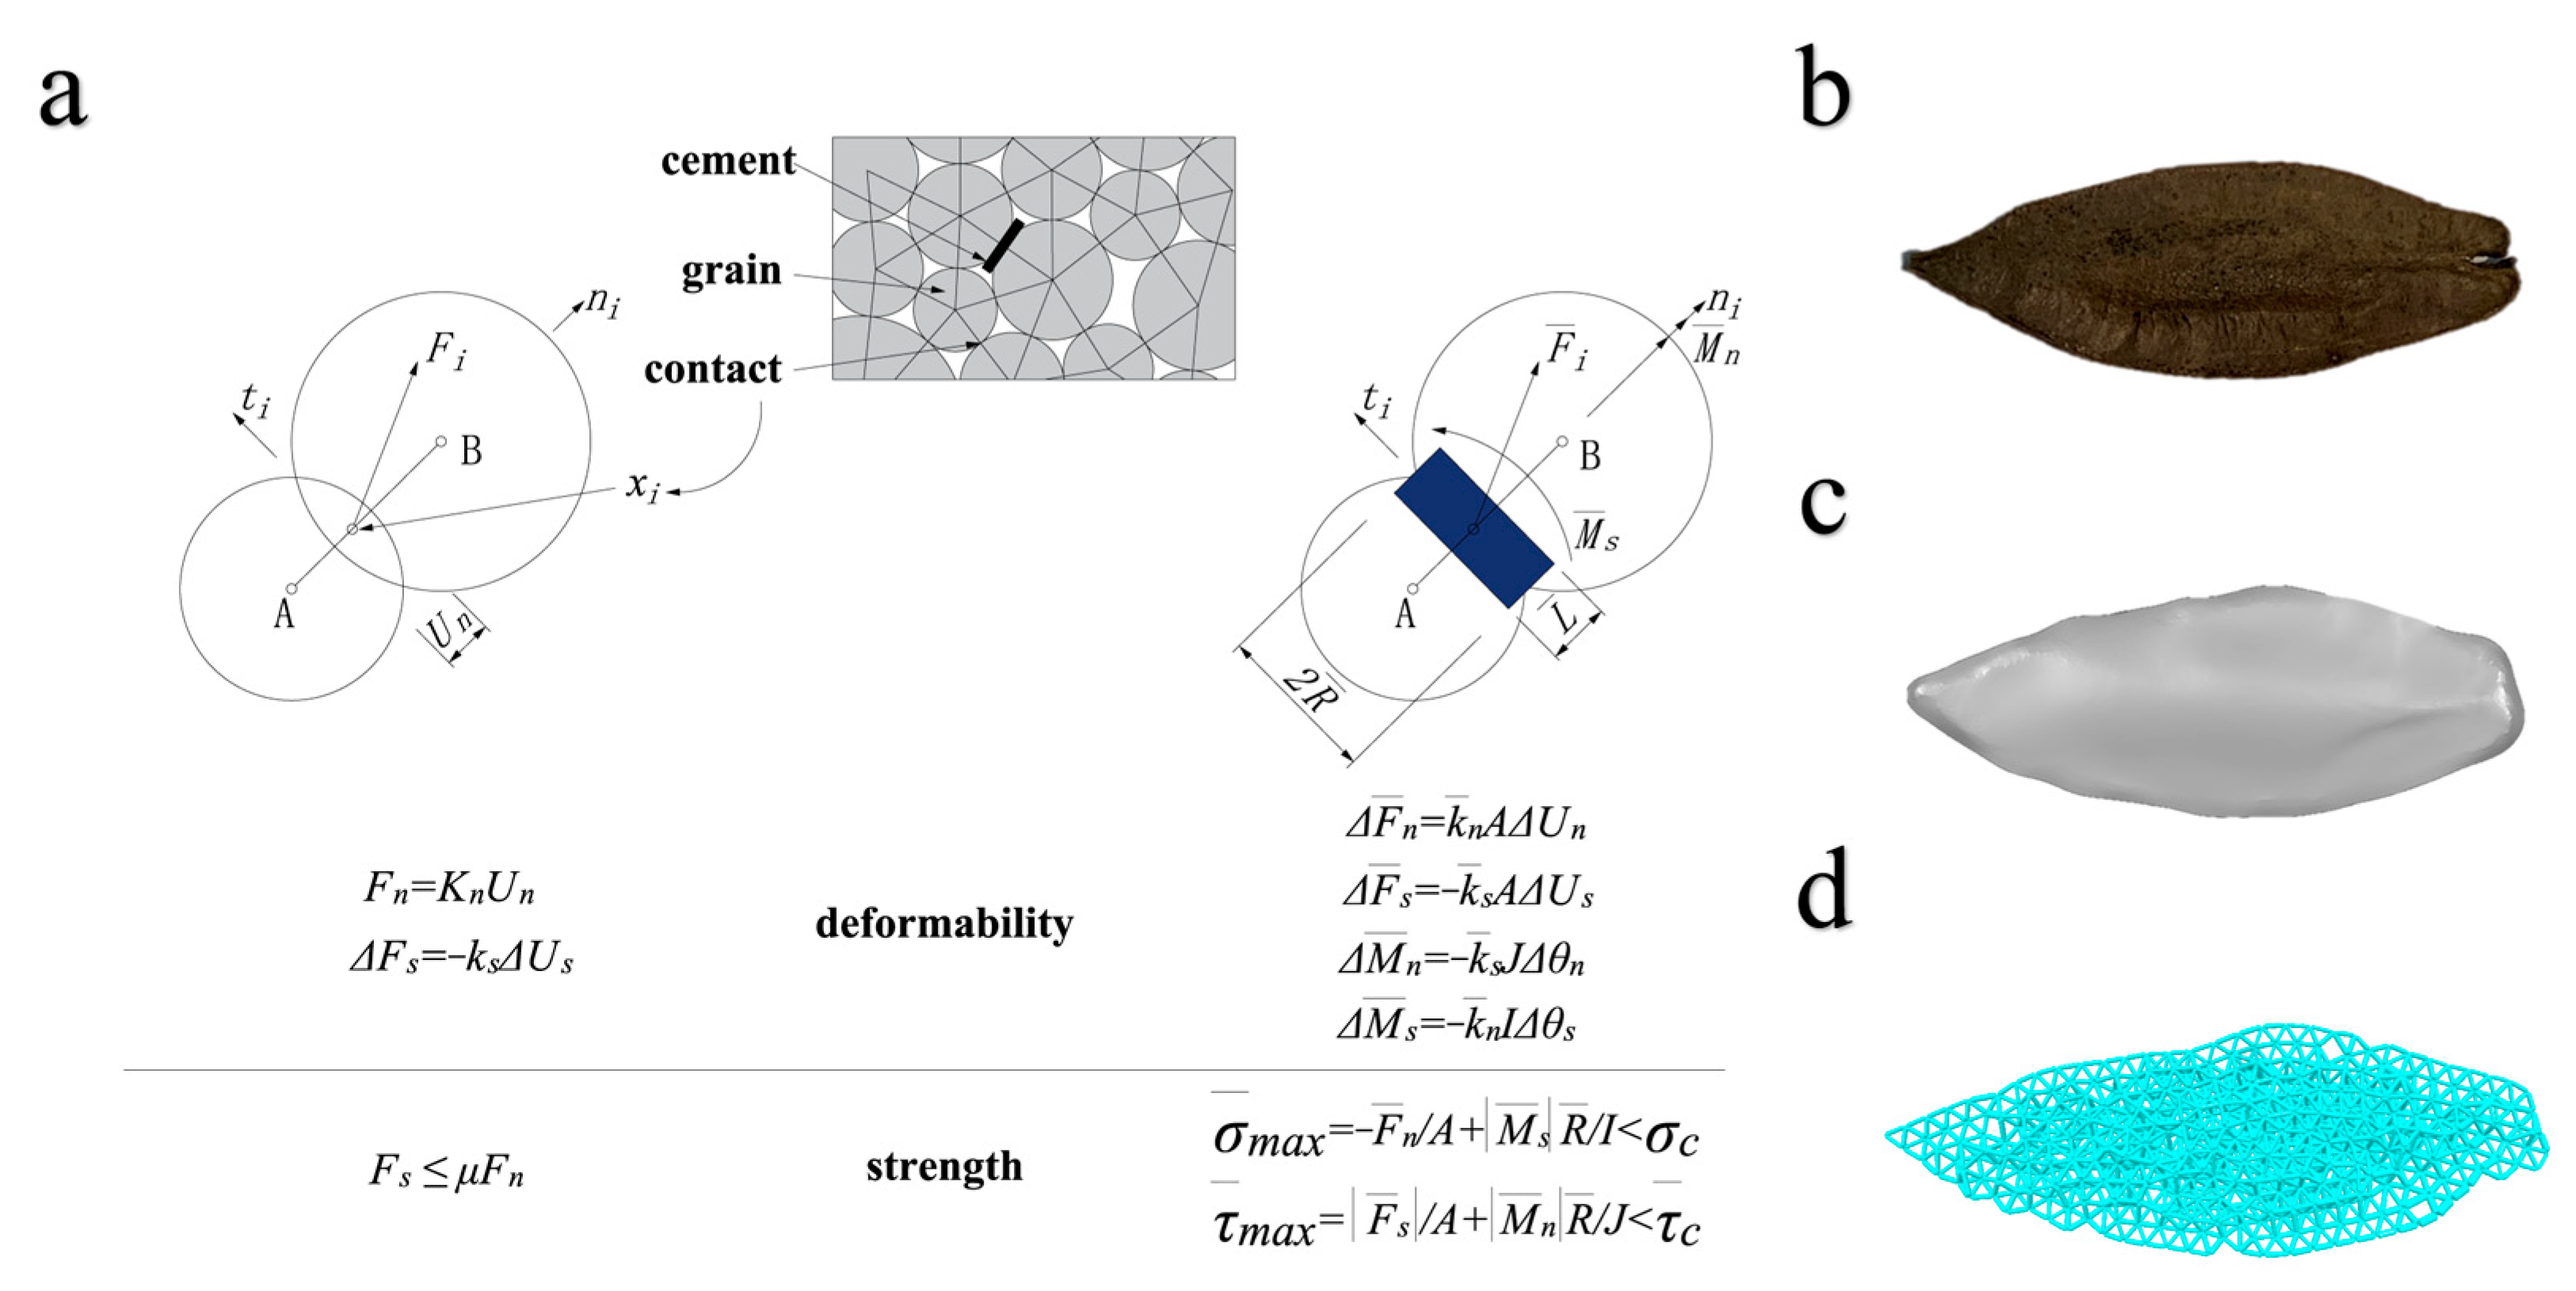
2.4.1. Bonding Parameters

Shear experiments were carried out on the EUO samara by using a Texture Analyzer to obtain a realistic reference value reflecting the bonding parameters, and a square blade was selected at the end of the Texture Analyzer for the shear experiments. The end of the Texture Analyzer was run at a speed of 0.5 mm/s during the experiments. Due to the brittleness of the EUO samara, the force curve of the shearing process reached its peak when the EUO samara fractured, and there was no fixed rule for the location of the peak between different individuals, so only the maximum value of the shearing force was selected as the evaluation index in this study. The experiment was repeated 20 times, and the maximum shear force F a of the blade on the EUO samara was 43.2 N. This was used as a physical reference value for the bonding parameters for the virtual calibration experiment.

2.4.2. The Single-Factor Experiments

According to the definition of the Hertz–Mindlin bonding model, the breakage of the bonding bond between particles is related to the particle contact radius x 1 , the normal stiffness per unit area x 2 , the shear stiffness per unit area x 3 , the critical normal stress x 4 , the critical shear stress x 5 and the bonded disk radius x 6 . Regarding reference to the simulation parameters of materials with similar morphological and mechanical properties, a preliminary range of discrete element simulation bonding parameters for EUO samara was set as shown in Table 1 [10,33,34], and the influence of each factor on the F a was analyzed by single-factor experiments and the parameter range was determined.
Single-factor simulation experiments were carried out in DEM discrete element software with F a as the evaluation index; factors x 1 and x 6 were taken as 5 points on average, factors x 2 x 5 had a larger range, and in order to take into account different orders of magnitude, points were taken for each order of magnitude endpoint and intermediate position, as shown in Table 2, the fixed factors were taken as intermediate levels, x 1 is 0.8 mm, x 2 is 4.0 × 10⁷ N∙m−3, x 3 is 4.0 × 10⁷ N∙m−3, x 4 is 4.0 × 10⁶ Pa, x 5 is 4.0 × 10⁶ Pa and x 6 is 0.8 mm.

2.4.3. The Two-Level Factorial Experiments

The two-level factorial experiment can quickly screen out the factors that have a significant impact on the test index during many influencing factors and determine the range of each parameter based on the results of the single-factor experiments. A total of 16 groups of two-level factorial experiments are designed.

2.4.4. The Steepest Climb Experiments

The steepest climb experiment is carried out on the factors screened for significance in the two-level factorial experiments to quickly determine the neighborhood of the optimum value, with the non-significant factors taken at a fixed level in the single-factor experiments.

2.4.5. The Box–Behnken Response Surface Experiments

To obtain the optimal simulation parameters, the response surface experiments were designed according to the Box–Behnken principle. The significant influencing factors x 1 , x 2 , x 3 and x 6 screened by the two-level factorial experiments, and the factors were narrowed down according to the results of the steepest climb experiments. Moreover, the levels in experiments 4 and 6 are the upper and lower limits for the response surface experiments, with four replications set at the central level, the response value of F a of EUO samara was used to obtain the regression equation with the significant influencing factor as the variable. Meanwhile, the relative error e between the measured shear force and the simulated shear force is calculated as follows:
e = F a F b F a × 100 %
where e is the relative error, F a is the maximum measured shear force and F b is the maximum shear force in the simulation experiments.

2.5. Simulation Model Building

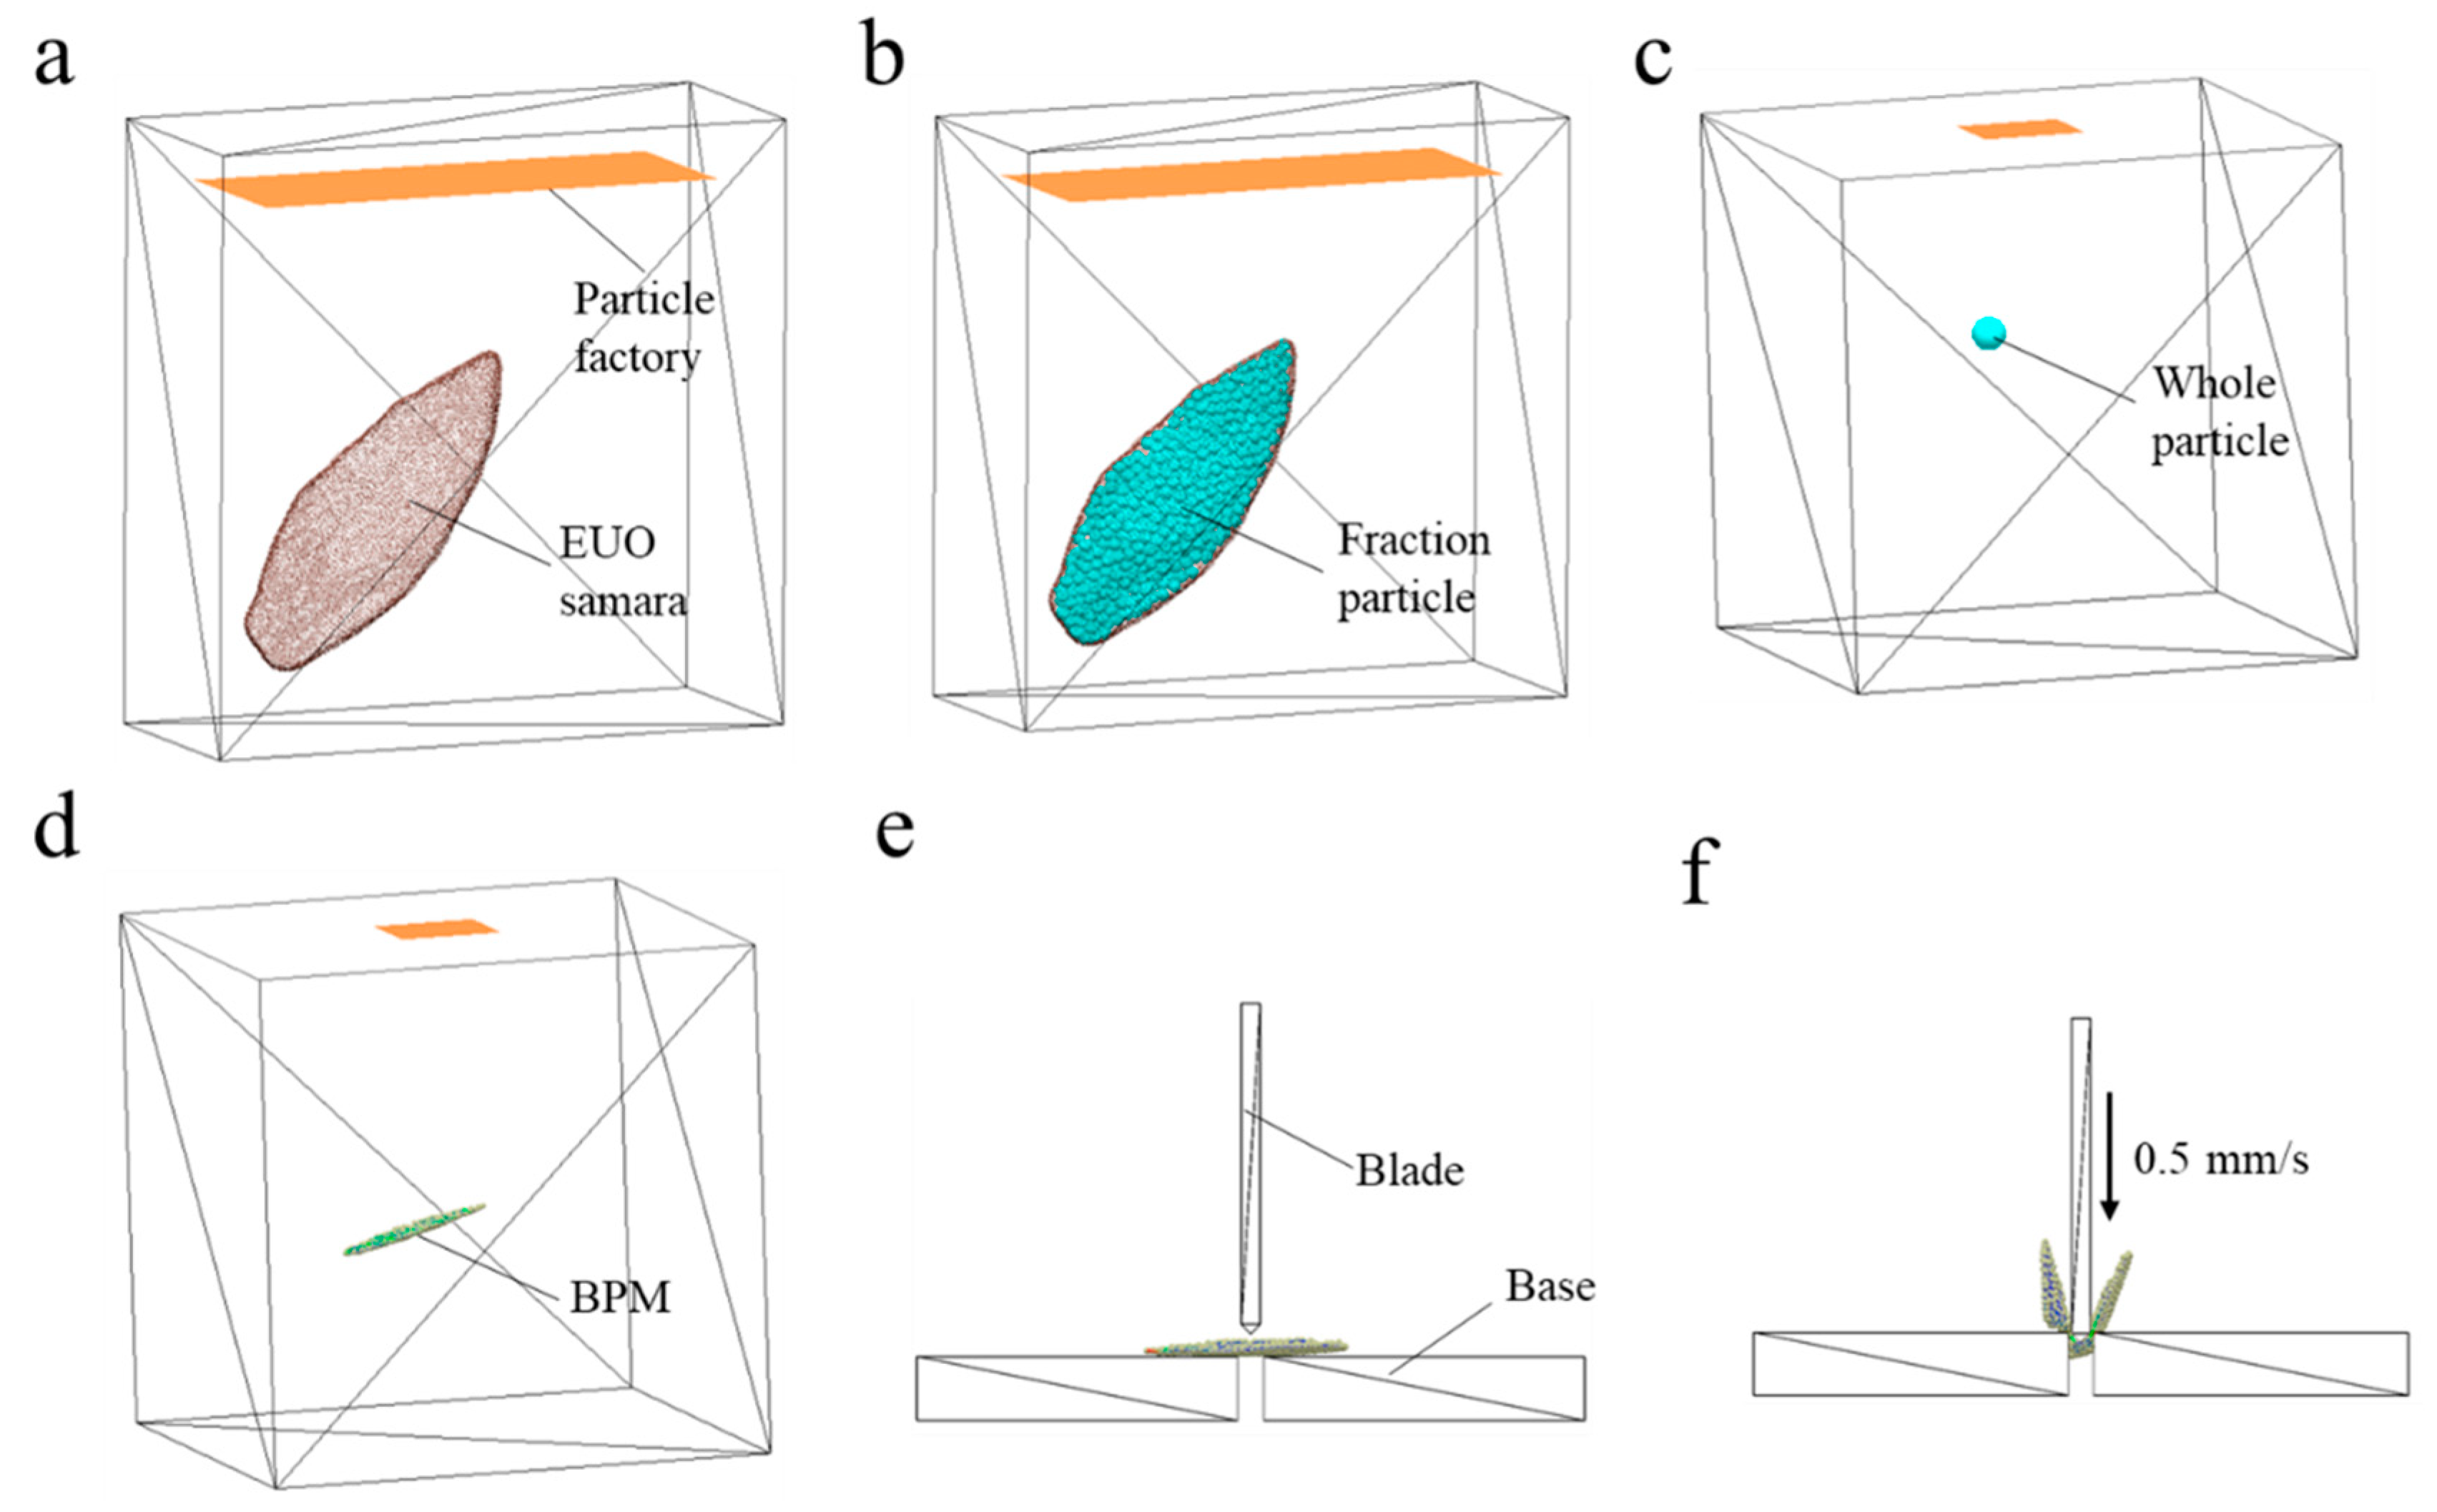
2.5.1. EUO Samara Model

The shape of the EUO samara is mostly irregularly surface (Figure 1b), and it is difficult to model its actual shape features by conventional modeling means. In order to obtain an accurate profile of the EUO samara and improve the accuracy of the simulation, this study used the 3D scanner (HandySCAN BLACKTM-Elite0321111) to scan the profile of the EUO samara to obtain accurate scan data of the EUO samara, imported into Geomagic Wrap to process the 3D scan data, remove abnormal scan points, fill in the gaps and adjust the coordinates to the center point (Figure 1c), then generated the stl model file and imported into DEM to build a discrete element model of the EUO samara with bonded bonds, as shown in Figure 1d.
The EUO samara discrete element modeling process is as follows: The geometry of the box was established in DEM software (version EDEM2020, ALTAIR, Troy, MI, USA, 2019), and the processed EUO samara model was imported into its internal area and set as virtual type (Figure 3a). A large number of particles were generated inside the box to fill the model. After filling, the model was set as physical type. At the same time, change the box type to virtual, and the excess particles will leave the calculation domain and disappear automatically under the action of gravity (Figure 3b). At this point, the internal particle coordinates of the EUO samara model were derived, and the derived coordinates were used to generate a discrete element model of the EUO samara with bonding bonds by particle replacement (Figure 3c,d). In the discrete element model, the smaller the particle radius is, the closer the simulation result is to the real situation, but the amount of calculation will also increase dramatically. In this case, the particle radius was set as 0.5 mm in combination with the blade thickness in actual shear and the shape parameter of EUO samara. Finally, the number of particles in the EUO samara model was 444, and a total of 2423 bonding bonds were generated. The average number of bonds in each particle was more than 5.5, and the bonding was sufficient.

2.5.2. Shear Model

The blade and base models were created in SolidWorks and saved in step mode, with all dimensions consistent with the actual experiments (Figure 3e). After the particle replacement was completed, they were imported into DEM, while the coordinates were adjusted to ensure that the shear angle was consistent with the actual experiments, and the blade loading speed was set at 0.5 mm/s, with the direction vertical downwards, for the shear simulation experiments (Figure 3f).

2.6. Calibration Results Validation

To test whether the calibrated parameters can be used in a simulation study of the hulling of EUO samaras, simulations were carried out using the optimal parameters solved by regression equations and compared with measured values to verify the accuracy of the discrete element model and parameter calibration of EUO samaras.
The above simulation experiments with a simulation time step of 5% of the Rayleigh time step, namely, 8.08037 × 10⁻⁷ s. The data storage time range was 0.01 s, and the total simulation time was 26 s, the grid size was 1 mm. The DEM simulation was run on a computer containing an eight-core processor (Inter® CoreTM i5-10400F CPU @ 2.90 GHz) with 16 GB of memory (RAM).

3. Results and Discussion

3.1. The Single-Factor Experiment Results and Analysis

The results of the single-factor experiments are shown in Figure 4. The degree of influence of each factor on F a is different, among which the simulation results do not change significantly when the critical normal stress x 4 (Figure 4d) and critical shear stress x 5 (Figure 4d) are taken to different values, indicating that their influence on the shear force is small, and the results of these two groups of experiments are between 40–50 N, which are close to the F a , indicating that the fixed level of each factor is close to the correct parameter and the parameter range is chosen reasonably.
With the increase in particle contact radius x 1 , the shear force also gradually increases when x 1 is between 0.7–0.8 mm, the simulation result is closest to the measured value (Figure 4a). The shear force gradually increases as the normal stiffness per unit area x 2 increases, and the simulation result is closest to the measured value when x 2 is between 2.0 × 10⁷ N/m3–4.0 × 107 N/m3 (Figure 4b). When the shear stiffness per unit area x 3 increases, the shear force also increases, and the simulation result is closest to the measured values as the x 3 is between 2.0 × 10⁷ N/m3 and 4.0 × 10⁷ N/m3 (Figure 4c). As the bonded disk radius x 6 increases, the shear force also increases, and the simulation result is closest to the measured values when x 6 is between 0.7–0.8 mm (Figure 4f).

3.2. The Two-Level Factorial Experiments Results and Analysis

The two-level factorial experiments protocol and results are shown in Table 3, and the results of the experimental variance are shown in Table 4. The effect of each factor on the maximum shear force is non-negative, the model coefficient of determination R2 = 0.9995, and therefore, the experimental results are reliable; p < 0.01 for factors x 1 , x 2 , x 3 and x 6 , which have a highly significant effect on the shear force; p > 0.05 for factors x 4 and x 5 , which have a non-significant effect on the shear force.

3.3. The Steepest Climb Experiments Results and Analysis

According to the results of the two-level factorial experiments, the factors x 1 , x 2 , x 3 and x 6 , which have a significant effect on the maximum shear, were selected for the steepest climb experiments. The non-significant factors x 4 and x 5 were set as fixed levels in the single-factor experiments. The experiment protocols and results are shown in Table 5. With the increase in each factor level, the shear force of the blades on the EUO samaras increased, among which the maximum values of simulated shear force in experiment five and experiment six were 40.9 N and 61.2 N, respectively. The results of experiment five were close to F a , which was not conducive to the subsequent development of response surface experimental design. Therefore, it was appropriate to extend the range of factors and use the factor levels from experiments four and six as the low and high levels for the subsequent Box–Behnken experiments.

3.4. The Box–Behnken Response Surface Experiments Results and Analysis

In order to obtain the optimal combination of simulation parameters for the discrete element model of EUO samara, Box–Behnken experiments were conducted on the significance factors according to the results of the two-level factorial experiments and the steepest climb experiments, and the experimental protocols and results are shown in Table 6. The regression results were fitted to obtain the regression equation with F a of the blade on EUO samara as the response value and x 1 , x 2 , x 3 and x 6 as variables, and the regression equation is shown as follows:
Y = 22.01 231.23 x 1 9.69 x 2 + 7.99 x 3 + 107.89 x 6 + 15.00 x 1 x 2 + 12.50 x 1 x 3 171.88 x 1 x 6 1.30 x 2 x 3 18.75 x 2 x 6 47.50 x 3 x 6 + 226.56 x 1 2 + 2.90 x 2 2 + 3.85 x 3 2 + 203.13 x 6 2
The Box–Behnken response surface experiments results were analyzed by variance in Design-Expert software, and the results are shown in Table 7. The model has a good fit because of the high coefficient R2 of 0.9503. The model is significant, and there are no other major factors affecting the response value of this experiment. p < 0.01 for factors x 1 , x 2 , x 3 and x 6 , with a highly significant effect on the shear force, p > 0.05 for the interaction of factors x 1 , x 2 , x 3 and x 6 and the squared terms of factors x 1 , x 2 , x 3 and x 6 , which have a non-significant effect on shear force. Response surface diagrams of the effect of the interaction of the factors on F a are obtained separately from the regression equation, and the relevant results are shown in Figure 5.
When x 2 , x 3 and x 6 are fixed, the shear force increases with the increase in x 1 , and the increasing trend is obvious (Figure 5a–c), indicating that x 1 is a comparatively critical factor affecting the magnitude of the shear force. The reason may be that x 1 is a condition to determine whether the contact model is triggered, and a large particle contact radius is more likely to trigger the Hertz–Mindlin with bonding model [42], while the Hertz–Mindlin with bonding model is used as the basis for this study, accordingly a large x 1 will increase the mechanical action range of the particles inside the model, thus increasing the shear strength of the model.
Secondly, when the x 1 and x 6 are fixed, there is also an increasing trend of the shear force with the increase in the x 2 and x 3 (Figure 5a,b,d–f). The reason is that in the shear process, the model will be not only subject to the action of the shear force but also to the action of the squeeze force, F a in the component force also has a certain squeeze force, so when the increase in x 2 and x 3 , the shear force will also increase.
Finally, the trend of the shear force with x 6 is shown in Figure 5c,e,f. It can be seen that when the x 2 , x 3 and x 1 are fixed, the shear force increases with the increase in x 6 . This is because a larger x 6 between particles will increase the number of model bonding bonds and change their spatial distribution, which will enhance the mechanical properties of the whole model and increase the stability of the model, and the shear strength of the corresponding model will increase [26].

3.5. Optimal Parameters and Validation of Calibration Results

Based on the F a of the blade on the EUO samara, the simulation parameters were optimally solved, and the quadratic regression equation obtained by fitting was parametrically solved with the aid of Design-Expert software, setting the optimization target to 43.2 N. The best combination of the significance parameters was obtained as follows: the particle contact radius x 1 was 0.79 mm, the normal stiffness per unit area x 2 was 3.20 × 10⁷ N·m−3, the shear stiffness per unit area x 3 was 3.83 × 10⁷ N·m−3, the bonded disk radius x 6 was 0.83 mm, and other factors were fixed values in the single-factor experiments. The optimal combination of parameters was verified in a simulation experiment, and the maximum shear force was 43.6 N. The relative error e between the simulation and the measured maximum shear force was 0.93%; the simulation results are in general agreement with the measured results, which shows that the established discrete element model of EUO samara and the calibrated parameters are accurate and reliable, and can guide the design and optimization of EUO samaras shelling equipment through discrete element simulation.

4. Conclusions

In this paper, based on the Hertz–Mindlin with bonding model, physical experiments and virtual calibration experiments were combined to calibrate the simulation parameters of the discrete element model of EUO samara, and the best combination of parameters for the EUO samara bonding model was obtained and validated, with the following main conclusions:
(1)
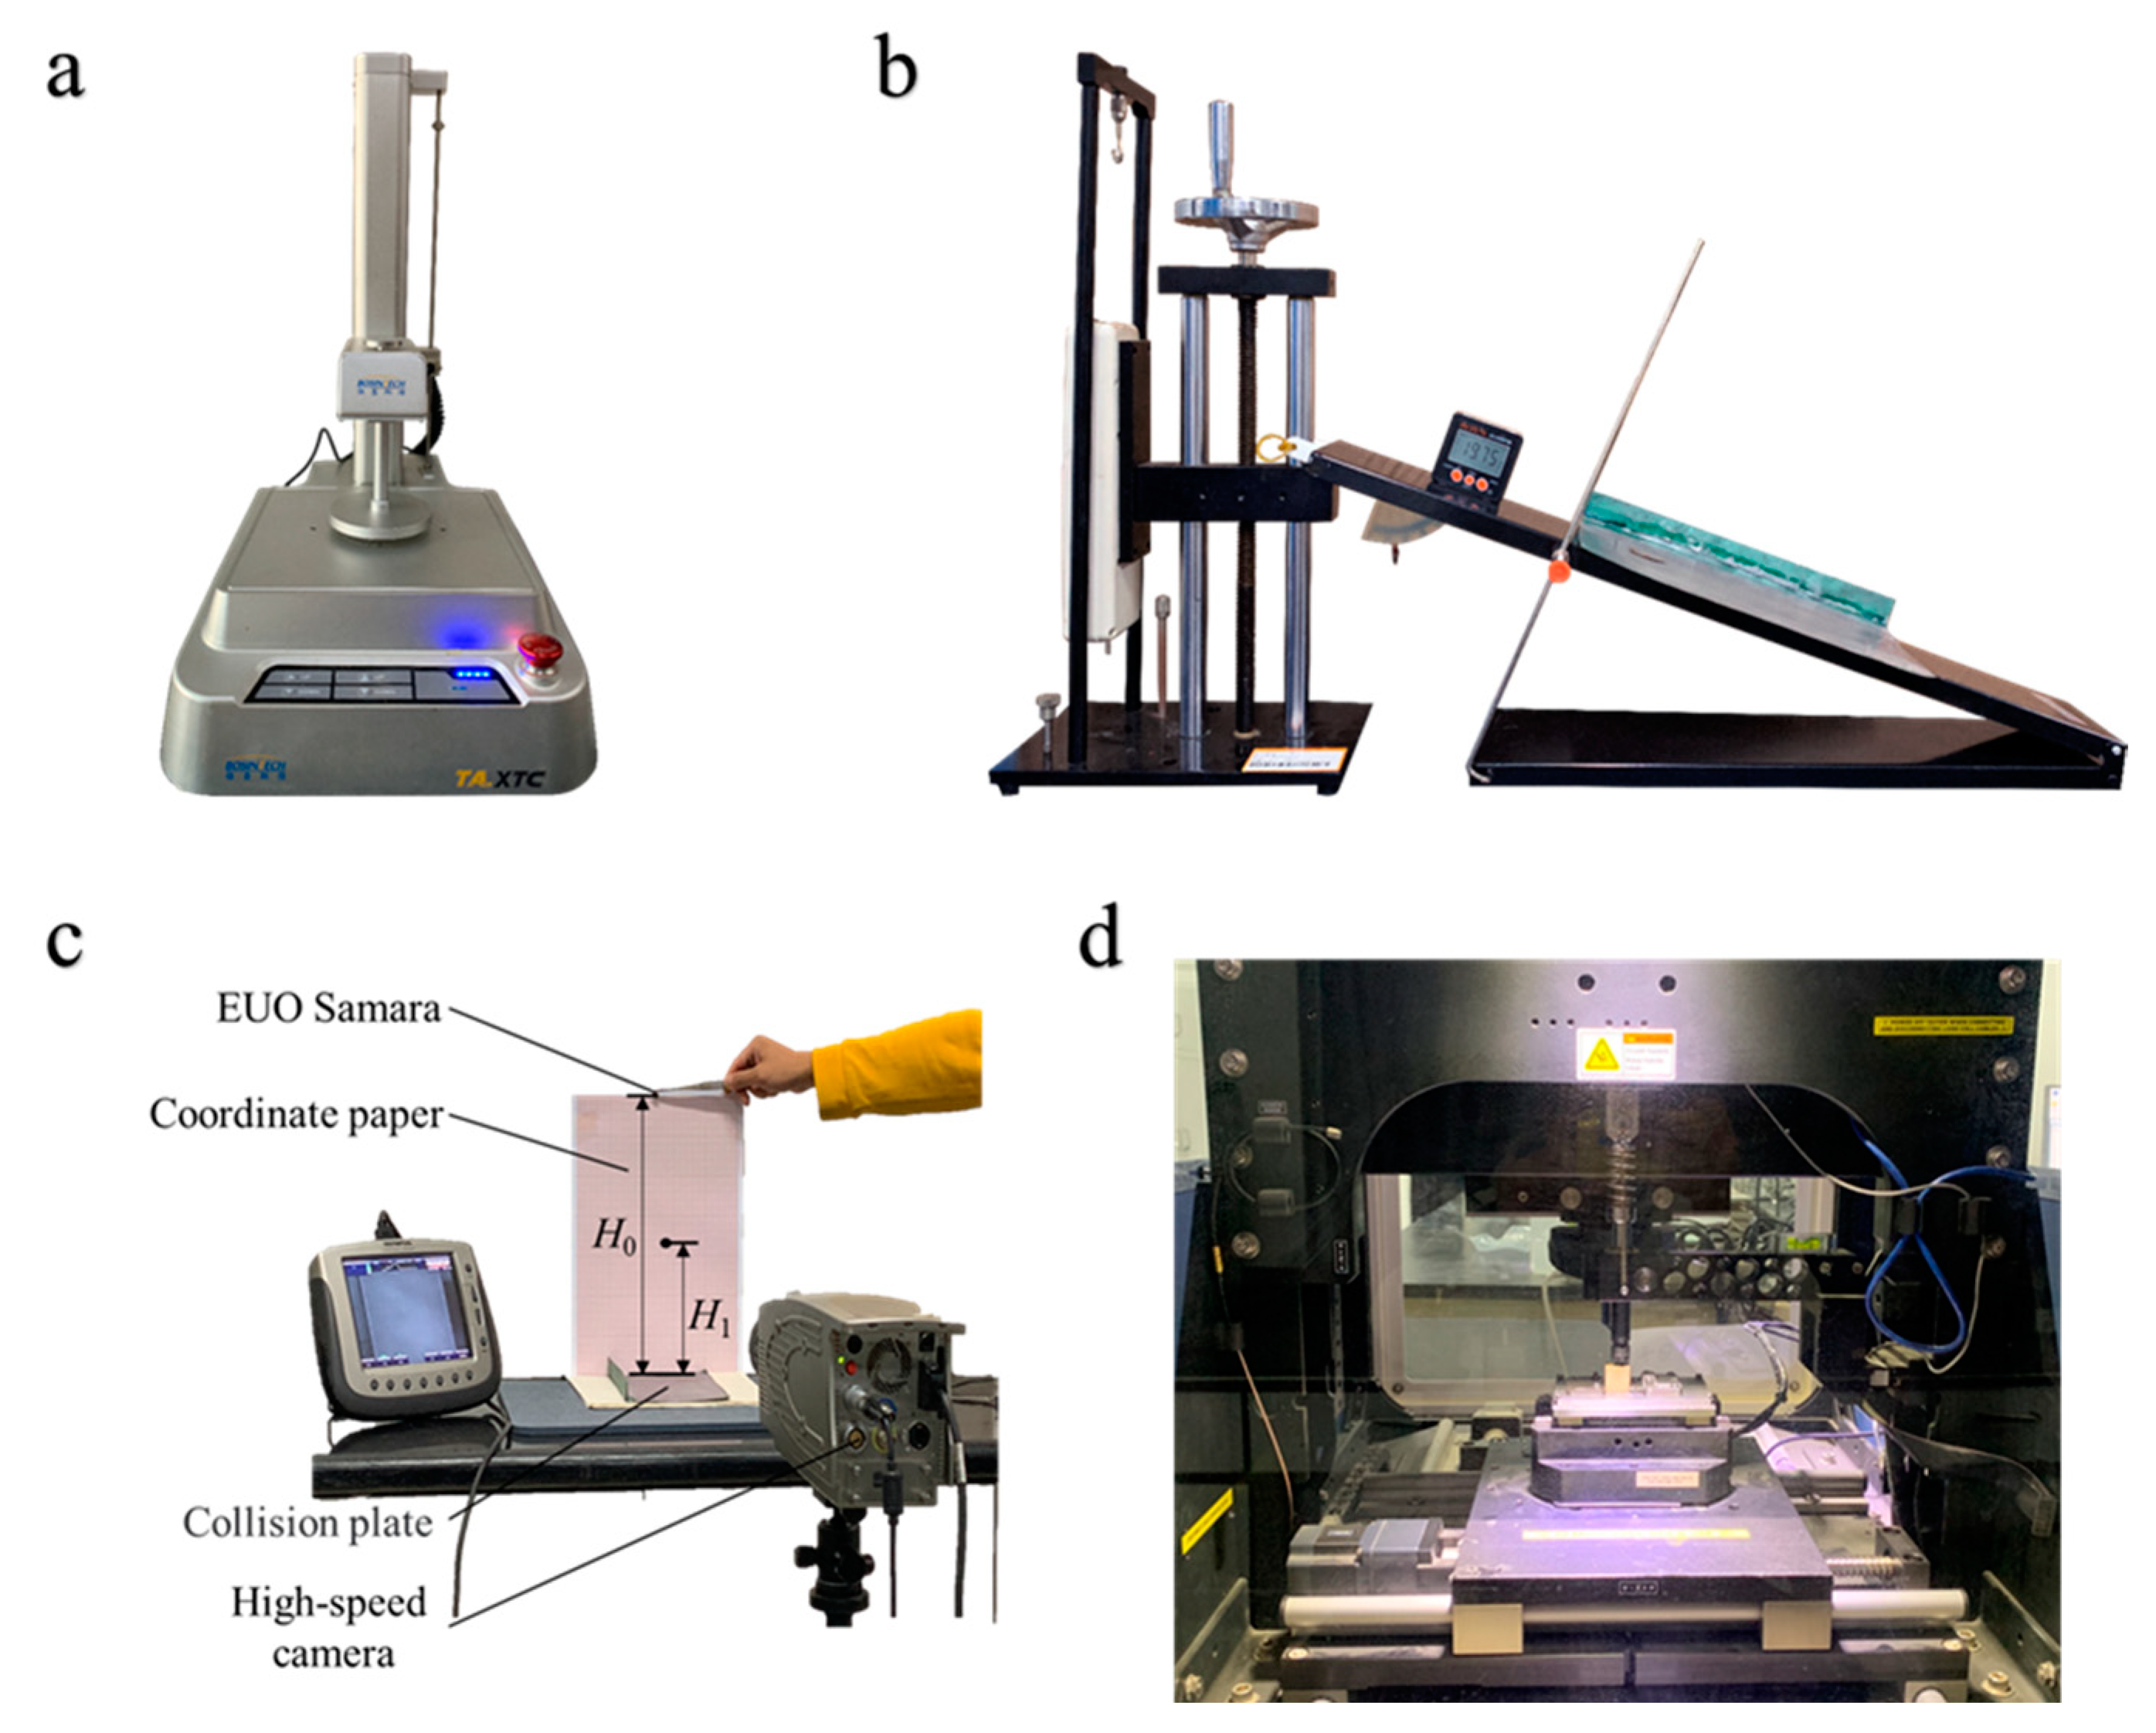
The moisture content and the density of the EUO samara were measured at 7.51% and 0.67 g/cm3, respectively. The bench experiments and physical experiments measured that the Poisson’s ratio of the juniper fins was 0.403, and the modulus of elasticity was 19.98 MPa. The coefficient of restitution of EUO samara-to-samara and EUO samara-to-stainless steel were 0.373 and 0.335, the coefficient of static friction were 0.676 and 0.442, respectively, and the coefficients of rolling friction were 0.349 and 0.254. Moreover, the maximum shear force of the blades on the EUO samara was 43.2 N.
(2)
The range of simulation parameters for EUO samara was initially determined with reference to similar materials. The influence trend of each factor on the shear force was analyzed by single-factor experiments, and the parameter range was reduced. The significant factors obtained from the two-level factorial experiments were particle contact radius, the normal stiffness per unit area, the shear stiffness per unit area, and the bonded disk radius.
(3)
The steepest climb experiments were used to narrow the range of significance parameters further. A quadratic regression model was established between the significance factors and the maximum shear force, while the optimal combination of the relevant parameters was obtained by optimal solution, and the following results were obtained: the particle contact radius was 0.79 mm, the normal stiffness per unit area was 3.20 × 10⁷ N·m−3, the shear stiffness per unit area was 3.83 × 10⁷ N·m−3, and the bonded disk radius was 0.83 mm.
(4)
The simulation was validated by using the best combination of parameters. The relative error between the simulated and measured values was 0.93%, which showed that the established discrete element model of EUO samara and the calibrated parameters were accurate and reliable. All of these could guide the design and optimization of EUO samara hulling equipment through discrete element simulation.

Author Contributions

Conceptualization, M.-Q.Z.; methodology, C.-N.L. and Z.-J.X.; software, C.-N.L.; validation, C.-N.L.; resources, L.Z.; writing—review and editing, C.-N.L. and M.-Q.Z.; visualization, C.-N.L.; supervision, M.-Q.Z. All authors have read and agreed to the published version of the manuscript.

Funding

This research was funded by the Forestry Science and Technology Development Project by State Forestry and Grassland Administration of China (KJZXZZ2019005); the Agricultural Science and Technology Innovation Drive Project of Shaanxi Province (NYKJ-2021-YLXN15); the National Key Research and Development Program of China (2018YFE0127000).

Data Availability Statement

Data are available upon request.

Conflicts of Interest

The authors declare no conflict of interest.

Nomenclature

Symbols
F a Maximum measured shear force, N
ρ Density of the EUO samara, g/cm3
ρ 1 Density of the water, g/cm3
AMass of the EUO samara, g
BMass of the specific gravity bottle filled with water, g
CTotal mass of the remaining water and samara, g
μ Poisson’s ratio of the EUO samara
ε x Samara transverse strain, mm
ε y Samara axial strain, mm
L Absolute samara transverse deformation, mm
L Samara transverse original length, mm
H Absolute samara axial deformation, mm
H Samara axial original length, mm
EModulus of elasticity of the EUO samara, Mpa
e 1 Coefficient of restitution between the samara and stainless steel
e 2 Coefficient of restitution between the samaras
γ 1 Coefficient of static friction between the samara and stainless steel
γ 2 coefficient of static friction between the EUO samaras
γ 3 coefficient of rolling friction between the EUO samara and the stainless steel
γ 4 coefficient of rolling friction between the EUO samaras
x 1 Particle contact radius, mm
x 3 Shear stiffness per unit area, N/m3
x 4 Critical normal stress, Pa
x 5 Critical shear stress, Pa
x 6 Bonded disk radius, mm
eRelative erro
F a Maximum shear force in simulation experiment, mm
R2Model coefficient of determination
Abbreviations
EUOEucommia ulmoides Oliver
DEMDiscrete element method
3DThree-dimensional
BPMBonding particle model

References

  1. Zhu, M.Q.; Sun, R.C. Eucommia ulmoides Oliver: A Potential Feedstock for Bioactive Products. J. Agric. Food Chem. 2018, 66, 5433–5438. [Google Scholar] [CrossRef] [PubMed]
  2. Ruan, L.; Lu, L.; Zhao, X.; Xiong, W.; Xu, H.; Wu, S. Effects of natural antioxidants on the oxidative stability of Eucommia ulmoides seed oil: Experimental and molecular simulation investigations. Food Chem. 2022, 383, 132640. [Google Scholar] [CrossRef] [PubMed]
  3. Ran, X.; Liu, Y.; Zhao, D. The relationship between EuSRPP1 gene expression and rubber biosynthesis in Eucommia ulmoides Oliver (Du-zhong). Ind. Crops Prod. 2022, 175, 114246. [Google Scholar] [CrossRef]
  4. Teng, F.; Wu, J.; Su, B.; Wang, Y. High-speed tribological properties of Eucommia ulmoides gum/natural rubber blends: Experimental and molecular dynamics simulation study. Tribol. Int. 2022, 171, 107542. [Google Scholar] [CrossRef]
  5. Niu, X.; Xu, D.; Luo, J.; Kong, L. Main iridoid glycosides and HPLC/DAD-Q-TOF-MS/MS profile of glycosides from the antioxidant extract of Eucommia ulmoides Oliver seeds. Ind. Crops Prod. 2016, 79, 160–169. [Google Scholar] [CrossRef]
  6. Yang, X.D.; Zhao, L.L.; Li, H.X.; Liu, C.S.; Hu, E.Y.; Li, Y.W. DEM study of particles flow on an industrial-scale roller screen. Adv. Powder Technol. 2020, 31, 4445–4456. [Google Scholar] [CrossRef]
  7. Zhou, L.; Yu, J.; Wang, Y.; Yan, D.; Yu, Y. A study on the modelling method of maize-seed particles based on the discrete element method. Powder Technol. 2020, 374, 353–376. [Google Scholar] [CrossRef]
  8. Gao, X.; Zhou, Z.; Xu, Y.; Yu, Y.; Su, Y.; Cui, T. Numerical simulation of particle motion characteristics in quantitative seed feeding system. Powder Technol. 2020, 367, 643–658. [Google Scholar] [CrossRef]
  9. Lu, F.Y.; Ma, X.; Tan, H.Y.; Chen, L.T.; Zeng, L.C.; An, P. Simulative calibration and experiment on main contact parameters of discrete elements for rice bud seeds. Trans. CSAM 2018, 49, 93–99. [Google Scholar] [CrossRef]
  10. Li, X.; Du, Y.; Liu, L.; Zhang, Y.; Guo, D. Parameter calibration of corncob based on DEM. Adv. Powder Technol. 2022, 33, 103699. [Google Scholar] [CrossRef]
  11. Du, C.; Han, D.; Song, Z.; Chen, Y.; Chen, X.; Wang, X. Calibration of contact parameters for complex shaped fruits based on discrete element method: The case of pod pepper (Capsicum annuum). Biosyst. Eng. 2023, 226, 43–54. [Google Scholar] [CrossRef]
  12. Zhao, L.; Zhou, H.; Xu, L.; Song, S.; Zhang, C.; Yu, Q. Parameter calibration of coconut bran substrate simulation model based on discrete element and response surface methodology. Powder Technol. 2022, 395, 183–194. [Google Scholar] [CrossRef]
  13. Fang, M.; Yu, Z.; Zhang, W.; Cao, J.; Liu, W. Friction coefficient calibration of corn stalk particle mixtures using Plackett-Burman design and response surface methodology. Powder Technol. 2021, 396, 731–742. [Google Scholar] [CrossRef]
  14. Yu, Y.J.; Fu, H.; Yu, J.Q. DEM-based simulation of the corn threshing process. Adv. Powder Technol. 2015, 26, 1400–1709. [Google Scholar] [CrossRef]
  15. Shi, L.; Yang, X.; Zhao, W.; Sun, W.; Wang, G.; Sun, B. Investigation of interaction effect between static and rolling friction of corn kernels on repose formation by DEM. Int. J. Agric. Biol. Eng. 2021, 14, 238–246. [Google Scholar] [CrossRef]
  16. Horabik, J.; Wicek, J.; Parafiniuk, P.; Bańda, M.; Kobyka, R.; Stasiak, M. Calibration of discrete-element-method model parameters of bulk wheat for storage—ScienceDirect. Biosyst. Eng. 2020, 200, 298–314. [Google Scholar] [CrossRef]
  17. Liu, F.Y.; Zhang, J.; Li, B.; Chen, J. Calibration of parameters of wheat required in discrete element method simulation based on repose angle of particle heap. Trans. CSAE 2016, 32, 247–253. [Google Scholar] [CrossRef]
  18. Liu, Y.P.; Zhang, T.; Liu, Y. Calibration and experiment of contact parameters of rice grain based on discrete element method. J. Agric. Sci. Sci. Technol. 2019, 21, 70–76. [Google Scholar] [CrossRef]
  19. Zhang, R.F.; Jiao, W.; Zhou, J.L.; Qi, B.; Liu, H.; Xia, Q.Q. Parameter calibration and experiment of rice seeds discrete element model with different filling particle radius. Trans. CSAM 2020, 51, 227–235. [Google Scholar] [CrossRef]
  20. Wu, M.C.; Cong, J.L.; Yan, Q.; Zhu, T.; Peng, X.Y.; Wang, Y.S. Calibration and experiments for discrete element simulation parameters of peanut seed particles. Trans. CSAE 2020, 36, 30–38. [Google Scholar] [CrossRef]
  21. Ghodki, B.; Patel, M.; Namdeo, R.; Carpenter, G. Calibration of discrete element model parameters: Soybeans. Comput. Part. Mech. 2018, 6, 3–10. [Google Scholar] [CrossRef]
  22. Wang, X.Z.; Zhang, Q.K.; Huang, Y.X.; Ji, J.T. An efficient method for determining DEM parameters of a loose cohesive soil modelled using hysteretic spring and linear cohesion contact models. Biosyst. Eng. 2022, 215, 283–294. [Google Scholar] [CrossRef]
  23. Bu, H.R.; Yu, S.Y.; Dong, W.C.; Wang, Y.Q.; Zhang, L.X.; Xia, Y.Q. Calibration and testing of discrete element simulation parameters for urea particles. Processes 2022, 10, 511. [Google Scholar] [CrossRef]
  24. Xia, R.; Li, B.; Wang, X.; Li, T.; Yang, Z. Measurement and calibration of the discrete element parameters of wet bulk coal. Measurement 2019, 142, 84–95. [Google Scholar] [CrossRef]
  25. Wang, Z.P.; Zhu, T.; Wang, Y.Z.; Ma, F.; Zhao, C.Y.; Li, X. Optimal discrete element parameters for black soil based on Multi-objective total evaluation normalized-response surface method. Processes 2023, 11, 2422. [Google Scholar] [CrossRef]
  26. Chen, Z.; Wang, G.; Xue, D. An approach to calibration of BPM bonding parameters for iron ore. Powder Technol. 2021, 381, 245–254. [Google Scholar] [CrossRef]
  27. Jiménez-Herrera, N.; Barrios, G.K.P.; Tavares, L.M. Comparison of breakage models in DEM in simulating impact on particle beds. Adv. Powder Technol. 2018, 29, 692–706. [Google Scholar] [CrossRef]
  28. Hanley, K.J.; O’Sullivan, C.; Huang, X. Particle-scale mechanics of sand crushing in compression and shearing using DEM. Soils Found. 2015, 55, 1100–1112. [Google Scholar] [CrossRef]
  29. Park, B.; Min, K.B. Bonded-particle discrete element modeling of mechanical behavior of transversely isotropic rock. Int. J. Rock Mech. Min. Sci. 2015, 76, 243–255. [Google Scholar] [CrossRef]
  30. Quist, J.; Evertsson, C.M. Cone crusher modelling and simulation using DEM. Miner. Eng. 2016, 85, 92–105. [Google Scholar] [CrossRef]
  31. Potyondy, D.O.; Cundall, P.A. A bonded-particle model for rock. Int. J. Rock Mech. Min. Sci. 2004, 41, 1329–1364. [Google Scholar] [CrossRef]
  32. Zeng, Y.; Jia, F.; Xiao, Y.; Han, Y.; Meng, X. Discrete element method modelling of impact breakage of ellipsoidal agglomerate. Powder Technol. 2019, 346, 57–69. [Google Scholar] [CrossRef]
  33. Zhang, G.Z.; Chen, L.M.; Liu, H.P.; Dong, Z.; Zhang, H.Q.; Zhou, Y. Calibration and experiments of the discrete element simulation parameters for water chestnut. Trans. CSAM 2022, 38, 41–50. [Google Scholar] [CrossRef]
  34. Liao, Y.T.; Liao, Q.X.; Zhou, Y.; Wang, Z.T.; Jiang, Y.J.; Liang, F. Parameters calibration of discrete element model of fodder rape crop harvest in bolting stage. Trans. CSAM 2020, 51, 73–82. [Google Scholar] [CrossRef]
  35. Dong, J.; Ma, X.; Fu, Z.; Guo, Y. Effects of microwave drying on the contents of functional constituents of Eucommia ulmoides flower tea. Ind. Crops Prod. 2011, 34, 1102–1110. [Google Scholar] [CrossRef]
  36. Wang, S.; Wang, X.; Liu, M.; Zhang, L.; Ge, Z.; Zhao, G. Preparation and characterization of Eucommia ulmoides seed oil O/W nanoemulsion by dynamic high-pressure microfluidization. LWT 2020, 121, 108960. [Google Scholar] [CrossRef]
  37. Xue, R.; Cui, E.L.; Hu, G.Q.; Zhu, M.Q. The composition, physicochemical properties, antimicrobial and antioxidant activity of wood vinegar prepared by pyrolysis of Eucommia ulmoides Oliver branches under different refining methods and storage conditions. Ind. Crops Prod. 2022, 178, 114586. [Google Scholar] [CrossRef]
  38. Hou, Z.F.; Dai, N.Z.; Chen, Z.; Qiu, Y.; Zhang, X.W. Measurement and calibration of physical property parameters for Agropyron seeds in a discrete element simulation. Trans. CSAE 2020, 36, 46–54. [Google Scholar] [CrossRef]
  39. Shi, L.R.; Ma, Z.T.; Zhao, W.Y.; Yang, X.P.; Sun, B.G.; Zhang, J.P. Calibration of simulation parameters of flaxed seeds using discrete element method and verification of seed-metering test. Trans. CSAE 2019, 35, 25–33. [Google Scholar] [CrossRef]
  40. Shu, C.X.; Yang, J.; Wang, X.Y.; Yuan, J.C.; Liao, Y.T.; Liao, Q.X. Calibration and experiment of the discrete element simulation parameters of rape threshing mixture in combine harvester. Trans. CSAE 2022, 38, 34–43. [Google Scholar] [CrossRef]
  41. Hao, J.J.; Wei, W.B.; Huang, P.C.; Qing, J.H.; Zhao, J.G. Calibration and experimental verification of discrete element parameters of oil sunflower seeds. Trans. CSAE 2021, 37, 36–44. [Google Scholar] [CrossRef]
  42. Shen, H.H.; Zhang, H.; Fan, J.K.; Xu, R.Y.; Zhang, X.M. Influence of contact radius on rock mechanical property and its application in discrete element method software EDEM. Rock Soil Mech. 2022, 43, 580–590+600. [Google Scholar] [CrossRef]
Figure 1. Bonding particle model: (a) Principle of BPM; (b) EUO samara; (c) 3D model of EUO samara; (d) Bonding model of EUO samara.
Processes 11 02971 g001
Figure 2. Bench tests: (a) The Texture Analyzer; (b) The inclined plane method; (c) Drop experiment; (d) Inclined plane method.
Processes 11 02971 g002
Figure 3. Simulation modeling process: (a) Importing the EUO samara model; (b) Filling particles; (c) Whole particle generation; (d) Particle replacement; (e) Shear experiments model; (f) Shearing simulation process.
Processes 11 02971 g003
Figure 4. Results of the single-factor experiments: (a) the particle contact radius; (b) the normal stiffness per unit area; (c) the shear stiffness per unit area; (d) the critical normal stress; (e) the critical shear stress; (f) the bonded disk radius.
Processes 11 02971 g004
Figure 5. Response surface diagrams: (a) the particle contact radius and the normal stiffness per unit area, (b) the particle contact radius and the shear stiffness per unit area, (c) the particle contact radius and the bonded disk radius, (d) the normal stiffness per unit area and the shear stiffness per unit area, (e) the normal stiffness per unit area and the bonded disk radius, and (f) the shear stiffness per unit area and the bonded disk radius.
Processes 11 02971 g005
Table 1. Parameters of bond model of EUO samara.
ParametersValue
Particle contact radius x 1 (mm)0.6–1.0
Normal stiffness per unit area x 2 (N m−3)9.0 × 10⁶–9.0 × 10⁷
Shear stiffness per unit area x 3 (N m−3)9.0 × 10⁶–9.0 × 10⁷
Critical normal stress x 4 (Pa)9.0 × 10⁵–9.0 × 10⁶
Critical shear stress x 5 (Pa)9.0 × 10⁵–9.0 × 10⁶
Bonded disk radius x 6 (mm)0.6–1.0
Table 2. The Single-factor experiment level.
Level x 1
(mm)
x 2
(×107 N/m3)
x 3
(×107 N/m3)
x 4
(×106 Pa)
x 5
(×106 Pa)
x 6
(mm)
10.60.90.90.90.90.6
20.72.02.02.02.00.7
30.84.04.04.04.00.8
40.96.06.06.06.00.9
51.09.09.09.09.01.0
Table 3. The two-level factorial experiments protocol and results.
No. x 1
(mm)
x 2
(×107 N/m3)
x 3
(×107 N/m3)
x 4
(×106 Pa)
x 5
(×106 Pa)
x 6
(mm)
Shear Force
(N)
10.84.02.02.02.00.835.6
20.84.04.02.04.00.739.9
30.82.02.04.04.00.828.8
40.82.04.02.02.00.836.9
50.72.02.02.02.00.715.3
60.72.02.04.02.00.821.3
70.84.04.04.04.00.844.5
80.74.04.02.02.00.730.6
90.72.04.02.04.00.833.8
100.72.04.04.04.00.722.6
110.74.02.04.04.00.716.6
120.82.04.04.02.00.734.0
130.74.04.04.02.00.835.9
140.84.02.04.02.00.732.6
150.82.02.02.04.00.723.4
160.74.02.02.04.00.825.8
Table 4. Analysis of variance of the two-level factorial experiments.
SourceSum of
Squares
Degree of
Freedom
Mean
Square
F Valuep Value
Model1047.431380.57291.660.0034
x 1 340.401340.401232.230.0008
x 2 128.821128.82466.330.0021
x 3 388.091388.091404.850.0007
x 4 1.5611.565.660.1405
x 5 2.8912.8910.460.0838
x 6 141.611141.61512.620.0019
Residual0.552520.2762
Note: p < 0.01 (extremely significant), 0.01 ≤ p < 0.05 (significant).
Table 5. The steepest climb experiments protocols and results.
No. x 1
(mm)
x 2
(×107 N/m3)
x 3
(×107 N/m3)
x 6
(mm)
Shear Force
(N)
10.631.71.70.637.9
20.672.22.20.6711.3
30.712.72.70.7117.8
40.753.23.20.7530.9
50.793.73.70.7940.9
60.834.24.20.8261.2
Table 6. The Box–Behnken response surface experiments protocols and results.
No. x 1
(mm)
x 2
(×107 N/m3)
x 3
(×107 N/m3)
x 6
(mm)
Shear Force
(N)
Relative Error e
(%)
10.793.23.20.7936.413.95
20.833.73.70.8344.85.91
30.793.74.20.8344.85.91
40.793.73.70.7940.64.02
50.794.23.70.8346.29.22
60.793.73.70.7940.83.55
70.753.73.70.7536.114.66
80.833.73.70.7543.63.07
90.793.74.20.7542.00.71
100.794.23.70.7541.90.95
110.793.24.20.7942.70.95
120.834.23.70.7947.111.35
130.833.73.20.7944.55.20
140.794.24.20.7946.49.69
150.793.73.20.8343.83.55
160.793.23.70.8342.70.95
170.753.73.70.8338.49.22
180.793.73.20.7537.212.06
190.754.23.70.7939.85.91
200.833.23.70.7943.11.89
210.794.23.20.7941.42.13
220.753.74.20.7939.46.86
230.793.73.70.7940.54.26
240.793.23.70.7536.912.77
250.793.73.70.7940.24.96
260.753.73.20.7936.413.95
270.753.23.70.7937.012.53
280.833.74.20.7948.514.66
Table 7. Analysis of variance of the Box–Behnken response surface experiments.
SourceSum of
Squares
Degree of
Freedom
Mean
Square
F Valuep Value
Model318.081422.7217.74<0.0001
x 1 165.021165.02128.85<0.0001
x 2 48.00148.0037.48<0.0001
x 3 48.40148.4037.79<0.0001
x 6 44.08144.0834.42<0.0001
x 1 x 2 0.3610.360.280.6049
x 1 x 3 0.2510.250.200.6659
x 1 x 6 0.3010.300.240.6351
x 2 x 3 0.4210.420.330.5755
x 2 x 6 0.5610.560.440.5191
x 3 x 6 3.6113.612.820.1170
x 1 2 0.7910.790.620.4468
x 2 2 3.1513.152.460.1406
x 3 2 5.5615.564.340.0575
x 6 2 0.6310.630.490.4942
Residual16.65131.28
Lack of fit16.46101.6526.340.0105
Pure error0.1930.062
Cor total334.7327
Note: p < 0.01 (extremely significant), 0.01 ≤ p < 0.05 (significant).
Disclaimer/Publisher’s Note: The statements, opinions and data contained in all publications are solely those of the individual author(s) and contributor(s) and not of MDPI and/or the editor(s). MDPI and/or the editor(s) disclaim responsibility for any injury to people or property resulting from any ideas, methods, instructions or products referred to in the content.

