


Permeability Enhancement Mechanism of Acidizing in Steam-Assisted Gravity Flooding Wells

 ,
,
Abstract
:1. Introduction
2. Experimental Section
2.1. Acid Sensitivity Experiment of Rocks in Intervals with Low Physical Properties
2.2. Optimization of Acidizing Formula Systems for Intervals with Low Physical Properties
2.2.1. Experimental Methods
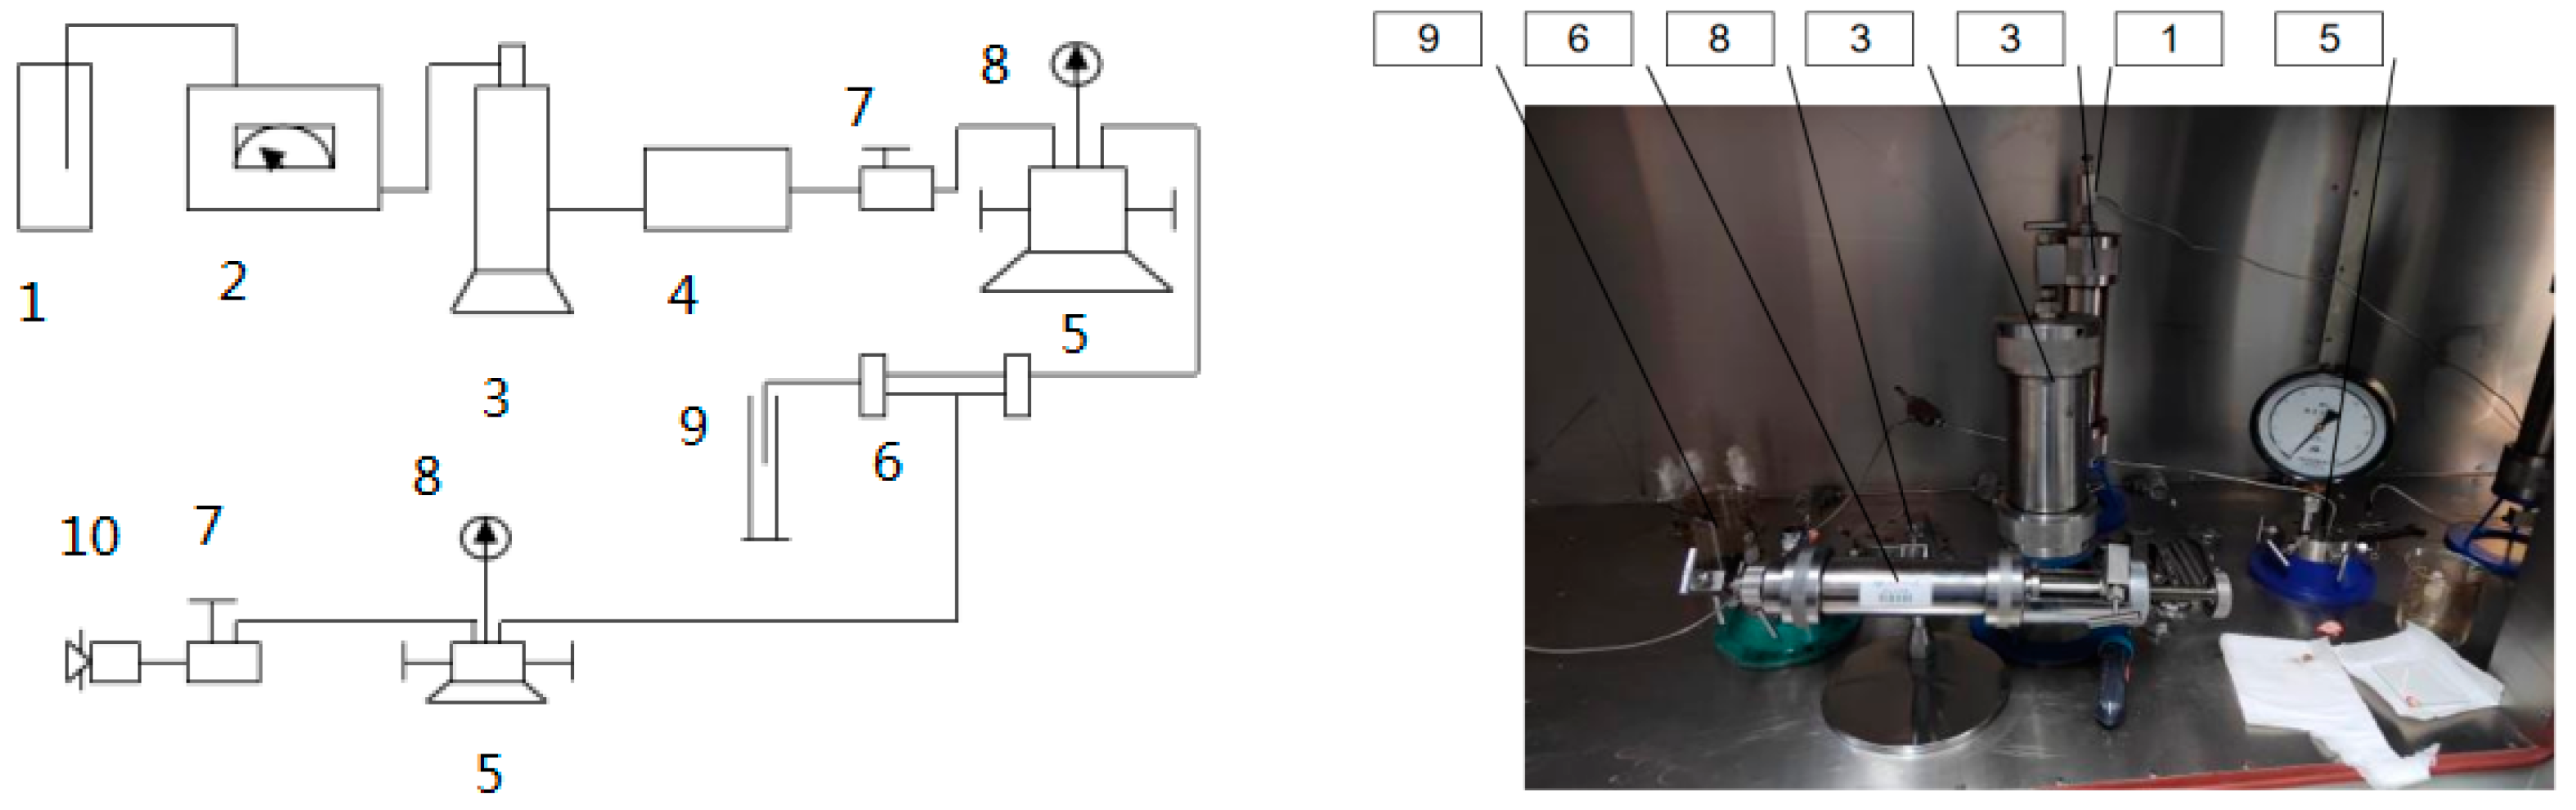
2.2.2. Experimental Instruments and Equipment
2.2.3. Experimental Procedures
2.3. Acidizing for Permeability Enhancement Experiment of Rocks in Intervals with Low Physical Properties
3. Results and Discussion
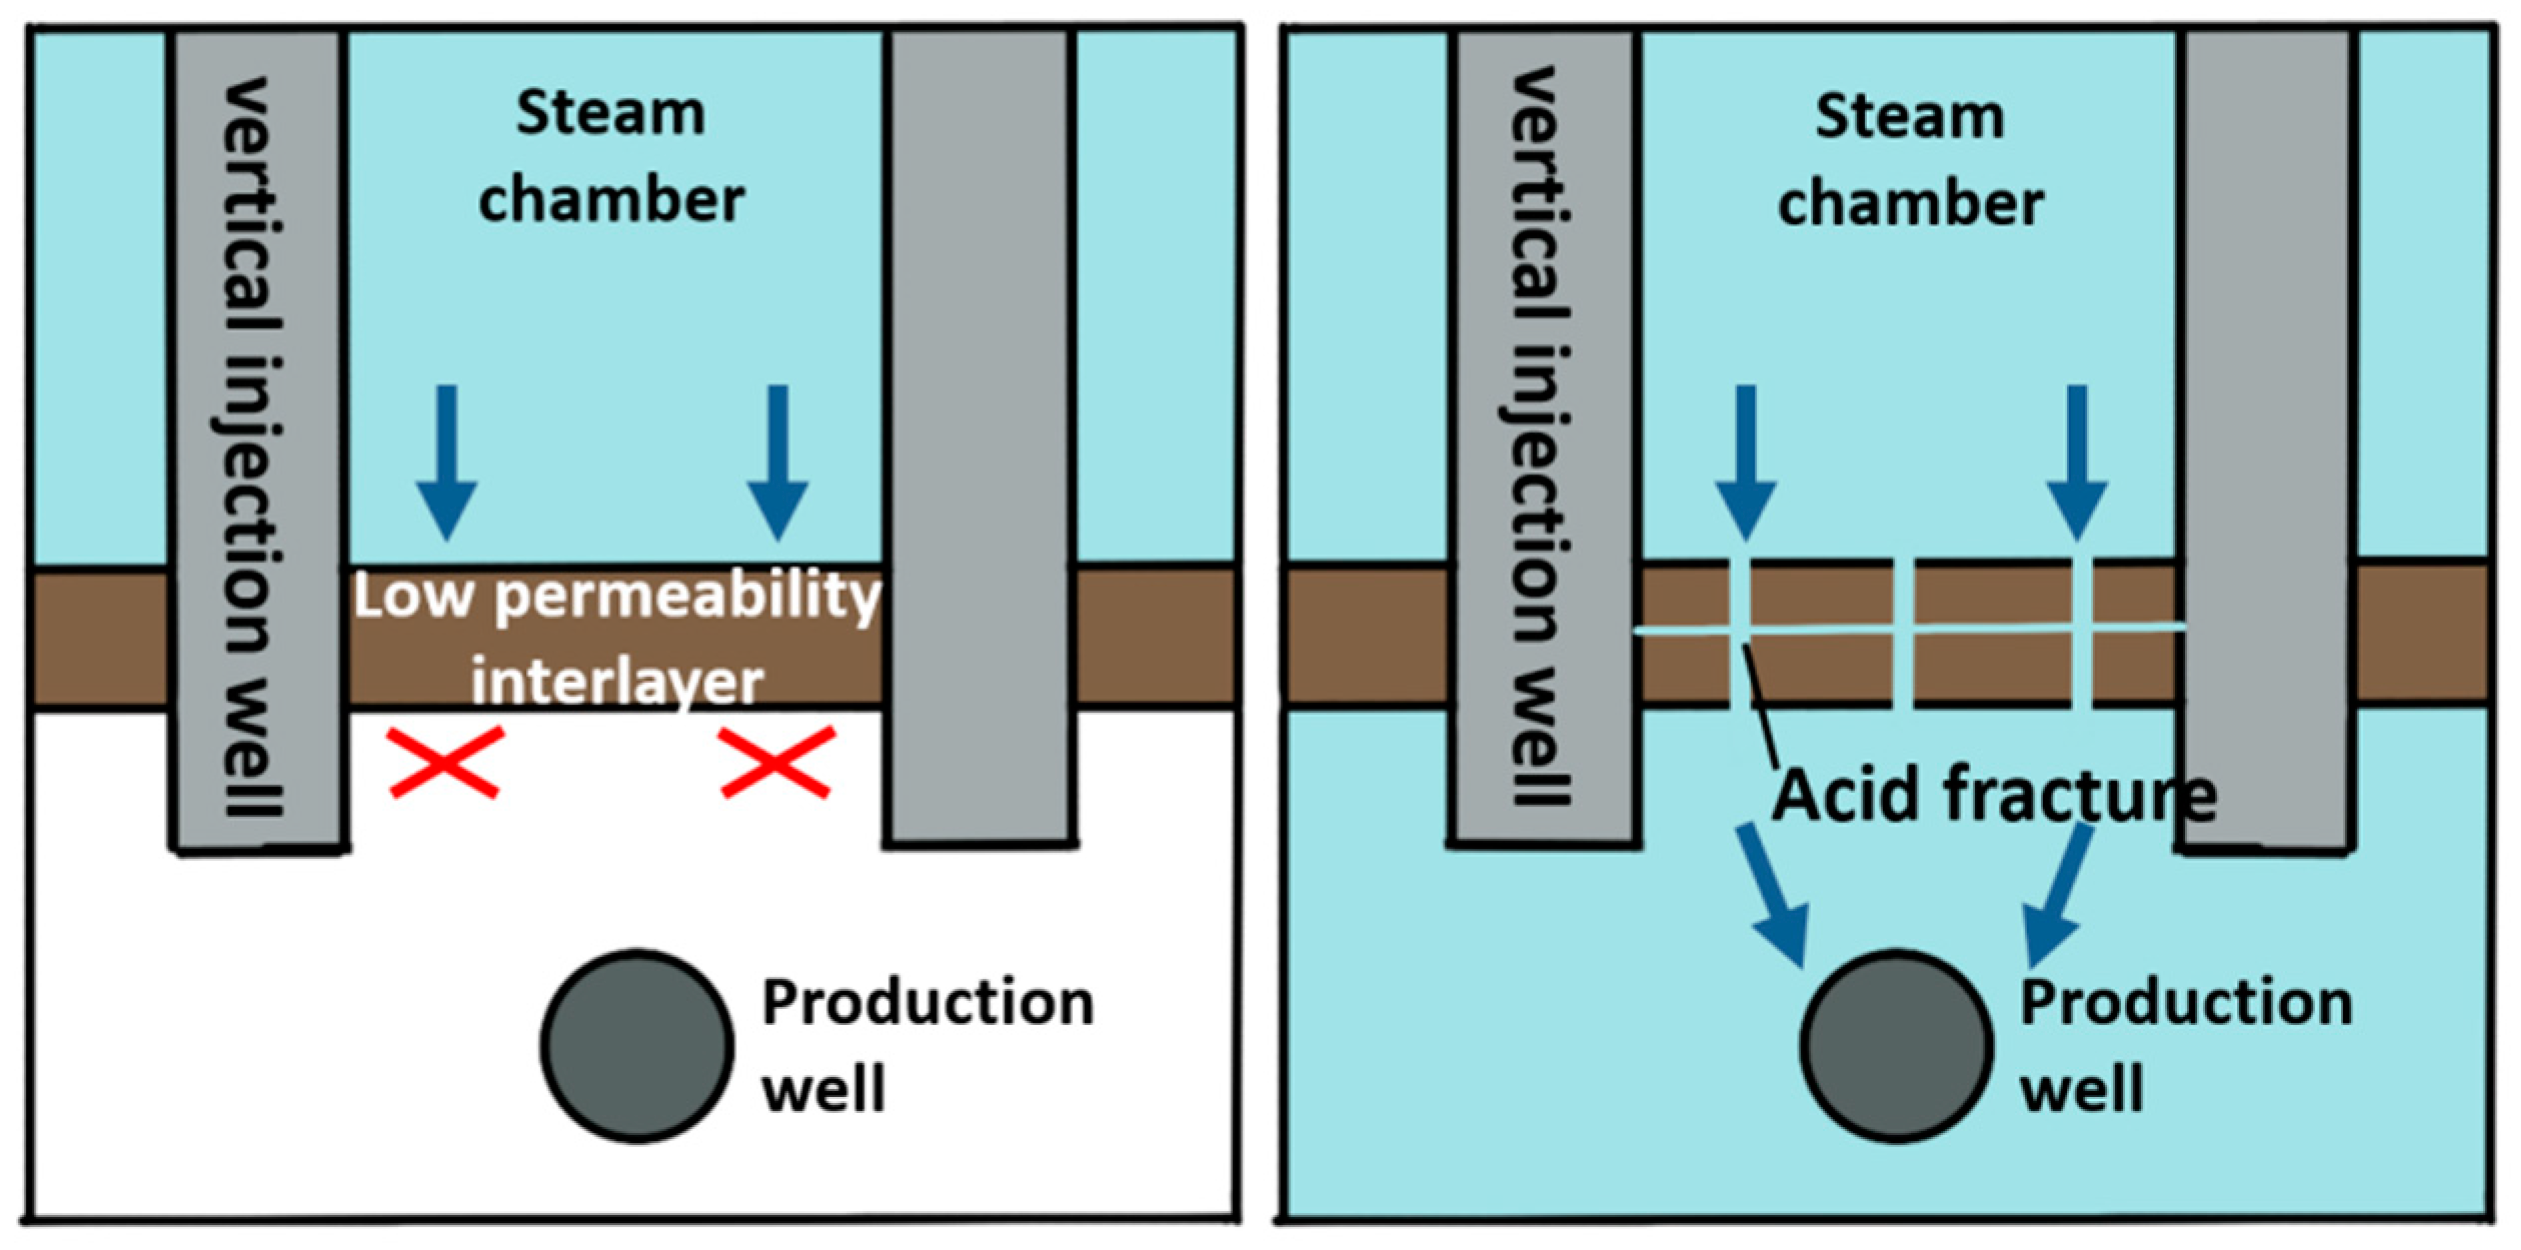
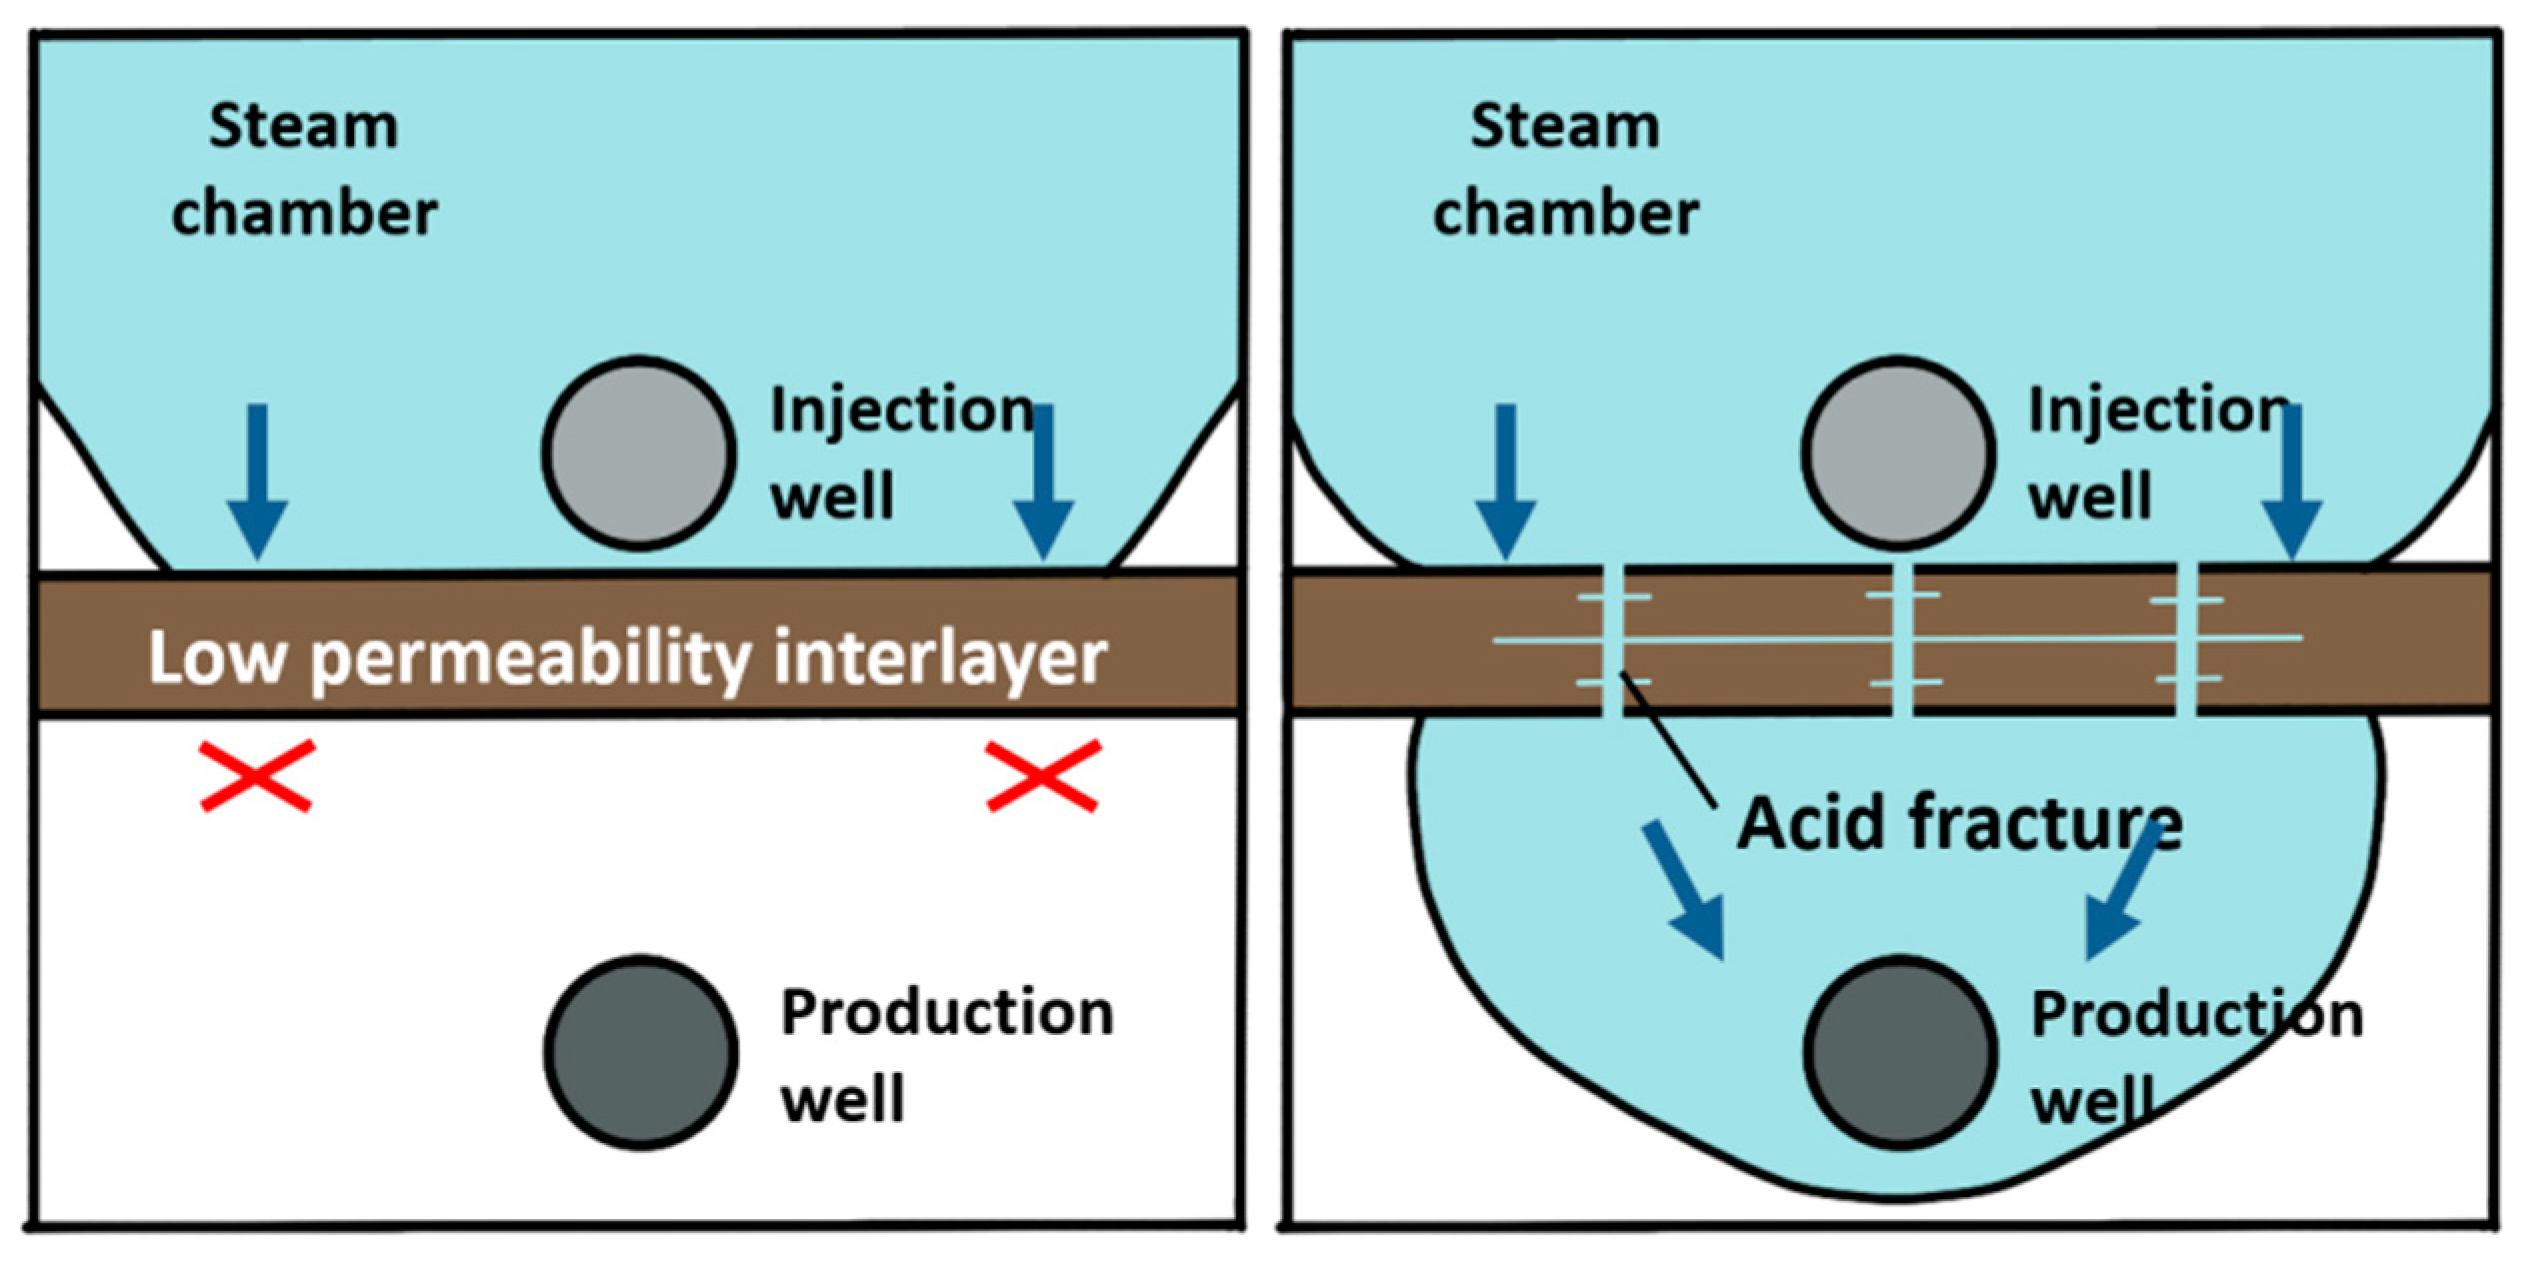
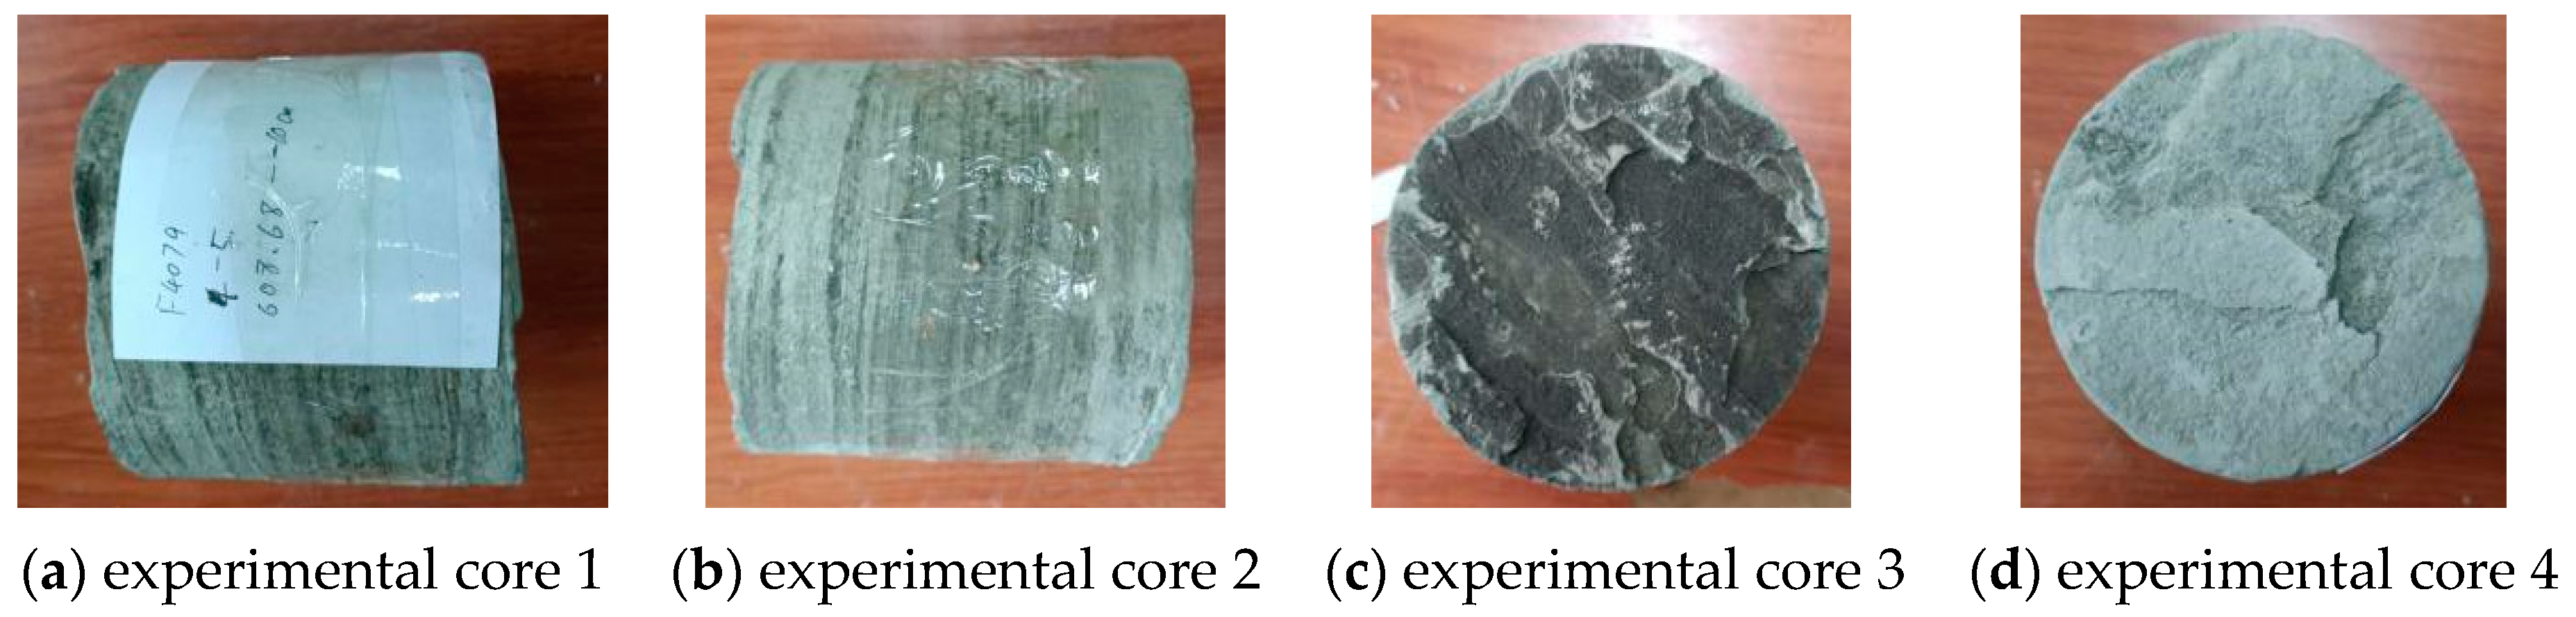
3.1. Basic Characteristics of Low Physical Intervals Developed by SAGD Method
3.2. Optimization of Acidizing Formula System for Low Physical Property Intervals
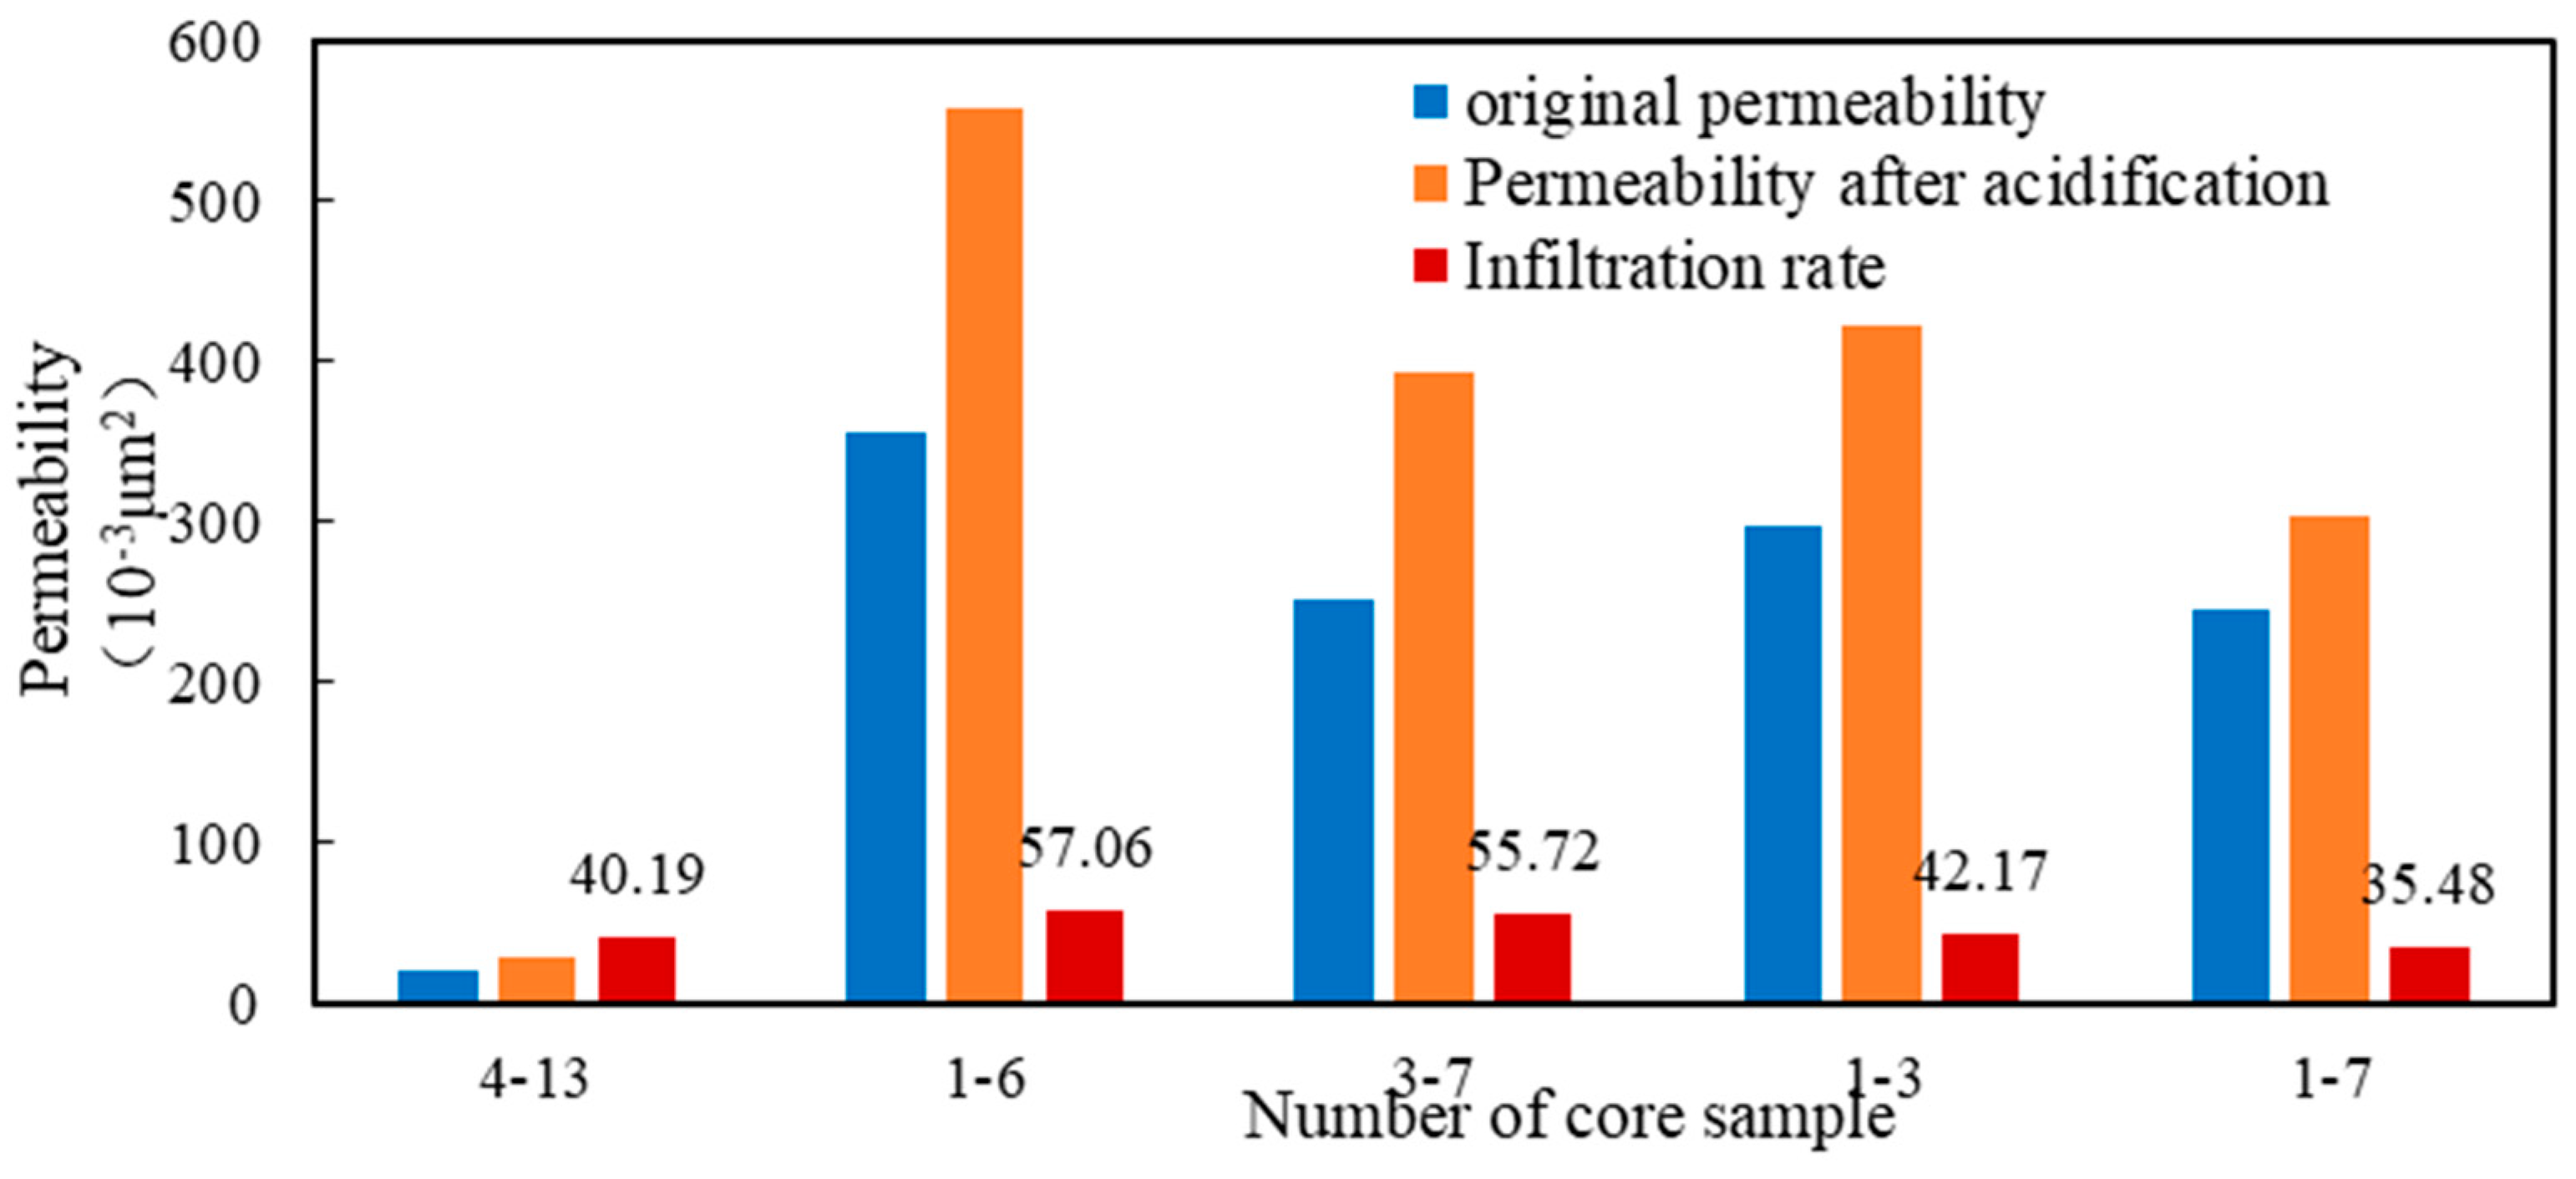
3.3. Permeability Enhancement Effect Achieved by Acidizing the Intervals with Low Physical Properties of Wells Developed by SAGD Method
4. Conclusions
- (1)
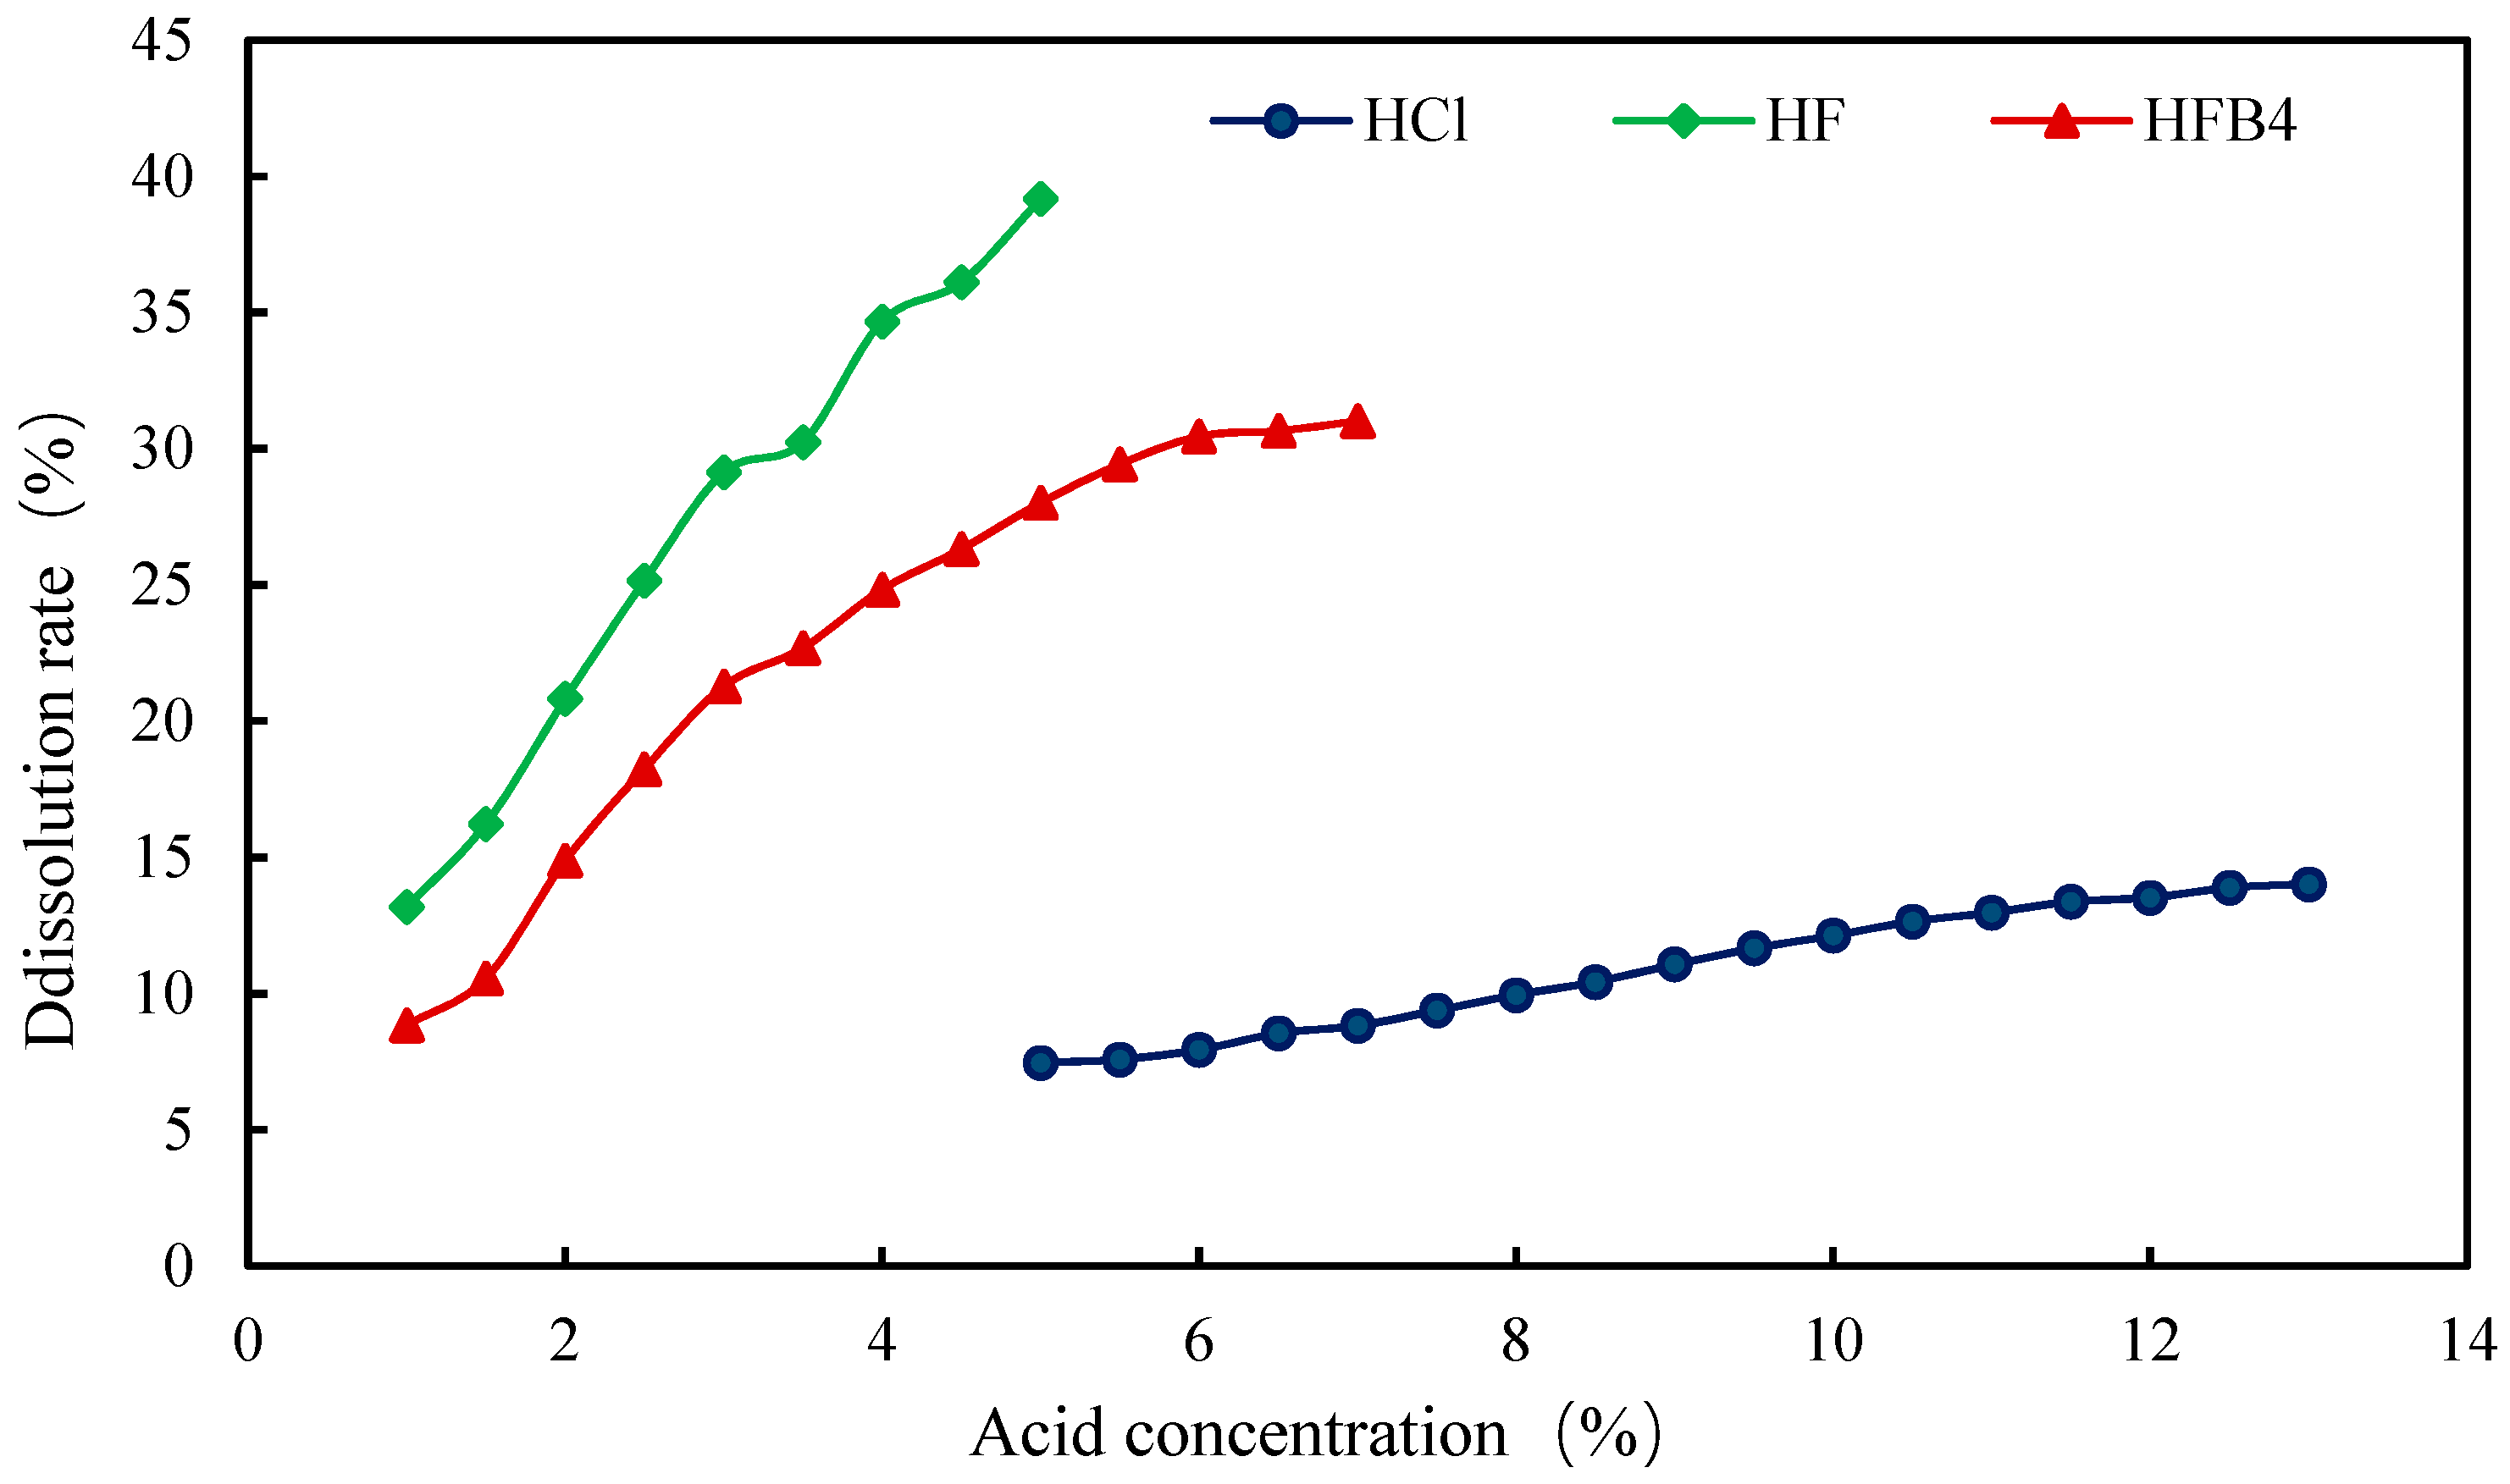
- The results of core dissolution experiments showed that hydrochloric acid and polyphosphate had poor dissolution effects on the formation. Although hydrofluoric acid and fluoroboric acid, especially fluoroboric acid, had good dissolution effects, they were prone to form small particles that plugged pores after dissolution.
- (2)
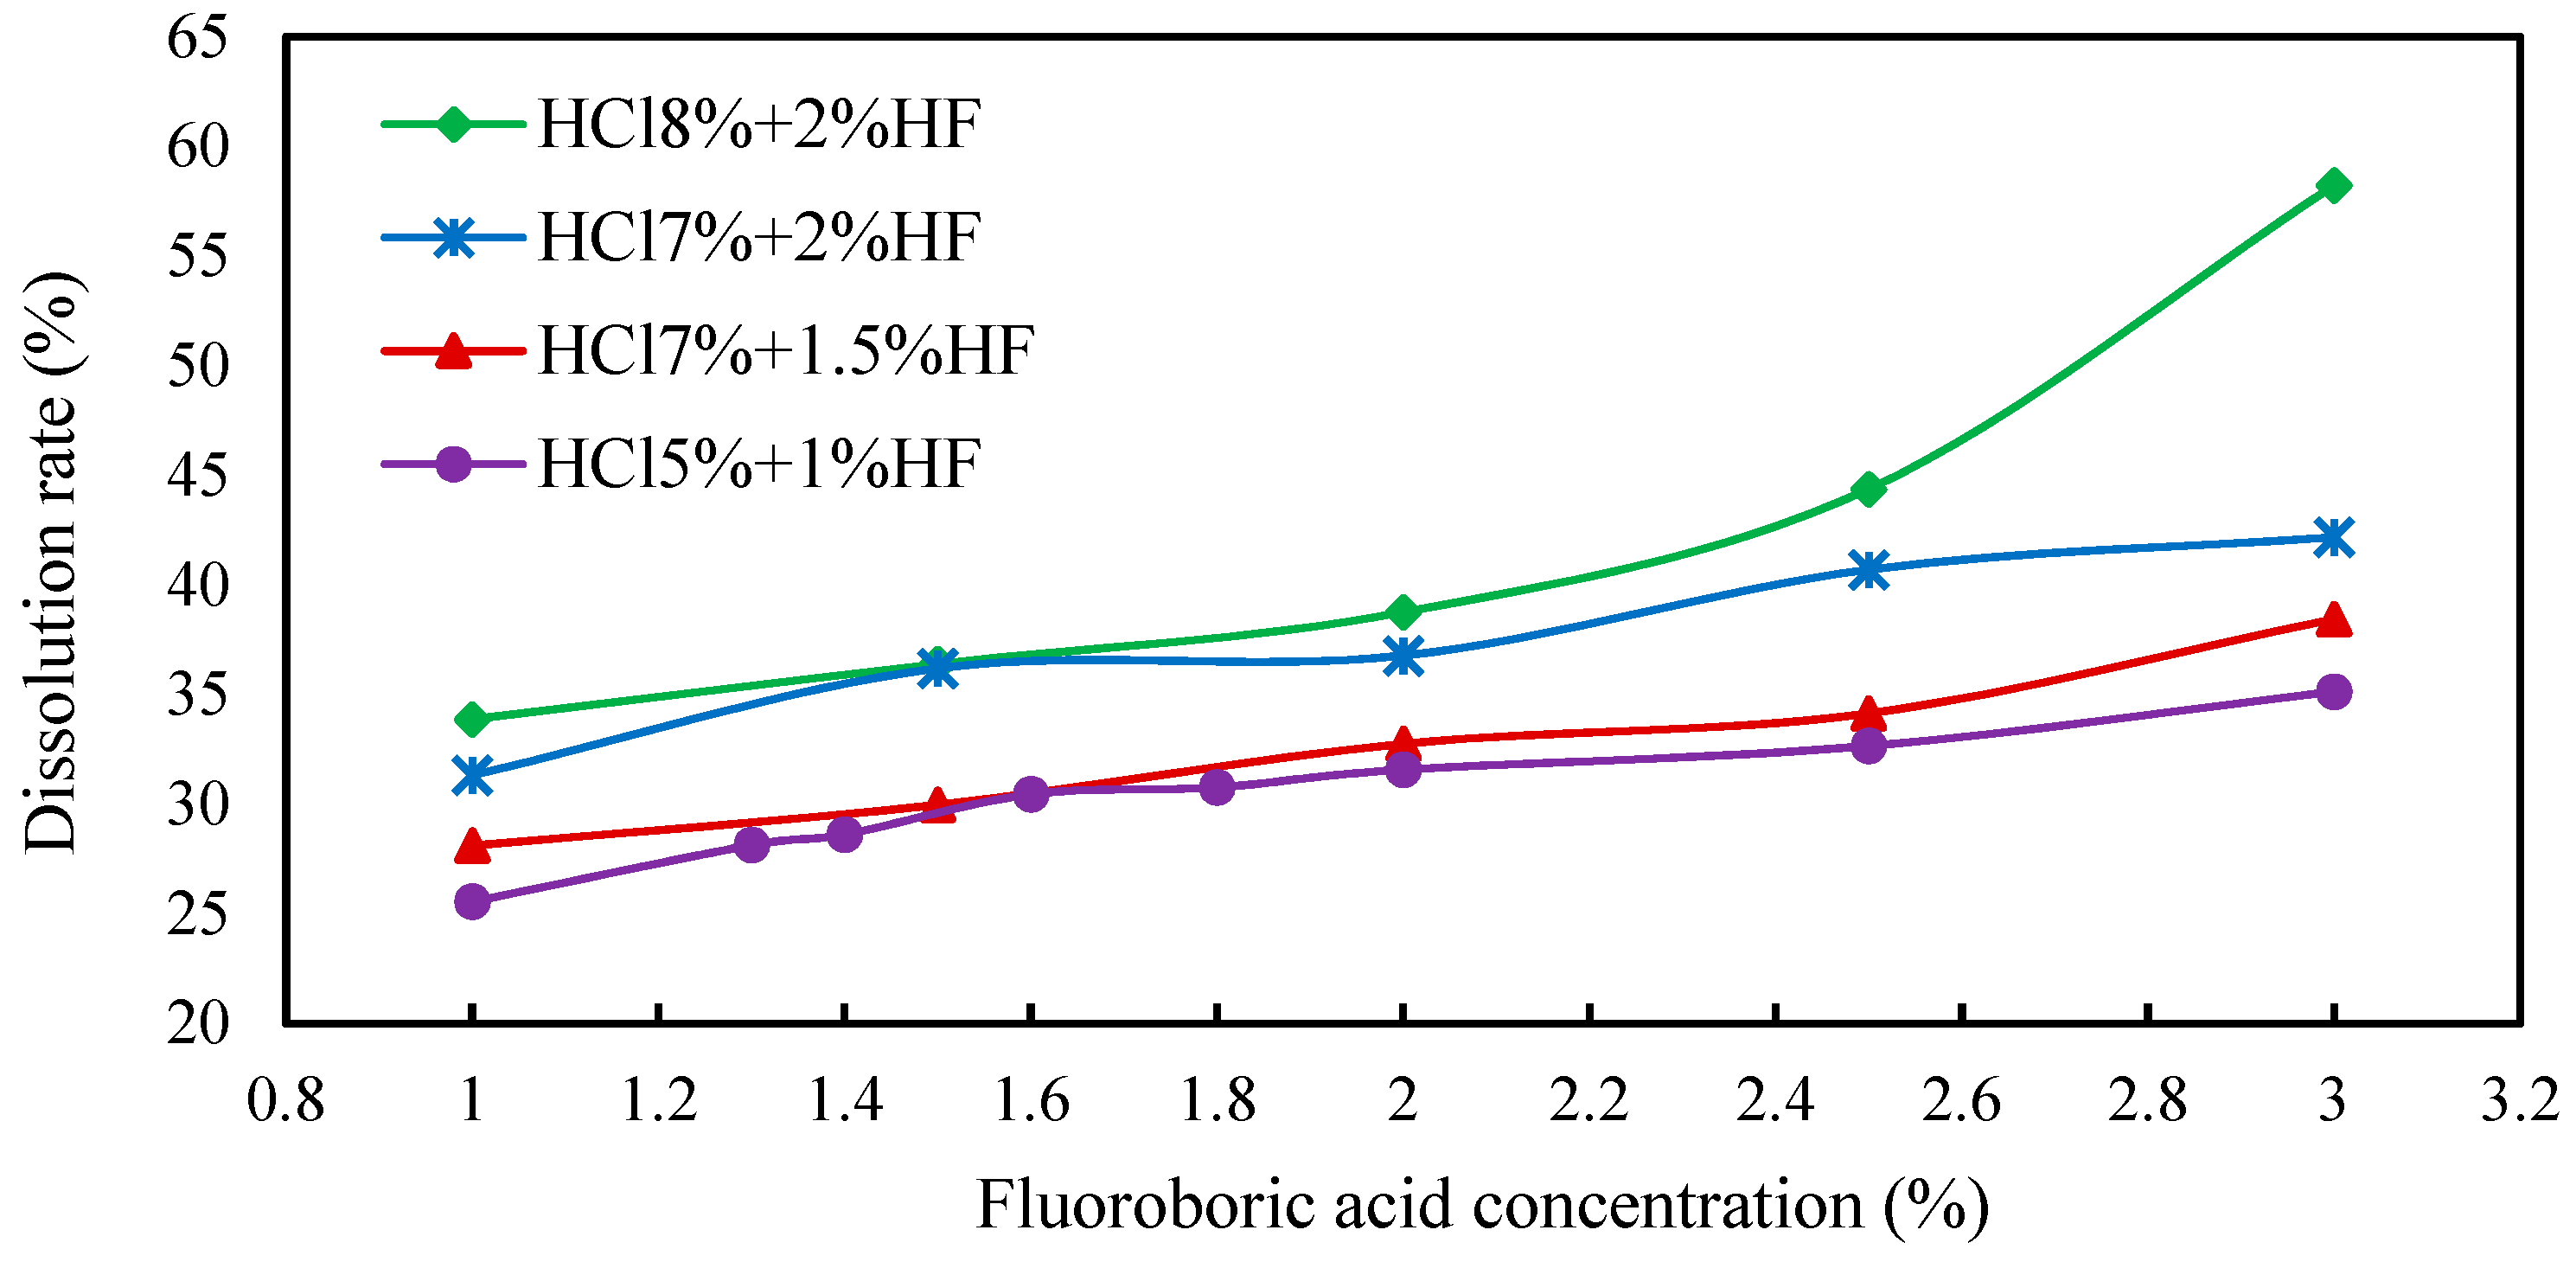
- The combination of multiple acids can effectively address the problem of particle migration, thereby improving the permeability enhancement ability. The actual permeability-enhancing capacity of the acid fracturing working fluid formula ‘4% hydrochloric acid + 2% polyphosphate + 5% fluoroboric acid + 4% acetic acid + 2% ethanol’ was verified with the natural core of the corresponding block.
- (3)
- Acidizing measures implemented on-site led to the beginning of a reduction in water cut and increase in oil production, indicating that applying acidizing could enhance permeability. The range of enhancement permeability of the acidizing system in intervals with low physical properties of the reservoir developed via SAGD flooding was 35.48%~57.06%.
Author Contributions
Funding
Data Availability Statement
Conflicts of Interest
References
- Ugursal, A.; Zhu, D.; Hill, A.D. Development of Acid Fracturing Model for Naturally Fractured Reservoirs. SPE Prod. Oper. 2019, 34, 735–748. [Google Scholar] [CrossRef]
- Chen, X.; Luo, Z.; Zhao, L.; Xiong, X.; Chen, W.; Miao, W.; Zhang, N.; Chen, X. Hydraulic, acid, and proppant-carrying acid fracturing stimulation of volcanic reservoirs in Sichuan Basin, China: An experimental study. Pet. Sci. Technol. 2023, 41, 731–749. [Google Scholar] [CrossRef]
- Lin, H.; Hou, T.; Wang, F.; Yue, L.; Liu, S.; Yuan, G.; Wang, G.; Liu, Y.; Wang, Q.; Zhou, F. Experimental Study of Acid Etching and Conductivity of High-Temperature-Resistant Cross-Linked Acid. Processes 2023, 11, 722. [Google Scholar] [CrossRef]
- Al-Bahlani, A.M.; Babadagli, T. SAGD laboratory experimental and numerical simulation studies: A review of current status and future issues. J. Pet. Sci. Eng. 2009, 68, 135–150. [Google Scholar] [CrossRef]
- Butler, R.M.; Mcnab, G.S.; Lo, H.Y. Theoretical studies on the gravity drainage of heavy oil during in-situ steam heating. Can. J. Chem. Eng. 1981, 59, 455–460. [Google Scholar] [CrossRef]
- Cheng, Q.; Cao, G.; Bai, Y.; Zhu, Z.; Zhang, Z.; Li, D. Probing the Demulsification Mechanism of Emulsion with SPAN Series Based on the Effect of Solid Phase Particles. Molecules 2023, 28, 3261. [Google Scholar] [CrossRef]
- Shin, H.; Polikar, M. Optimizing the SAGD Process in Three Major Canadian Oil-Sands Areas. In Proceedings of the SPE Annual Technical Conference and Exhibition, Dallas, TX, USA, 9–12 October 2005. [Google Scholar]
- Polikar, M.; Cyr, T.J.; Coates, R.M. Fast-SAGD: Half the Wells and 30% Less Steam. In Proceedings of the SPE/CIM International Conference on Horizontal Well Technology, Calgary, AB, Canada, 6–8 November 2000. [Google Scholar]
- Shin, H.; Polikar, M. Review of Reservoir Parameters to Optimize SAGD and Fast-SAGD Operating Conditions. J. Can. Pet. Technol. 2007, 46, 35–41. [Google Scholar] [CrossRef]
- Ito, Y.; Suzuki, S. Numerical Simulation of the SAGD Process in the Hangingstone Oil Sands Reservoir. Can. Pet. Technol. 1999, 38, 27–35. [Google Scholar] [CrossRef]
- Ito, Y.; Ipek, G. Steam-Fingering Phenomenon During SAGD Process. In Proceedings of the SPE International Thermal Operations and Heavy Oil Symposium, Calgary, AB, Canada, 1–3 November 2005. [Google Scholar]
- Gates, I.D.; Chakrabarty, N. Optimization of Steam Assisted Gravity Drainage in McMurray Reservoir. Can. Pet. Technol. 2006, 45, 54–62. [Google Scholar] [CrossRef]
- Gates, I.D.; Kenny, J.; Hernandez-Hdez, I.L.; Bunio, G.L. Steam-Injection Strategy and Energetics of Steam-Assisted Gravity Drainage. SPE Res. Eval. Eng. 2007, 10, 19–34. [Google Scholar] [CrossRef]
- Sharma, J.; Gates, I.D. Multiphase flow at the edge of a steam chamber. Can. J. Chem. Eng. 2010, 88, 312–321. [Google Scholar] [CrossRef]
- Mou, J.; He, J.; Zheng, H.; Zhang, R.; Zhang, L.; Gao, B. A New Model of Temperature Field Accounting for Acid–Rock Reaction in Acid Fracturing in Shunbei Oilfield. Processes 2023, 11, 294. [Google Scholar] [CrossRef]
- Jiang, T.; Wang, H.; Bian, X.; Wang, D.; Zhou, J.; Yu, B. Numerical Simulation on Hydrofracture Propagation in Fractured-Vuggy Unconventional Reservoirs. Geofluids 2022, 2022, 1453–1467. [Google Scholar] [CrossRef]
- Wang, Y.; Yang, J.; Wang, T.; Hu, Q.; Lv, Z.; He, T. Visualization experiment of multi-stage alternating injection acid fracturing. Energy Rep. 2022, 8, 9094–9103. [Google Scholar] [CrossRef]
- Sui, Y.; Cao, G.; Guo, T.; Li, Z.; Bai, Y.; Li, D.; Zhang, Z. Development of gelled acid system in high-temperature carbonate reservoirs. J. Pet. Sci. Eng. 2022, 216, 110836. [Google Scholar] [CrossRef]
- Zhao, H.; Xiong, Y.; Zhen, H.; Liu, C.; Li, X. Experimental investigation on the fracture propagation of three-stage acid fracturing of tight sandstone gas reservoir. J. Pet. Sci. Eng. 2022, 211, 110143. [Google Scholar] [CrossRef]
- Mehrjoo, H.; Norouzi-Apourvari, S.; Jalalifar, H.; Shajari, M. Experimental study and modeling of final fracture conductivity during acid fracturing. J. Pet. Sci. Eng. 2022, 208, 109192. [Google Scholar] [CrossRef]
- Dou, H.; Xie, J.; Xie, J.; Sun, G.; Li, Z.; Wang, Z.; Miao, Y. Study on the mechanism of the influence of HNO3 and HF acid treatment on the CO2 adsorption and desorption characteristics of coal. Fuel 2022, 309, 122187. [Google Scholar] [CrossRef]
- Yan, F.; Shi, Y.; Tian, Y. Synthesis and Characterization of Surfactant for Retarding Acid–Rock Reaction Rate in Acid Fracturing. Front. Chem. 2021, 9, 715009. [Google Scholar] [CrossRef]
- Xu, H.; Cheng, J.; Zhao, Z.; Lin, T.; Liu, G.; Chen, S. Coupled thermo-hydro-mechanical-chemical modeling on acid fracturing in carbonatite geothermal reservoirs containing a heterogeneous fracture. Renew. Energy 2021, 172, 145–157. [Google Scholar] [CrossRef]
- Gou, B.; Zhan, L.; Guo, J.; Zhang, R.; Zhou, C.; Wu, L.; Ye, J.; Zeng, J. Effect of different types of stimulation fluids on fracture propagation behavior in naturally fractured carbonate rock through CT scan. J. Pet. Sci. Eng. 2021, 201, 108529. [Google Scholar] [CrossRef]
- Zhang, Y.; Zheng, Y.; Jiang, B.; Yu, G.; Ren, B.; Yu, C.; Wang, S. Experimental study on the influence of acid fracturing fluid on coal wettability. Fuel 2023, 343, 127965. [Google Scholar] [CrossRef]
- Yang, G.; Butler, R.M. Effects of reservoir heterogeneities on heavy oil recovery by steam-assisted gravity drainage. J. Can. Pet. Technol. 1990, 31, 37–43. [Google Scholar] [CrossRef]
- Kisman, K.E.; Yeung, K.C. Numerical Study of the SAGD Process in the Burnt Lake Oil Sands Lease. In Proceedings of the SPE International Heavy Oil Symposium, Calgary, AB, Canada, 19–21 June 1995. [Google Scholar]
- Chen, Q.; Gerritsen, M.G.; Kovscek, A.R. Effects of Reservoir Heterogeneities on the Steam-Assisted Gravity-Drainage Process. SPE Res. Eval. Eng. 2008, 11, 921–932. [Google Scholar] [CrossRef]
- Ipek, G.; Frauenfeld, T.; Yuan, J.Y. Numerical Study of Shale Issues in SAGD. In Proceedings of the Canadian International Petroleum Conference, Calgary, AB, Canada, 17–19 June 2008. [Google Scholar]
- Fatemi, S.M. The Effect of Geometrical Properties of Reservoir Shale Barriers on the Performance of Steam-assisted Gravity Drainage (SAGD). Energy Sources Part A Recovery Util. Environ. Eff. 2012, 23, 2178–2191. [Google Scholar] [CrossRef]
- Lo, K.K.; Dean, R.H. Modeling of Acid Fracturing. SPE Prod. Eng. 1989, 4, 194–200. [Google Scholar] [CrossRef]
- Oeth, C.V.; Hill, A.D.; Zhu, D. Acid Fracturing: Fully 3D Simulation and Performance Prediction. In Proceedings of the SPE Hydraulic Fracturing Technology Conference, The Woodlands, TX, USA, 4–6 February 2013. [Google Scholar]
- Williams, B.B.; Nierode, D.E. Design of Acid Fracturing Treatments. J. Pet. Technol. 1972, 24, 849–859. [Google Scholar] [CrossRef]
- Crowe, C.W.; Hutchinson, B.H.; Trittipo, B.L. Fluid-Loss Control: The Key to Successful Acid Fracturing. SPE Prod. Eng. 1989, 4, 215–220. [Google Scholar] [CrossRef]
- Zhang, Q.; Liu, P.; Xiong, Y.; Du, J. Self-Generated Organic Acid System for Acid Fracturing in an Ultrahigh-Temperature Carbonate Reservoir. ACS Omega 2023, 8, 12019–12027. [Google Scholar] [CrossRef]
- Li, C.; Song, L.; Cao, Y.; Zhao, S.; Liu, H.; Yang, C.; Cheng, H.; Jia, D. Investigating the Mechanical Property and Enhanced Mechanism of Modified Pisha Sandstone Geopolymer via Ion Exchange Solidification. Gels 2022, 8, 300. [Google Scholar] [CrossRef]
- Ryu, M.; Kim, H.; Lim, M.; You, K.; Ahn, J. Comparison of Dissolution and Surface Reactions Between Calcite and Aragonite in L-Glutamic and L-Aspartic Acid Solutions. Molecules 2010, 15, 258–269. [Google Scholar] [CrossRef] [PubMed]
- Shan, G.; Igarashi, K.; Ooshima, H. Dissolution kinetics of crystals in suspension and its application to L-aspartic acid crystals. Chem. Eng. J. 2002, 88, 53–58. [Google Scholar] [CrossRef]
- Ling, D.; Zhu, S.; Zheng, J.; Xu, Z.; Zhao, Y.; Chen, L.; Shi, X.; Li, J. A simulation method for the dissolution construction of salt cavern energy storage with the interface angle considered. Energy 2023, 263, 125792. [Google Scholar] [CrossRef]


| Core Number | Length (cm) | Diameter (cm) | Dry Weight (g) | Wet Weight (g) | Pore Volume (cm3) | Permeability (10−3 μm2) |
|---|---|---|---|---|---|---|
| 1 | 7.82 | 2.512 | 86.485 | 92.772 | 6.292 | 0.076 |
| 2 | 5.104 | 2.518 | 44.33 | 50.22 | 5.89 | 0.083 |
| 3 | 8.44 | 2.508 | 93.275 | 100.21 | 6.935 | 0.072 |
| 4 | 5.41 | 2.49 | 73.641 | 79.96 | 6.319 | 0.073 |
| Core Number | Length (cm) | Diameter (cm) | Formation Water Viscosity (mPa·s) | Dry Weight (g) | Wet Weight (g) | Pore Volume (cm3) | Flow Rate (mL/min) |
|---|---|---|---|---|---|---|---|
| 1 | 5.41 | 2.49 | 0.5 | 62.34 | 71.59 | 9.25 | 0.30 |
| 2 | 7.17 | 2.51 | 0.5 | 64.28 | 72.80 | 8.52 | 0.30 |
| 3 | 6.32 | 2.50 | 0.5 | 63.95 | 72.81 | 8.86 | 0.30 |
| 4 | 5.86 | 2.49 | 0.5 | 63.51 | 72.64 | 9.13 | 0.30 |
| Core Number | (10−3 μm2) | Kad (10−3 μm2) | Acid Sensitivity Index Ia (%) | Level of Sensitivity |
|---|---|---|---|---|
| 1 | 0.076 | 0.025 | 65.5 | pole-strength |
| 2 | 0.083 | 0.034 | 65.41 | pole-strength |
| 3 | 0.072 | 0.033 | 67.12 | pole-strength |
| 4 | 0.073 | 0.028 | 56.31 | pole-strength |
| Core Number | Quartz | Potash Feldspar | Plagioclase | Calcite | Ankerite | Dolomite | Siderite | Pyrite | Clay Mineral |
|---|---|---|---|---|---|---|---|---|---|
| 1 | 52.4 | 25.4 | 18.0 | 0.2 | 1.1 | - | - | - | 2.8 |
| 2 | 32.4 | 19.1 | 29.7 | - | - | 1.8 | 16.2 | - | 0.8 |
| 3 | 22.5 | 20.5 | 42.0 | - | - | - | 9.7 | - | 5.2 |
| 4 | 17.6 | 14.3 | 16.7 | - | - | - | 44.0 | - | 7.4 |
| Number | Formular |
|---|---|
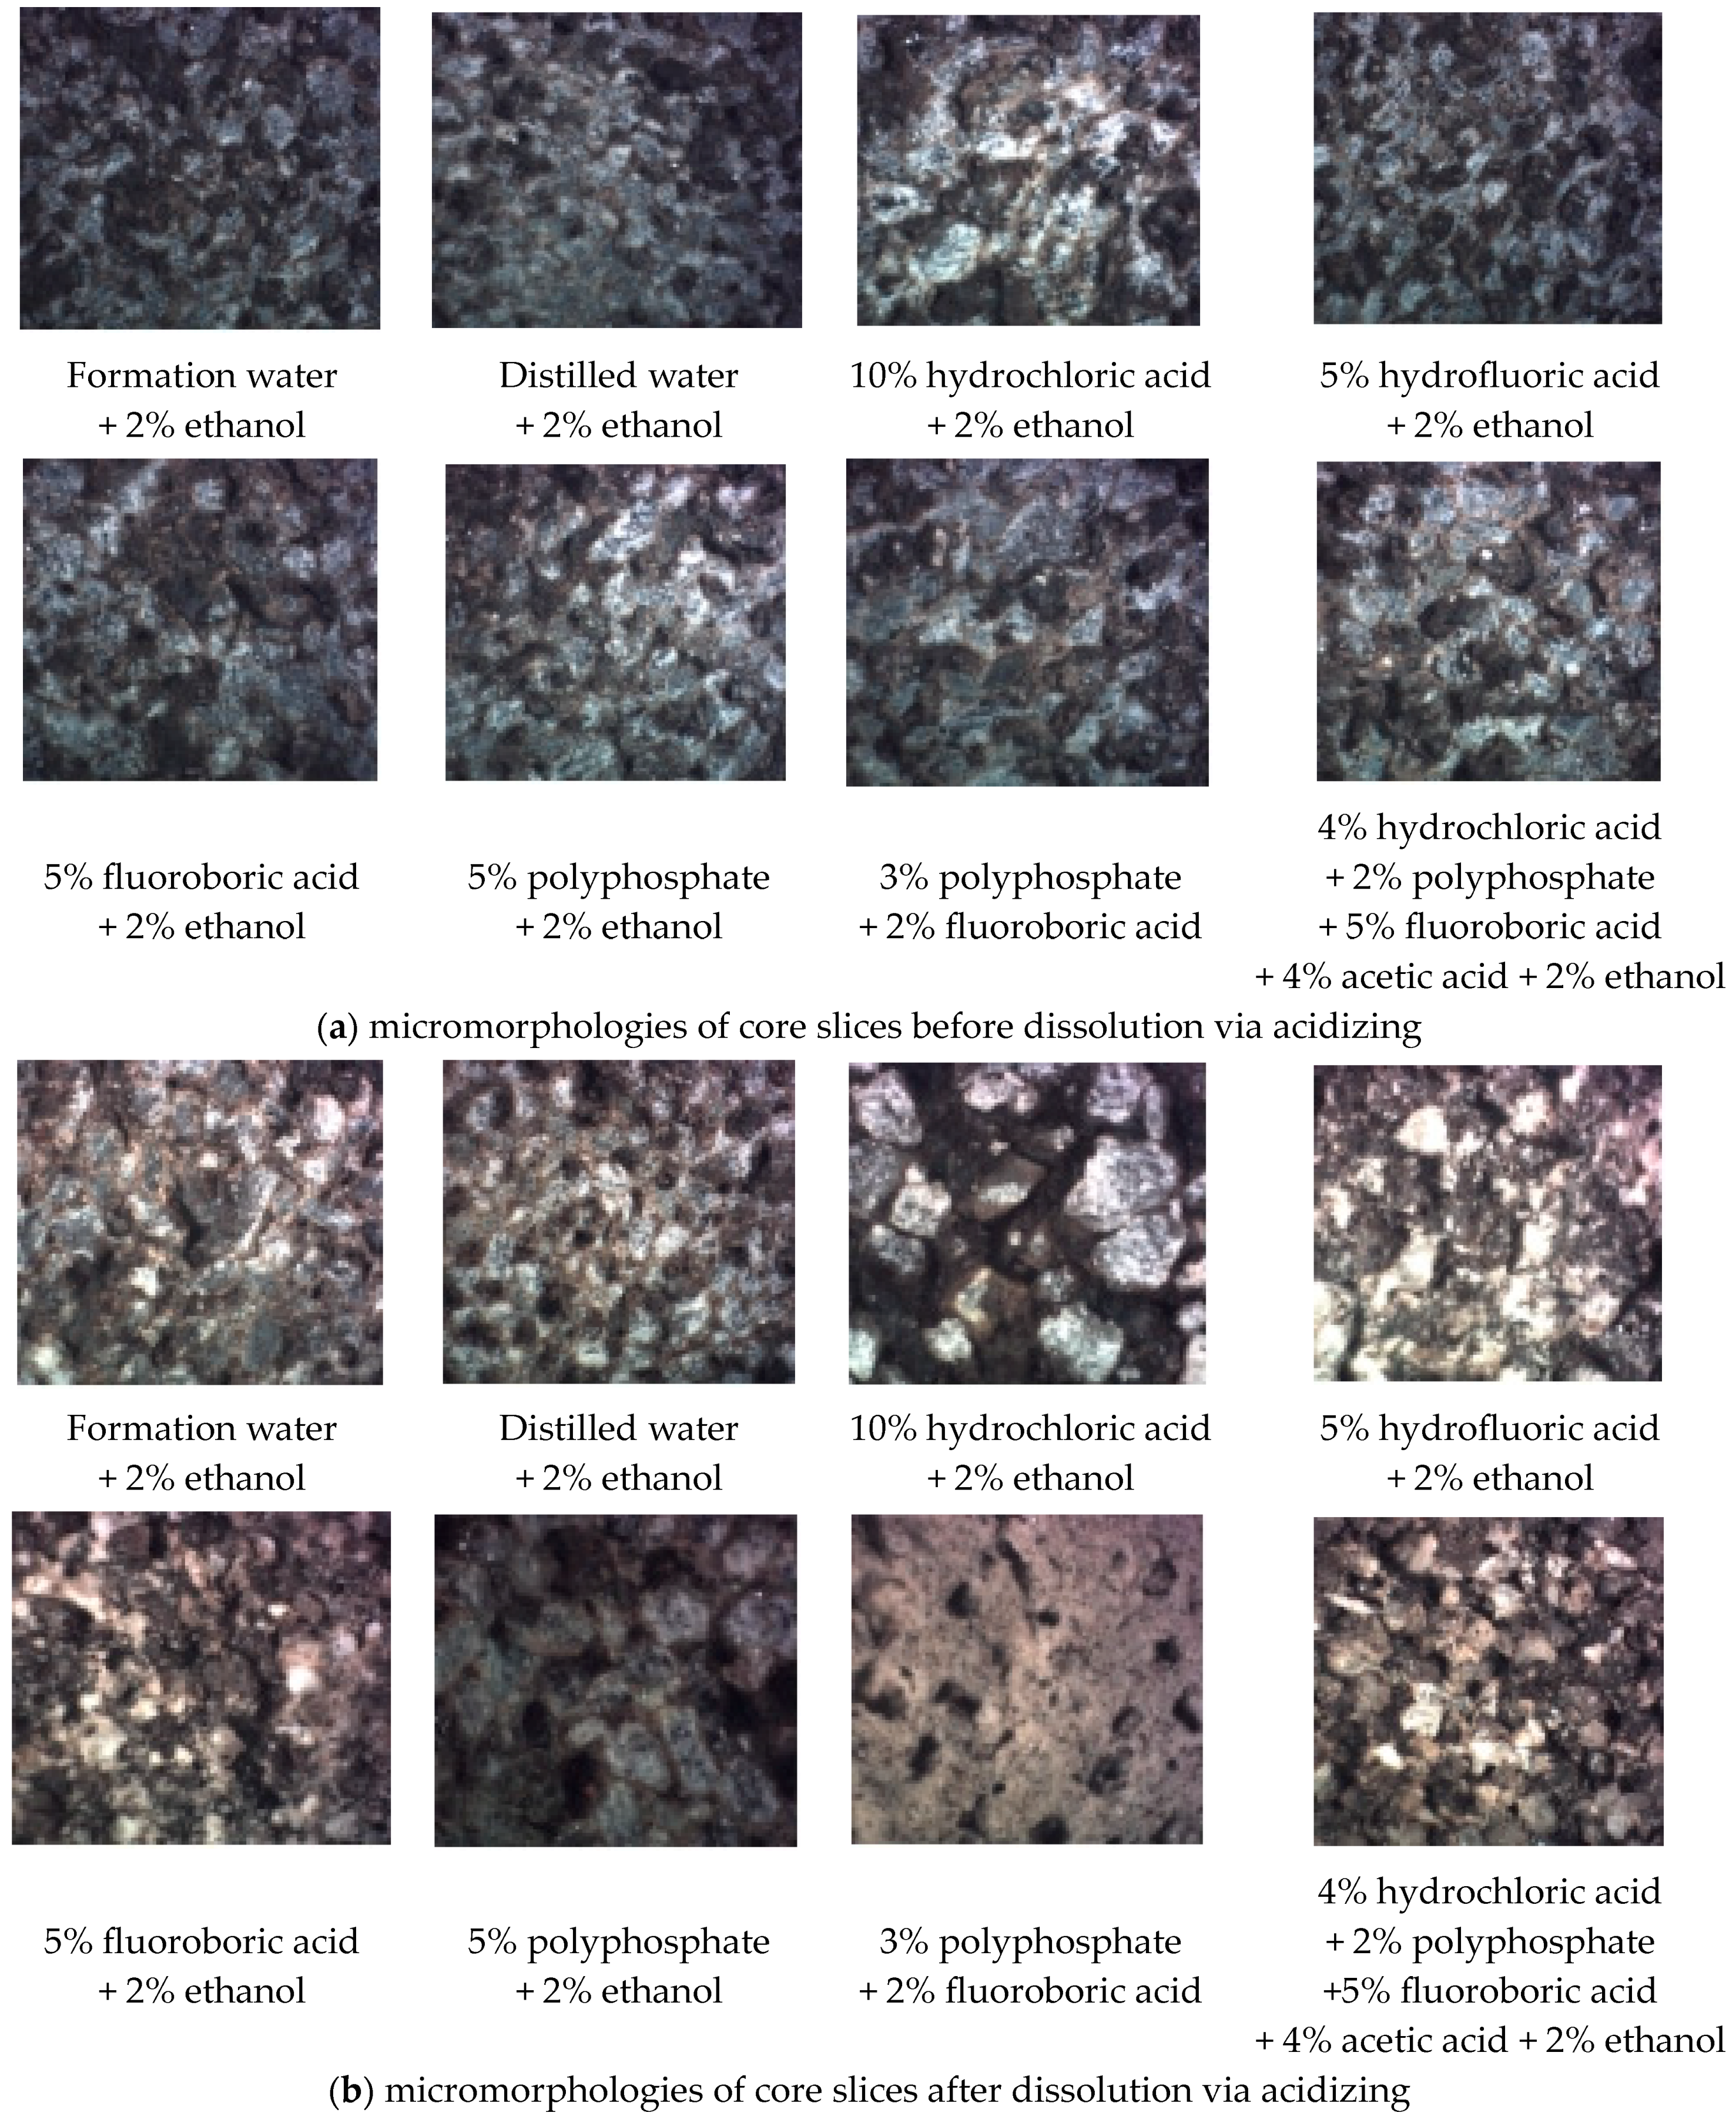
| 1 | Formation water + 2% ethanol |
| 2 | Distilled water + 2% ethanol |
| 3 | 10% hydrochloric acid + 2% ethanol |
| 4 | 5% hydrofluoric acid + 2% ethanol |
| 5 | 5% fluoroboric acid + 2% ethanol |
| 6 | 5% polyphosphate + 2% ethanol |
| 7 | 3% polyphosphate + 2% fluoroboric acid |
| 8 | 4% hydrochloric acid + 2% polyphosphate + 5% fluoroboric acid + 4% acetic acid + 2% ethanol |
Disclaimer/Publisher’s Note: The statements, opinions and data contained in all publications are solely those of the individual author(s) and contributor(s) and not of MDPI and/or the editor(s). MDPI and/or the editor(s) disclaim responsibility for any injury to people or property resulting from any ideas, methods, instructions or products referred to in the content. |
© 2023 by the authors. Licensee MDPI, Basel, Switzerland. This article is an open access article distributed under the terms and conditions of the Creative Commons Attribution (CC BY) license (https://creativecommons.org/licenses/by/4.0/).
Share and Cite
Yu, M.; Xu, C.; Bai, Y.; Zou, C.; Liu, W.; Cao, G.; Yi, X.; Zhang, J. Permeability Enhancement Mechanism of Acidizing in Steam-Assisted Gravity Flooding Wells. Processes 2023, 11, 3004. https://doi.org/10.3390/pr11103004
Yu M, Xu C, Bai Y, Zou C, Liu W, Cao G, Yi X, Zhang J. Permeability Enhancement Mechanism of Acidizing in Steam-Assisted Gravity Flooding Wells. Processes. 2023; 11(10):3004. https://doi.org/10.3390/pr11103004
Chicago/Turabian StyleYu, Ming, Chao Xu, Yujie Bai, Che Zou, Weibo Liu, Guangsheng Cao, Xi Yi, and Jing Zhang. 2023. "Permeability Enhancement Mechanism of Acidizing in Steam-Assisted Gravity Flooding Wells" Processes 11, no. 10: 3004. https://doi.org/10.3390/pr11103004
APA StyleYu, M., Xu, C., Bai, Y., Zou, C., Liu, W., Cao, G., Yi, X., & Zhang, J. (2023). Permeability Enhancement Mechanism of Acidizing in Steam-Assisted Gravity Flooding Wells. Processes, 11(10), 3004. https://doi.org/10.3390/pr11103004