
Numerical Simulation of Fracture Flow Interaction Based on Discrete Fracture Model
by
 ,
,
Fanle Meng
1,2,*,
Youjing Wang
1,
Xinmin Song
1,2,
Mingqiang Hao
1,
Guosheng Qin
1,
You Qi
1,
Zunjing Ma
1 and
Dong Wang
3 1
Research Institute of Petroleum Exploration & Development, PetroChina, Beijing 100083, China
2
State Key Laboratory of Enhanced Oil Recovery, Beijing 100083, China
3
Geological Exploration and Development Research Institute of CNPC Chuanqing Drilling Engineering Co., Ltd., Chengdu 610051, China
*
Author to whom correspondence should be addressed.
Processes 2023, 11(10), 3013; https://doi.org/10.3390/pr11103013
Submission received: 14 September 2023
/
Revised: 8 October 2023
/
Accepted: 11 October 2023
/
Published: 19 October 2023
(This article belongs to the Special Issue Advances in Improving Oil Recovery in Low-Permeability Hydrocarbon Resources)
Abstract
:Hydraulic fracturing of horizontal wells is a common method for enhancing production in low-permeability and unconventional oil reservoirs. However, due to the interference between fractures, issues such as decreased production and water channeling often occur in hydraulic fracturing of horizontal wells. Therefore, studying how to mitigate the effects of fracture interference is of great significance for optimizing hydraulic fracturing design and improving oil and gas recovery rates. In this paper, an oil–water two-phase discrete fracture model was established, and the grid dissection was carried out by using the optimization method to obtain a triangular grid that can finely characterize the fracture in geometry. Then, typical discrete fracture models were designed, and the influences of the fracture permeability ratio, absolute fracture scale, oil–water viscosity ratio, and fracture length on the fracture flow interference were investigated separately. The degree of fracture interference was evaluated using the fracture fractional flow rate ratio, remaining oil saturation, and sweep efficiency. This study verified fracture interaction and identified that the threshold value of the fracture permeability ratio is 9 to classify the degree of interference. Sensitivity analysis shows that the absolute size of the fracture has a significant impact on fracture interference, while the impact of the oil–water viscosity ratio and fracture length on fracture interference is relatively small.
1. Introduction
Fractures play a crucial role in oil and gas field production. The development of low-permeability and unconventional reservoirs often involves hydraulic fracturing, natural fractures, and induced fractures, which become significant pathways for fluid flow. The large difference in seepage capacity of multi-scale fractures exacerbates the non-homogeneity of reservoirs, which seriously affects the displacement effect and ultimate recovery [1].
Fracture interference is a meaningful and highly discussed research topic, as there are numerous scenarios where fracture interference can occur. With the widespread use of fractured horizontal wells, fracture-driven interactions or frac-hits have become a focus of attention for researchers and engineers [2]. Frac-hits can result in complex fracture networks that affect well productivity and ultimate recovery. Therefore, accurate prediction and management of frac-hits are crucial for optimizing production.
The concept of fracture-driven interactions (FDIs) was first introduced to explain pressure increases caused by stimulation during different stages of fracturing a single horizontal well [3]. This concept was later extended to inter-well interactions of fractures. FDIs can be divided into two general groups: intra-well and inter-well FDIs [4,5]. The term frac-hits was originally used to describe communication between parent and child wells during infill drilling and has since been extended to include any type of well interference [6]. FDIs are an important and complex issue. The existence of FDIs can lead to inter-well interference and reduced production, thereby affecting the production efficiency of the entire oilfield. Therefore, understanding and controlling FDIs is crucial for optimizing oilfield development. In recent years, with the widespread application of horizontal wells and fracturing technology, FDIs have become one of the hotspots of research. Numerous studies have been conducted on the mechanisms of well-to-well FDIs; three types of frac-hits and corresponding scenarios were summarized [2]. This research mainly focuses on the direct frac-hit and its similar scenarios that frequently occur in the short horizontal wells, infilling development of ultralow-permeability reservoirs in the Ordos Basin [7,8,9]. Previous studies have paid little attention to the flow interactions between neighboring hydraulic fractures on a field scale to direct practical productions, though the flow capacity differences between fractures have been of interest for a long time. In the future, we need to further investigate the mechanisms and influencing factors of FDIs to better understand and control this issue.
Kang et al. and Chen et al. [10,11] investigated the effect of fractures on oil migration and found that fractures play a crucial role during waterflooding. Through micro-scale flooding experiments, they discovered that large-scale fractures have a strong flow interaction effect on small-scale fractures. Wang et al. [12] pointed out that the aperture difference between multi-scale fractures can result in a significant difference in permeability, which creates strong flow barriers from large-scale fractures to small-scale fractures. When water breakthrough occurs in a large-scale fracture, it becomes challenging to displace the remaining oil in the small-scale fracture [13].
Li et al. [14] studied the relationship between multi-scale fractures and production dynamics. They found that when the width difference of fractures is 1.5, large fractures have a complete shielding effect on the flow of small ones through theoretical calculation. The waterflooding is mainly carried out in large fractures and there is almost no fluid flow in small fractures. In this case, the water cut of the oil well suddenly rises and shows watered-out characteristics.
According to the research conducted by Zhu et al. [15] through the core-scale displacement experiment, it has been demonstrated that the difference in permeability between fractures can lead to a decrease in waterflooding efficiency. Furthermore, as the permeability contrast between fractures increases, the flow distribution between fractures no longer follows Darcy’s law. Ma et al. [16] combined micro experiments and finite element numerical simulations to study the influencing factors of fracture interference in fracture-vuggy carbonate reservoirs at micro scale. They carried out a quantitative evaluation index named relative interference factor to study the role of oil viscosity, fracture permeability, and fracture length in flow interference.
These findings have important implications for oilfield development. To optimize production, it is necessary to understand the characteristics and behavior of fractures at different scales and their impact on fluid flow. Accurate modeling and simulation tools are essential for predicting fracture behavior and designing effective stimulation strategies.
Liang et al. and Zhao et al. developed a discrete fracture model to study fluid flow through hydraulic and natural fractures in unconventional reservoirs and suggested the DFM is more accurate [17,18,19,20,21]. Meng et al. studied waterflooding characteristics in fractured reservoirs with discrete fracture model simulation and then investigated waterflooding and flow interaction in a carbonate reservoir with multi-scale fractures at field scale [22,23,24]. His research revealed the levels and boundaries of fracture interference on vertical wells and natural fractures. However, with the application of fractured horizontal wells and short horizontal wells, the fracture interaction in frac-hits needs increased attention because most of the watered-out wells only produced for a short time in the Ordos Basin low-permeability field. Figure 1 is the schematic of different communication forms between the injection and production of horizontal wells in the Ordos Basin.
Previous research has not thoroughly analyzed the interference patterns and influencing factors of fracture interference between fractured horizontal wells at the reservoir scale. This study focuses on the fracture interaction of frac-hits and performs simulation studies at a field scale. First, we establish a discrete fracture model to characterize fracture geometry and two-phase fluid flow. We then investigate and clarify fracture interaction phenomena, interaction processes, boundaries, and influencing factors through numerical simulations. New insights on fracture flow interference during waterflooding will be revealed and depicted by defining some new flow parameters and formulas obtained from the discrete fracture model. Our study aims to achieve a comprehensive understanding of fracture interaction behavior for sustainable and efficient oilfield development [25,26].
2. Numerical Simulation
2.1. Mathematical Model
In the discrete fracture model, it is necessary to simplify the actual model according to the main content of our research, so we have made the following assumptions about the model [27].
- (1)
- The model is oil–water two-phase flow, and the fluid flow in the fracture satisfies Darcy’s law and cubic law;
- (2)
- The fluid in the matrix and fractures and the rock skeleton are slightly compressible;
- (3)
- The fluid flow in porous and fractured material is an isothermal process;
- (4)
- The reservoir has two-dimensional heterogeneity, and the model is treated with equal thickness, ignoring the influence of gravity.
The two-dimensional oil–water two-phase Darcy model of discrete fractures is composed of the continuity equation, motion equation, and auxiliary equation. The mathematical expression of each equation is as follows:
- (1)
- The mass conservation equation
Oil phase mass conservation equation in matrix:
Oil phase mass conservation equation in fracture:
Water phase mass conservation equation in matrix:
Water phase mass conservation equation in fracture:
where, is porosity, decimal; is the oil density, kg/m3; is the density of water, kg/m3; is pressure, Pa; is oil phase pressure, Pa; is water phase pressure, Pa; is the oil phase flow rate, m3; is the water phase flow rate, m3; is oil saturation, decimal; is water saturation, decimal; is the viscosity of oil, ; is the viscosity of water, ; is matrix permeability, D; is fracture permeability, D; is oil phase relative permeability, dimensionless; is water phase relative permeability, dimensionless.
- (2)
- Equation of motion
Equation of oil phase motion in matrix:
Equation of oil phase motion in fracture:
Equation of water phase motion in matrix:
Equation of water phase motion in fracture:
where, is the oil phase flow rate, m/s; is the water phase flow rate, m/s; is the acceleration of gravity, ; is the depth along the direction of gravity, m.
- (3)
- Equation of auxiliary
Saturation auxiliary equation:
Capillary equation:
Compressibility equation of rock:
Compressibility equation of fluid:
where, is capillary pressure, Pa; is the initial porosity, decimal; is the initial reservoir pressure, Pa; cr is rock compression coefficient, ; ci is rock compression coefficient, ; and is fluid density of oil and water phase, kg/m3.
- (4)
- Fracture permeability
In the process of discrete fracture modeling, the current commonly used fracture permeability is the cubic rule derived from the plate model; that is, the fracture permeability is related to the effective fracture aperture [28,29]:
where, Kf is the permeability of fracture, μm2; w is effective fracture width, m.
2.2. Model Validation and Comparision
A typical model was established for verification. The discrete fracture model is a two-dimensional planar model of 100 m × 100 m, which is dissected using a triangular grid. The discrete fracture model with a variable step size triangular mesh dissection for adaptive and accurate characterization of fractures and matrix was used. The discrete fracture model was set up with one injection and one extraction well, and one fracture was set up between the injection and extraction wells. The effective width of the fracture was 0.001 m. The model solution was carried out using the DFM module of the MRST toolbox [30,31,32]. CMG−STARS (Version 2021) was used to establish a comparison model, keeping all model parameters consistent, in which the fracture was realized by grid refinement equivalent inflow capacity. The specific parameters are shown in Table 1.
The obvious permeability difference between the DFM model and the CMG model is due to the fact that CMG simulated fractures by means of equivalent conductivity. Due to the influence of mesh size, the actual mesh width of fractures in CMG is at least 0.6 m, which is much greater than the real effective fracture aperture. In order to compare and verify the accuracy of the simulation, the production dynamic data calculated by the two simulation methods are compared (see Figure 2).
From Figure 2, it seems that the two simulation methods used to calculate production dynamic data in a two-dimensional DFM model have produced highly consistent results. This is evident when comparing the daily production rates of the well and the average reservoir pressure. It appears that the accuracy of the simulation has been successfully verified through this comparison. However, due to the difference of grid scale of the CMG model, the simulation results fluctuate slightly. In addition, the saturation field simulation results of the two models are also compared and verified. Figure 3 is the comparison model and simulated saturation field results.
The validation of the simulation comparison indicates that the discrete fracture model has a high-accuracy fracture meshing. The grid has lower oil saturation near the injection wells due to the diffusion of water injection. In the fracture, saturation changes rapidly along the direction of the fracture, and the diffusion of the perpendicular method with the fracture surface is not significant. Comparison of the waterflooding features shows that the discrete fracture model characterizes the rapid water channeling feature at the end side of the fracture, which the CMG model cannot. The discrete fracture model grid size is finer than CMG, resulting in a weaker numerical dispersion phenomenon after calculation, and a smoother front of the saturation distribution. However, in the CMG model, due to the influence of grid dissection accuracy, there is strong numerical dispersion, and the grid near the well has lower oil saturation. The saturation changes significantly along the fracture direction, but there is no directionality due to the calculation of permeability between grids during equivalence calculation in the CMG model. Therefore, there are also saturation changes in the direction perpendicular to the fracture surface. These differences indicate that there are some variations between the models in terms of fracture characterization.
By comparing the oil saturation field distributions of the discrete fracture model and the verification model, it can be seen that the discrete fracture model has a certain degree of accuracy and credibility. However, the DFM method also has its limitations. In addition to the difficulty of simulating three-dimensional discrete fractures at the field scale, computational requirements for grid computing are relatively large. The most prominent drawback is that fluid flux rates in DFM numerical models are highly sensitive to fracture aperture. Therefore, it is crucial to minimize errors in characterizing fracture apertures to ensure accurate model outputs. However, determining the aperture and transmissivity of a fracture population is equally challenging due to the limited number of fracture samples that can be obtained from restricted locations through in situ and laboratory tests. Furthermore, it is difficult to determine the effect of sample size on the results. Therefore, the discrete fracture model is mainly used for mechanistic research and exploratory research, and the industrial project practice is mainly applied to commercial software.
3. Simulation Results
3.1. Simulation Schemes
In order to study the fracture flow interference law, this paper simplifies the frac-hit model into a double fracture. According to the difference of fracture flow-conducting ability, the double-seam flow-conducting ability grade difference multiplier is defined, and the flow-conducting ability grade difference is used as the independent variable to study the waterflooding in different models. Previous studies have typically utilized permeability difference to characterize the major fracture and minor fracture [33,34,35]. For frac-hit cases, we define a fracture permeability difference parameter D to characterize the permeability ratio of the major and minor fracture.
where D is the gradient difference in hydraulic fracture permeability, dimensionless; Kfrac1 and Kfrac2 both represent the hydraulic fracture permeability, μm2.
We simplify the hydraulic fracture in Figure 1 to be the main fracture and the secondary fracture and set the permeability capacity and related parameters of the two fractures according to the parameters of reservoir stimulation of a short horizontal well in an ultralow-permeability field. These short horizontal wells have been commonly used in the well pattern adjustment of ultralow-permeability reservoirs in the Ordos Basin in recent years. To avoid water channeling issues, only small-scale fracturing is carried out on these wells, with the number of fractured stages ranging from 2 to 4 [36,37,38]. Figure 4 is the discrete fracture model with inter-well direct frac-hit.
This model is 100 m in length and 60 m in width with two short horizontal wells for water injection and oil production, respectively. Two fractures with the same length but different apertures and permeability are proposed to simulate the inter-well direct frac-hit. The fracture spacing is 30 m, which is half the length of the horizontal well trajectory. The basic parameters of the simulation are the same as the verification model as shown in Table 1. The relative permeability curves are provided separately for matrix and fracture considering their obvious seepage differences, as shown in Figure 5 [39,40].
This study set six cases with a fixed minimum fracture permeability while varying the fracture permeability gradient difference D. Minor fracture width is 0.2 mm and the corresponding permeability calculated by cubic law is 3333 μm2. When fracture width difference increases from one to six for case 1 to case 6, the permeability gradient difference D is squared.
3.2. Fracture Flow Interaction
Fracture Flow Interaction (FFI) can also be seen as FDI, while FFI places more emphasis on the flow interference within the fracture network. The impact of frac-hits on pressure response remains a focal point of interest in numerous FDI studies [41,42,43,44]. Nevertheless, pressure data present a challenge due to high sensitivity and limited accessibility for real-time monitoring. Conversely, micro-seismic techniques enable the acquisition of waterflooding and fluid saturation distribution data. In light of this, the present paper delves into the interaction of fracture and its effect on the fluid saturation field’s evolution. Figure 6 is the simulation result of the oil saturation field in different cases at the timestep of 180 days.
The simulation result reveals that the permeability of the lower fracture surpasses that of the upper one. As the level of permeability difference increases, the flow interference between the fractures becomes increasingly pronounced. The major fracture situated below serves as the dominant seepage channel, and then the displacement strength exhibits high waterflooding and low oil saturation while another remains unflooded. As can be seen from Figure 6, once D is greater than 9, the change of oil saturation is no longer significant in the rest of the cases. Furthermore, we can observe that the waterflooding front for the matrix in all instances remains within a 30 m radius. The propagation of the minor fracture does not extend more than 70 m, while the major fracture’s flooding reaches up to the production well. The above results confirm that there is flow interference between fractures, and the displacement state of large fractures has a certain degree of influence on small fractures. To further investigate the oil saturation changing due to fracture flow interference, the variation of each parameter with the simulation time requires attention. Taking the simulation results of case 3 as an example, the variation process of waterflooding interaction of the fracture is revealed, as indicated in Figure 7.
As the waterflooding process progresses, the waterflooding front gradually advances in the matrix and fractures. When simulated for 30 days, the waterflooding front in the matrix advances approximately 10 m; it progresses approximately 20 m in the upper fractures and notably more than 40 m in the lower fractures. When the simulation timestep is 90 days, the large fracture is already watered out. In this case, even though the large fractures at the bottom are already flooded with water, displacement continues in the matrix and small fractures. By the time the simulation reaches 540 days, both fractures are already flooded, and the waterflooding front in the matrix reaches a location approximately 10 m away from the production well. In addition to being faster along the direction of fractures, the lateral influence of large fractures is also more significant than the small fractures above. Next, the process of the saturation of oil and water in the fractures is further analyzed over time. Figure 8 is the simulated saturation distribution along the fractures from injection to production.
As can be seen from Figure 8, at any given timestep, the saturation in large fractures is always lower than in small fractures. Moreover, the disparity between the fractures gradually increases over time, essentially reaching a stable state by the 180th day. The inflection points of the curve represent the forefronts of saturation. The inflection point closer to the injection well signifies the saturation forefront of the water phase and the two-phase oil–water flow, while the one closer to the production well marks the saturation forefront of the two-phase oil–water and oil phases. There is a noticeable difference in the forefront changes of the two fractures. The solid line signifies that the initial inflection points of the small fracture’s forefront occurred at less than 20 m, suggesting that the distance of complete water displacement is short. Conversely, the dashed line indicates a position close to 60 m, suggesting that by the 540th day, the water phase forefront in the large fracture has neared the oil well, resulting in complete waterflooding. It can also be observed that the small fracture remains at its initial oil saturation level beyond 60 m, implying that waterflooding has not reached the production well.
Compared with saturation, the flow rate in the fracture is more meaningful for analyzing flow interference [45,46,47]. Therefore, we further calculated the flow rates through the major and minor fractures in order to compare the differences in fluid flow capacity between the major and minor fractures. By averaging the unit thickness flow rates on the fracture grid, the flow rates in the major and minor fractures were obtained. Here, we define a parameter fmin to describe the fracture flow ratio, which is measured by the ratio of the flow rate in the small fracture to all fractures, characterizing differences in fracture flow capacity during the displacement process.
where fmin is the fractional flow rate of the minor fracture, decimal; Qfrac1 and Qfrac2 is fracture flow rate, m3/d. This paper assumes that all small fracture flow rates are represented by Qfrac1.
Considering that the fracture flow is an instantaneous quantity, this paper mainly uses the flow corresponding to the last timestep of the simulation for calculation. Figure 9 describes the relationship between fmin (the fracture fractional flow rate ratio) and D (the fracture permeability ratio).
The fmin satisfying the power function relationship rapidly decreases with the increase in D. When D is greater than 9, fmin decreases to a degree that can be ignored in engineering. Therefore, this curve is divided into two parts. The light green background area represents the impact variation zone; the fracture flow ratio in this region gradually deviates from the allocation calculated by Darcy’s Law, which is consistent with the experimental results of previous researchers [14,48,49]. The light red area represents the impact stable zone, where fmin essentially reaches a constant value. This result clearly indicates that the degree of flow interference between fractures is related to the ratio of permeability between them and that there is a threshold value. When it exceeds this limit, the flow rate from small fractures can be ignored, approximating a condition where there is no fluid flow. Under the current simulation conditions, this limit value of D is 9, which is of great significance for understanding the interference effect between fractures and taking targeted measures to increase production in fractured reservoirs.
To further demonstrate the limit value, we assume a limit case that exists in the reservoir field. When the large fracture is fully flooded, it serves as a channel for water phase flow. Therefore, the greater the diverted volume within the large fracture, the higher the water cut of the oil well. The estimated overall water cut can be calculated as 1 minus the minimum oil fraction (fmin). In this simulation, with a permeability ratio of 9, the fmin is 0.02 and the water cut reaches 98%, indicating the engineering limit for production. This finding can serve as a valuable guide for geologists and reservoir engineers, directing their attention towards the permeability differences between adjacent reservoirs in low-permeability reservoirs. By analyzing the remaining oil and understanding these differences, targeted enhanced oil recovery (EOR) countermeasures can be developed to effectively maximize oil production. However, it is only applicable in simulations and under certain ideal conditions. Whether this threshold exists universally requires further study to determine its applicability in more scenarios.
3.3. Sensitivity Analysis
3.3.1. Fracture Scale
Upon the culmination of our preliminary study, it was discerned that a permeability ratio exceeding 9 results in large fractures imposing a significant influence on the flow within smaller fractures. However, it is pertinent to note that these findings are predicated on the assumption that the effective aperture of smaller fractures is 0.1 mm. The potential impact of the absolute aperture of fractures on the dynamics of flow competition and interference mandates more in-depth verification. Henceforth, our future research would be calibrated to three distinctive effective aperture values for smaller fractures: 0.1 mm, 1 mm, and 10 mm. Utilizing the data obtained from these simulation models, we are positioned to analyze the nuanced changes. Figure 10 is the relationship between the fracture flow ratio and fracture permeability ratio of three fracture scales.
Figure 10 indicates that the absolute scale of the fracture has a great influence on the FDI. An increase in the absolute scale of the fractures will reduce the interference of the fractures’ relative scale differences. The flow capacity of small fractures is greatly affected by their size and the presence of larger fractures. When the effective width of a small fracture is only 0.1 mm, an increase in D results in a rapid decrease in fmin until it eventually approaches 0. This indicates that the small fracture no longer has any flow capacity under the influence of the larger fracture. On the other hand, when the effective width of a small fracture is greater, such as 1 mm, the minimum flow ratio of the fracture is close to 0.2, indicating that the small fracture still has some flow capacity. However, as the absolute scale of fractures increases to 10 mm, the flow interference between fractures becomes less significant, and a linear relationship between fmin and D emerges. The findings indicate that flow interference only affects small-scale fractures and that enhancing fracture permeability can mitigate the impact of FDIs on production. The permeability ratio threshold of 9 is no longer applicable in large-scale fracture systems.
3.3.2. Oil–Water Viscosity Ratio
In addition to the absolute scale of the fracture, fluid viscosity is also a significant factor that can affect seepage and displacement and, thus, may influence FDIs [50]. We define eight cases to conduct a simulation study, with oil–water viscosity ratios of 1, 5, 10, 20, 50, 100, 150, and 200, respectively. Figure 11 is the oil saturation distribution at different oil–water viscosity ratios after 270 days.
Figure 11 illustrates that changes in crude oil viscosity have a significant impact on the distribution of oil and water two-phase areas. When the viscosity ratio of oil and water is relatively low, the oil–water interface is clear, and displacement occurring in the matrix and fractures is similar to piston displacement. However, as the viscosity ratio increases, the front of waterflooding advances more quickly and the two-phase flow region increases significantly. Furthermore, it is observed that when the viscosity of crude oil is relatively low (e.g., μo/μw = 1), the front of oil and water advances more slowly, but the water saturation in the fracture is high. Conversely, when the oil–water viscosity ratio is relatively high, the oil–water leading edge advances more quickly, but the water saturation is low. This is attributed to the fact that when the oil–water viscosity ratio is low, waterflooding oil behaves similarly to piston-driven replacement. However, when the oil–water viscosity is relatively high, fingering is more likely to occur. Although the ripple range increases, the residual oil saturation also increases, indicating a decrease in displacement efficiency.
To investigate the permeability ratio limit of major and minor fracture flow interference at a given oil–water viscosity ratio, we conducted an experiment in which we set the oil–water viscosity ratio to 1, 10, 50, and 100. We then modified the effective aperture of the fractures to change the fracture permeability grade difference. Figure 12 illustrates the fractional flow rate ratio of the fractures under different oil–water viscosity ratios as the permeability ratios vary.
From Figure 12, it can be observed that the impact of different oil–water viscosity ratios on fmin and D is minimal, as the four curves are almost identical, and the influence of viscosity can only be reflected if the fracture permeability difference is small. The fracture flow rate formula derived from cubic law based on a single phase is applied to estimate the flow difference of fractures by previous researchers [51]. The equation indicates that permeability has a much greater impact on fracture flow than viscosity does. Therefore, the fmin parameter defined in this study is more sensitive to permeability, while the effect of viscosity is relatively small. This suggests that adjusting the oil–water viscosity ratio does not improve flow interference between fractures. Moreover, when the oil–water viscosity ratio increases from 1 to 100, the limit value of permeability difference for flow interference remains at 9. This indicates that changes in the oil–water viscosity ratio do not significantly affect the permeability difference limit for flow interference. To further investigate the influence of viscosity, we set the permeability difference between fractures to a fixed value of 9 and varied the oil–water viscosity ratio. We then analyzed the changes in fmin with respect to the oil–water viscosity ratio. This approach allowed us to examine how changes in viscosity affect the FDI with a fixed permeability difference, providing valuable insights into the impact of viscosity on flow interference between fractures. Figure 13 shows the change of the minor fracture fractional flow rate fmin with the increase in the oil–water viscosity ratio.
With the increase in the oil–water viscosity ratio, the small fracture flow rate will gradually decrease and tend to a stable value. The fmin and D curves can be divided into two intervals. When the oil–water viscosity ratio is smaller than 20, fmin decreases rapidly with increasing oil viscosity. However, when the oil–water viscosity ratio is greater than 20, the trend of a decreasing viscosity ratio decreases. Furthermore, for the minor fracture flow rate ratio with the increase in the oil–water viscosity ratio, the decrease is limited. Even if the oil–water viscosity ratio increases by one order of magnitude, the order of magnitude of the small fracture flow rate does not change. These findings suggest that the impact of oil viscosity on fmin and D is dependent on the oil–water viscosity ratio, with a higher ratio leading to a weaker effect of oil viscosity on FDIs. This information can be valuable in optimizing fracture systems for enhanced oil recovery.
3.3.3. Fracture Length
Large numbers of fractured horizontal wells cannot be effectively connected by hydraulic fractures for all kinds of reasons [47,52,53,54]. Therefore, indirect frac-hits should also be considered. This study primarily focuses on analyzing the influence of the fracture length of the indirect frac-hit on FDI to optimize the hydraulic fracturing design and improve the overall well performance. We applied more simulation cases of fracture lengths at 30 m, 40 m, 50 m, 60 m, 70 m, and 80 m to further analyze FDIs of indirect frac-hits and direct frac-hits. Figure 14 shows oil saturation under different fracture lengths after 360 days of simulation.
The figure illustrates that when the fracture does not penetrate the injection well, the injected water initially infiltrates the matrix. As the length of the fracture increases, the leading edge of the water drive enters the fracture earlier, resulting in an earlier breakthrough of water injection for the larger fracture. The minor fracture may also propagate a certain distance when it breaks through, and overall performance indicates that the interference caused by the minor fracture is relatively small. By comparing the saturation distribution fields under different fracture lengths, it can be observed that as the fracture length increases, the proportion of the advance distance of the small fracture to the total length of the fracture decreases when the large fracture breaks through to reach the water. This suggests that longer fractures tend to leave a greater portion of the small fracture unused. Therefore, optimizing the hydraulic fracturing design by considering the interaction between large and small fractures has strong engineering practical application significance [55].
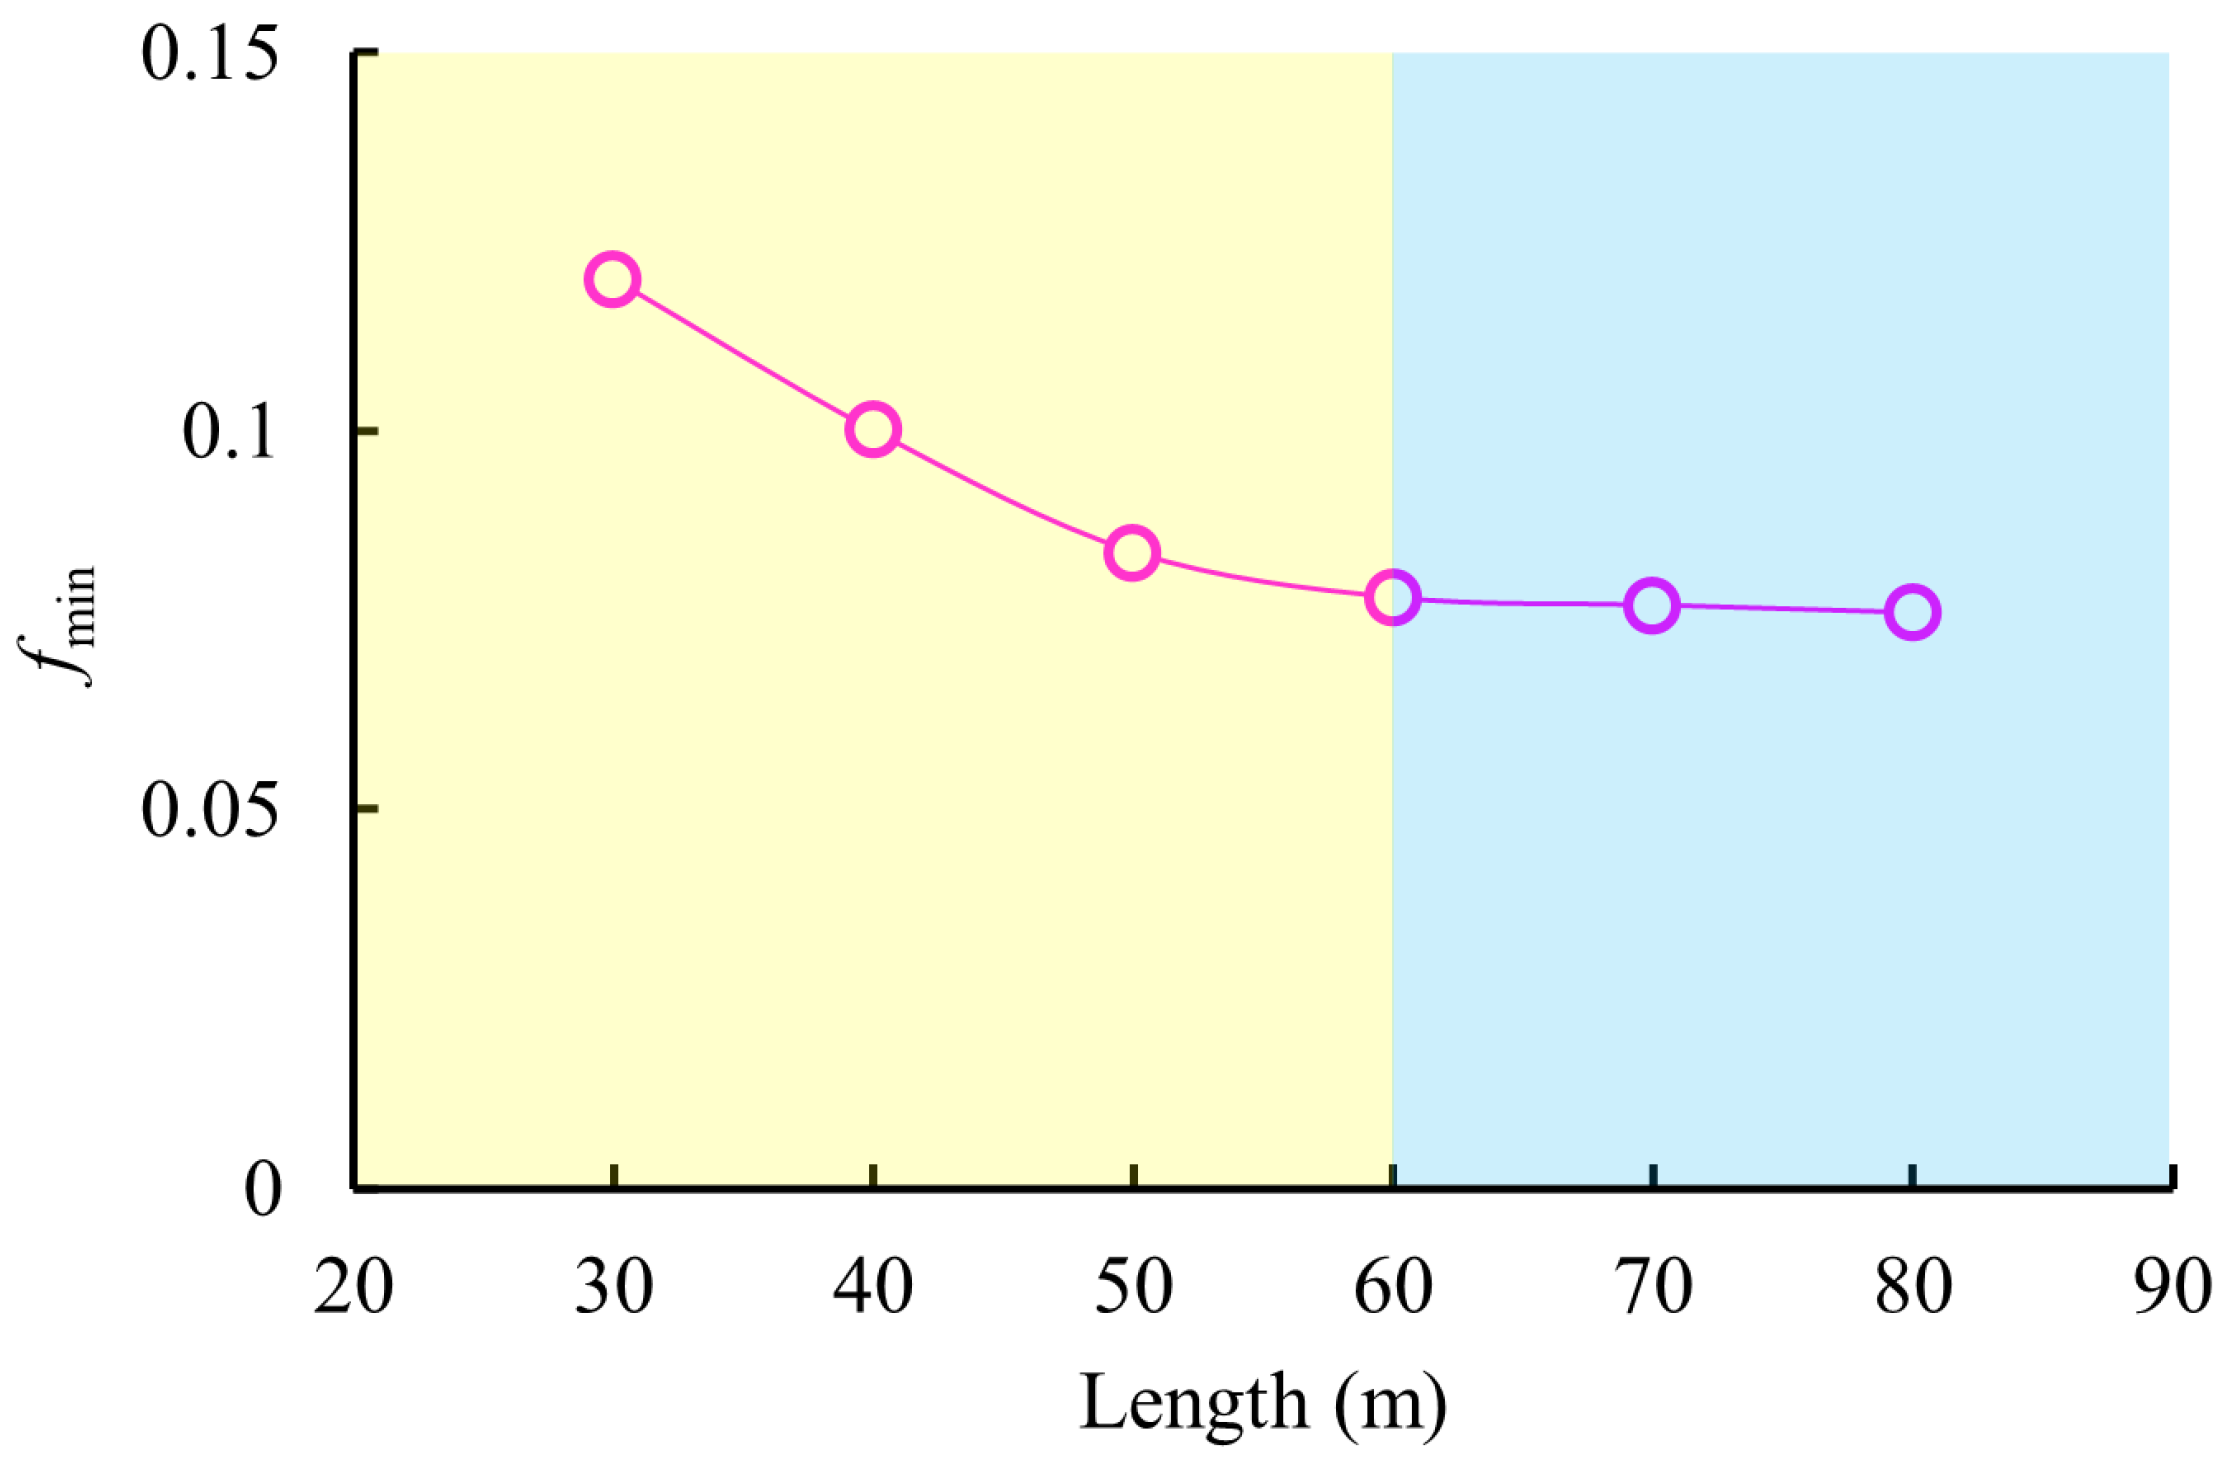
Statistics on the variation of the fracture fractional flow rate fmin with fracture lengths for minor fractures are shown in Figure 15.
Figure 15 illustrates that the process of changing the small fracture fractional flow rate with increasing fracture length can be divided into two stages. The first stage occurs when the fracture length is between 30 m and 60 m, during which, the small fracture fractional flow rate shows a linear decrease with increasing fracture length. In the second stage, when the fracture length is greater than 60 m, the fractional flow rate of the small fracture remains stable around a certain value, even if the fracture length is further increased. Although the fracture length has an impact on the fractional flow rate of the small fracture, the absolute difference between the fractional flow rate of a small fracture with a fracture length of 30 m and that with a fracture length of 80 m does not significantly affect the order of magnitude of the fractional flow rate. This also implies that changing the length of the hydraulic fracture may not effectively diminish the FDI [56,57].
4. Conclusions
(1) This paper establishes a discrete fracture model to study the problem of fracture interference in field scales, which enables a precise characterization of the fracture geometry and flow parameters. Through comparison with commercial numerical simulations, the discrete fracture model can more accurately simulate fracture interference phenomena.
(2) The simulation verifies the existence of flow interference between fractures, which can cause problems such as waterflooding in oil wells and a decrease in the spreading coefficient due to fracture flow interaction. The study also identifies the threshold value of the interference intensity when the fracture permeability ratio is 9 in certain scenarios.
(3) The absolute scale of the fracture has a significant impact on fracture flow interaction; there is only slight interference in the large-scale fracture system, while the effect of the oil–water viscosity ratio and fracture length on fracture flow interaction is relatively small. Therefore, an effective measure to mitigate the impact of FFI is to enhance the fracture conductivity.
Author Contributions
Conceptualization, F.M. and Y.W.; software, Y.Q.; validation, Z.M. and D.W.; writing—original draft preparation, F.M.; writing—review and editing, G.Q.; project administration, M.H.; supervision, X.S. All authors have read and agreed to the published version of the manuscript.
Funding
The project is supported by the Scientific Research and Technology Development Projects, CNPC (Number 2021DJ1303) and (Number 2022ZS1203).
Data Availability Statement
The data that support the findings of this study are available from the corresponding author upon reasonable request.
Acknowledgments
The authors acknowledge the technical support provided by the Research Institute of Petroleum Exploration & Development and the Computational Geosciences group in the Department of Mathematics and Cybernetics at SINTEF Digital for providing the open-source reservoir simulator called MRST.
Conflicts of Interest
The authors declare that they have no known competing financial interest or personal relationship that could have appeared to influence the work reported in this paper.
References
- Wang, Y.; Song, X.; Tian, C.; Shi, C.; Li, J.; Hui, G.; Hou, J.; Gao, C.; Wang, X.; Liu, P. Dynamic fractures are an emerging new development geological attribute in water-flooding development of ultra-low permeability reservoirs. Pet. Explor. Dev. 2015, 42, 222–228. [Google Scholar] [CrossRef]
- Singh, H.; Cheng, P.; Pan, Y.; Li, C.; Liu, Y.; Wu, X.; Van Domelen, M.; Rogers, S.; Taleghani, A.D.; Cao, M. A Comprehensive Review of Fracture-Driven Interaction in Unconventional Oil and Gas Plays: Characterization, Real-Time Diagnosis, and Impact on Production. In Proceedings of the SPE/AAPG/SEG Unconventional Resources Technology Conference, Denver, CO, USA, 13–15 June 2023; p. D021S052R003. [Google Scholar]
- Daneshy, A.; Au-yeung, J.; Thompson, T.; Tymko, D. Fracture Shadowing: A Direct Method for Determination of the Reach and Propagation Pattern of Hydraulic Fractures in Horizontal Wells. In Proceedings of the SPE Hydraulic Fracturing Technology Conference, The Woodlands, TX, USA, 6–8 February 2012; p. SPE–151980-MS. [Google Scholar]
- Daneshy, A.; King, G. Horizontal Well Frac-Driven Interactions: Types, Consequences, and Damage Mitigation. J. Pet. Technol. 2019, 71, 45–47. [Google Scholar] [CrossRef]
- Daneshy, A. Intra-Well Frac-Driven Interactions FDIs: Types, Causes, Consequences and Diagnostic Value Learnt from Actual BH Data. In Proceedings of the SPE Hydraulic Fracturing Technology Conference and Exhibition, The Woodlands, TX, USA, 4–6 February 2020; p. D021S005R005. [Google Scholar]
- Dehghan, A.N.; Goshtasbi, K.; Ahangari, K.; Jin, Y.; Bahmani, A. 3D Numerical Modeling of the Propagation of Hydraulic Fracture at Its Intersection with Natural (Pre-existing) Fracture. Rock Mech. Rock Eng. 2017, 50, 367–386. [Google Scholar] [CrossRef]
- Wang, Y.; Cheng, S.; Qin, J.; Lei, Z.; An, X.; Yu, H. Development theory and practice of water injection induced fractures in ultra-low permeability reservoirs. Sci. Sin. Technol. 2021, 52, 613–626. [Google Scholar] [CrossRef]
- Wang, Y.; Cheng, S.; Zhang, K.; He, Y.; Feng, N.; Qin, J.; Luo, L.; Yu, H. A Comprehensive Work Flow To Characterize Waterflood-Induced Fractures by Integrating Real-Time Monitoring, Formation Test, and Dynamic Production Analysis Applied to Changqing Oil Field, China. SPE Reserv. Eval. Eng. 2018, 22, 692–708. [Google Scholar] [CrossRef]
- Zhou, C.; Sun, Z.; Xiao, Y.; Huang, G.; Kuang, D.; Li, M. Study on Brittleness Characteristics and Fracturing Crack Propagation Law of Deep Thin-Layer Tight Sandstone in Longdong, Changqing. Processes 2023, 11, 2636. [Google Scholar] [CrossRef]
- Kang, Y.; Guo, Q.; Zhu, J.; Zeng, L. Light etched physical simulation experiment on oil migration in fractured media. Acta Pet. Sin. 2003, 24, 44–47. [Google Scholar] [CrossRef]
- Chen, L.; Kang, Y.; Zhu, J. Image Processing and Information Extraction from Oil Migration Images Collected from the Experiments in Fractured Media Model. J. China Univ. Pet. (Ed. Nat. Sci.) 2000, 24, 115–116, 122–133. [Google Scholar] [CrossRef]
- Wang, Y.; Zhu, Z.; Wang, X.; Liu, B.; Zhang, W. Preliminary study on the boundary of inter-fracture interference in fractured reservoirs—By taking JZS oil reservoir as an example. Pet. Geol. Eng. 2020, 34, 76–79. [Google Scholar]
- Zhu, W.; He, X.; Khirevich, S.; Patzek, T.W. Fracture sealing and its impact on the percolation of subsurface fracture networks. J. Pet. Sci. Eng. 2022, 218, 111023. [Google Scholar] [CrossRef]
- Li, Y.; Zhu, Z.; Meng, Z.; Cheng, Q.; Wen, J. Injection-Production Pattern of Fractured Reservoir. Spec. Oil Gas Reserv. 2018, 25, 130–134. [Google Scholar] [CrossRef]
- Zhiqiang, Z. Remaining Oil Distribution Patterns of Metamorphic Buried-Hill Fractured Reservoir Based on Digital Core Technology. Spec. Oil Gas Reserv. 2019, 26, 148–152. [Google Scholar]
- Shufen, M.; Liang, L.; Junjian, L. Study on influencing factors of fracture interference in fracture-cave carbonate reservoirs at micro scale. Complex Hydrocarb. Reserv. 2020, 13, 46–50. [Google Scholar] [CrossRef]
- Liang, B.; Jiang, H.; Li, J.; Gong, C. A systematic study of fracture parameters effect on fracture network permeability based on discrete-fracture model employing Finite Element Analyses. J. Nat. Gas Sci. Eng. 2016, 28, 711–722. [Google Scholar] [CrossRef]
- Liang, B.; Jiang, H.; Li, J.; Gong, C.; Jiang, R.; Pei, Y.; Wei, S. Flow in multi-scale discrete fracture networks with stress sensitivity. J. Nat. Gas Sci. Eng. 2016, 35, 851–859. [Google Scholar] [CrossRef]
- Liang, B.; Jiang, H.; Li, J.; Li, M.; Lan, Y.; Seright, R. Sizing gelant treatment for conformance control in hydraulically-fractured horizontal wells. In Proceedings of the SPE Improved Oil Recovery Conference, Tulsa, OK, USA, 31 August–4 September 2020; p. D031S045R002. [Google Scholar]
- Zhao, L.; Jiang, H.; Wang, H.; Yang, H.; Sun, F.; Li, J. Representation of a new physics-based non-Darcy equation for low-velocity flow in tight reservoirs. J. Pet. Sci. Eng. 2020, 184, 106518. [Google Scholar] [CrossRef]
- Zhao, L.; Jiang, H.; Zhang, S.; Yang, H.; Sun, F.; Qiao, Y.; Zhao, L.; Chen, W.; Li, J. Modeling vertical well in field-scale discrete fracture-matrix model using a practical pseudo inner-boundary model. J. Pet. Sci. Eng. 2018, 166, 510–530. [Google Scholar] [CrossRef]
- Meng, F. Water Production Law of Fractures in Carbonate Reservoirs and Countermeasures for Water Shutoff. Master’s Thesis, China University of Petroleum, Beijing, China, 2022. [Google Scholar] [CrossRef]
- Meng, F.; Li, J.; Jiang, H.; Zhao, L.; Li, L.; Qiao, Y.; Zhou, Y.; Xu, F. Study on characteristics of waterflooding in fractured reservoirs based on discrete fracture model. Arab. J. Geosci. 2021, 14, 1–4. [Google Scholar] [CrossRef]
- Meng, F.-L.; Wang, Y.-J.; Qi, Y.; Li, Z.-D.; Zhang, X.-C. Simulation of Fracture Channeling in Carbonate Reservoirs and Countermeasures for Water Shutoff. In Proceedings of the International Field Exploration and Development Conference, Xi’an, China, 16–18 November 2022; pp. 6141–6154. [Google Scholar]
- Li, Q.; Han, Y.; Liu, X.; Ansari, U.; Cheng, Y.; Yan, C. Hydrate as a by-product in CO2 leakage during the long-term sub-seabed sequestration and its role in preventing further leakage. Environ. Sci. Pollut. Res. 2022, 29, 77737–77754. [Google Scholar] [CrossRef]
- Li, Q.; Wang, F.; Wang, Y.; Forson, K.; Cao, L.; Zhang, C.; Zhou, C.; Zhao, B.; Chen, J. Experimental investigation on the high-pressure sand suspension and adsorption capacity of guar gum fracturing fluid in low-permeability shale reservoirs: Factor analysis and mechanism disclosure. Environ. Sci. Pollut. Res. 2022, 29, 53050–53062. [Google Scholar] [CrossRef]
- Jaffré, J.; Mnejja, M.; Roberts, J.E. A discrete fracture model for two-phase flow with matrix-fracture interaction. Procedia Comput. Sci. 2011, 4, 967–973. [Google Scholar] [CrossRef]
- Skopintsev, A.M.; Dontsov, E.V.; Baykin, A.N.; Golovin, S.V. The influence of heterogeneous proppant pack on fracture closure and productivity. J. Pet. Sci. Eng. 2022, 214, 110494. [Google Scholar] [CrossRef]
- Li, L.; Jiang, H.; Li, J.; Wu, K.; Meng, F.; Chen, Z. Modeling tracer flowback in tight oil reservoirs with complex fracture networks. J. Pet. Sci. Eng. 2017, 157, 1007–1020. [Google Scholar] [CrossRef]
- Krogstad, S.; Lie, K.A.; Møyner, O.; Nilsen, H.M.; Raynaud, X.; Skaflestad, B. MRST-AD—An open-source framework for rapid prototyping and evaluation of reservoir simulation problems. In Proceedings of the SPE Reservoir Simulation Conference, Houston, TX, USA, 23–25 February 2015; p. D022S002R004. [Google Scholar]
- Bao, K.; Lie, K.-A.; Møyner, O.; Liu, M. Fully implicit simulation of polymer flooding with MRST. Comput. Geosci. 2017, 21, 1219–1244. [Google Scholar] [CrossRef]
- Lie, K.-A. An Introduction to Reservoir Simulation Using MATLAB/GNU Octave: User Guide for the MATLAB Reservoir Simulation Toolbox (MRST); Cambridge University Press: Cambridge, UK, 2019. [Google Scholar]
- Gong, L.; Fu, X.; Gao, S.; Zhao, P.; Luo, Q.; Zeng, L.; Yue, W.; Zhang, B.; Liu, B. Characterization and Prediction of Complex Natural Fractures in the Tight Conglomerate Reservoirs: A Fractal Method. Energies 2018, 11, 2311. [Google Scholar] [CrossRef]
- Cinar, M.; Deniz-Paker, M. Laboratory experiments of in situ combustion in core samples with simulated fractures. J. Pet. Sci. Eng. 2023, 220, 111153. [Google Scholar] [CrossRef]
- Kong, D.; Gao, J.; Zhu, W.; Yue, M.; Li, H. Experimental study on conductivity and stress sensitivity of fully supported fractured shale cores. J. Pet. Sci. Eng. 2022, 218, 110971. [Google Scholar] [CrossRef]
- Bazyrov, I.; Shel, E.; Gimazov, A.; Roshchektaev, A.; Khasanov, M. Case Study on Waterflooding of Low-Permeability Reservoirs by Horizontal Wells with Water-Injection Induced Fractures. In Proceedings of the 54th U.S. Rock Mechanics/Geomechanics Symposium, Golden, CO, USA, 28 June–1 July 2020. [Google Scholar]
- Zhi, X.; Fang, W.; Dan, L.; Xiaodan, Z.; Hao, M. Study and practice of ultrashort horizontal well infilling in ultra-low permeability reservoirs of AS oilfield. Mud Logging Eng. 2022, 33, 97–102. [Google Scholar] [CrossRef]
- Meng, M.; Chen, Z.; Liao, X.; Wang, J.; Shi, L. A well-testing method for parameter evaluation of multiple fractured horizontal wells with non-uniform fractures in shale oil reservoirs. Adv. Geo-Energy Res. 2020, 4, 187–198. [Google Scholar] [CrossRef]
- Li, L.; Jiang, H.; Li, J.; Wu, K.; Meng, F.; Xu, Q.; Chen, Z.J. An analysis of stochastic discrete fracture networks on shale gas recovery. J. Pet. Sci. Eng. 2018, 167, 78–87. [Google Scholar] [CrossRef]
- Tang, C.; Chen, X.; Du, Z.; Yue, P.; Wei, J. Numerical Simulation Study on Seepage Theory of a Multi-Section Fractured Horizontal Well in Shale Gas Reservoirs Based on Multi-Scale Flow Mechanisms. Energies 2018, 11, 2329. [Google Scholar] [CrossRef]
- Hwang, J.; Zheng, S.; Sharma, M.; Chiotoroiu, M.-M.; Clemens, T. Containment of Water-Injection-Induced Fractures: The Role of Heat Conduction and Thermal Stresses. SPE Reserv. Eval. Eng. 2022, 25, 245–260. [Google Scholar] [CrossRef]
- Li, M.; Guo, J.; Zhang, T.; Zeng, X.; Yang, R.; Gou, H. Quantitative experimental study on the rule of fluid flow and its influencing factors in hydraulic fractures. J. Pet. Sci. Eng. 2022, 214, 110505. [Google Scholar] [CrossRef]
- Li, M.; Zhou, F.; Dong, E.; Zhang, G.; Zhuang, X.; Wang, B. Experimental study on the multiple fracture simultaneous propagation during extremely limited-entry fracturing. J. Pet. Sci. Eng. 2022, 218, 110906. [Google Scholar] [CrossRef]
- Li, S.; Zhao, H.; Cheng, T.; Wang, J.; Gai, J.; Zou, L.; He, T. The Analysis of Hydraulic Fracture Morphology and Connectivity under the Effect of Well Interference and Natural Fracture in Shale Reservoirs. Processes 2023, 11, 2627. [Google Scholar] [CrossRef]
- Du, D.; Liu, P.; Ren, L.; Li, Y.; Tang, Y.; Hao, F. A Volume Fracturing Percolation Model for Tight Reservoir Vertical Wells. Processes 2023, 11, 2575. [Google Scholar] [CrossRef]
- Chen, M.; Cheng, L.; Cao, R.; Lyu, C. A Study to Investigate Fluid-Solid Interaction Effects on Fluid Flow in Micro Scales. Energies 2018, 11, 2197. [Google Scholar] [CrossRef]
- Zeng, F.; Peng, F.; Guo, J.; Xiang, J.; Wang, Q.; Zhen, J. A Transient Productivity Model of Fractured Wells in Shale Reservoirs Based on the Succession Pseudo-Steady State Method. Energies 2018, 11, 2335. [Google Scholar] [CrossRef]
- Liu, J.; Liu, X. On the Effect of Different Fractural Distribution on Water-Oil Displacement. Xinjiang Pet. Geol. 2002, 23, 146–147. [Google Scholar] [CrossRef]
- Wang, M.; Ma, Y.; Li, H.; Guo, B. Experimental and numerical investigations of water-oil two-phase flow in fractures with proppants of different wetting properties. J. Pet. Sci. Eng. 2022, 214, 110361. [Google Scholar] [CrossRef]
- Zhang, Y.; Jin, Y.; Yang, D. Semi-analytical modeling of transient pressure behaviour for a multifractured horizontal well in a gas reservoir with a complex fracture network by considering effects of slippage, stress-sensitivity, and gas adsorption/desorption. J. Pet. Sci. Eng. 2022, 214, 110504. [Google Scholar] [CrossRef]
- Chu, H.; Dong, P.; Lee, W.J. A deep-learning approach for reservoir evaluation for shale gas wells with complex fracture networks. Adv. Geo-Energy Res. 2023, 7, 49–65. [Google Scholar] [CrossRef]
- Taghichian, A.; Zaman, M.; Devegowda, D. Stress shadow size and aperture of hydraulic fractures in unconventional shales. J. Pet. Sci. Eng. 2014, 124, 209–221. [Google Scholar] [CrossRef]
- Tu, Z.; Hu, X.; Zhou, F.; Huang, G.; Han, S.; Zhou, Q. A new multi-fracture geometry inversion model based on hydraulic-fracture treatment pressure falloff data. J. Pet. Sci. Eng. 2022, 215, 110724. [Google Scholar] [CrossRef]
- Zhang, J.; Xie, Z.; Pan, Y.; Tang, J.; Li, Y. Synchronous vertical propagation mechanism of multiple hydraulic fractures in shale oil formations interlayered with thin sandstone. J. Pet. Sci. Eng. 2023, 220, 111229. [Google Scholar] [CrossRef]
- Shi, X.; Ge, X.; Zhang, Y.; Kong, X.; Huang, W.; Jiang, S. Experimental study on hydraulic fracture propagation behavior on dolomite rocks with open-hole completion. J. Pet. Sci. Eng. 2022, 218, 110840. [Google Scholar] [CrossRef]
- Hongquan, C.; Changqing, Y.; Akhil, D.-G.; Ali, A.A.; Majdi, A.B. Identification of Fractures and Preferential Flow Paths Using Streamlines and Dynamic Data in Dual Porosity Dual Permeability Reservoir Models. In Proceedings of the SPE Annual Technical Conference and Exhibition, Virtual, 27–29 October 2020. [Google Scholar]
- Luo, B.; Wong, G.K.; Guo, J.; Fu, W.; Lu, G.; Bunger, A.P. Modeling of solids particle diversion to promote uniform growth of multiple hydraulic fractures. J. Pet. Sci. Eng. 2023, 220, 111159. [Google Scholar] [CrossRef]
Disclaimer/Publisher’s Note: The statements, opinions and data contained in all publications are solely those of the individual author(s) and contributor(s) and not of ΜM2PI and/or the editor(s). ΜM2PI and/or the editor(s) disclaim responsibility for any injury to people or property resulting from any ideas, methods, instructions or products referred to in the content. |
Figure 1.
Schematic of different communication forms between injection and production horizontal wells in the Ordos Basin. (a) Direct frac-hit of two fractured wells. (b) Direct frac-hit of large-scale fractured production well and unfractured injection well. (c) Indirect frac-hit of fractured production well and unfractured injection well.
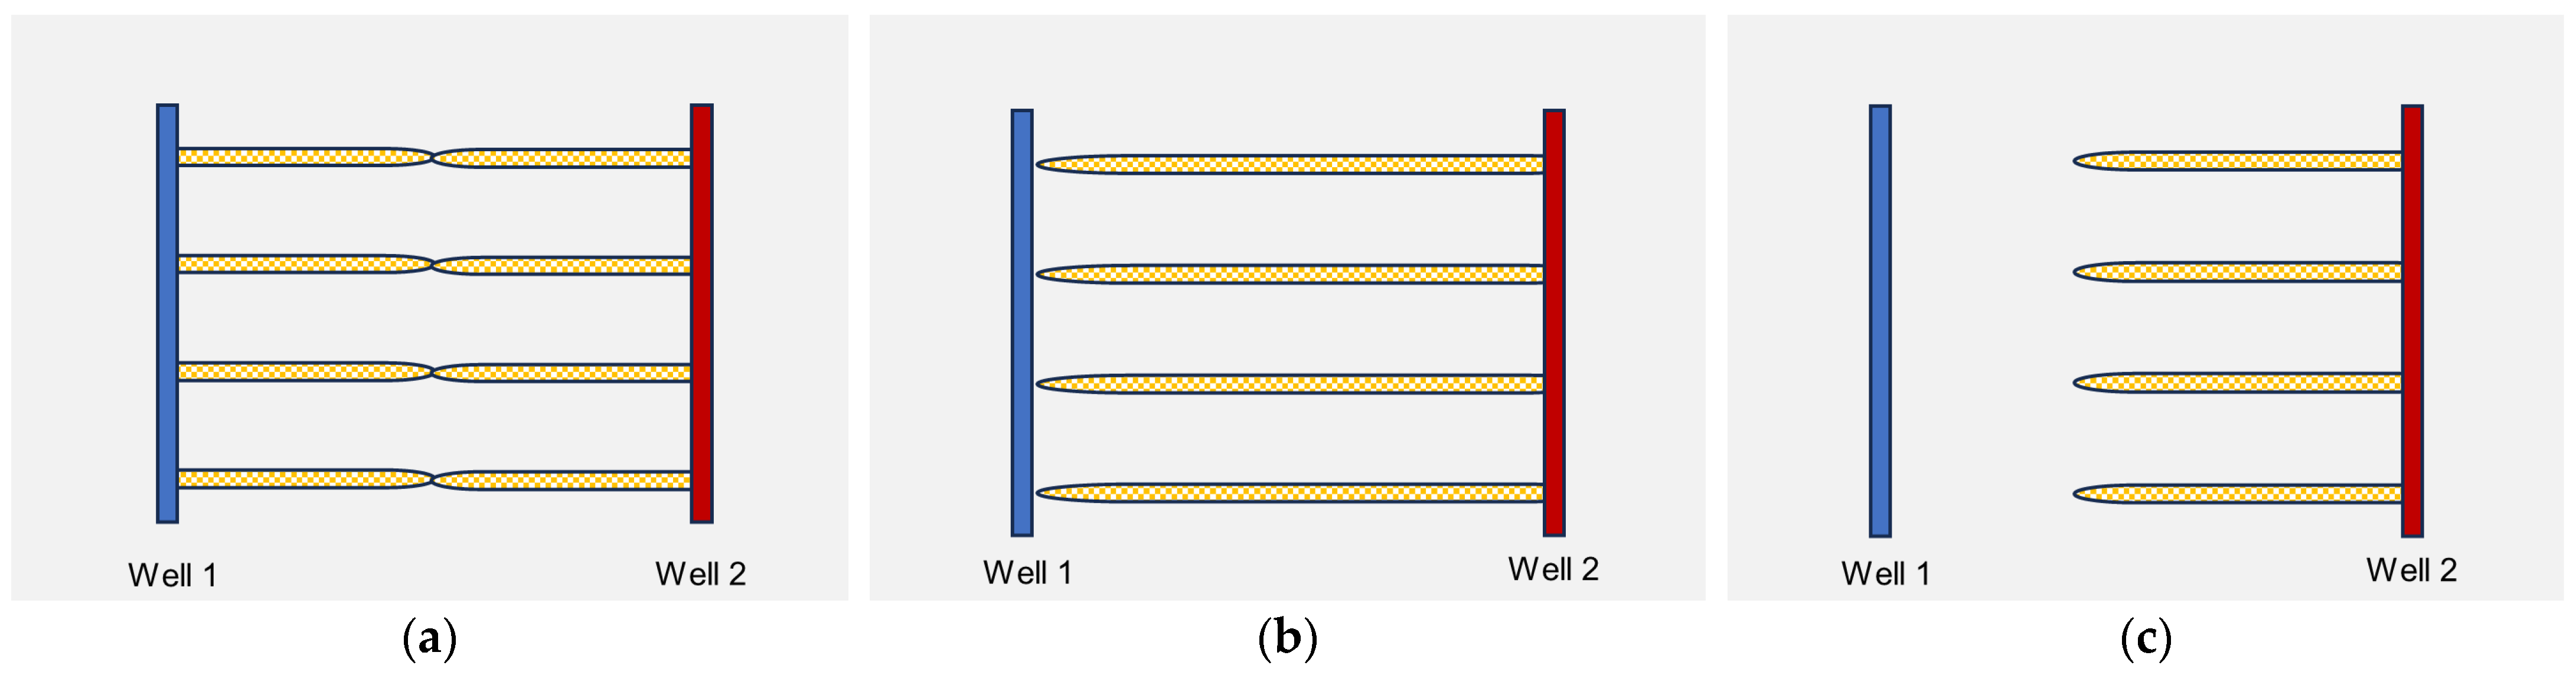
Figure 2.
Simulation results of DFM and CMG. (a) Oil rate and water rate validation. (b) Average pressure validation.
Figure 2.
Simulation results of DFM and CMG. (a) Oil rate and water rate validation. (b) Average pressure validation.
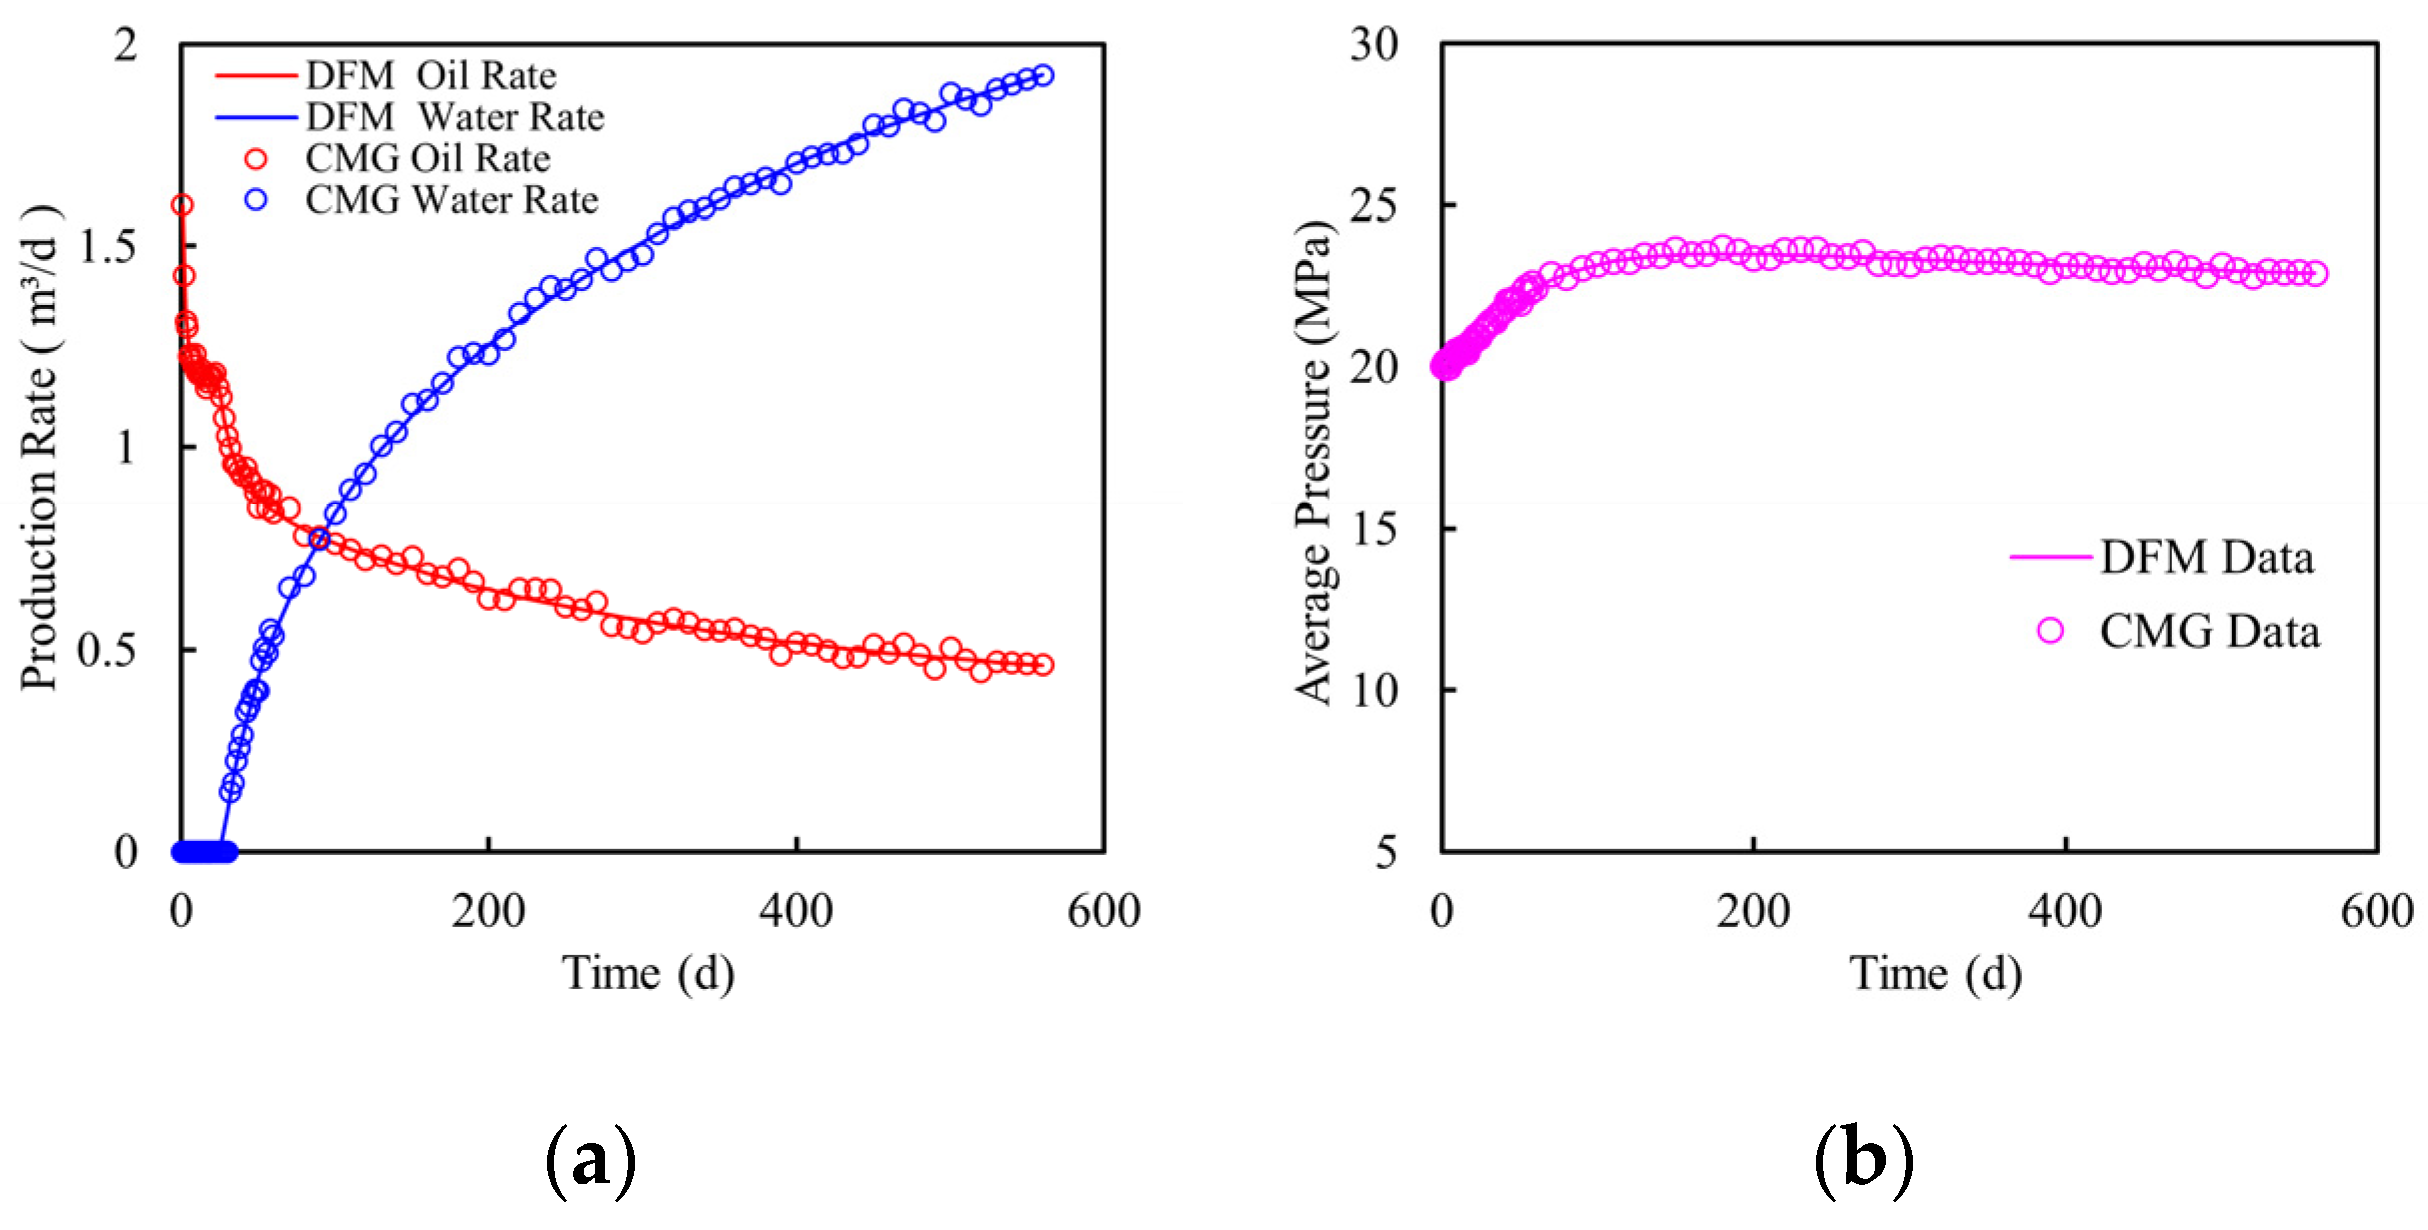
Figure 3.
Verification models and comparisons of simulation results. (a) Discrete fracture model for validation. (b) CMG model for validation. (c) Simulated oil saturation of discrete fracture model. (d) Simulated oil saturation of CMG model.
Figure 3.
Verification models and comparisons of simulation results. (a) Discrete fracture model for validation. (b) CMG model for validation. (c) Simulated oil saturation of discrete fracture model. (d) Simulated oil saturation of CMG model.
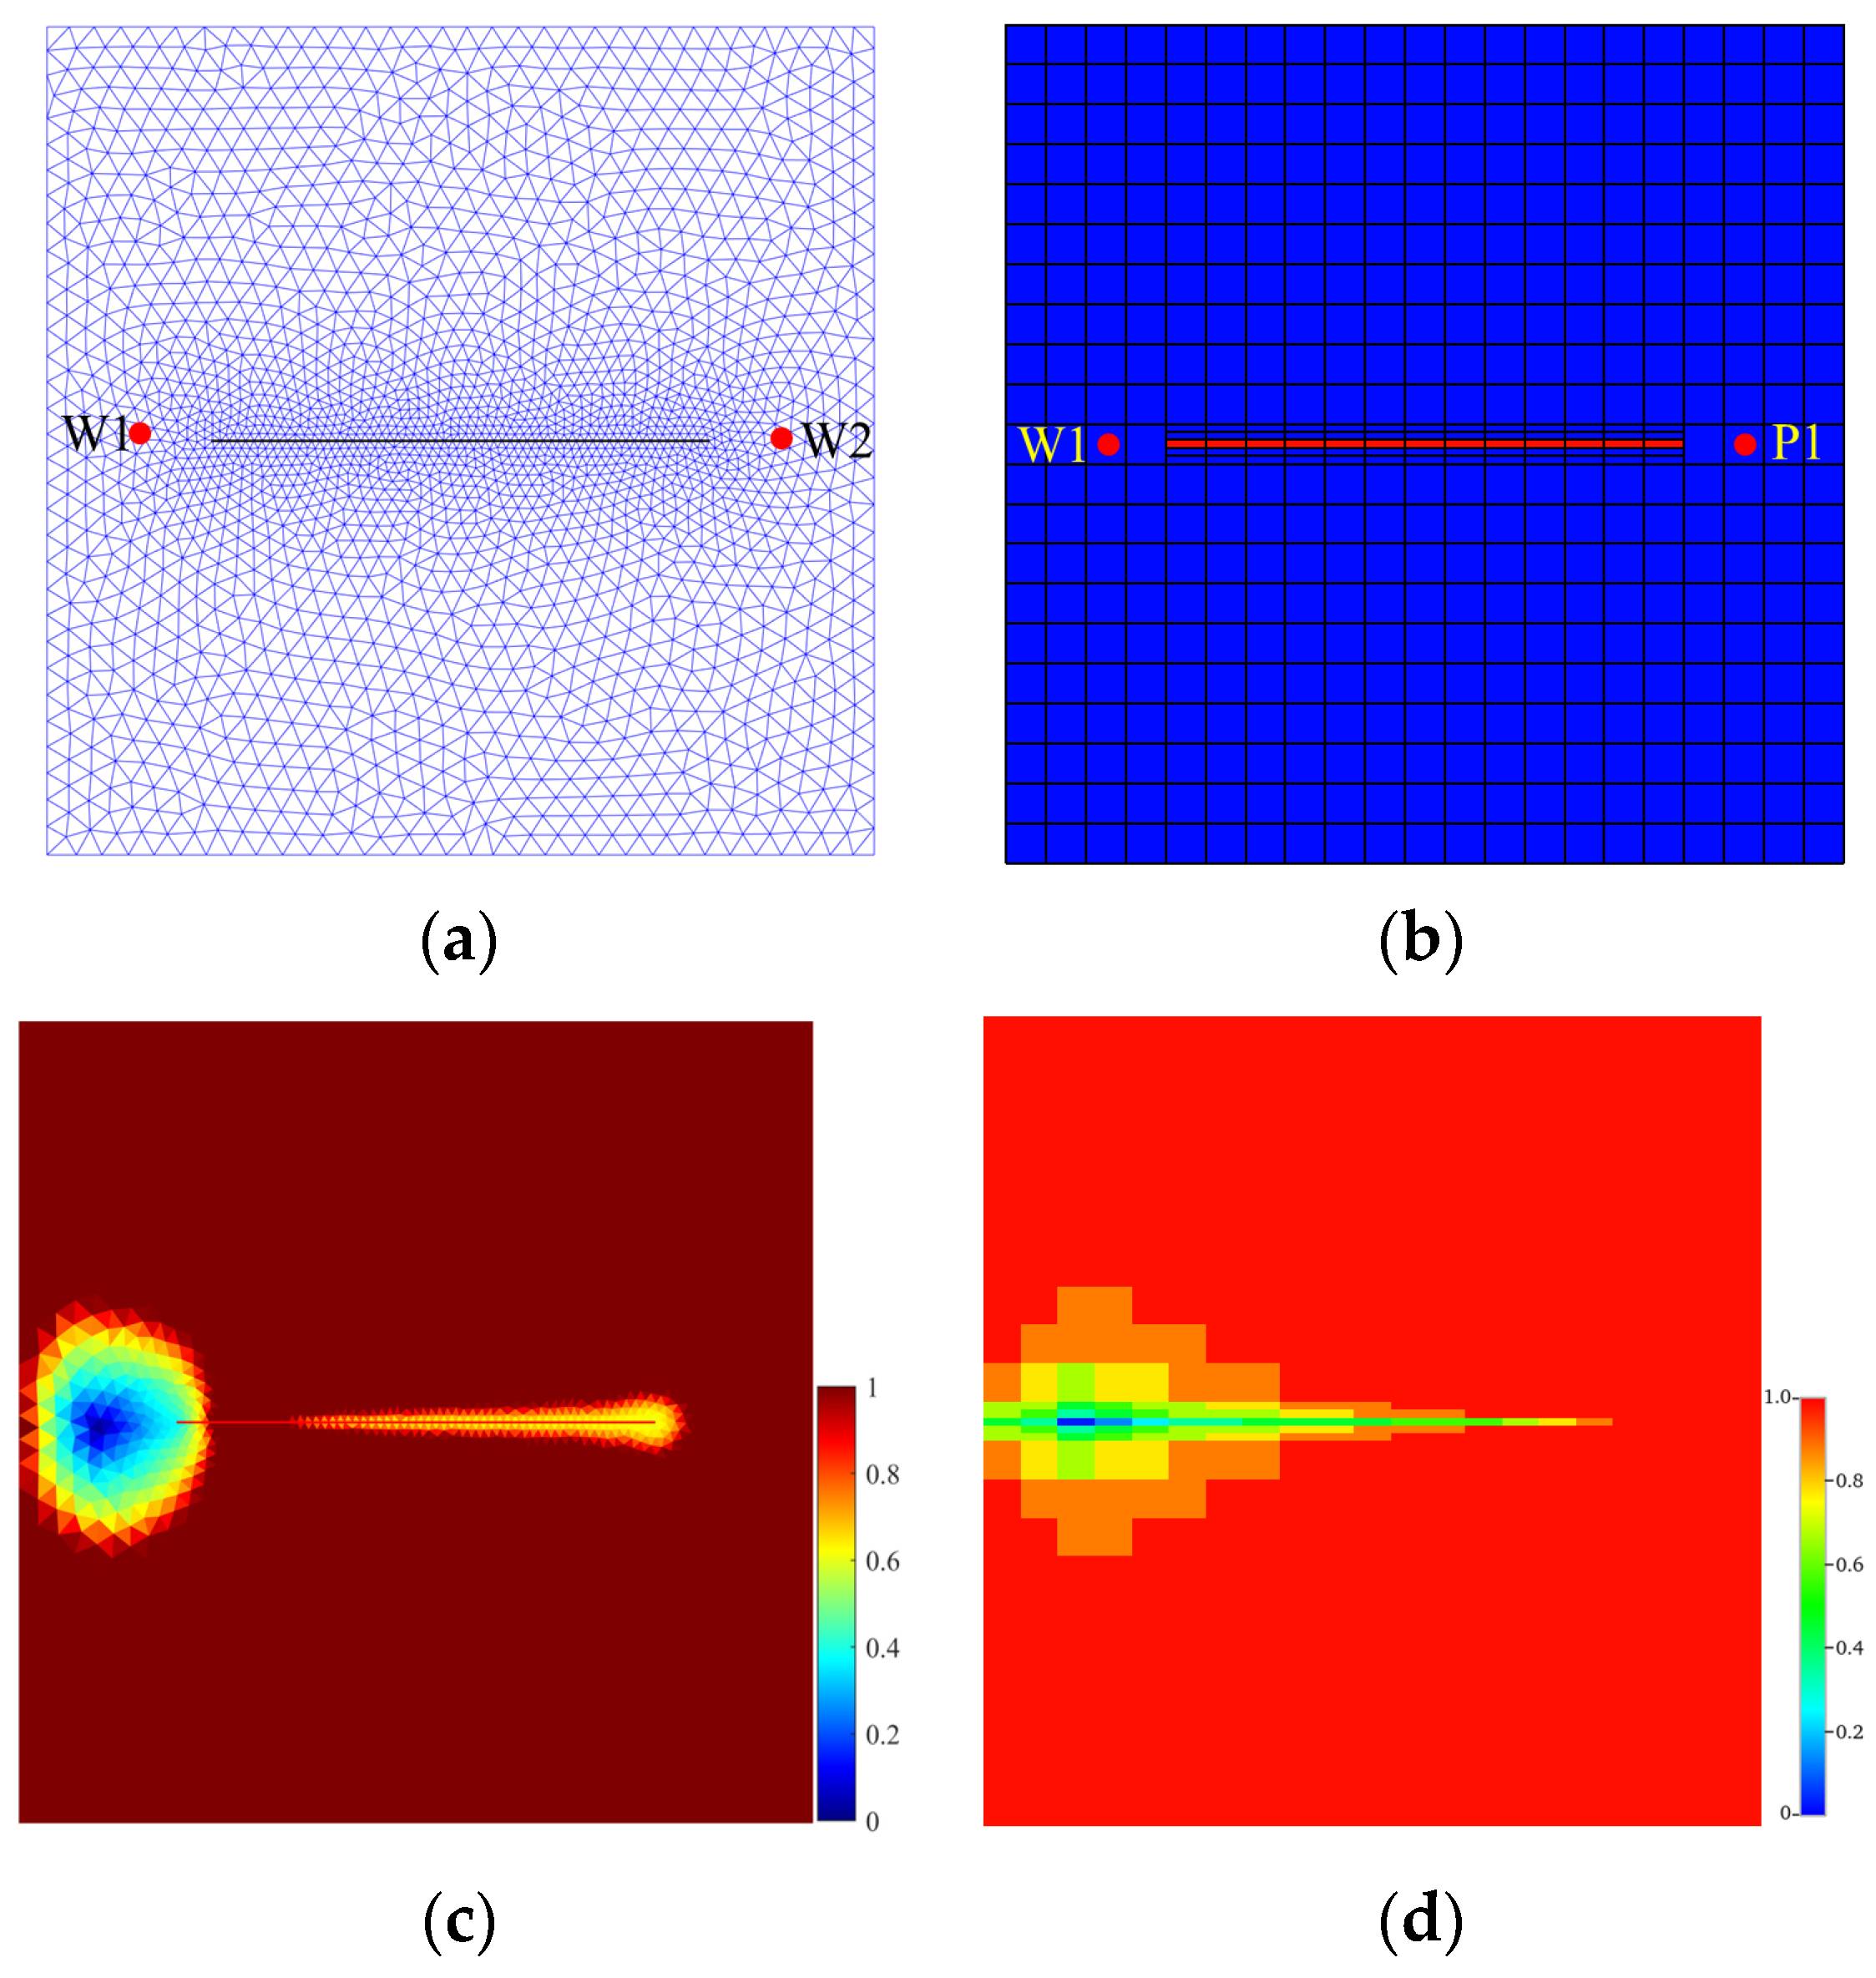
Figure 4.
Discrete fracture model with inter-well direct frac-hit. The model is constructed in a triangular grid; in this way, the fractures and wells can be finely characterized in geometric patterns. The black line in the figure is the fracture; the blue line represents the injection well; and the red line means the production well.
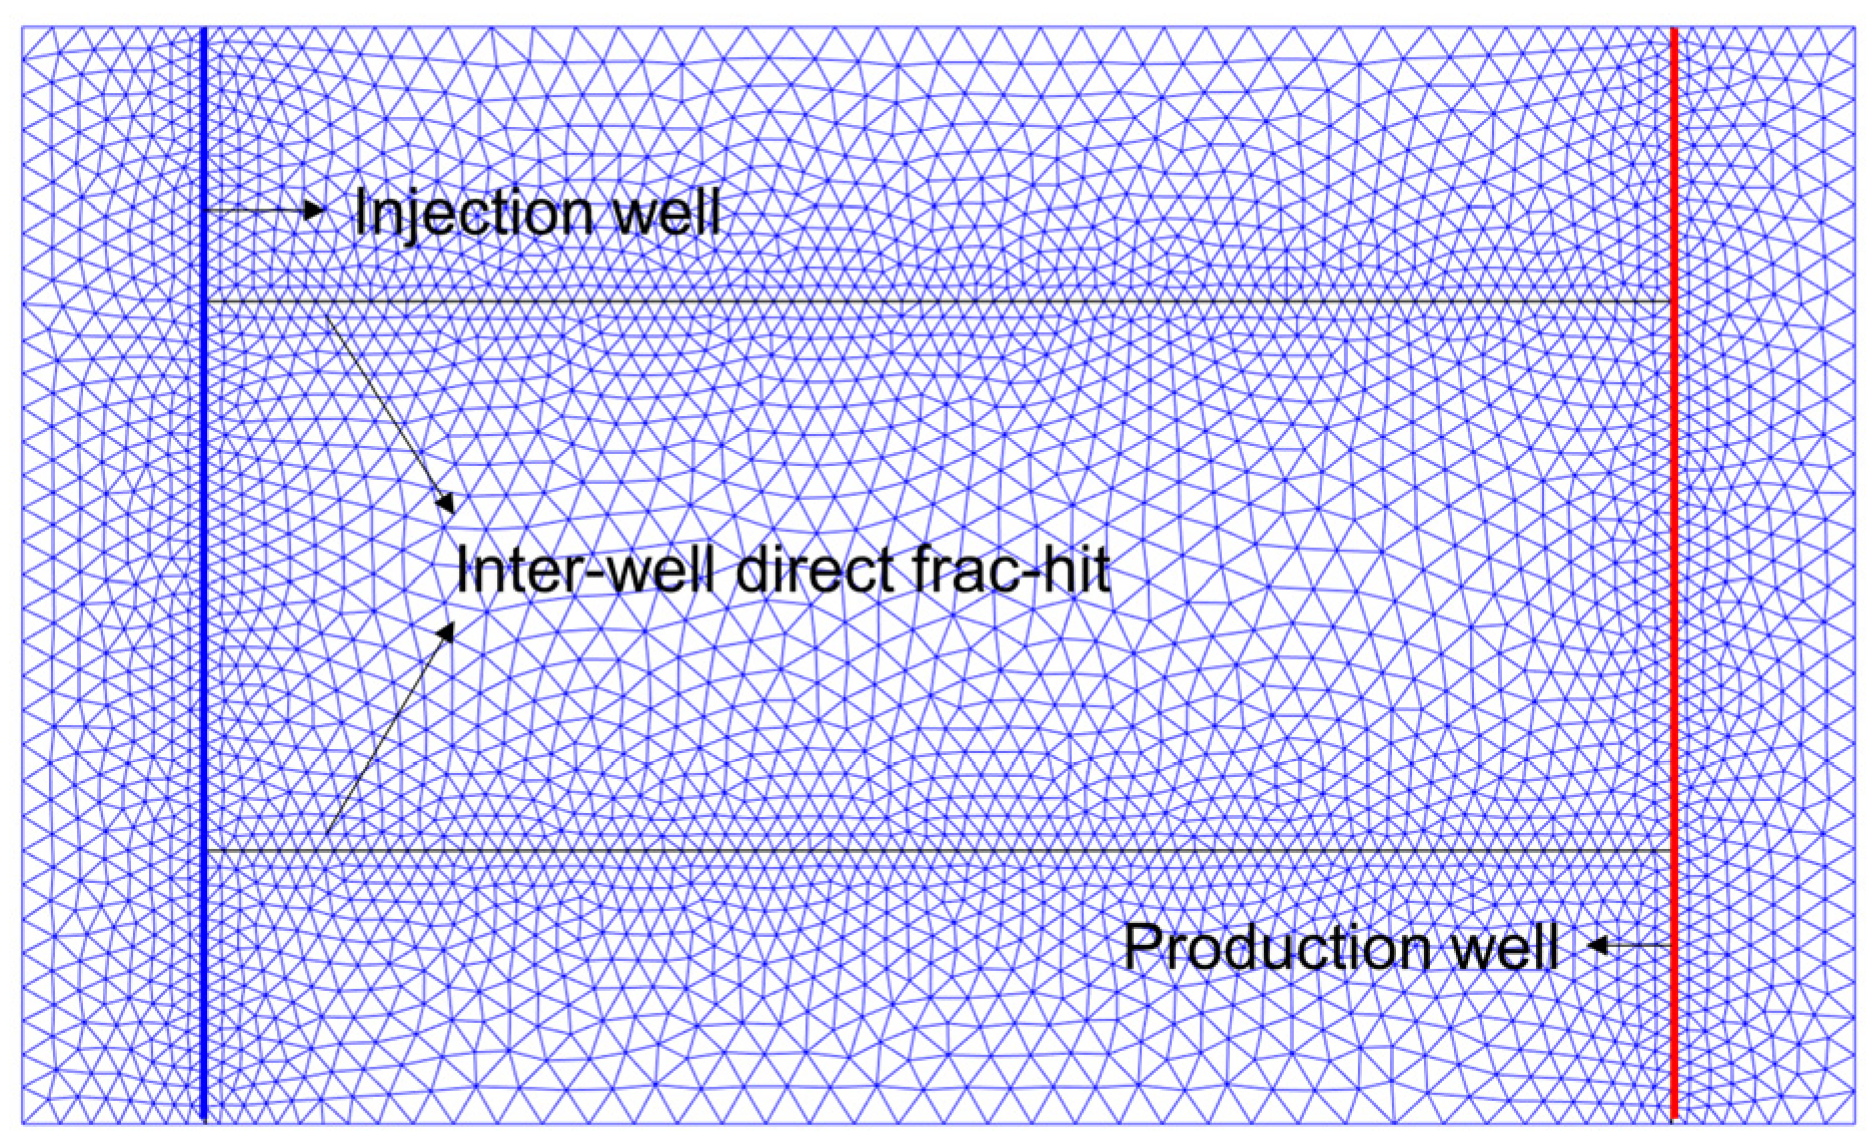
Figure 5.
Relative permeability curves. (a) Relative permeability curve for the matrix; (b) Relative permeability curve for the fractures.
Figure 5.
Relative permeability curves. (a) Relative permeability curve for the matrix; (b) Relative permeability curve for the fractures.
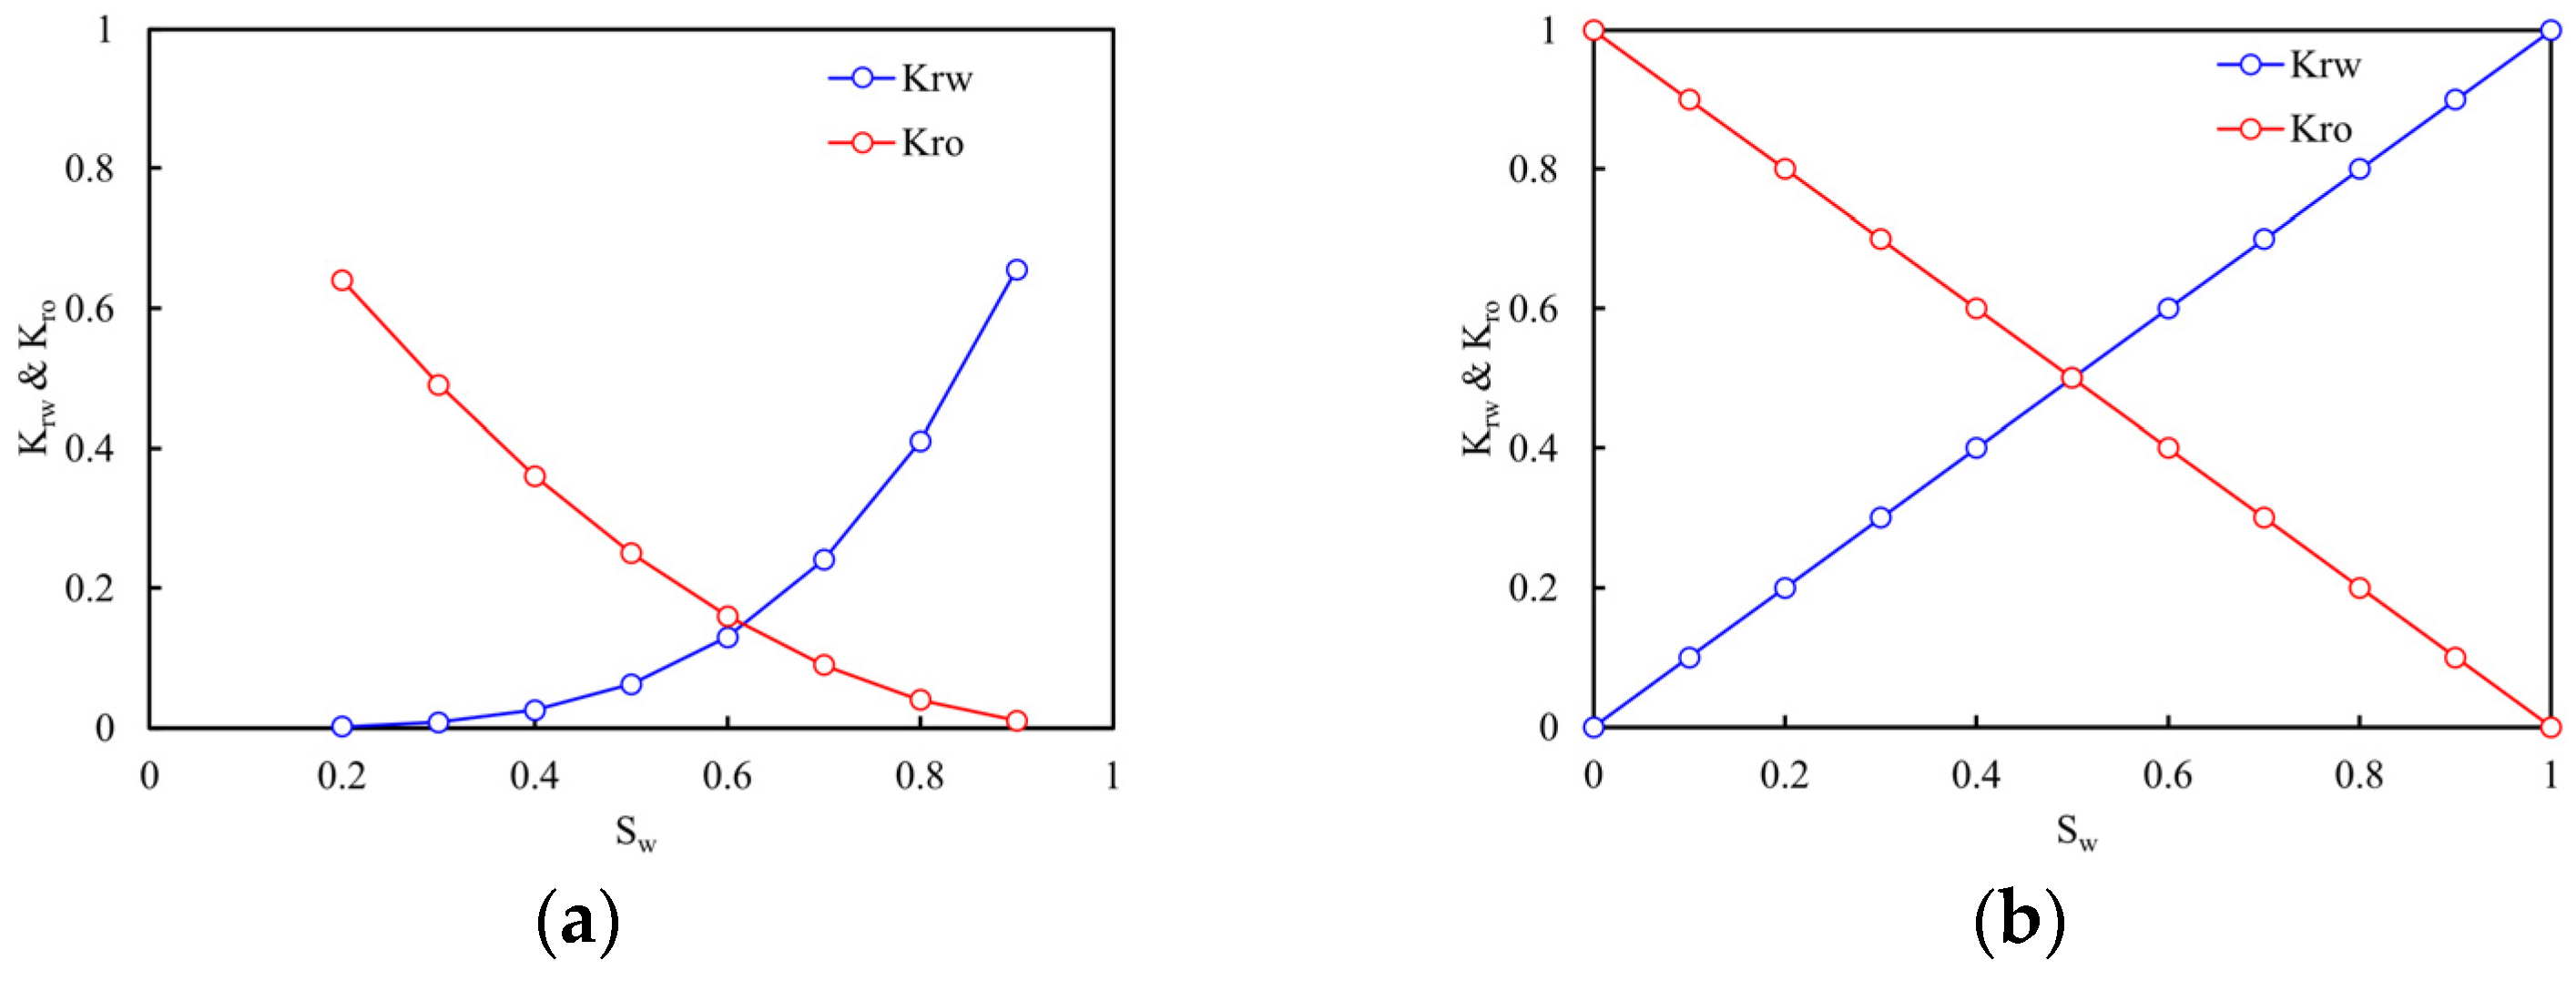
Figure 6.
Simulated oil saturation at 180 days for case 1 to case 6. There is little difference between the fracture flow in cases 1 and 2, but differences in the saturation distribution become obvious from case 3 (permeability difference D = 9).
Figure 6.
Simulated oil saturation at 180 days for case 1 to case 6. There is little difference between the fracture flow in cases 1 and 2, but differences in the saturation distribution become obvious from case 3 (permeability difference D = 9).

Figure 7.
Simulated oil saturation varies over time for case 3. The permeability difference D is 9 for case 3, and saturation results at 30 days, 90 days, 180 days, 270 days, 360 days, and 540 days are demonstrated.
Figure 7.
Simulated oil saturation varies over time for case 3. The permeability difference D is 9 for case 3, and saturation results at 30 days, 90 days, 180 days, 270 days, 360 days, and 540 days are demonstrated.

Figure 8.
Oil saturation along fractures at different timesteps. The solid line indicates the saturation of the small fracture above, and the dotted line indicates the saturation of the large fracture below. The abscissa represents the fracture distance from the injection well to the production well.

Figure 9.
Relationship between fracture fractional flow rate ratio and fracture permeability ratio (logarithmic scale). The relationship between fmin and D can be well fitted by a power function. When the permeability ratio exceeds 9, the flow rate in small fractures cannot be obtained by Wang’s parallel core displacement experiment.

Figure 10.
Relationship between fracture fractional flow rate and fracture permeability ratio of three fracture scales in liner scale. The three lines of red, blue, and pink are those representing small fracture effective widths of 0.1 mm, 1 mm, and 10 mm, respectively.
Figure 10.
Relationship between fracture fractional flow rate and fracture permeability ratio of three fracture scales in liner scale. The three lines of red, blue, and pink are those representing small fracture effective widths of 0.1 mm, 1 mm, and 10 mm, respectively.

Figure 11.
Oil saturation distribution at different oil–water viscosity ratios after 270 days. There are eight subgraphs which separately represent cases of oil–water viscosity ratios of 1, 5, 10, 20, 50, 100, 150, and 200.
Figure 11.
Oil saturation distribution at different oil–water viscosity ratios after 270 days. There are eight subgraphs which separately represent cases of oil–water viscosity ratios of 1, 5, 10, 20, 50, 100, 150, and 200.
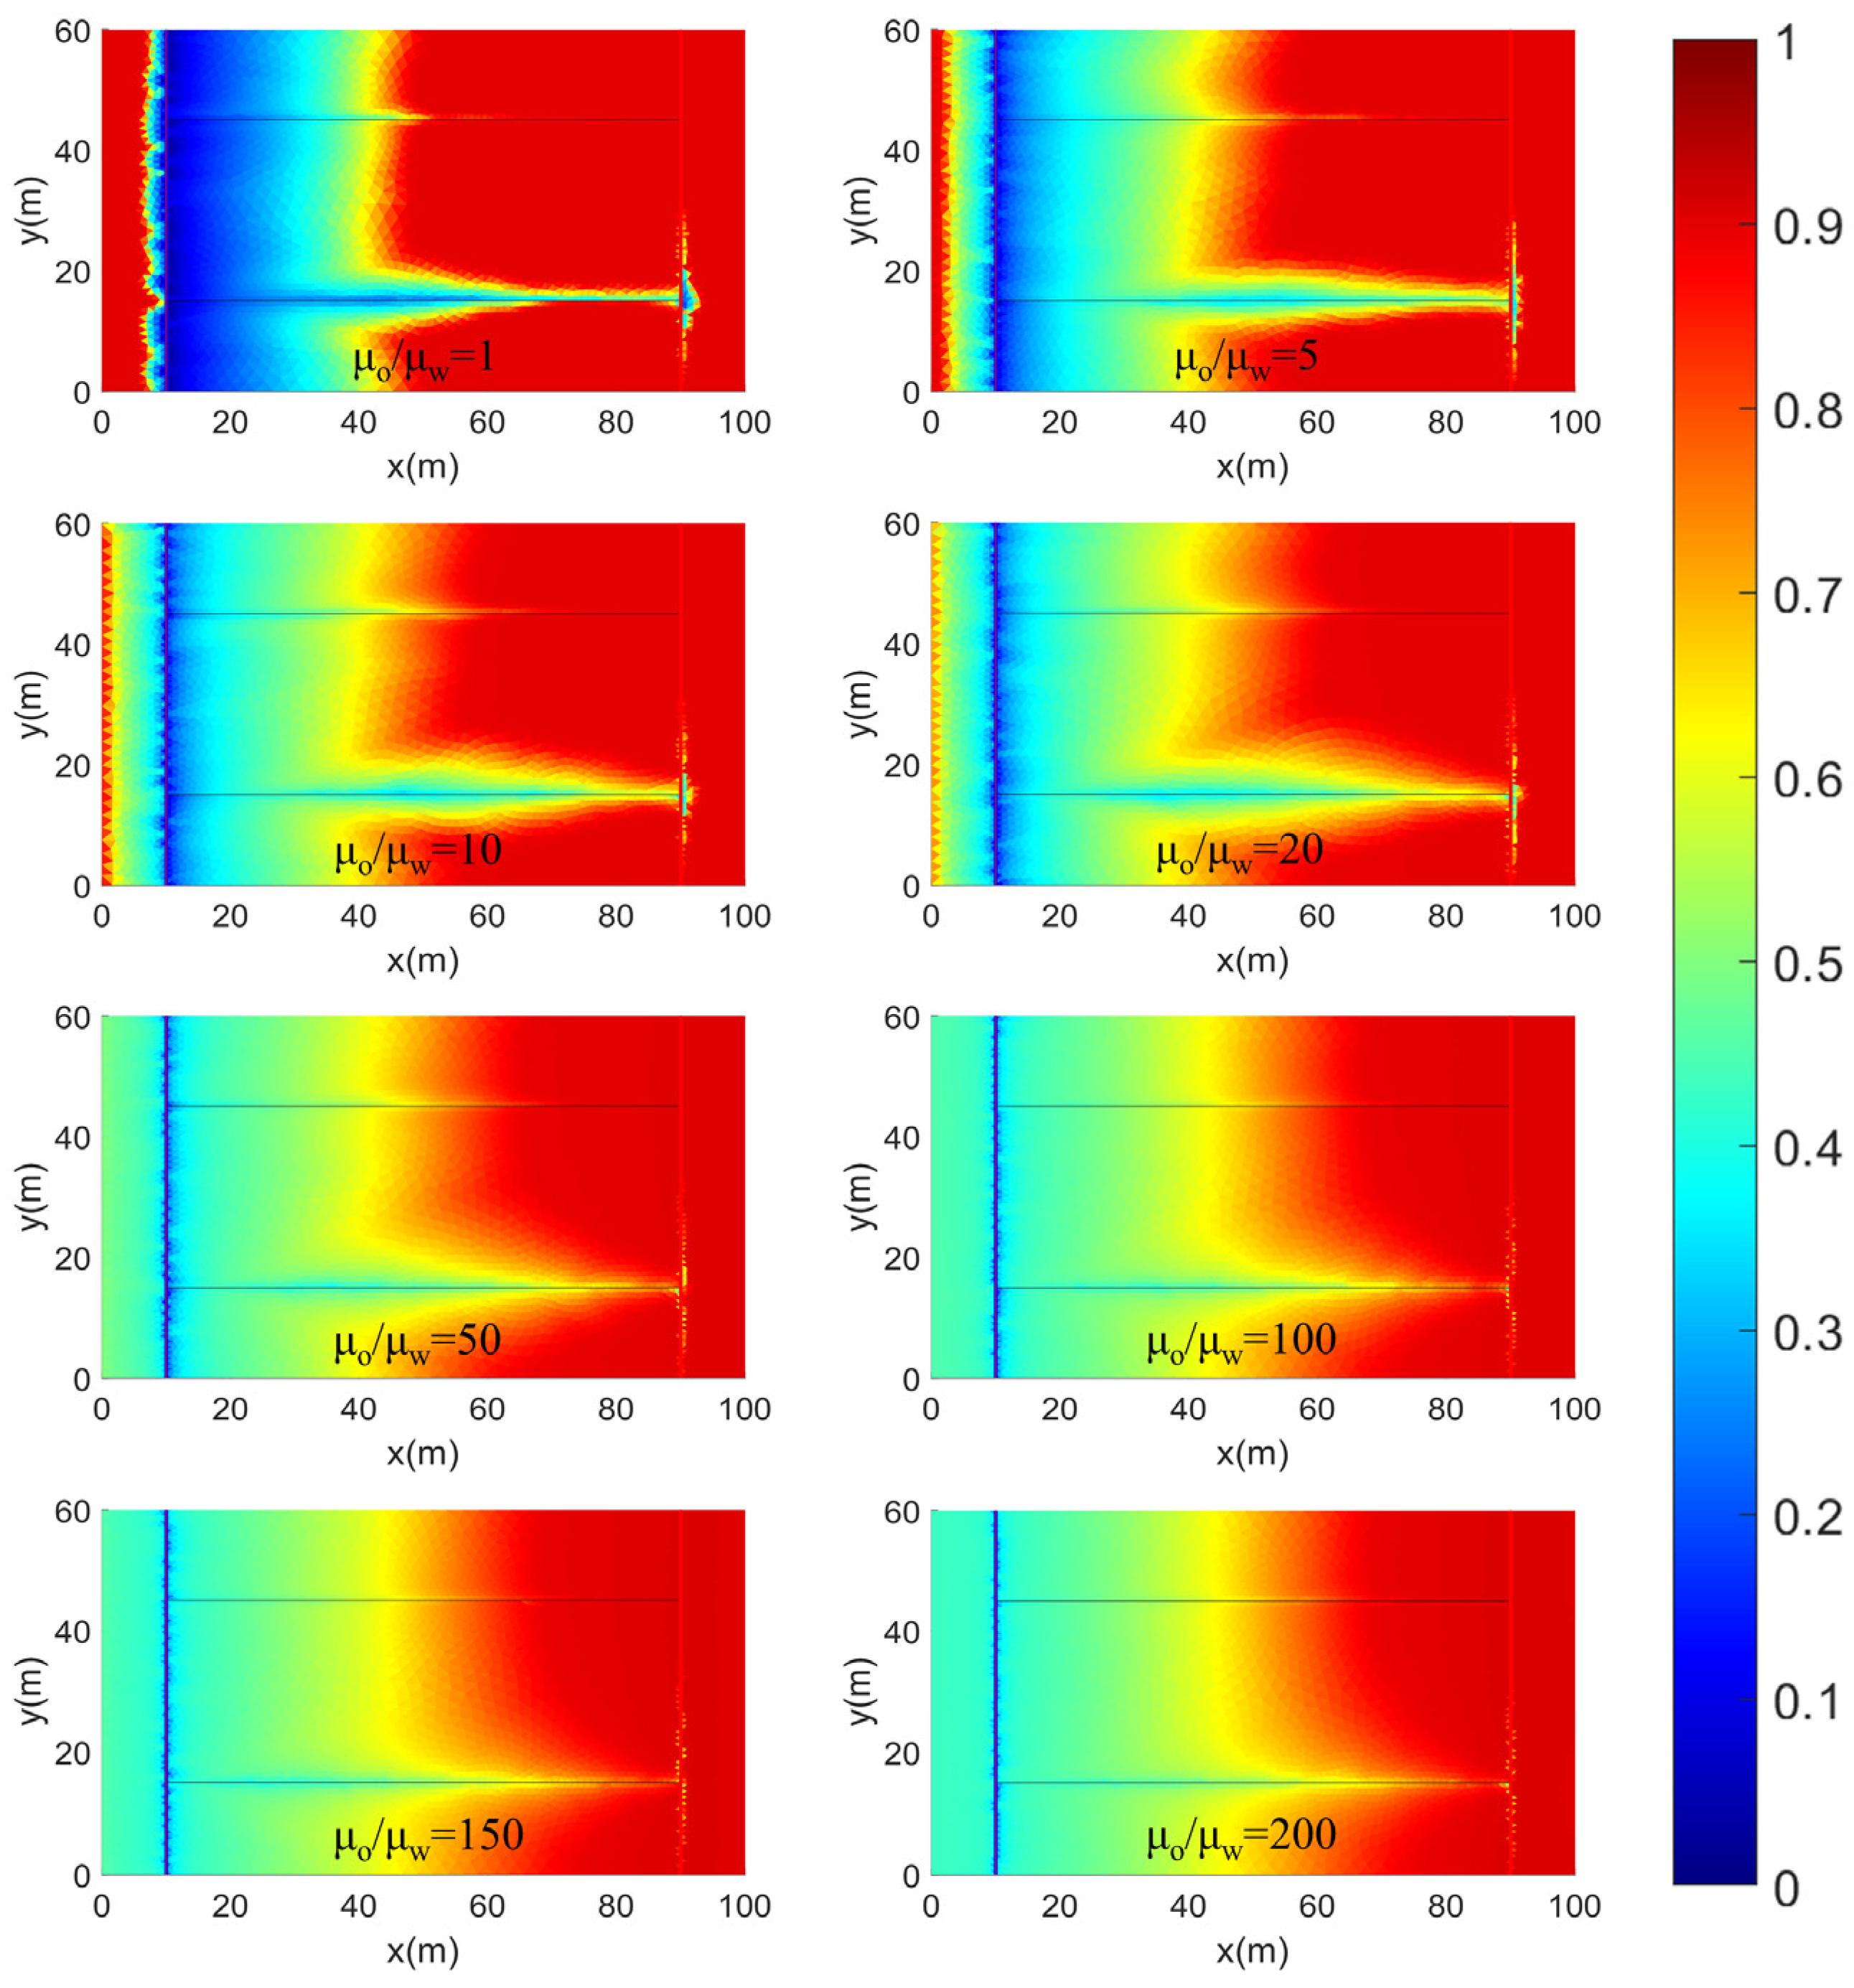
Figure 12.
Fracture fractional flow rate ratio under different oil–water viscosity ratios varies with the permeability ratios. There are four cases with oil–water viscosity ratios = 1, = 10, = 50, and = 100 represented by pink, green, blue, and red lines, respectively.
Figure 12.
Fracture fractional flow rate ratio under different oil–water viscosity ratios varies with the permeability ratios. There are four cases with oil–water viscosity ratios = 1, = 10, = 50, and = 100 represented by pink, green, blue, and red lines, respectively.

Figure 13.
Fracture fractional flow rate with the increase in the oil–water viscosity ratio. All the cases have a fixed permeability ratio of 9 and oil–water viscosity ratio.
Figure 13.
Fracture fractional flow rate with the increase in the oil–water viscosity ratio. All the cases have a fixed permeability ratio of 9 and oil–water viscosity ratio.
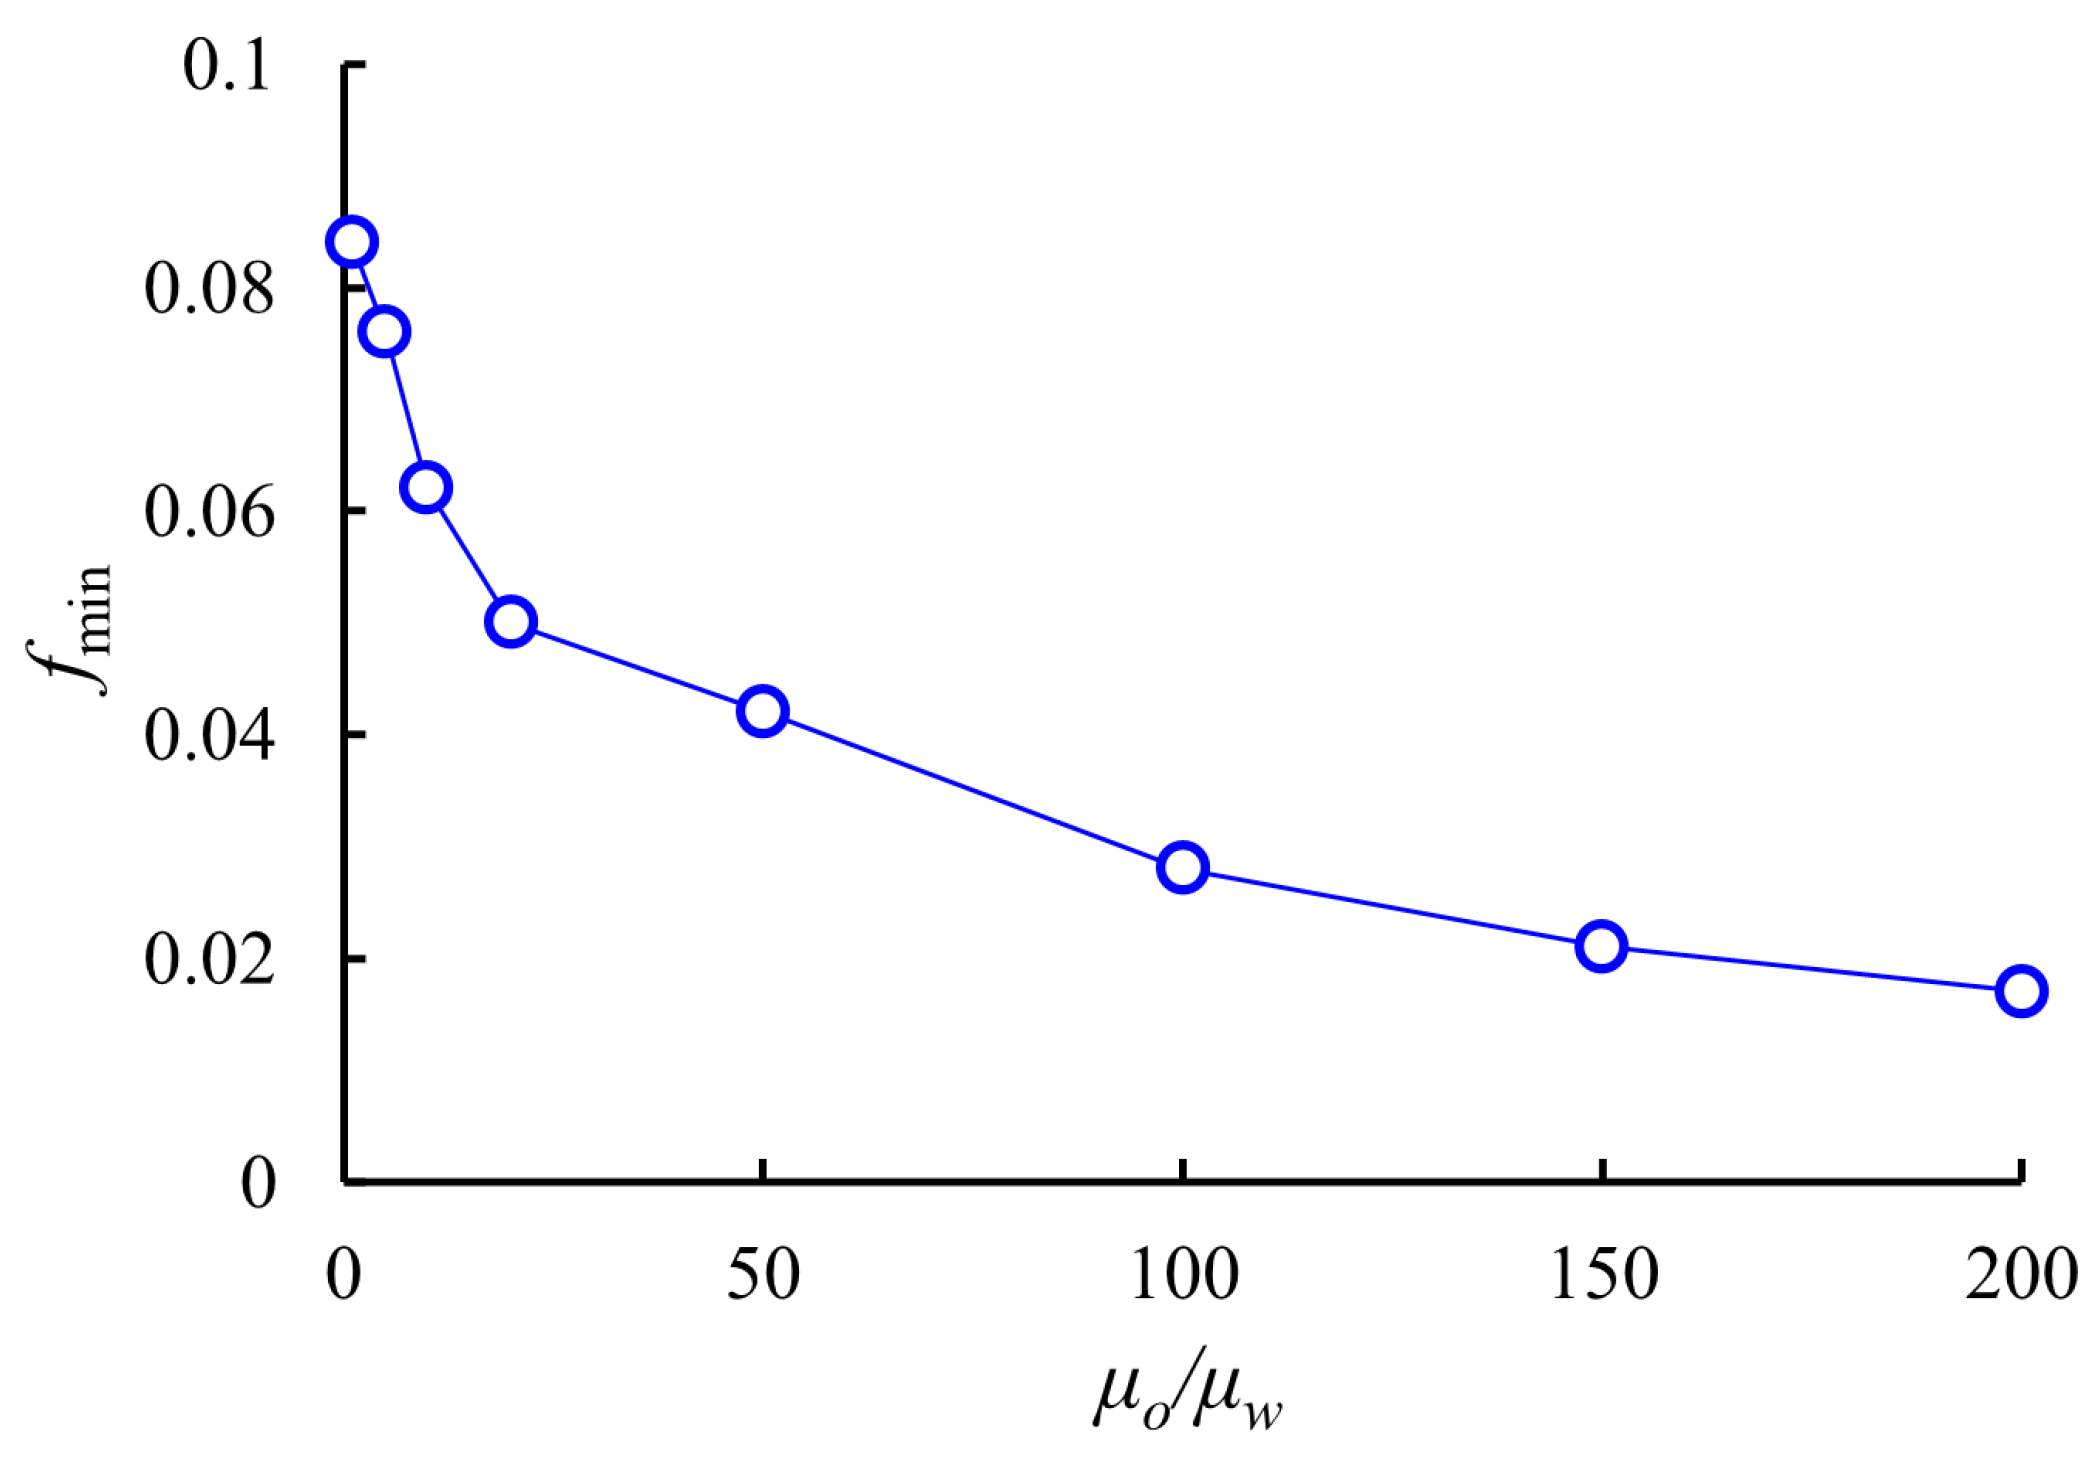
Figure 14.
Oil saturation map under different fracture length after 360 days. Six subgraphs separately represent cases of fracture lengths of 30 m, 40 m, 50 m, 60 m, 70 m, and 80 m. The first seven cases are indirect frac-hits.
Figure 14.
Oil saturation map under different fracture length after 360 days. Six subgraphs separately represent cases of fracture lengths of 30 m, 40 m, 50 m, 60 m, 70 m, and 80 m. The first seven cases are indirect frac-hits.

Figure 15.
Fracture fractional flow rate ratio under different fracture lengths. There are two regions divided by the fracture length of 60 m. In the first region, with the light yellow background, fmin decreases as fracture length increases, while in the second region, with the light blue background, fmin remains at a relatively constant value.

Table 1.
Basic parameters of verification model.
| Parameters | DFM Model | CMG Model |
|---|---|---|
| Fracture permeability (μm2) | 8.3 × 10⁴ | 139 |
| Matrix permeability (μm2) | 1 | 1 |
| Fracture porosity | 0.45 | 0.45 |
| Matrix porosity | 0.15 | 0.15 |
| Oil viscosity (mPa·s) | 2 | 2 |
| Water viscosity (mPa·s) | 0.5 | 0.5 |
| Oil density (kg/m3) | 850 | 850 |
| Water density (kg/m3) | 1000 | 1000 |
| Fracture length (m) | 60 | 60 |
| Effective fracture width (m) | 0.001 | 0.6 |
| Initial pressure (MPa) | 12 | 12 |
| Injection pressure (MPa) | 30 | 30 |
| Bottom hole pressure (MPa) | 5 | 5 |
Disclaimer/Publisher’s Note: The statements, opinions and data contained in all publications are solely those of the individual author(s) and contributor(s) and not of MDPI and/or the editor(s). MDPI and/or the editor(s) disclaim responsibility for any injury to people or property resulting from any ideas, methods, instructions or products referred to in the content. |
© 2023 by the authors. Licensee MDPI, Basel, Switzerland. This article is an open access article distributed under the terms and conditions of the Creative Commons Attribution (CC BY) license (https://creativecommons.org/licenses/by/4.0/).
Share and Cite
MDPI and ACS Style
Meng, F.; Wang, Y.; Song, X.; Hao, M.; Qin, G.; Qi, Y.; Ma, Z.; Wang, D. Numerical Simulation of Fracture Flow Interaction Based on Discrete Fracture Model. Processes 2023, 11, 3013. https://doi.org/10.3390/pr11103013
AMA Style
Meng F, Wang Y, Song X, Hao M, Qin G, Qi Y, Ma Z, Wang D. Numerical Simulation of Fracture Flow Interaction Based on Discrete Fracture Model. Processes. 2023; 11(10):3013. https://doi.org/10.3390/pr11103013
Chicago/Turabian StyleMeng, Fanle, Youjing Wang, Xinmin Song, Mingqiang Hao, Guosheng Qin, You Qi, Zunjing Ma, and Dong Wang. 2023. "Numerical Simulation of Fracture Flow Interaction Based on Discrete Fracture Model" Processes 11, no. 10: 3013. https://doi.org/10.3390/pr11103013
Note that from the first issue of 2016, this journal uses article numbers instead of page numbers. See further details here.