Abstract
The solar drying process is a critical postharvest stage for preserving coffee quality and is widely used in coffee-producing countries. A descriptive exploratory study was carried out in zones with different annual solar brightness to determine the climate variability influence on solar drying. Variables related to the evolution of drying, physical and sensory quality, and the physicochemical characteristics of the Castillo® coffee variety were analyzed. Coffee quality was assessed by means of SCA protocol. An automatic system was designed to record variables inside the dryers and mass loss. The drying rates were different by climatic zone above and below 0.52%∙h−1. Drying time was significantly longer in less solar brightness zones (Wilcoxon test). An inverse linear relationship between rewetting percentage and bean moisture was observed. Regarding coffee quality, the average scores were 81.37 and 80.93 SCA points for the climatic zones with the lowest and highest solar brightness, respectively. The bean color, water activity, acidity, and fat content did not vary between climatic zones. The coffee quality was not affected by solar drying in contrasting climatic conditions, despite the differences in drying time. Solar drying behaviors were identified that allow for the development of strategies for improving the process efficiency and management of coffee.
1. Introduction
In the production of mild washed Arabica coffee, drying constitutes the main stage of conservation because wet parchment coffee is a product with high levels of moisture, on the order of 53% w.b. [1]. The wet process method consists mainly of removing different parts of the coffee fruit, such as the exocarp (pulp) and mesocarp (mucilage), until obtaining the endosperm (green bean), which is covered by the endocarp (parchment). The obtained beans are subjected to solar or mechanical drying. Mechanical drying in coffee consists of supplying hot air in the appropriate quantity and temperature to reduce coffee moisture without compromising the quality of the beans. The temperature should not exceed 50 °C, and the specific flow rate should be 0.1 m3∙min−1∙kg dry parchment coffee [1,2]. During drying, moisture is removed from the bean to reduce microbial activity and maintain stable green coffee bean physiology [3,4]. In this way, alterations in the safety and deterioration in quality attributes of coffee are avoided. The adequate moisture levels to facilitate commercialization and subsequent stages until consumption are between 10 and 12% w.b.; in this state, coffee is known as dry parchment coffee (dpc) [2]. To decrease coffee moisture, drying is a unit operation with high energy demand; therefore, one alternative is to take advantage of the air’s natural energy and that which solar radiation supplies. Although mechanical drying allows moisture to be removed from the coffee in less time and has operational advantages, it also presents some disadvantages compared to solar drying, such as high consumption of fuels, mainly fossil fuels [1], and effects on quality when not handled correctly [3,4]. Solar drying contributes to environmental protection, obtaining coffee with less energy requirements and in a sustainable way [5], and this technology is maintained in force for the coffee production process. It is also a method traditionally used by coffee growers during months of low production or during harvest times with low amounts of coffee [2]. In Colombia and other coffee-producing countries, the solar drying process is carried out under plastic covers or roofs that protect the coffee from the risks of drying in the open air, for example, contamination, animals, and/or unexpected rain [2,4,6]. This drying system is classified as passive because it uses the transfer of heat that occurs by natural convention, where the movement of air is caused by differences in density due to the thermal changes within the drying chamber, serving to increase temperature and avoid losses of convection from the wind [5,7,8,9].
Given the dependence of solar drying on radiation, whose availability is intermittent, there are different drying conditions that are difficult to control. With this method, the temperature and relative humidity of the environment influence the evolution of the process, affecting the rates of moisture extraction and drying time. In addition to the above, the production of this type of coffee is carried out at a wide range of altitudes and in different relief forms that provide sufficient climatic conditions for the agronomy of the crop [10,11], whose influence on bean quality has been studied. For example, less solar radiation in the productive stages of the crop generates a positive effect on the quality of the beverage [12,13]. Although the radiation requirements are sufficient for stages such as flowering or fruit formation [10], it is unknown whether variations in solar radiation during drying influence the characteristics associated with coffee quality.
Additionally, the use of solar drying to process coffee is desired by some buyers due to the relationship between higher drying temperatures with forced air and deterioration in quality [14,15]. It has been suggested that the extraction of moisture in a slow way is favorable for coffee quality [16]. However, in areas with low solar brightness, coffee drying is difficult, increasing the risk of affecting quality and the formation of defects, thus restricting the possibility of using this drying alternative under limiting climatic conditions.
The solar drying process implies having large drying areas; this fact is especially risky when there is a large harvest because there are not only greater volumes of coffee but also weather conditions, for example, increases in precipitation and relative humidity and decreases in sunlight and environmental temperature, to consider. Under these conditions, the drying time can be extended for several days without knowing the effect on the quality and characteristics of the resulting coffee. Because the processing method has great influence on coffee quality, it is necessary to determine the contribution of postharvest stages, in this case, drying, to satisfy quality standards and the demand of the consumer market. Therefore, the objective of this work was to evaluate the drying condition’s (level of solar brightness) effect on coffee’s physicochemical and sensory quality characteristics. Currently, there is no reported information about these variables’ effects on washed coffee quality; so, this research constitutes a starting point for understanding drying process factors that could represent changes in the beverage of coffee’s characteristics. The results of this research provide a basis for proposing alternatives for improving solar drying in areas with environmental limitations or with conditions that influence coffee quality.
2. Materials and Methods
The research was carried out in the Department of Quindío, Colombia. The information was collected during the harvests from November 2021 to March 2023. This descriptive exploratory research was conducted in the stages described below.
2.1. Description of the Climatic Zones
The drying processes were carried out in two climatic zones with different levels of solar brightness, i.e., low and adequate for the production of coffee [10,17], in the Department of Quindío, Colombia, located between 04°04′41″ and 04°43′18″ north latitude and between 75°23′41″ and 75°53′56″ west longitude (Figure 1). Zone 1, with less than 1400 h of average annual solar brightness, is located in the central mountain range. And zone 2, with 1400 and 1800 h of average annual solar brightness, corresponds to the flat western part of the department; these zones are classified as low and suitable, respectively, for coffee production, and these zones have daily average solar brightness values from less than 3.8 h to 4.9 h, respectively.
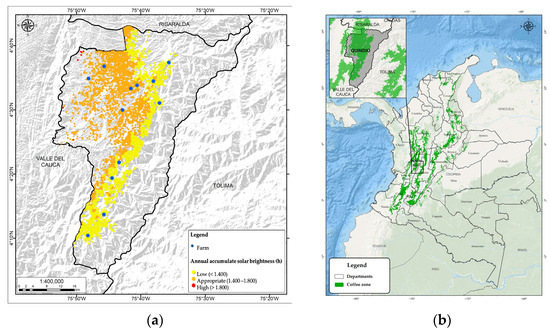
Figure 1.
Geographic location of the study area, including the climatic zones and solar brightness (a) in the coffee-growing zone of Colombia (b).
The climatic information of the farms in which the drying processes were carried out, i.e., annual mean values and estimated values based on reports from stations that are part of the department’s climatic network [17], are presented in Table 1.

Table 1.
Average annual climatic conditions of the coffee farms sampled in each climatic zone.
2.2. Description of Solar Drying Systems and Recording of Environmental Conditions
In selected farms, the solar dryers were located, which were built using the same parameters (shape and volume) in order to guarantee the dry experimental conditions (Figure 2a). The dryers had a cylindrical shape with a dome-type cover, with a metallic structure, covered on the top and side with agricultural-use plastic recommended for the solar drying of coffee in Colombia [18,19]. The air volume above the tray was 3.52 ± 0.02 m3, and the drying area was 2 m2, capable of drying approximately 12 kg of dry parchment coffee (dpc). The tray that supported the coffee during drying was built of plastic mesh to facilitate water extraction. This tray was suspended and supported by a load cell to record loss of mass. A circular rake was added to facilitate the movement of the coffee mass during drying at least four times a day, in accordance with recommendations [20] (Figure 2b). A sensor (UT330B-USB, UNI-T, China) was used to record the humidity and environmental temperature conditions at the experimentation site [18].
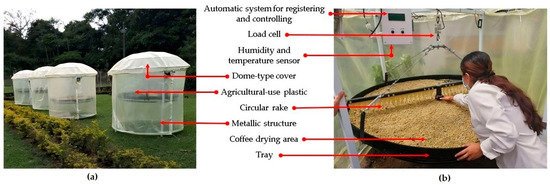
Figure 2.
Drying equipment used for solar coffee drying, external view (a). Drying equipment used for solar coffee drying, internal view (b).
The dryers were arranged in each of the farms of the study (Table 1) to carry out at least two solar drying batches in each one of them. Each dryer had an automatic system for registering and controlling variables for the solar drying of coffee. With this system, the temperature and relative humidity of the air inside the dryer were recorded, as was the mass of the coffee during the drying process. Additionally, with this information, the extraction of exhausted air from the inside of the dryer was programmed, and the completion of the solar drying process was determined automatically.
The automatic registration and control system comprised sensors, actuators, and electronic circuits:
- Central processing unit—CPU (Mega 2560, Arduino, Ivrea, Italy);
- SD data storage device (Data Logger Shield, Adafruit, New York, NY, USA) and real-time clock (PCF-8523, Adafruit, New York, NY, USA);
- Temperature sensor (Dallas DS18B20, Maxim integrated, New York, NY, USA) (55 °C to +125 °C with ±0.5 °C accuracy) and relative humidity sensor (HIH-4030SF, Honeywell, Charlotte, NC, USA) (from 0% RH to 100% RH with an accuracy of ± 3.5%), with operating temperatures between −40 °C and 85 °C;
- Reference S-type load cell (YZ101N, Vector Controls, Houston, TX, USA) (125 kg);
- Humid air extractor (RQA120, Cheka, Bogotá, Colombia) from 21 W to 110 VAC;
- End-of-drying indicator system with audible alarm and 10 W LED reflector (LD/1603, Watt, Ningbo, China); and
- LCD display screen (20 × 4) (Vishay, Malvern, PA, USA) and real-time configuration buttons.
The control diagram used is shown in Figure 3.
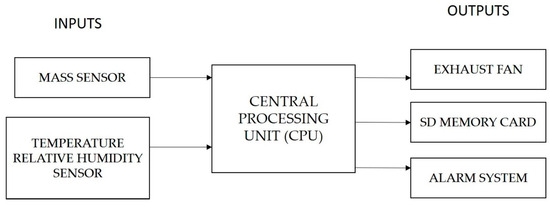
Figure 3.
Control system diagram.
Variable data were stored by the system; the sampling period was 5 min. Additionally, the extraction of humid air from the drying chamber was carried out by means of an extractor that operated automatically based on temperature and relative humidity data, the time of day, and the temperature and humidity inside the dryer. The extractor was activated from 7:00 a.m. to 5:00 p.m., when the temperature was greater than or equal to 45 °C, and/or when the relative humidity was greater than or equal to 70%. To deactivate the extraction system, lower temperature and relative humidity values were taken into account, i.e., 38 °C and 60%, respectively.
Additionally, the system had a sound and light alarm that indicated mass loss close to 12% w.b. (Mf), to stop the drying on time and remove the coffee from the dryer. The coffee moisture mass was estimated by the gravimetric method [21] based on the characteristics of wet parchment coffee, such as initial mass (), with an initial moisture content (Mi) of 53% w.b. (Equation (1)).
2.3. Coffee Sampling and Processing
The obtained washed coffee (wet process method) from each farm was obtained from the manual harvesting of ripe coffee fruits (Coffea arabica L. variety Castillo®). Recommendations were followed to obtain good-quality coffee postharvest, e.g., the removal of fruits and beans of low quality, pulping, fermentation, and washing [22]. In this way, the coffee quality that entered the dryers was similar between drying cycles. Each drying batch consisted of placing the initial mass on the tray of each dryer, which was 24 kg of wet parchment coffee, with a bean layer height of 2 cm, to efficiently take advantage of solar radiation and facilitate drying. Drying was stopped to record the drying time (h) when the system registered a mass of coffee in the tray of 12.5 ± 0.5 kg, which indicated coffee moisture between 10 and 12% w.b. This moisture was verified in situ by measuring the capacitance of the sample using a grain moisture tester (PM-450, Kett, Tokyo, Japan). Samples of 2 kg of dpc were packed, labeled, and transported to the Cenicafé Postharvest Discipline laboratory to perform moisture determinations following International Organization for Standardization (ISO) 6673, 2003 [23]. Subsequently, the samples were stored in a room with controlled conditions (16 ± 1 °C and 65% RH) for later analysis.
2.4. Physical and Sensorial Analyses
To determine physical and sensory quality, threshing was carried out (C-250, Kaffemat, Bogotá, Colombia) to obtain green coffee beans. Granulometry analysis was carried out using 100 g samples of coffee beans to determine the size of the beans and physical defects, especially of brocaded beans, following the procedure established by the Specialty Coffee Association (SCA) [24].
The bulk density analysis of the green coffee beans was carried out in accordance with the procedure established in ISO 6669: 1995 [25]. Samples of green coffee beans were passed through a feeder tank with the dimensions indicated in the standard of a 1 L volumetric container, ensuring a distance of 76.2 ± 1.5 mm between them, allowing the mass to flow freely until overflowing; excess beans were removed by leveling the top of the container. The coffee mass was recorded after the procedure.
Regarding the sensory quality of the samples, a panel of experts accredited for coffee cupping [26] roasted and ground the beans and prepared the beverage and then rated the quality attributes through the use of the Specialty Coffee Association (SCA) protocol [27]. The evaluation protocol is internationally recognized, and it considers ten attributes for coffee beverage sensory profile, including fragrance/aroma, uniformity, cleanliness, sweetness, flavor, acidity, body, aftertaste, balance, and overall impression. Each attribute was evaluated on a scale of up to 10 points, and the sum of the values of these attributes generated each sample qualification; the higher the score, the better the beverage quality. This scale made it possible to identify alterations in the attributes that reveal unpleasant flavors, identified as quality defects, whose total cup scores are less than 60 points. The panel consisted of five Q-Grader tasters, and each taster evaluated each of the coffees’ attributes with five cups per sample.
2.5. Physicochemical Analysis
The analysis of the physical and chemical characteristics of the coffee in each climatic zone consisted of a description of color, water activity, acidity, fat, and ash content, using the procedures described below. All the determinations were carried out in triplicate.
The color of coffee beans was determined using a photocolorimeter (HunterLab ColorQuest XE, Reston, VA, USA) with a D65 illumination source at an observer angle of 10°. The sample holder of the equipment was filled with whole coffee beans until the bottom was completely covered and the color was determined via reflection on the grain surface. Tristimulus color coordinates were recorded in the CIELab color space, in which there are three readings: lightness (L*), which measures the intensity of the reflected color with values between 0 and 100, where 0 is black and 100 is white; variable a* measures the amount of green or red in an image, being negative for green and positive for red; and the variable b* measures the amount of blue and yellow in the image, being negative for blue and positive for yellow.
The water activity (aw) of the coffee beans was determined using a dew point hygrometer (LabMaster, Novasina, Lachen, Switzerland) at 25 °C. Whole bean coffee was used. The background of the measurement cell was completely covered with the sample to avoid deviations in the measured values. The aw is given by the following Equation (2):
where aw is the decimal water activity, Pv is the vapor pressure in the coffee beans, and is the vapor pressure of pure water under the same temperature conditions.
The pH of the samples was determined via potentiometry using a pH meter (704, Metrohm, Herisau, Switzerland) following the methodology described by Cortés Macías et al., 2022 [28] with the following modifications. Samples (1 g) of ground coffee were diluted in 10 mL of distilled water, the homogenate was filtered, and the pH was measured.
The fat content of the dpc beans was measured using the crude fat method by Soxhlet (AOAC 920.39). For this, samples (1 g) of ground coffee obtained via cryogenic grinding were taken in a Soxhlet cellulose thimble. The extraction of the ether phase was carried out with petroleum ether in a Soxtec extractor (ST 243 Soxtec, Foss, Hillerod, Denmark), with a preheating stage at 90 °C for 10 min. The solvent recirculation process was carried out at 90 °C for 40 min. The fat content of the samples was expressed as a percentage (w.b.).
The ash content of the dpc was evaluated using the protocol described in AOAC 942.05. A muffle Thermolyne (FB1414M Thermos Scientific, Waltham, MA, USA) was employed. The organic matter was calcined at 550–600 °C. The ash content was expressed as a percentage (% w.b.).
2.6. Statistical Analysis
The average and interval were obtained with a 95% confidence interval. In addition, the standard deviation and median, minimum, and maximum sensory scores for each attribute were estimated for the coffee produced in each climatic zone. The same process was carried out for the physical and physicochemical characteristics of coffee. To evaluate differences in drying times and total SCA scores for the coffee samples from the two climatic zones, the Wilcoxon signed-rank test was performed because the samples did not follow a normal distribution. Additionally, the chi-square homogeneity test was performed to determine if there were differences between the distribution of the number of clean and defective cups. The statistical program SAS/STAT version 9.4 was used [29].
3. Results and Discussion
3.1. Description of Environmental Conditions during Solar Drying Processes
The humidity, environmental temperature, and solar brightness during solar drying were different between the climatic zones, corroborating said classification and allowing the generation of different conditions for drying. Zone 1, with the lowest average annual solar brightness (2.99 h, with a range between 0.38 and 6.99 h), presented a lower average temperature (19.82 °C, with a range between 14.70 and 30.25 °C) and higher relative humidity (85.00% with a range between 55.89 and 97.90%) during the drying tests. The average values of climatic zone 2 were 22.02 °C, minimum 15.90 °C, and maximum 32.69 °C, with a relative humidity of 84.84%, minimum 52.14%, maximum 98.40%, and with a solar brightness of 3.07 h, minimum 0.50 h, and maximum 6.38 h.
The thermal amplitude values were between 9.9 and 20.1 °C and between 12.8 and 21.4 for zones 1 and 2, respectively. The farms selected for the evaluations were framed within the previously defined and differentiated characteristics.
The sampling period and the control and recording system allowed for the estimation of daily trends, generating average values per hour. The main differences between the variables inside and outside the dryer were observed between 10:00 a.m. and 4:00 p.m., when climatic zone 2, with the highest number of hours of annual sunlight, had lower relative humidity than did climatic zone 1 (Figure 4b). This translates into a greater daily air drying capacity. Additionally, the mean temperature values were higher than those in zone 1 across 24 h (Figure 4a). The trends of these variables, for approximately 16 h, i.e., between 5:00 p.m. and 9:00 a.m., with a relative humidity close to 100% and a temperature of approximately 20 °C, made it difficult to reduce moisture in the beans.
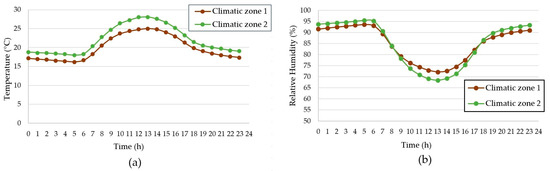
Figure 4.
Trends of the average environmental temperature (a) and relative humidity (b) during the day in the two climate conditions.
The proper functioning of the control system was confirmed because the maximum average temperature inside the dryers was not higher than 46 °C (Figure 4a), per the programming criteria described in Section 2.2, activating the exhaust fan to renew the air when the temperature inside the dryer reached 45 °C. Using the control and recording system allowed for the identification of differences between the dryers’ internal and external temperature and relative humidity values. For temperature, the internal temperatures were higher than the external temperatures, with average values up to 3.9 °C and maximum values up to 13 °C (Figure 5a). The drying capacity of the air inside the dryers was higher than outside the dryer, as evidenced by the lower relative humidity, with differences up to 12.4% on average concerning the relative humidity of the environment outside the dryer (Figure 5b).
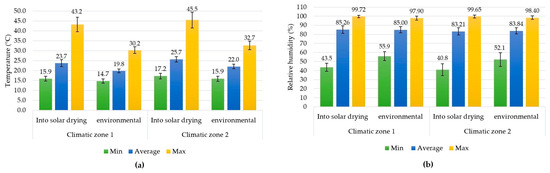
Figure 5.
Environmental conditions in each climatic zone during solar drying processes: (a) air temperature (°C) and (b) relative humidity (%).
The automatic recording and control system allowed for monitoring and controlling the conditions inside the dryer. There was a record of the monitoring of mass loss for all of the coffee available in the dryer, with a continuous sampling time of 5 min, which allowed for determining the trend of the loss of moisture throughout the drying process using the gravimetric method. Other tests have been reported for small coffee samples, for drying in a thin layer and with the potential of telemonitoring control, with results that can be integrated into the system proposed herein [30]. The monitoring of temperature and relative humidity inside solar coffee dryers has been previously reported [31,32] under different production conditions. Although it is a challenge to control the variables inherent to solar drying, it can be a useful tool to understand the process under a given condition and estimate values for process optimization, as used for the forced-air drying of coffee. In this case, the instrumentation allowed for simulating the process and knowing in advance the time required for the amount of coffee [33,34]. Similar mass monitoring systems have been used for other agricultural products, in which the mass of a sample up to 1 kg can be recorded and alerts can be sent via text message to mobile devices [35,36]. This technology can be adapted to the monitoring of variables for the solar drying of coffee to determine the opportune moment to stop solar drying and avoid economic losses.
3.2. Coffee Drying Time and Moisture Trends
The moisture of the dpc obtained after the drying cycle was within the moisture range of hygroscopic equilibrium (10–12% w.b.) (Table 2). Therefore, the first physical and sensory quality criterion was met. The characteristics of the production areas can affect the moisture of coffee after drying, and the difference can be significant in some places depending on climatic variables [37]. This is not the case for the conditions evaluated in this investigation.
Table 2.
Average values, variation, and range for coffee moisture and solar drying time under two climatic conditions.
As seen in Table 2, the drying time to obtain the moisture value was significantly higher for climatic zone 1 (p = 0.0025, Wilcoxon test), and the variability between the different drying runs was greater. A total of 82.8% of the drying batches in zone 2 needed between 169 and 336 h to achieve the appropriate moisture level. To obtain coffee with a moisture close to 11% w.b., 40% of the batches in zone 1 required times greater than 336 h. Solar drying times have been compared among processing methods, i.e., dry, semidry, and wet; the differences reported are due to the initial moisture of the coffee, which depends on the state of the bean, either in fruit, mucilage, or wet parchment, respectively [28]. For solar drying, the process time depends on the type of dryer, the climatic conditions and the amount of coffee, among others. In a previous study, the time to reduce the moisture to 10% w.b. was 69 h, using a thin layer in a hemispherical solar drying system, with an average environmental temperature of 28 °C and without control of variables to avoid high temperatures [30]. Therefore, the information presented herein contains the first data values for two different climatic conditions under the same solar drying system for coffee using the wet method.
Using the solar brightness information collected from the climatic stations in the zones [17], the number of hours of average solar brightness accumulated to obtain the desired coffee moisture was calculated. The drying carried out in climatic zone 1 required a greater number of accumulated hours to reach the hygroscopic equilibrium moisture (45.58 h), which on average was 12.75 h longer than that required in zone 2 (32.83 h), a difference that represents between three and four more days of drying in zone 1.
Because the evolution of solar drying depends entirely on the environmental conditions in which the process takes place, each drying curve, that is, the relationship between the loss of moisture from the beans and drying time, has different behavior. Figure 6 presents a typical drying curve for each climatic zone, with differences in the process time, together with the humidity and temperature for the air inside the dryer during the batches. The moisture curves for coffee were not continuous lines because the air from the environment did not have drying capacity most of the time when the air temperature decreased at night. The drying times were 341 h and 195 h (Figure 6a,b) for zones 1 and 2, respectively; there were temperature peaks during the day higher than 40 °C in zone 2 (Figure 6d), conditions that were not observed in zone 1 (Figure 6c). In general, when there was an increase in the temperature and a decrease in the humidity of the air inside the dryer, there was a rapid decrease in coffee moisture. In zone 1 (Figure 6a), the coffee moisture stabilized near 20% w.b. between approximately 200 and 280 h, which coincided with relative humidity values higher than 60%. In zone 2, there was a greater drying capacity of the air, and the time with relative humidity levels lower than 60% was longer, as reflected in daily peaks of decreases in coffee moisture between 5.11 and 9.01% per day. For zone 1, this decrease was between 1.29 and 5.77% per day. The effective drying times were 172 h and 85 h for zones 1 and 2, respectively.
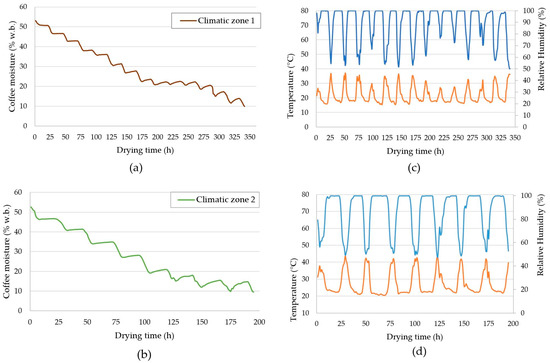
Figure 6.
Moisture loss from coffee during solar drying under different levels of solar brightness (a,b) and temperature (orange line) and relative humidity (blue line) during drying (c,d).
The drying rate was variable depending on the daily climatic condition, which was also different for the two climatic zones, i.e., greater than 0.52%/h for zone 2 and lower than that for zone 1 (Figure 7a). The same behavior was identified for obtaining natural coffee during drying at different air temperatures; higher temperatures lead to higher drying rates [38]. During the drying process, a moisture gain in the coffee was observed in the periods when the drying was stopped, known as rewetting, which presented an inverse linear behavior with the coffee moisture; the lower the coffee moisture, the greater the rewetting of the coffee beans due to the inverse relationship between the moisture of the beans and the humidity of the air (Figure 7b). Just as the drying rate is lower at lower coffee moisture, indicating that water reduction becomes difficult, the vapor pressure of the saturated air is higher than coffee beans’ vapor pressure, causing a gain of water due to the adsorption forces of the grain [39]. This behavior also depends on the psychrometric conditions in each area because atmospheric pressure varies with altitude. For example, the atmospheric pressure for the farms in Figure 7, located at an elevation of 1820 and 1210 m, was 81.2 kPa and 87.6 kPa (0.80 atm and 0.86 atm), respectively. For this case, with an air humidity of 100% at night, the temperature was above 20 °C for zone 2 and below 20 °C for zone 1. The air with the greatest drying capacity is in the zone with the lowest atmospheric pressure.
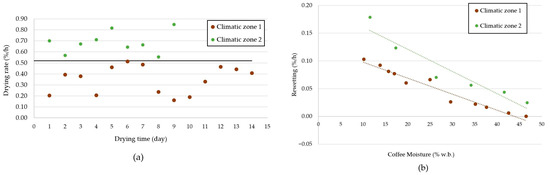
Figure 7.
Coffee drying rate (% w.b./h) (a) and rewetting rate (b) (% w.b./h) under two climate conditions.
In zone 1, the drying rate was close to 0.02%/h when the moisture of the beans was 38.0% w.b., and in zone 2, the same drying rate was observed when the coffee had a moisture of 46.8% w.b. The moisture gain of the beans implied a greater demand for energy during drying to achieve the desired decrease in the beans, even more so when it was estimated that the total rewetting of the two processes was similar, i.e., 14.9% and 14.7% for zones 1 and 2, respectively.
3.3. Physical and Sensorial Analysis
The physical quality, described via bulk density and granulometry, were similar to those of the coffee obtained via solar drying in climatic zones with two different levels of solar brightness. Descriptively, the beans from zone 1 had a higher bulk density and a size between meshes 14 and 17, and the batches from zone 2 contained a higher proportion of larger beans and brocaded beans (Table 3); however, the differences were not significant for any of the physical variables evaluated concerning the two solar drying conditions evaluated.
Table 3.
Descriptive statistics for the physical characteristics of coffee obtained under two climate conditions during solar drying.
Bulk density is a physical characteristic that varies by species. Beans of the Arabica species are more dense than beans of the Robusta species [40]. Different levels of crop elevation do not influence changes in this variable [41]. This variable can vary widely; therefore, differences in real density can be detected, for which measurements are made bean by bean [42]. Regarding size, most of the beans from the two climatic zones were greater than 18 mesh, indicating the characteristics of the variety used in the study. The size of the beans is a variable defined in the field, where appropriate fertilization practices improve this relationship. Crop nutrition, especially in sulfur and zinc levels, has been strongly correlated with better grain size [40].
Brocade grains are related to the temperature requirements of insects because the higher the temperature is, the shorter the life cycle of the insect; therefore, there are a greater number of generations [43]. However, the values for the two climatic zones did not exceed the thresholds of economic damage or the standards for quality [44,45]. Additionally, a large part of the brocaded fruits and grains was removed in the classification processes carried out during the postharvest process.
Regarding sensory qualities, Table 4 shows the values of the main attributes and the total score. For the two climatic zones, 77.8% of the samples were classified as specialty coffee. Uniformity, sweetness, and clean cup received scores of 10 points, consistent with the attributes of Colombian coffee. Although there were samples of coffee with defects, there were no significant differences between the climatic zones (p = 0.2014, chi-square test). In the samples that were not classified as clean cups, the earthy defect was the most predominant (69%), especially in climatic zone 2; however, there were no significant differences between the climatic zones (p = 0.2014, chi-square test). The median, average, and maximum values for the total score and the attributes were higher for zone 1 coffee.
Table 4.
Descriptive statistics of the sensory qualities (SCA points) of coffee obtained under two climate conditions during solar drying.
The main variations in the sensory quality of coffee are related to the processing method, i.e., dry, semidry, or wet [28,46,47]. Coffee produced via the wet method is characterized by having greater acidity and aroma than coffee produced via the dry and semidry methods [28]. Differences have been observed in the chemical composition of coffee obtained via different drying methods; however, evaluations of different geographical locations in the same region [37] and drying methods [48] have indicated that there are no differences in the overall organoleptic quality. The main differences in drying have been observed with respect to the drying method, i.e., solar or mechanical. The quality of coffee obtained with a solar tunnel, in the open air, and with forced air was different only for the latter, with a taste rating lower than that for solar drying [3]. Therefore, solar drying under plastic covers, with short or long drying times, does not generate differences in overall quality or in the individual attributes of overall quality.
3.4. Physicochemical Analysis
The results of the basic physicochemical tests carried out on the coffee samples corroborated the physical and sensory quality information. For color, water activity, pH, acidity, ash, and total fat content, there were no significant differences between the evaluated drying conditions (Table 5), despite the differences in drying time. Additionally, the values obtained were within the reference ranges for each variable, being similar to those reported in other studies.
Table 5.
Descriptive statistics for the physicochemical variables of coffee obtained under two climate conditions during solar drying.
Solar drying causes the photodegradation of compounds, which leads to a change in color, which is further affected by long drying times. However, different ways of performing solar drying under plastic covers did not affect color. Species and processing method are factors that define the color of coffee beans, with Arabica coffee beans being greener than Robusta beans [40]. Additionally, beans obtained via the wet method are greener than those obtained via the dry and semidry methods [28,49].
Regarding water activity, the values obtained were related to the moisture content of the coffee and within the reference values for coffee processed with the wet method [28]. Different drying methods and temperatures did not affect water activity, with values close to 0.59 [48]. In addition, values below 0.62 are related to the best conditions for maintaining texture and color properties during storage [50].
Solar drying did not affect the total fat content. The variation reported has been associated with environmental factors or genotype, and high fat content is associated with better cup quality [51]. The total fat content showed low variability and was within the reference values reported for healthy Arabica coffee beans [40,52].
Although there are multiple factors that can affect the fat content in seeds, the drying method used does not represent a relevant condition for this parameter, being more associated with the variety of coffee. In this case, the drying conditions did not present statistically significant differences of the beans during drying, indicating that the temperature ranges reached are not strong enough to generate the degradation of the beans.
4. Conclusions
The solar drying process of coffee was conducted under two climatic conditions; there were differences in the drying time without affecting the physicochemical characteristics and physical and sensory quality.
The recording of information on the temperature and relative humidity of the air during drying allowed for the identification of differences in the evolution of the solar drying process under two climatic conditions with different levels of solar brightness. The results can be used to provide recommendations for the management of coffee in dryers and improve the efficiency of processing in each climatic zone to avoid beans with moisture problems or defects due to an excess or deficiency of drying. The automatization of the drying process variables constitutes an important factor for standardizing washed coffee production and its quality.
The continuous recording of bean mass inside the dryer was used to establish drying rates between 1.29 and 9.01% w.b/day, which varied depending on the climate of each climatic zone. Similarly, the percentage of rewetting was directly related to the coffee moisture, with the highest rates occurring in the final drying stages. This behavior was observed when the relative humidity of the air was saturated. As is well known, there are many factors that affect the physicochemical characteristics of dry parchment coffee. However, in the Department of Quindío (Colombia), the solar brightness levels in different zones of the department did not present important changes in the aw, fat, and ash content, representing a great homogeneity in the postharvest process and generating quality coffee with grades above 80 points in the SCA protocol. The differences in the solar drying time, generally between 253.3 h and 371 h, under the two climatic conditions did not influence the resulting coffee’s physical and sensory quality or physicochemical characteristics.
In the two climatic zones, classified by level of solar brightness, the solar drying of coffee was possible following the minimum recommendations for this process. In producing good-quality coffee, starting with ripe fruits and applying recommendations for good postharvest processing is crucial. Therefore, the solar drying of coffee contributes to the maintenance of quality characteristics intrinsically provided by the variety and species, the climatic conditions during fruit growth, and good agronomy practices.
Author Contributions
Conceptualization, A.E.P.-M.; methodology, A.E.P.-M., A.G. and L.M.A.-L.; investigation, A.E.P.-M. and I.P.H.-G.; formal analysis, I.P.H.-G., H.B.-R. and J.M.-G.; data curation, A.E.P.-M., I.P.H.-G. and L.M.A.-L.; writing—original draft preparation, A.E.P.-M.; writing—review and editing, I.P.H.-G., A.G. and L.M.A.-L., supervision, A.E.P.-M. and L.M.A.-L.; project administration, A.E.P.-M. All authors have read and agreed to the published version of the manuscript.
Funding
This research was developed under the project: Experimental Development for the Competitiveness of the Coffee Sector of the Department of Quindío”, code 2017000100099, financed by the General System of Royalties, Gobernación de Quindío, in agreements signed with the National Colombian Coffee Growers Federation (Cenicafé—Crossref Funder ID 100019597). No. 002-of-2020.
Data Availability Statement
Not applicable.
Acknowledgments
The authors are grateful to the Department of Quindío Committee of the Colombian Coffee Growers Federation (FNC) and National Coffee Research Center—Cenicafé, to the farmers that supported and allowed samples collection in coffee wet processing, to the Agroclimatology Discipline of Cenicafé, to Carlos Tibaduiza and Alejandro Rios for the support in the development of drying system, and to Juan Manuel Rendón for their support in sample collection and fieldwork.
Conflicts of Interest
The authors declare no conflict of interest.
References
- Duque-Dussán, E.; Sanz-Uribe, J.; Banout, J. Design and Evaluation of a Hybrid Solar Dryer for Postharvest Processing of Parchment Coffee. Renew. Energy 2023, 215, 118961. [Google Scholar] [CrossRef]
- Parra, C.A.; Roa, M.G.; Oliveros, T.C.E.; Sanz, U.J.R. Optimización Operacional de Secadores Mecánicos Para Café Pergamino; Cenicafé: Manizales, Colombia, 2017; pp. 12–13. Available online: https://www.cenicafe.org/es/index.php/nuestras_publicaciones/libros/publicaciones_optimizacion_operacional_de_secadores_mecanicos_para_cafe (accessed on 28 June 2023).
- Dong, W.; Hu, R.; Long, Y.; Li, H.; Zhang, Y.; Zhu, K.; Chu, Z. Comparative Evaluation of the Volatile Profiles and Taste Properties of Roasted Coffee Beans as Affected by Drying Method and Detected by Electronic Nose, Electronic Tongue, and HS-SPME-GC-MS. Food Chem. 2019, 272, 723–731. [Google Scholar] [CrossRef]
- Firdissa, E.; Mohammed, A.; Berecha, G.; Garedew, W. Coffee Drying and Processing Method Influence Quality of Arabica Coffee Varieties (Coffee Arabica L.) at Gomma I and Limmu Kossa, Southwest Ethiopia. J. Food Qual. 2022, 2022, 9184374. [Google Scholar] [CrossRef]
- Bani Hani, E.H.; Alhuyi Nazari, M.; Assad, M.E.H.; Forootan Fard, H.; Maleki, A. Solar Dryers as a Promising Drying Technology: A Comprehensive Review. J. Therm. Anal. Calorim. 2022, 147, 12285–12300. [Google Scholar] [CrossRef]
- Shapiro-Garza, E.; King, D.; Rivera-Aguirre, A.; Wang, S.; Finley-Lezcano, J.A. Participatory Framework for Feasibility Assessments of Climate Change Resilience Strategies for Smallholders: Lessons from Coffee Cooperatives in Latin America. Int. J. Agric. Sustain. 2019, 18, 21–34. [Google Scholar] [CrossRef]
- Ortiz-Rodríguez, N.M.; Condorí, M.; Durán, G.; García-Valladares, O. Solar Drying Technologies: A Review and Future Research Directions with a Focus on Agroindustrial Applications in Medium and Large Scale. Appl. Therm. Eng. 2022, 215, 118993. [Google Scholar] [CrossRef]
- Kamarulzaman, A.; Hasanuzzaman, M.; Rahim, N.A. Global Advancement of Solar Drying Technologies and Its Future Prospects: A Review. Sol. Energy 2021, 221, 559–582. [Google Scholar] [CrossRef]
- Tawfik, M.A.; Oweda, K.M.; Abd El-Wahab, M.K.; Abd Allah, W.E. A New Mode of a Natural Convection Solar Greenhouse Dryer for Domestic Usage: Performance Assessment for Grape Drying. Agriculture 2023, 13, 1046. [Google Scholar] [CrossRef]
- Ramírez-Builes, V.H.; Jaramillo-Robledo, Á.; Arcila-Pulgarín, J. Factores climáticos que intervienen en la producción del café en Colombia. In Federación Nacional de Cafeteros de Colombia, Manual del Cafetero Colombiano: Investigación y Tecnología Para la Sostenibilidad de la Caficultura; Federación Nacional de Cafeteros de Colombia: Manizales, Colombia, 2013; Volume 1, pp. 205–237. [Google Scholar]
- García, L.J.C.; Posada-Suárez, H.; Läderach, P. Recommendations for the Regionalizing of Coffee Cultivation in Colombia: A Methodological Proposal Based on Agro-Climatic Indices. PLoS ONE 2014, 9, e113510. [Google Scholar] [CrossRef]
- Louzada Pereira, L.; Carvalho Guarçoni, R.; Soares Cardoso, W.; Côrrea Taques, R.; Rizzo Moreira, T.; da Silva, S.F.; Schwengber ten Caten, C. Influence of Solar Radiation and Wet Processing on the Final Quality of Arabica Coffee. J. Food Qual. 2018, 2018, 6408571. [Google Scholar] [CrossRef]
- Soares Ferreira, D.; Eduardo da Silva Oliveira, M.; Rodrigues Ribeiro, W.; Altoé Filete, C.; Toledo Castanheira, D.; Cesar Pereira Rocha, B.; Polonini Moreli, A.; Catarina da Silva Oliveira, E.; Carvalho Guarçoni, R.; Partelli, F.L.; et al. Association of Altitude and Solar Radiation to Understand Coffee Quality. Agronomy 2022, 12, 1885. [Google Scholar] [CrossRef]
- Oliveira, P.D.; Borém, F.M.; Isquierdo, E.P.; Giomo, G.d.S.; Lima, R.R.d.; Cardoso, R.A. Aspectos fisiológicos de grãos de café, processados e secados de diferentes métodos, associados à qualidade sensorial. Coffee Sci. 2013, 8, 211–220. Available online: http://www.sbicafe.ufv.br:80/handle/123456789/7972 (accessed on 28 June 2023).
- Taveira, J.H.S.; Borém, F.M.; Rosa, S.D.V.F.D.; Oliveira, P.D.; Giomo, G.d.S.; Isquierdo, E.P.; Fortunato, V.A. Post-Harvest Effects on Beverage Quality and Physiological Performance of Coffee Beans. Afr. J. Agric. Res. 2015, 10, 1457–1466. [Google Scholar] [CrossRef]
- Borém, F.M. Cofffee Drying. In Handbook of Coffee Post-Harvest Technology; Universidade Federal de Lavras: Norcross, Georgia, 2014; pp. 98–118. [Google Scholar]
- Caracterización Agroclimatica—Agroclima. Available online: https://agroclima.cenicafe.org/caracterizacion-agroclimatica (accessed on 9 May 2023).
- Peñuela-Martínez, A.E.; Restrepo-Rivera, M.V.; Tibaduiza, C.A. Secado solar de café usando diferentes tipos de cubiertas plásticas. Rev. Cenicafé 2022, 73, 69–85. [Google Scholar] [CrossRef]
- Oliveros-Tascón, C.E.; Ramírez, C.A.; Tibaduiza-Vianchá, C.A.; Sanz-Uribe, J.R. Construcción de secadores solares tipo túnel con nuevos materiales. Av. Técnicos Cenicafé 2017, 482, 1–8. [Google Scholar] [CrossRef]
- Oliveros Tascón, C.E.; Ramírez, C.A.; Sanz-Uribe, J.R.; Peñuela-Martínez, A.E.; Pabón, J. Secado Solar y Secado Mecánico Del Café. In Manual Del Cafetero Colombiano: Investigación y Tecnología Para la Sostenibilidad de la Caficultura; Federación Nacional de Cafeteros de Colombia: Manizales, Colombia, 2013; Volume 3, pp. 49–80. [Google Scholar] [CrossRef]
- Jurado, C.J.M.; Motoya, R.E.C.; Olivero, T.C.E.; García, A.J. Método Para Medir El Contenido de Humedad Del Café Pergamino En El Secado Solar Del Café. Cenicafé 2009, 60, 135–147. Available online: http://hdl.handle.net/10778/188 (accessed on 28 June 2023).
- Peñuela, A.E.; Sanz-Uribe, J.R. Obtenga café de calidad en el proceso de beneficio. In Guía Más Agronomia, Más Productividad, más Calidad; Cenicafé: Manizales, Colombia, 2021; pp. 189–218. Available online: http://hdl.handle.net/10778/4289 (accessed on 28 June 2023).
- ISO 6673:2003; Green Coffee- Determination of Loss in Mass at 105 °C. International Organization for Standardization, ISO: Geneva, Switzerland, 2003. Available online: https://t1.daumcdn.net/cfile/tistory/233BDA33597FFE9C26?download (accessed on 28 June 2023).
- El Café Arábica Lavado Guía de Defectos Del Café Verde. Available online: https://bootcoffee.com/wp-content/uploads/2019/09/SCA_The-Arabica-Green-Coffee-Defect-Guide_Spanish_updated.pdf (accessed on 5 May 2023).
- ISO 6669:1995; Green and Roasted Coffee—Determination of Free Flow Bulk Density of Whole Beans (Routine Method). International Organization for Standardization, ISO: Geneva, Switzerland, 1995. Available online: https://cdn.standards.iteh.ai/samples/13098/217e86f01f7344d599d06086c8cf9a02/ISO-6669-1995.pdf (accessed on 27 June 2023).
- Coffee Quality Institute. Available online: https://www.coffeeinstitute.org/ (accessed on 15 March 2023).
- SCAA Protocols-Cupping Specialty Coffee. Available online: https://www.scaa.org/PDF/resources/cupping-protocols.pdf (accessed on 5 May 2023).
- Cortés-Macías, E.T.; López, C.F.; Gentile, P.; Girón-Hernández, J.; López, A.F. Impact of Post-Harvest Treatments on Physicochemical and Sensory Characteristics of Coffee Beans in Huila, Colombia. Postharvest Biol. Technol. 2022, 187, 111852. [Google Scholar] [CrossRef]
- Clark, V.; SAS Institute (Eds.) SAS/STAT 9.1: User’s Guide; SAS Pub: Cary, NC, USA, 2004; Available online: https://support.sas.com/documentation/onlinedoc/91pdf/sasdoc_91/stat_ug_7313.pdf (accessed on 28 June 2023).
- Pramono, E.K.; Karim, M.A.; Fudholi, A.; Bulan, R.; Lapcharoensuk, R.; Sitorus, A. Low cost telemonitoring technology of semispherical solar dryer for drying arabica coffee beans. INMATEH Agric. Eng. 2022, 66, 340–350. [Google Scholar] [CrossRef]
- Osorio, H.R.; Guerra, G.L.M.; Tinôco, I.F.F.; Martins, J.H.; Souza, C.d.F.; Osorio, S.J.A. Simulation of the Internal Environment of a Post-Harvest Installation and a Solar Dryer of Coffee. Rev. Bras. Eng. Agríc. E Ambient. 2016, 20, 163–168. [Google Scholar] [CrossRef]
- Dávila-Guamuro, J.; Llanos-Pérez, J.; Cabanillas-Pardo, L. Secador solar tipo túnel con microclima auto controlado para Café (Coffea arabica) Honey de alto valor en taza. Rev. Agrotecnológica Amaz. 2022, 2, e227. [Google Scholar] [CrossRef]
- Bravo, W.A.; Montenegro, D.A.B.; Pito, J.C. Prototipo para el control de temperatura y humedad en el secado mecánico del café. Rev. Científica Ing. Desarro. 2022, 40, 28–46. [Google Scholar] [CrossRef]
- Giraldo, d.L.; Javier, O. Diseño E Implementación de Un Secador Híbrido Para El Control Y Monitoreo Del Proceso de Secado Del Grano de Café. Bachelor’s Thesis; Ingeniería Electronica, Universidad Tecnológica de Pereira: Pereira, Colombia, 2018. Available online: https://hdl.handle.net/11059/9290 (accessed on 28 June 2023).
- Murali, S.; Alfiya, P.V.; Aniesrani Delfiya, D.S.; Harikrishnan, S.; Kunjulakshmi, S.; Samuel, M.P. Performance Evaluation of PV Powered Solar Tunnel Dryer Integrated with a Mobile Alert System for Shrimp Drying. Sol. Energy 2022, 240, 246–257. [Google Scholar] [CrossRef]
- Vengsungnle, P.; Jongpluempiti, J.; Srichat, A.; Wiriyasart, S.; Naphon, P. Thermal Performance of the Photovoltaic–Ventilated Mixed Mode Greenhouse Solar Dryer with Automatic Closed Loop Control for Ganoderma Drying. Case Stud. Therm. Eng. 2020, 21, 100659. [Google Scholar] [CrossRef]
- Tassew, A.A.; Yadessa, G.B.; Bote, A.D.; Obso, T.K. Influence of Location, Elevation Gradients, Processing Methods, and Soil Quality on the Physical and Cup Quality of Coffee in the Kafa Biosphere Reserve of SW Ethiopia. Heliyon 2021, 7, e07790. [Google Scholar] [CrossRef] [PubMed]
- Borém, F.M.; Isquierdo, E.P.; Alves, G.E.; Egídio, R.D.; Cambuy, S.V.; da Silva Taveira, J.H. Quality of Natural Coffee Dried Under Different Temperatures and Drying Rates. Coffee Sci. 2018, 13, 159–167. [Google Scholar] [CrossRef]
- Alves, G.E.; Borém, F.M.; Isquierdo, E.P.; Siqueira, V.C.; Cirillo, M.Â.; Pinto, A.C.F. Physiological and sensorial quality of Arabica coffee subjected to different temperatures and drying air-flows. Acta Scientiarum. Agron. 2017, 39, 225–233. [Google Scholar] [CrossRef][Green Version]
- Ramalakshmi, K.; Kubra, I.R.; Rao, L.J.M. Physicochemical Characteristics of Green Coffee: Comparison of Graded and Defective Beans. J. Food Sci. 2007, 72, S333–S337. [Google Scholar] [CrossRef]
- Peñuela-Martínez, A.E.; Moreno-Riascos, S.; Medina-Rivera, R. Influence of Temperature-Controlled Fermentation on the Quality of Mild Coffee (Coffea Arabica L.) Cultivated at Different Elevations. Agriculture 2023, 13, 1132. [Google Scholar] [CrossRef]
- Duque-Dussán, E.; Sanz-Uribe, J.R.; Dussán-Lubert, C.; Banout, J. Thermophysical Properties of Parchment Coffee: New Colombian Varieties. J. Food Process Eng. 2023, 46, e14300. [Google Scholar] [CrossRef]
- Giraldo-Jaramillo, M.; Garcia, A.G.; Parra, J.R. Biology, Thermal Requirements, and Estimation of the Number of Generations of Hypothenemus Hampei (Ferrari, 1867) (Coleoptera: Curculionidae) in the State of São Paulo, Brazil. J. Econ. Entomol. 2018, 111, 2192–2200. [Google Scholar] [CrossRef]
- Duque-Orrego, H.; Salazar, H.M.; Rojas-Sepúlveda, L.A.; Gaitán, Á. Análisis Económico de Tecnologías Para La Producción de Café En Colombia; Cenicafé: Manizales, Colombia, 2021; pp. 67–73. [Google Scholar]
- Bustillo Pardey, A.E. Una revisión sobre la broca del café, Hypothenemus hampei (Coleoptera: Curculionidae: Scolytinae), en Colombia. Rev. Colomb. Entomol. 2006, 32, 101–116. Available online: http://www.scielo.org.co/scielo.php?script=sci_arttext&pid=S0120-04882006000200001 (accessed on 28 June 2023). [CrossRef]
- Scholz, M.B.; Prudencio, S.; Kitzberger, C.; Silva, R. Physico-Chemical Characteristics and Sensory Attributes of Coffee Beans Submitted to Two Post-Harvest Processes. J. Food Meas. Charact. 2019, 13, 831–839. [Google Scholar] [CrossRef]
- Arenas, A.F.; Hincapie, A.M.V.; Ocampo, G.T. Effects of Post-Harvest Process on Volatile—Sensory Profile for Coffee in Colombia. Coffee Sci. 2022, 17, e172016. [Google Scholar] [CrossRef]
- Kulapichitr, F.; Borompichaichartkul, C.; Suppavorasatit, I.; Cadwallader, K.R. Impact of Drying Process on Chemical Composition and Key Aroma Components of Arabica Coffee. Food Chem. 2019, 291, 49–58. [Google Scholar] [CrossRef]
- Kulapichitr, F.; Borompichaichartkul, C.; Fang, M.; Suppavorasatit, I.; Cadwallader, K.R. Effect of Post-Harvest Drying Process on Chlorogenic Acids, Antioxidant Activities and CIE-Lab Color of Thai Arabica Green Coffee Beans. Food Chem. 2022, 366, 130504. [Google Scholar] [CrossRef] [PubMed]
- Estrada-Bahena, E.B.; Salazar, R.; Ramírez, M.; Moreno-Godínez, M.E.; Jiménez-Hernández, J.; Romero-Ramírez, Y.; González-Cortázar, M.; Alvarez-Fitz, P. Influence of Water Activity on Physical Properties, Fungal Growth, and Ochratoxin A Production in Dry Cherries and Green-Coffee Beans. J. Food Process. Preserv. 2022, 46, e16226. [Google Scholar] [CrossRef]
- Barbosa, M.d.S.G.; Scholz, M.B.d.S.; Kitzberger, C.S.G.; de Toledo Benassi, M. Correlation between the Composition of Green Arabica Coffee Beans and the Sensory Quality of Coffee Brews. Food Chem. 2019, 292, 275–280. [Google Scholar] [CrossRef]
- Caporaso, N.; Whitworth, M.B.; Grebby, S.; Fisk, I.D. Rapid Prediction of Single Green Coffee Bean Moisture and Lipid Content by Hyperspectral Imaging. J. Food Eng. 2018, 227, 18–29. [Google Scholar] [CrossRef]


Disclaimer/Publisher’s Note: The statements, opinions and data contained in all publications are solely those of the individual author(s) and contributor(s) and not of MDPI and/or the editor(s). MDPI and/or the editor(s) disclaim responsibility for any injury to people or property resulting from any ideas, methods, instructions or products referred to in the content. |
© 2023 by the authors. Licensee MDPI, Basel, Switzerland. This article is an open access article distributed under the terms and conditions of the Creative Commons Attribution (CC BY) license (https://creativecommons.org/licenses/by/4.0/).