


Unlocking Insights: A Cloud Tool for Data Visualisation in a Smart Meter Project


Abstract
:1. Introduction
- Relationship between cloud tools and data visualisation
2. Method
- Type of research
- Research design: Pre-Experimental
- Administering a pretest to measure the data visualisation process (dependent variable-process they perform manually).
- Applying the experimental treatment, which is the Quicksight cloud tool, to the subjects.
- Administering a post-test to re-measure the data visualisation process.
- Data analysis and processing stage
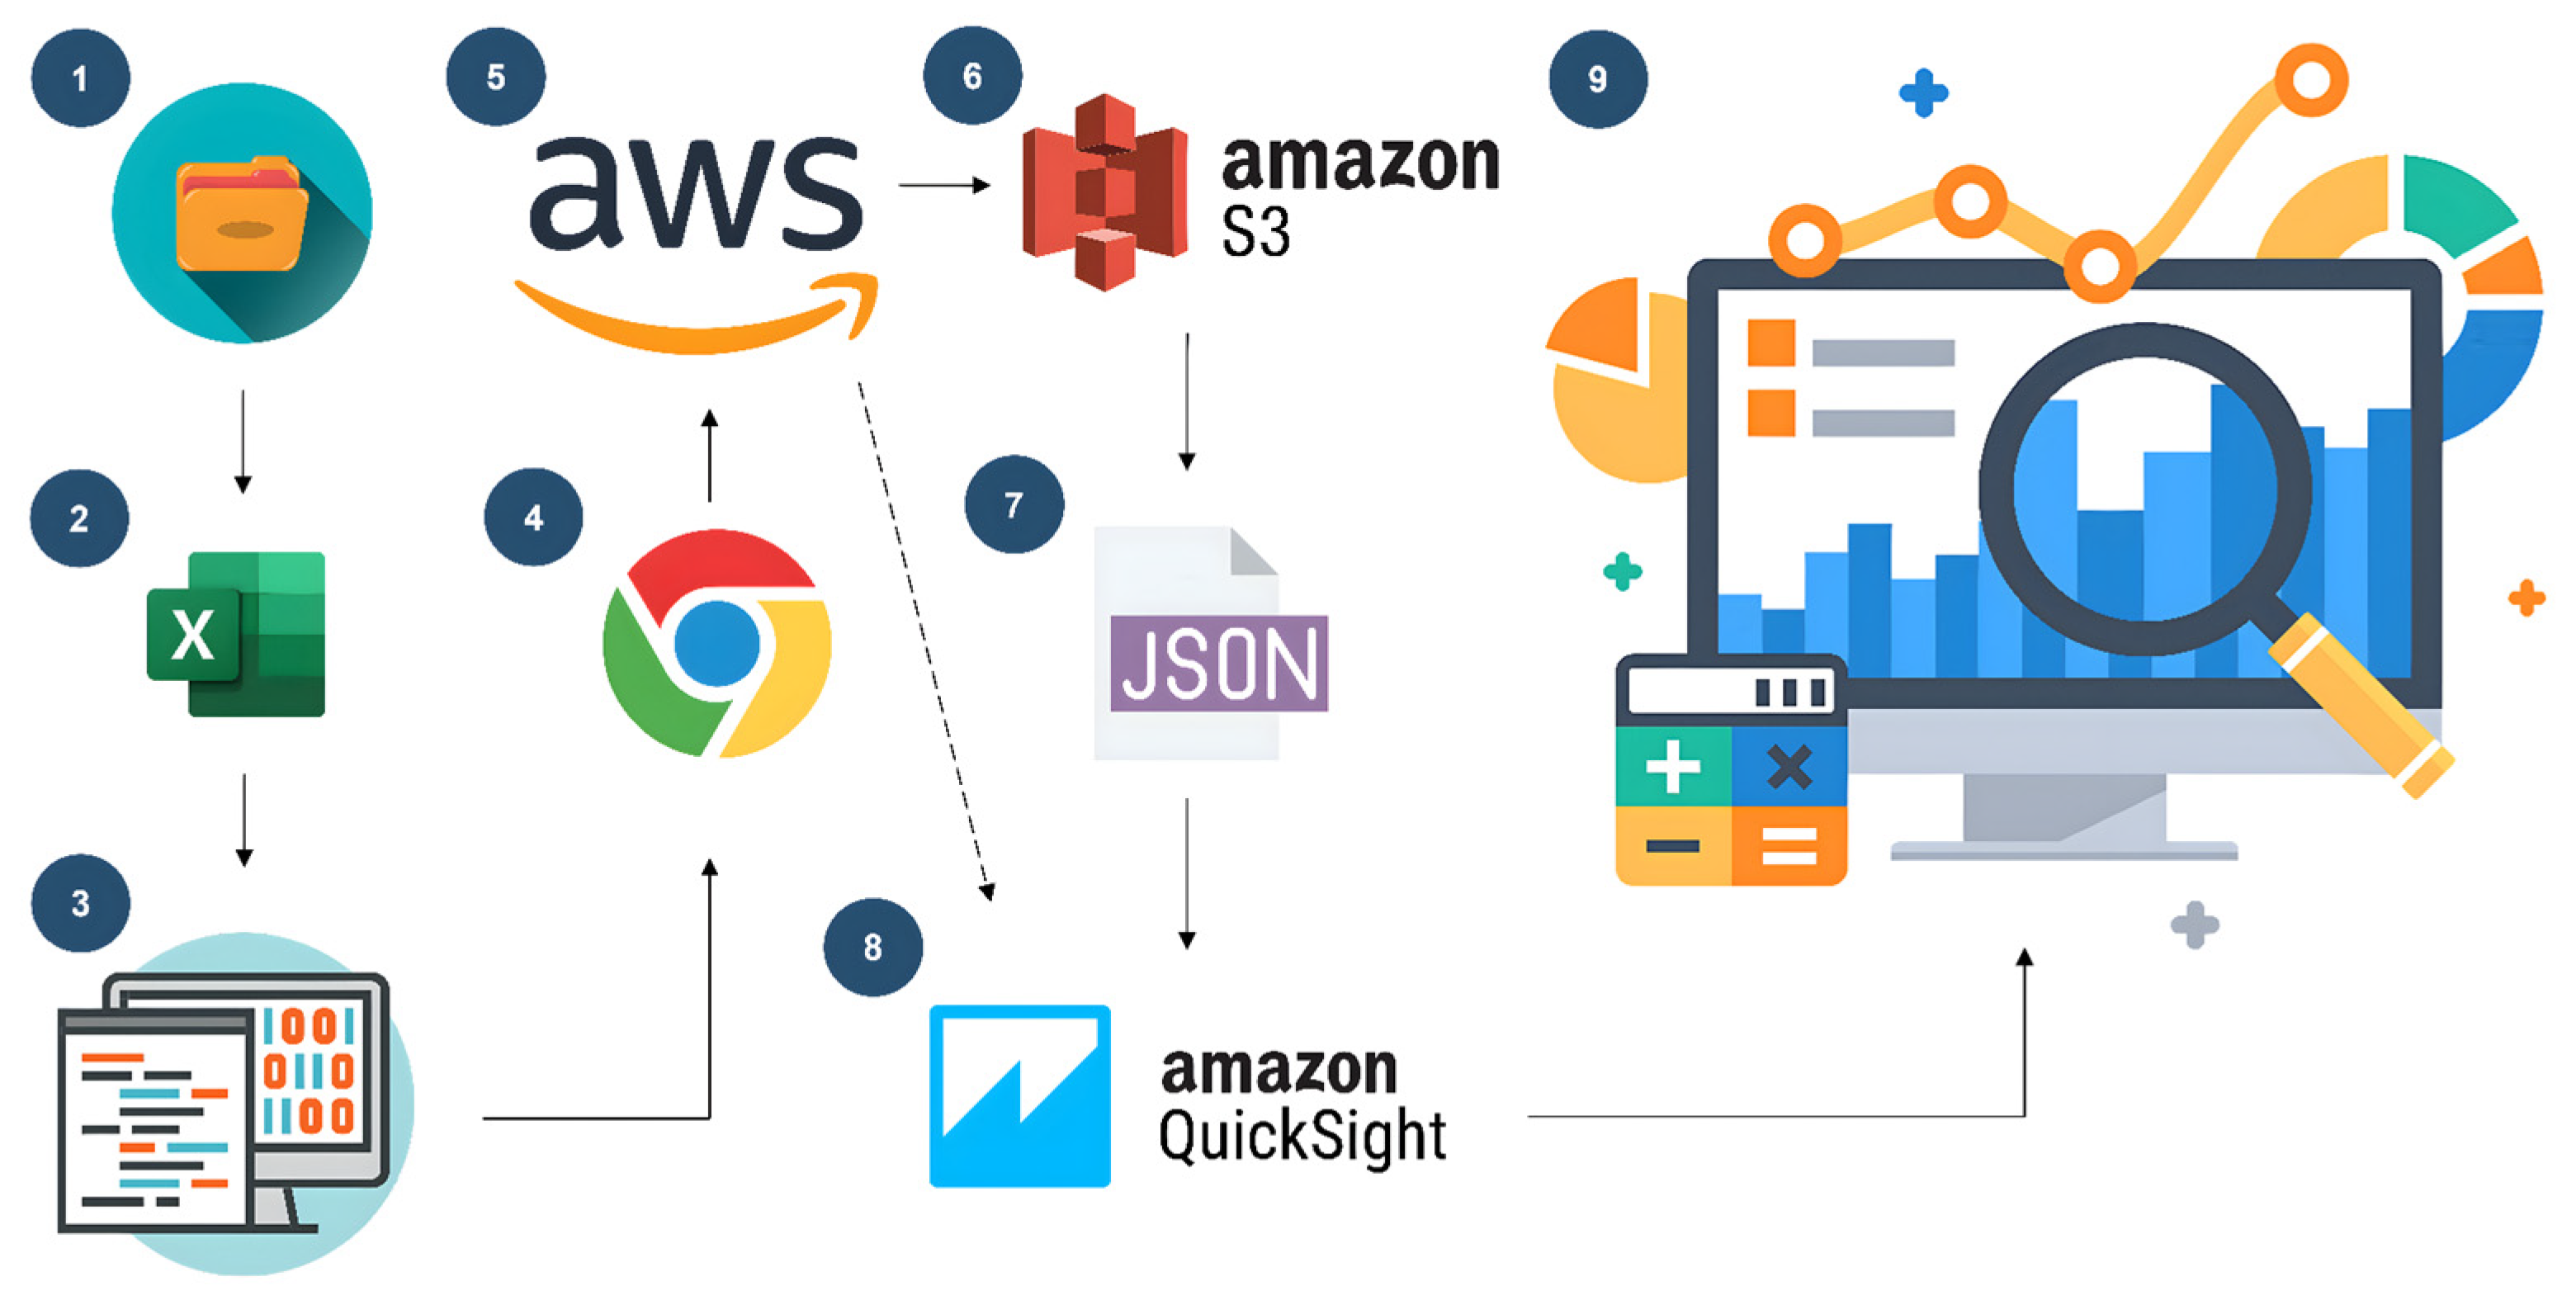
- The first step is to obtain the data in CSV format generated from the smart cities simulation project. These data contain relevant information about the behaviour of the smart meters in the simulation, showing the performance of the 4G LTE network in the smart meters, which are: name, type, module, attrname, attrvalue, value, vectime and vecvalue, which are related to the communication between meters, sending and receiving packets, packet loss, response time, meter and meter group identifier, data type and values.
- Once the data are obtained, we import it into an Excel spreadsheet to start with the data processing.
- It is necessary to have them in orderly cells to be able to manipulate them optimally, with cleanliness and accuracy to facilitate the reading in the cloud, so they are imported into an Excel spreadsheet to perform the aforementioned treatment and then saved in CSV format.
- The Amazon Web Services (AWS) page is then accessed via the Chrome browser.
- Log in with the AWS account previously created. This allows you to use the cloud services.
- AWS cloud computing offers a simple and well-documented http-based interface for computing and storage services [27]. We look for the S3 service to upload the data in CSV format and host it in a secure repository called a bucket.
- To establish the connection between S3 and Quicksight services, a manifest file is set up in a notepad and then saved with the JSON extension. JSON manifest files are used to specify the Amazon S3 files to be imported into Amazon QuickSight. Configure the S3 bucket URIs, prefixes and global settings for the file to import.
- Next, access the main AWS dashboard to search for and select the Quicksight service. This tool, integrated into the AWS platform, offers advanced data analysis and visualisation functionalities in an intuitive and easy-to-use environment.
- Finally, a new analysis is initiated in Quicksight using the data hosted in the S3 service, and the previously configured manifest file is used. This stage marks the beginning of the data analysis and visualisation process, where patterns, trends and relationships are explored for valuable information that can support informed decision-making.
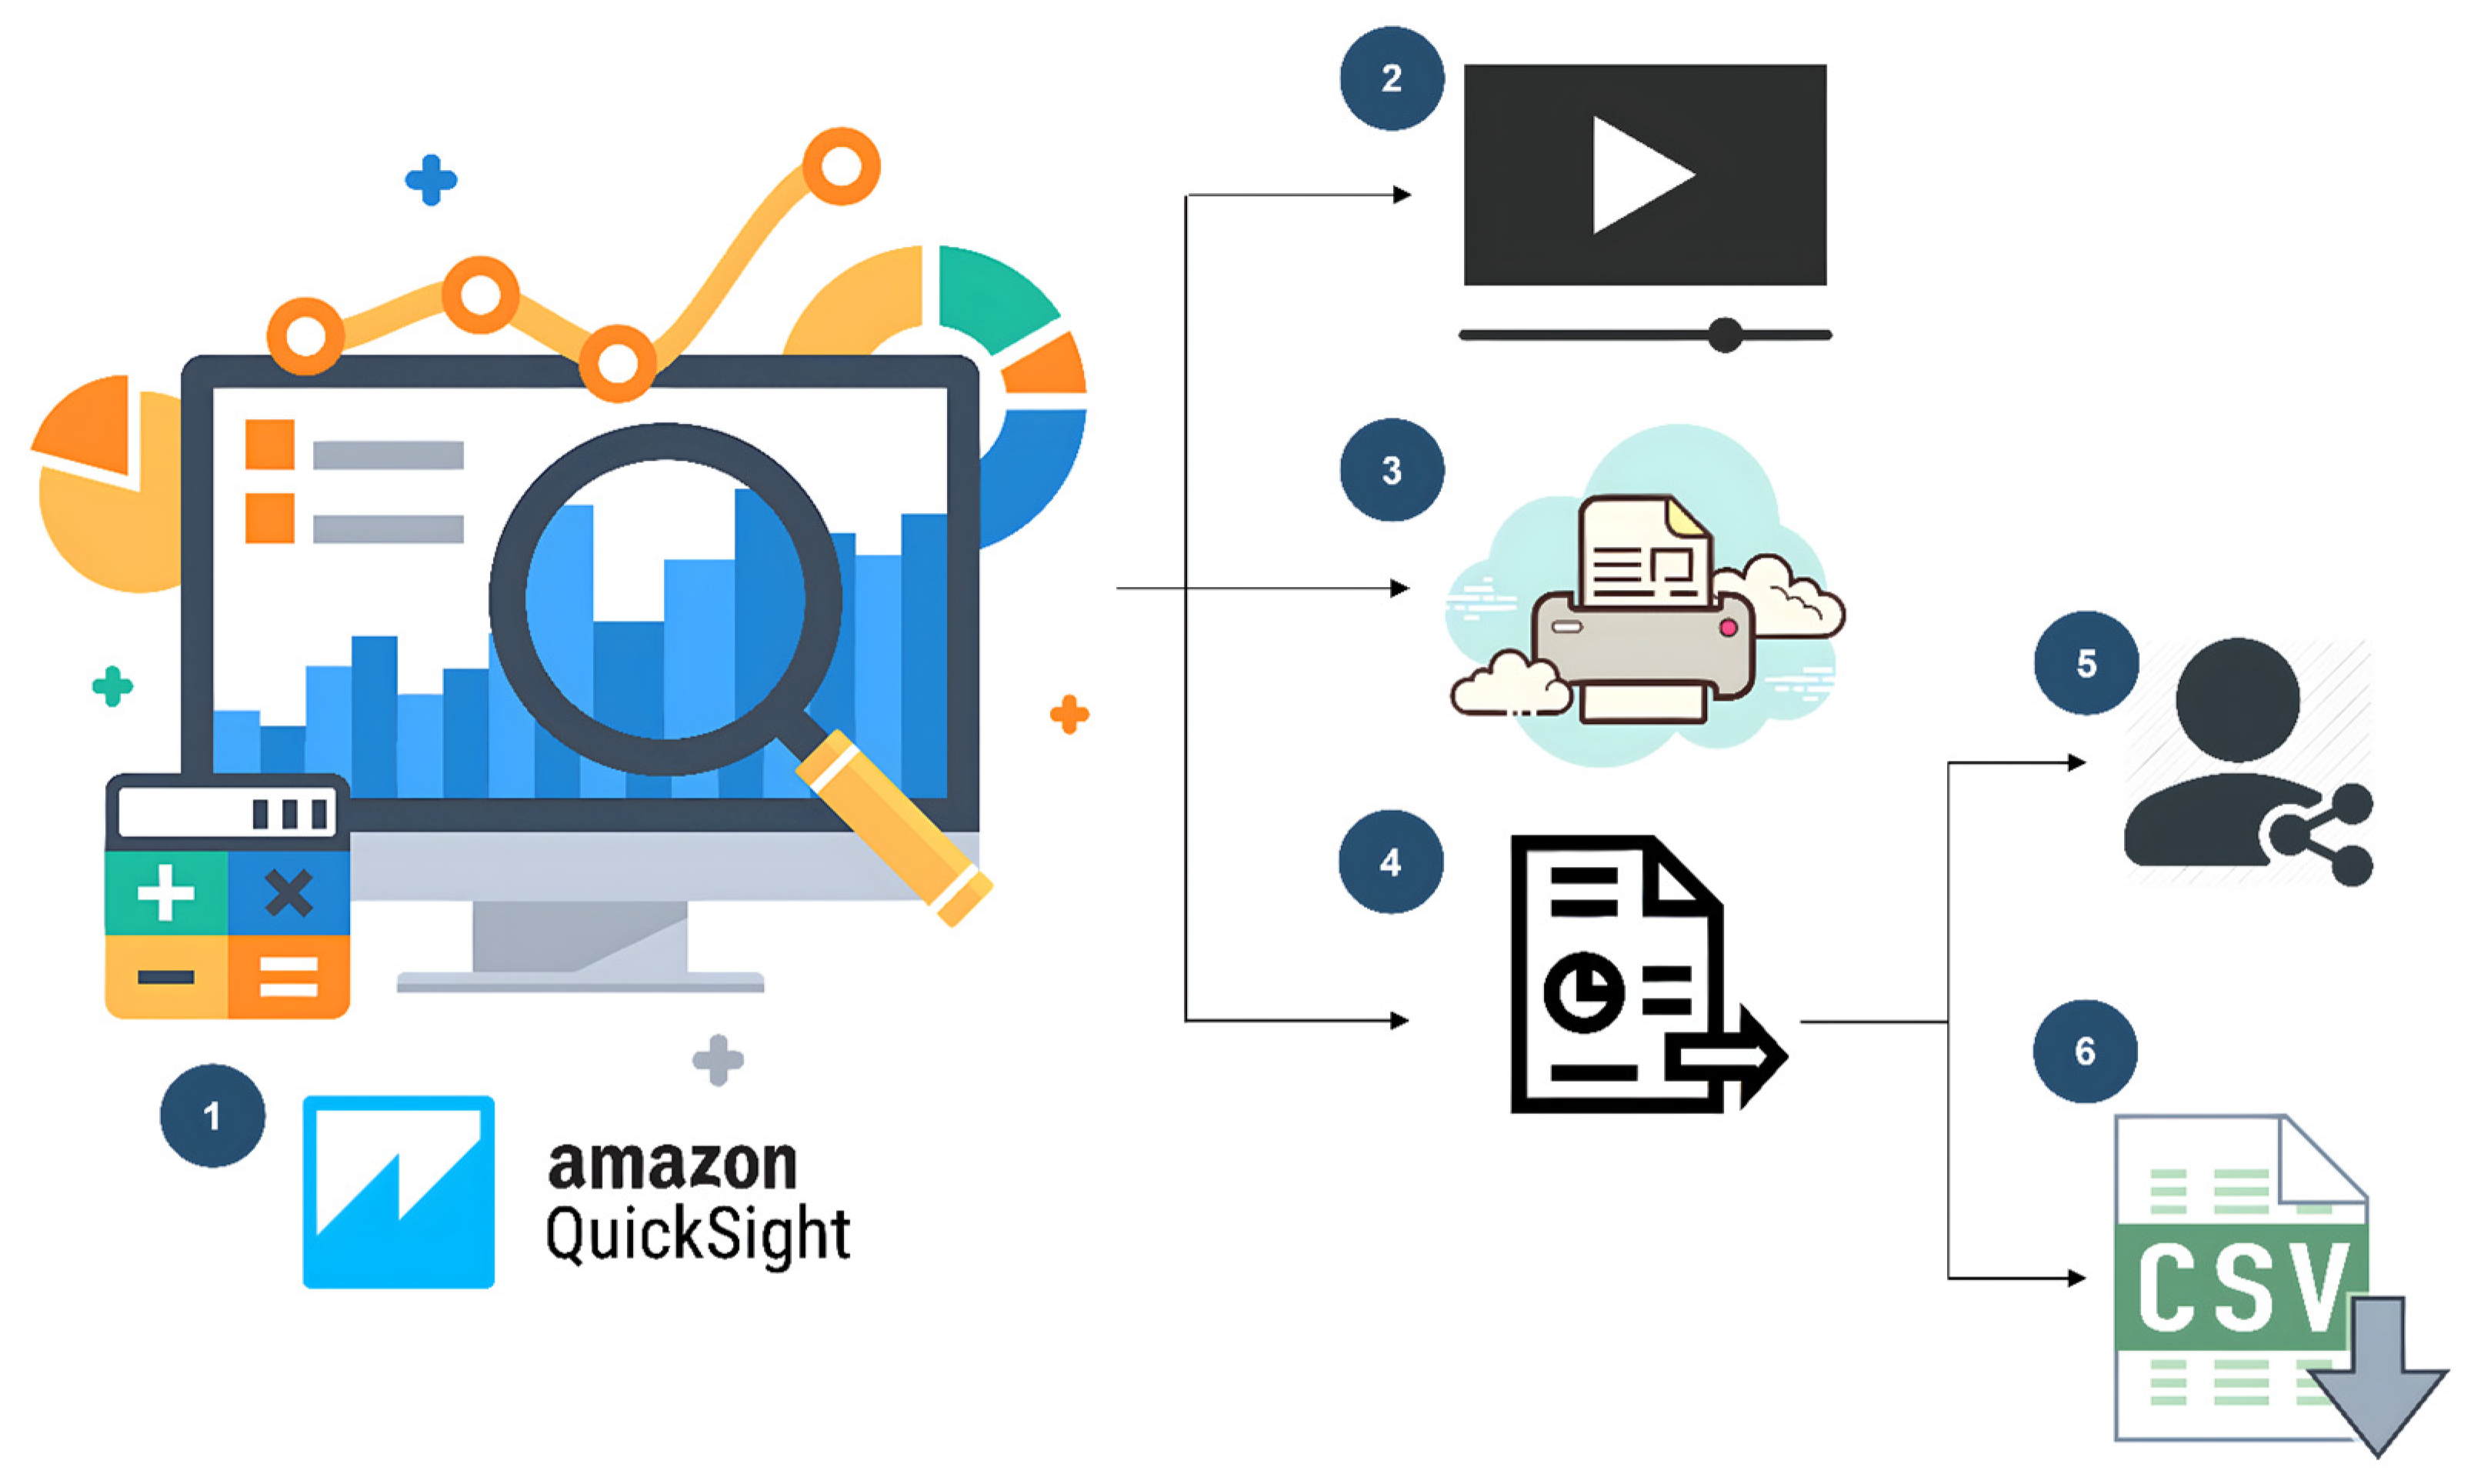
- Visualisation Stage and its forms of sharing
- Once the analysis of the imported data has been performed, it is then represented in a graphical form using a variety of graph types available in Quicksight. The behaviour of the LTE network on the meters should be visualised and analysed, observing if there is good performance of the meters on the network. These graphs are carefully selected to clearly and accurately communicate relevant and necessary information for decision-making. The aim is to achieve a dashboard that is composed of individual visualisations that are coherent and thematically related to each other. They are widely used in organisations for the analysis of sets of variables and decision-making. For example, analysis of data graphs can reveal where the highest price of a house is located in a city, while analysis of a patient’s medical history can facilitate early detection of a disease, allowing timely decisions to be made at an early stage [28].
- Once the analysis is complete, it is possible to capture the results or transfer them to a multimedia format provided by Quicksight. These results can be exported to the History section, where they are stored as “Scene 1” by default. This facilitates presentations on the analysis performed, allowing effective sharing of the findings.
- In addition, this tool offers the option to print the graphs directly from the cloud. It is possible to configure the type of sheet and orientation according to specific needs. This option allows physical copies of the visualisations to be obtained for later reference or distribution.
- Another way to share the results is through the publication of a dashboard. This is achieved by selecting the “Share” option and then “Publish panel”. A name is assigned to the new dashboard, and the actions and visual options are configured in the advanced settings. Clicking on “Publish” creates the dashboard and enables sharing.
- Once the dashboard is created, a window is displayed that allows you to share it with other users of the tool. However, it is important to note that these dashboards can only be shared with other AWS users for security reasons. The root user has the control to manage access to the dashboard, delegate permissions and perform other necessary actions.
- Finally, it is possible to download the analysis in CSV format. At the top right of the graph, there is an options bar that includes the export to CSV function. This option allows you to obtain a copy of the analysed data in a widely used format that is compatible with other tools and systems.
3. Results
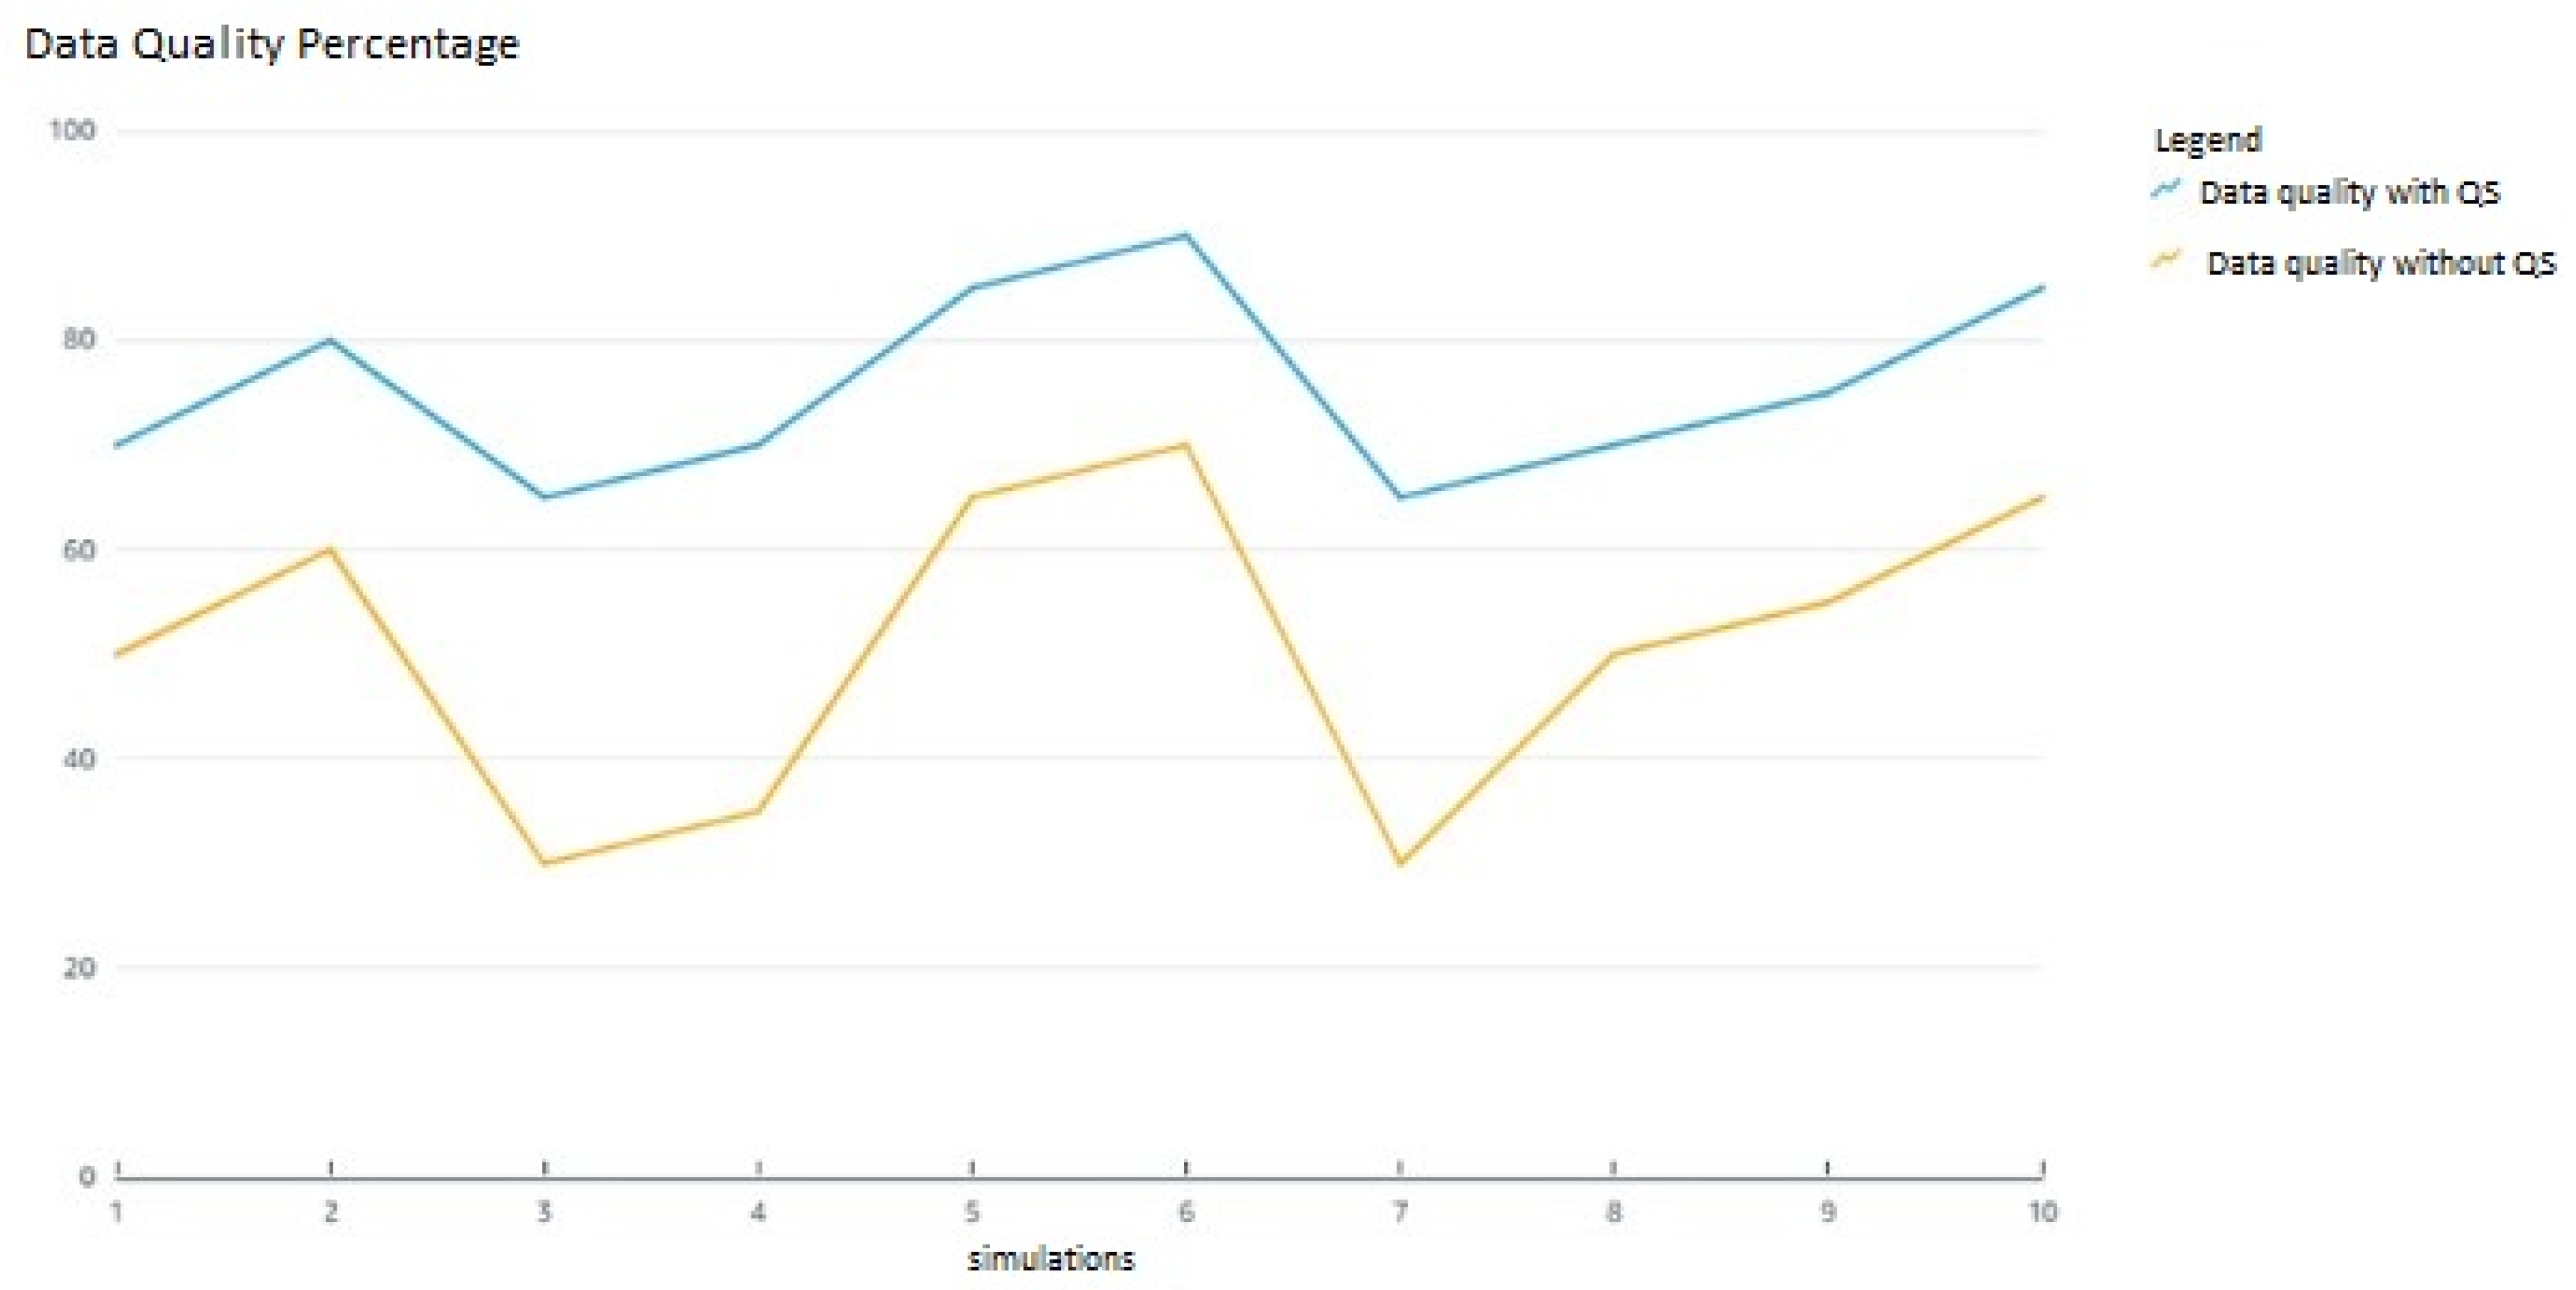
3.1. Percentage of Data Quality
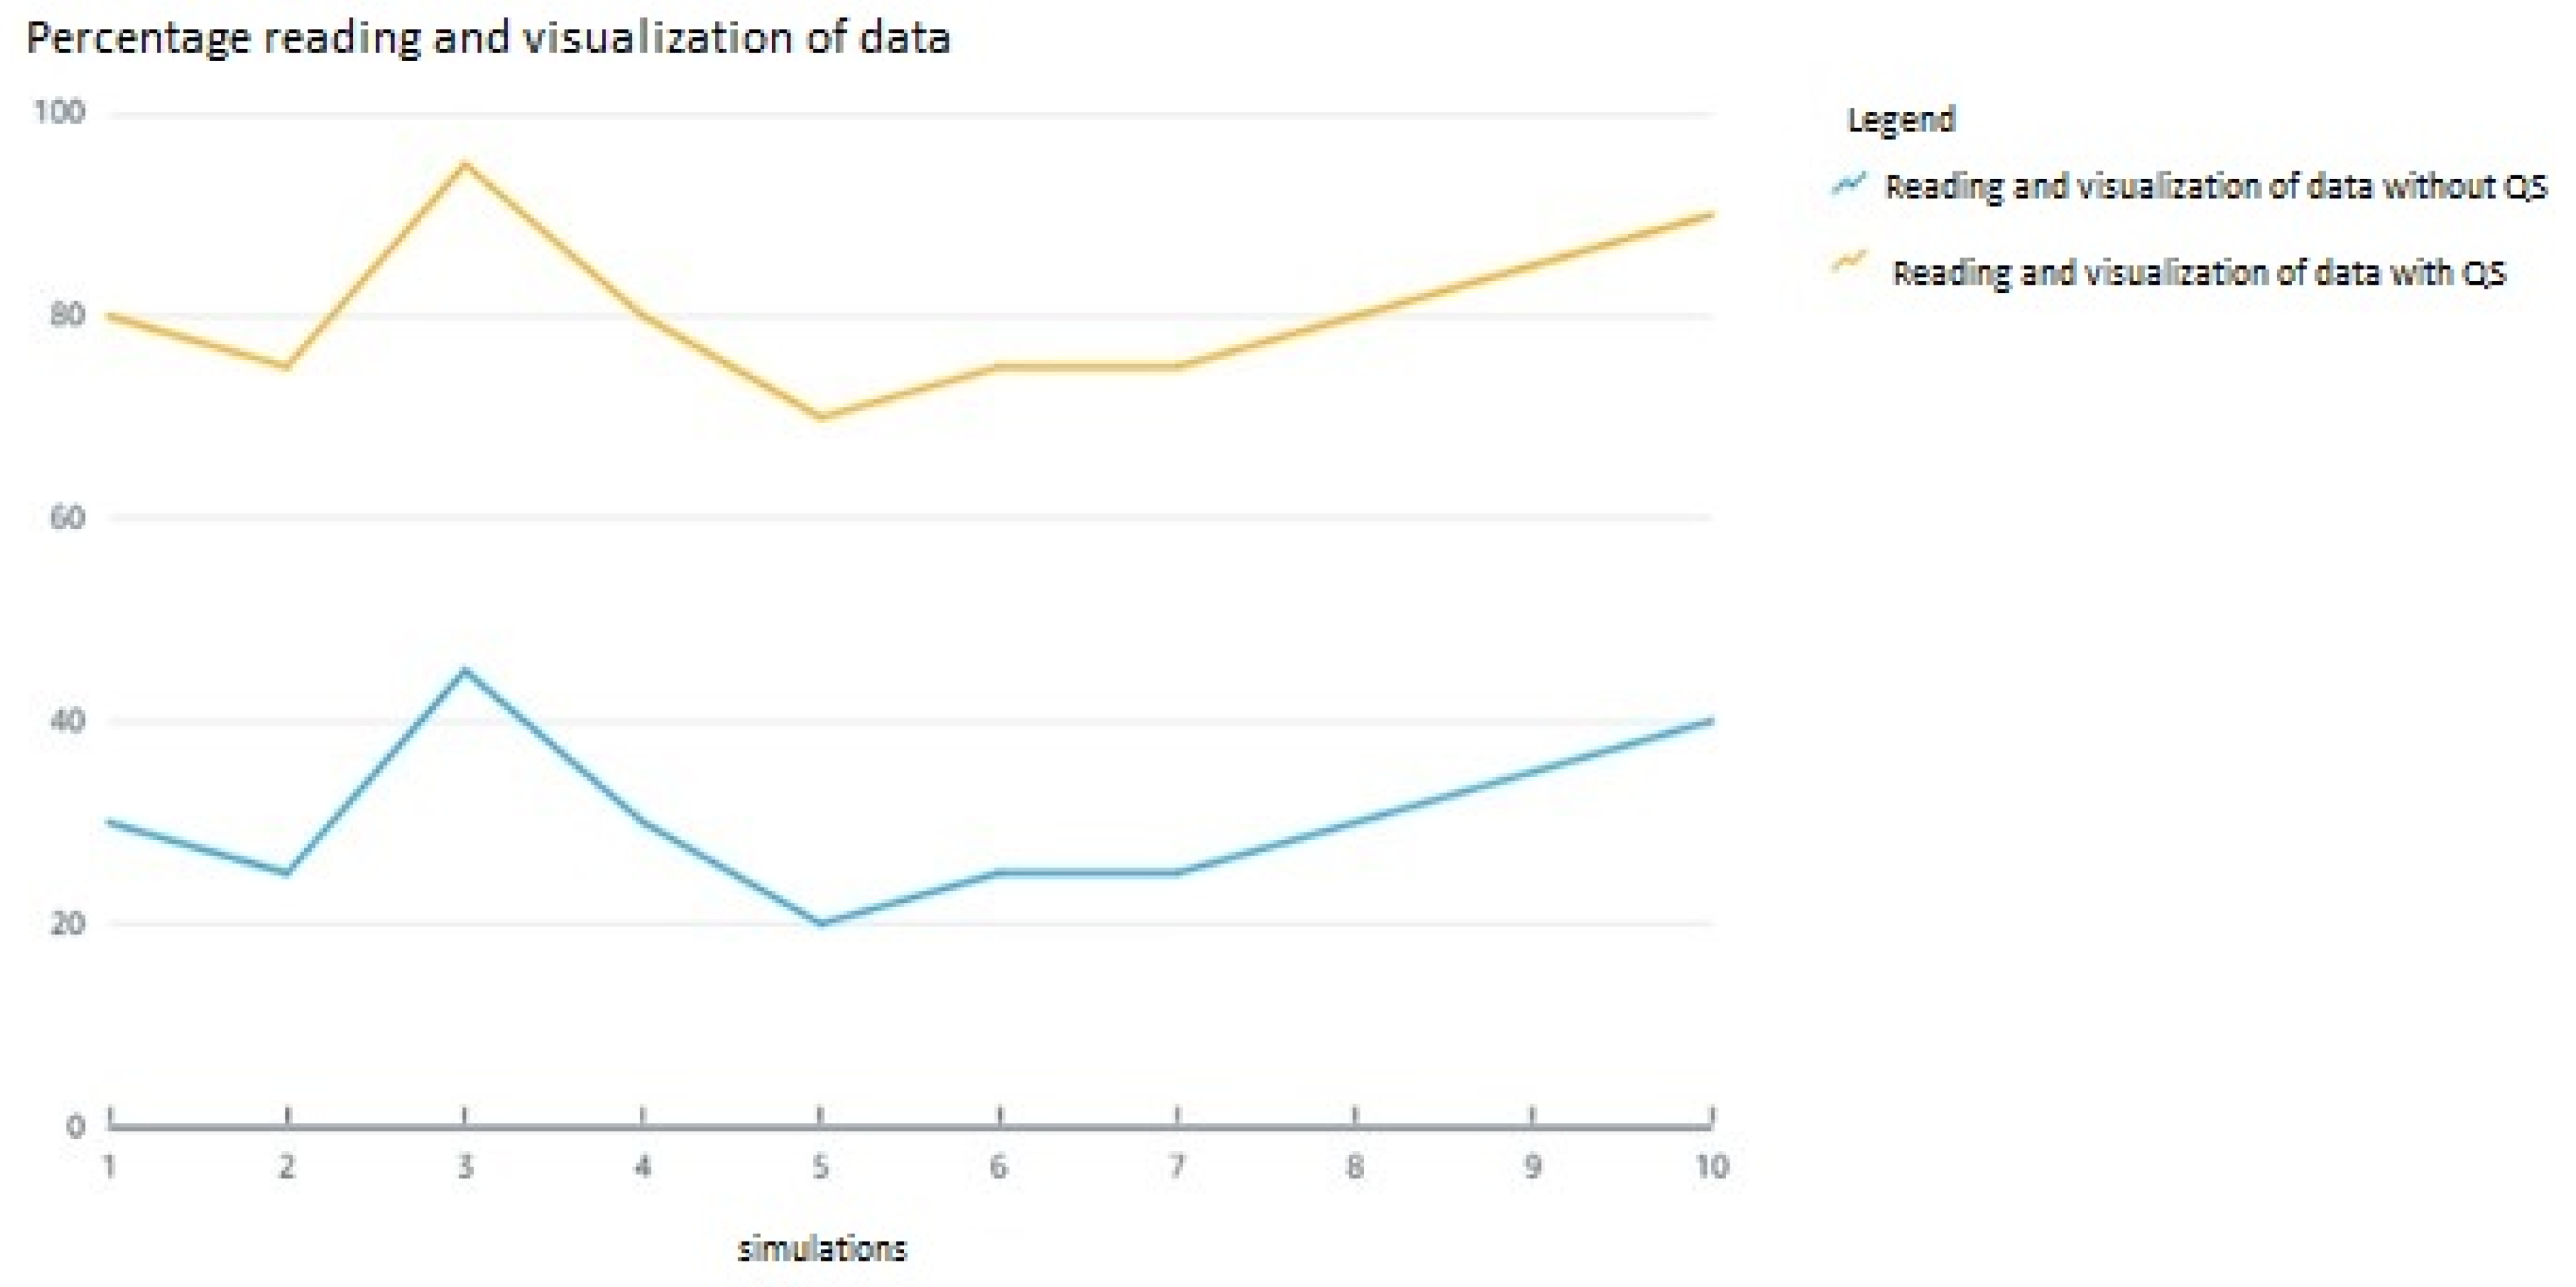
3.2. Percentage of Reading and Display of Data
3.3. Percentage of Useful Data
4. Discussion
5. Conclusions
6. Future Research
Author Contributions
Funding
Institutional Review Board Statement
Data Availability Statement
Acknowledgments
Conflicts of Interest
References
- Kuranga, A.; Maslin, M.; Maarop, N. Critical implementation factors for cloud-based Enterprise Resources Planning in the Nigerian Maritime Transport and supply chain. IOP Conf. Ser. Mater. Sci. Eng. 2021, 1051, 012022. [Google Scholar] [CrossRef]
- George, L.C.; Guo, Y.; Stepanov, D.; Peri, V.K.R.; Elvitigala, R.L.; Spichkova, M. Usage visualisation for the AWS services. Procedia Comput. Sci. 2020, 176, 3710–3717. [Google Scholar] [CrossRef]
- Farmanbar, M.; Rong, C. Triangulum City Dashboard: An Interactive Data Analytic Platform for Visualizing Smart City Performance. Processes 2020, 8, 250. [Google Scholar] [CrossRef]
- Wang, C.; Qi, T.; Lin, S.; Wang, W.; He, H. RETRACTED: The Strategy of Statistical Analysis of Audit Data in the Era of Big Data is Explored. J. Phys. Conf. Ser. 2021, 1881, 032081. [Google Scholar] [CrossRef]
- Lv, Q.; Yang, N.; Slowik, A.; Lv, J.; Yousefpour, A. Market behavior-oriented deep learning-based secure data analysis in smart cities. Comput. Electr. Eng. 2023, 108, 108722. [Google Scholar] [CrossRef]
- Shahzad, F.; Mannan, A.; Javed, A.R.; Almadhor, A.S.; Baker, T.; OBE, D.A.-J. Cloud-based multiclass anomaly detection and categorization using ensemble learning. J. Cloud Comput. 2022, 11, 74. [Google Scholar] [CrossRef]
- Castilla, R.; Pacheco, A.; Robles, I.; Reyes, A.; Inquilla, R. Digital channel for interaction with citizens in public sector entities. World J. Eng. 2020, 18, 547–552. [Google Scholar] [CrossRef]
- De la Cruz, C.; Pacheco, A.; Robles, I.; Duran, A.; Flores, E. Smart transportation system for public universities. Int. J. Inf. Technol. 2021, 13, 1643–1647. [Google Scholar] [CrossRef]
- Hsu, T.-H.; Wang, L.-C.; Chu, P.-C. Development of a cloud-based advanced planning and Scheduling System. Procedia Manuf. 2018, 17, 427–434. [Google Scholar] [CrossRef]
- Liu, J.; Wang, L.; Chu, P. Development of a cloud-based advanced planning and scheduling system for automotive parts manufacturing industry. Procedia Manuf. 2019, 38, 1532–1539. [Google Scholar] [CrossRef]
- Abdullayeva, F. Cyber resilience and cyber security issues of intelligent cloud computing systems. Results Control Optim. 2023, 12, 100268. [Google Scholar] [CrossRef]
- Župerl, U.; Stepien, K.; Munđar, G.; Kovačič, M. A Cloud-Based System for the Optical Monitoring of Tool Conditions during Milling through the Detection of Chip Surface Size and Identification of Cutting Force Trends. Processes 2022, 10, 671. [Google Scholar] [CrossRef]
- Walek, T.T. New model of cost allocation for micro-cogeneration systems applied in multi-family buildings—With standard and new-type multi-source energy meters. Energy 2023, 262, 125480. [Google Scholar] [CrossRef]
- Windisch, D.; Kelling, J.; Juckeland, G.; Bieberle, A. Real-time data processing for ultrafast X-ray computed tomography using modular CUDA based pipelines. Comput. Phys. Commun. 2023, 287, 108719. [Google Scholar] [CrossRef]
- Granero, L.P.; Guillén, M.; Bañón-Gomis, A.J. Influence of contingency factors in the development of the BSC and its association with better performance. The case of Spanish companies. Rev. Contab. 2017, 20, 82–94. [Google Scholar] [CrossRef]
- Henelius, A.; Torniainen, J. MIDAS: Open-source framework for distributed online analysis of data streams. SoftwareX 2018, 7, 156–161. [Google Scholar] [CrossRef]
- Fornieles, A. Data transformations in salary surveys. Rev. Psicol. Trab. Organ. 2013, 29, 75–82. [Google Scholar] [CrossRef]
- Blog, S. What is LTE? Differences between LTE and 4G. SoftwareLab. 2018. Available online: https://softwarelab.org/es/lte-4g/ (accessed on 18 May 2020).
- Smart Cities Interplatforms Group. Smart Cities: Vision document to 2030. Gici 2015, 1, 13–127. [Google Scholar] [CrossRef]
- Pacheco, A.; Reyes, O.; Reyes, A.; Espino, C.; Cardenas, C.; Mendoza, E. Technological proposal of an LTE network simulator with smart meter. Test Eng. Manag. 2020, 83, 13381–13387. [Google Scholar]
- Red.es. Data Visualisation: Definition, Technologies and Tools. Iniciat. Aporta. 2016. Available online: http://datos.gob.es/sites/default/files/doc/file/informe_herramientas_visualizacion.pdf (accessed on 4 June 2020).
- Fuentes, J.M.; Juradopm, P.J.M.; Marín, J.M.M.; Cámara, S.B. The role of information and communication technologies (ICTs) in the quest for efficiency: An analysis from lean production and e-integration of the supply chain. Cuad. Econ. Dir. Empresa 2012, 15, 105–116. [Google Scholar] [CrossRef]
- Qian, W.; Na, M.; Zenan, Y.; Yue, S.M.; Qing, L. Access Data Analysis Technology and Implementation of Electric Power Big Data Achievement Sharing Platform through Artificial Intelligence. J. Phys. Conf. Ser. 2021, 2083, 032065. [Google Scholar] [CrossRef]
- Valderrama, S. Steps for the Elaboration of Scientific Research Projects; Editorial San Marcos: Lima, Peru, 2015; 495p. [Google Scholar]
- Marino, C.A.; Chinelato, F.; Marufuzzaman, M. AWS IoT analytics platform for microgrid operation management. Comput. Ind. Eng. 2022, 170, 108331. [Google Scholar] [CrossRef]
- Ma, S.; Huang, Y.; Liu, Y.; Liu, H.; Chen, Y.; Wang, J.; Xu, J. Big data-driven correlation analysis based on clustering for energy-intensive manufacturing industries. Appl. Energy 2023, 349, 121608. [Google Scholar] [CrossRef]
- Gehrcke, J.P.; Kluth, S.; Stonjek, S. ATLAS@AWS. J. Phys. Conf. Ser. 2010, 219, 052020. [Google Scholar] [CrossRef]
- Tasmin, R.; Muhammad, R.N.; Nor, A.H.; Rawat, R.; Yadav, R. Big Data: Big Data Analysis, Issues and Challenges and Technologies. IOP Conf. Ser. Mater. Sci. Eng. 2021, 1022, 012014. [Google Scholar] [CrossRef]
- PowerData Data Quality. How to Drive Your Business with Data. Power Data. 2014. Available online: https://www.powerdata.es/calidad-de-datos (accessed on 12 June 2020).
- Murray, M.L.; Love, S.B.; Carpenter, J.R.; Hartley, S.; Landray, M.J.; Mafham, M.; Parmar, M.K.B.; Pinches, H.; Sydes, M.R. Data provenance and integrity of health-care systems data for clinical trials. Lancet Digit. Health 2022, 4, e567–e568. [Google Scholar] [CrossRef]
- Salazar, J. Implementation of Business Intelligence for the Commercial Area of the Company Azaleia—Based on Agile Scrun Methodology. 2017. Available online: https://repositorio.usil.edu.pe/entities/publication/b02d6825-8202-4630-a60f-4b70a1126702 (accessed on 15 July 2020).
- Peralta, E. Similarity-Based Visual Exploration of Large Geo-Referenced Multidimensional Datasets. 2019. Available online: http://repositorio.ucsp.edu.pe/handle/UCSP/15997 (accessed on 15 July 2020).
- Rodriguez, L. Metamodel for Open Data Integration Applied to Business Intelligence. 2017. Available online: http://di002.edv.uniovi.es/~cueva/investigacion/tesis/Tesis-LuzAndrea.pdf (accessed on 24 July 2020).
- Lino, C.A.C. Simulation and Analysis of LTE Network Performance for Advanced Metering Infrastructure in Smart Grids; Universidad de Chile: Santiago, Chile, 2016. [Google Scholar]
- Kollu, V.N.; Janarthanan, V.; Karupusamy, M.; Ramachandran, M. Cloud-Based Smart Contract Analysis in FinTech Using IoT-Integrated Federated Learning in Intrusion Detection. Data 2023, 8, 83. [Google Scholar] [CrossRef]
- Aulia, R.; Putri, A.N.; Raihan, M.F.; Ayub, M.; Sulistio, J. The Literature Review of Cloud-based Enterprise Resource Planning. IOP Conf. Ser. Mater. Sci. Eng. 2019, 598, 012036. [Google Scholar] [CrossRef]


| Indicators | Control | M | CVM |
|---|---|---|---|
| (I) Percentage of data quality | With Quicksight Without Quicksight | 75.5 51 | +27.39% |
| (II) Percentage of data reading and display | With Quicksight Without Quicksight | 80.5 30.5 | +63.70% |
| (III) Percentage of useful data | With Quicksight Without Quicksight | 79.8 39.8 | +47.30% |
| Reference Margin | Quality Index |
|---|---|
| =100 | Excellent |
| ≥50 | Good |
| ≤49 | Bad |
Disclaimer/Publisher’s Note: The statements, opinions and data contained in all publications are solely those of the individual author(s) and contributor(s) and not of MDPI and/or the editor(s). MDPI and/or the editor(s) disclaim responsibility for any injury to people or property resulting from any ideas, methods, instructions or products referred to in the content. |
© 2023 by the authors. Licensee MDPI, Basel, Switzerland. This article is an open access article distributed under the terms and conditions of the Creative Commons Attribution (CC BY) license (https://creativecommons.org/licenses/by/4.0/).
Share and Cite
Luyo, B.; Pacheco, A.; Cardenas, C.; Roque, E.; Larico, G. Unlocking Insights: A Cloud Tool for Data Visualisation in a Smart Meter Project. Processes 2023, 11, 3059. https://doi.org/10.3390/pr11113059
Luyo B, Pacheco A, Cardenas C, Roque E, Larico G. Unlocking Insights: A Cloud Tool for Data Visualisation in a Smart Meter Project. Processes. 2023; 11(11):3059. https://doi.org/10.3390/pr11113059
Chicago/Turabian StyleLuyo, Beni, Alex Pacheco, Cesar Cardenas, Edwin Roque, and Guido Larico. 2023. "Unlocking Insights: A Cloud Tool for Data Visualisation in a Smart Meter Project" Processes 11, no. 11: 3059. https://doi.org/10.3390/pr11113059
APA StyleLuyo, B., Pacheco, A., Cardenas, C., Roque, E., & Larico, G. (2023). Unlocking Insights: A Cloud Tool for Data Visualisation in a Smart Meter Project. Processes, 11(11), 3059. https://doi.org/10.3390/pr11113059