
Environmental Processes Assessment of a Building System Based on LCA–Emergy–Carbon Footprint Methodology


1
School of Civil Engineering, Architecture and Environment, Hubei University of Technology, Wuhan 430068, China
2
Key Laboratory of Health Intelligent Perception and Ecological Restoration of River and Lake of the Ministry of Education, Hubei University of Technology, Wuhan 430068, China
3
School of Civil Engineering and Architecture, Jiangsu University of Science and Technology, Zhenjiang 212100, China
4
College of Architecture, Nanjing Tech University, Nanjing 211816, China
5
School of Architecture, Architectural History and Theory, Southeast University, Nanjing 210096, China
*
Authors to whom correspondence should be addressed.
Processes 2023, 11(11), 3113; https://doi.org/10.3390/pr11113113
Submission received: 9 October 2023
/
Revised: 27 October 2023
/
Accepted: 29 October 2023
/
Published: 30 October 2023
(This article belongs to the Section Environmental and Green Processes)
Abstract
:Sustainable architecture holds research significance as a necessary approach to address climate change. However, the lack of a clear definition and diverse research methods present obstacles in this field. To overcome these challenges, this study adopts an integrated approach that combines ecological and low-carbon aspects and considers the entire life cycle system. The highlight of this article is the integration of two research methods to assess the sustainability of a building system from both ecological and carbon footprint perspectives. This approach has not been extensively explored by researchers thus far. The aim is to quantitatively explore and evaluate the sustainability performance of building systems. The research findings reveal that, among the five life cycle stages, the operational stage of a building exhibits the highest proportions of emergy consumption and carbon emissions, accounting for approximately 89.4% and 90%, respectively. From an emergy analysis perspective, newly constructed building systems demonstrate qualified sustainable parameters (Emergy Sustainability Indicator (ESI) = 2.7 > 1)). However, as the building system ages and operates over time, the overall sustainable parameters gradually decrease, eventually becoming unqualified. Furthermore, carbon emissions analysis indicates that total carbon emissions accelerate with the aging of the building, highlighting the necessity of continuous inputs of material flow, energy flow, and information flow to maintain the building system’s sustainability. The cross-feedback model emerges as the most effective correction method among the input processes, although data collection poses a challenge due to its nonlinearity. This study provides a fresh perspective for architects and building managers, offering insights that contribute to mitigating climate change and promoting sustainable practices in the built environment.
1. Introduction
To address the abnormal changes in global climate, the development of sustainable building systems is one of the best strategies [1,2]. Due to the broad definition of sustainability, there are differences in understanding sustainable building systems. Building systems under various assessments such as green, ecological, and low carbon can all achieve a certain level of sustainable development [3,4,5,6]. This paper conducts a quantitative evaluation and exploration of building systems from the perspective of the integration of ecology and low carbon, which is of great significance for designers and government management departments.
This study utilizes two distinct approaches. The emergy analysis, which originates from scholars at the University of Florida in the United States, was initially developed for sustainable assessment and analysis of ecological environments. It has gradually been expanded to a few types, including city areas, wetlands, buildings, economics, and energy [7,8,9,10,11,12,13,14,15,16]. Building systems are an important application area of emergy analysis, since this method can integrate different types of parameters into a unified platform for comparison. Currently, researchers are conducting design studies on green building systems based on the integration of BIM technology and emergy concepts [17]. Through quantitative evaluation using emergy analysis, the sustainable design of buildings can be guided [18]. The whole life cycle emergy framework is also significant for the sustainable design of building systems. Applying such methods enables the comprehensive assessment of various inputs in building systems; effective calculations of energy flow, material flow, and information flow; and optimization of sustainable building designs [19,20,21].
In addition, the establishment of carbon neutrality goals has made research on carbon emissions in building systems urgent. Compared to previous simple calculations, low-carbon and even zero-carbon buildings now have higher requirements for carbon emission calculations. It goes beyond simple carbon accounting and involves areas such as low-carbon building design, low-carbon building operation and maintenance, low-carbon transportation, and simulation in low-carbon software development, significantly broadening the scope of research on low-carbon buildings. In response to this carbon neutrality context, different researchers have conducted analyses and explorations at various levels. For example, researchers have explored the carbon emission effects of different building models [22]. Researchers have extensively explored low-carbon urban design, focusing on the building level and introducing innovative approaches [23]. Understanding the evolving nature of carbon emissions, the analysis of emission trends in public buildings has garnered attention [24]. System dynamics methods are employed by some researchers to predict and analyze carbon emissions in buildings [25]. Managing carbon emissions in the supply chain is crucial for ensuring the efficient functioning of building systems, leading to increased research interest [26]. Integrating low-carbon design principles during the renovation of existing buildings is gaining traction in the industry [27]. Scholars are also investigating the impact of green space design on carbon reduction through the coupling of building and landscape systems [28]. Government officials are tasked with analyzing the influence of carbon emission quotas on the construction industry [29]. Zero-carbon buildings are widely recognized as the optimal model for building systems and remain a prominent focus within the industry [30]. Some researchers have combined the life cycle of building systems with carbon emissions, conducting comparative analyses of the carbon emission intensity and cost [31]. Researchers are also interested in the relationship between low-carbon and energy efficiency, as well as the impact of carbon emissions on the environment [32,33]. Carbon sequestration calculations and analysis have also gained attention to reduce carbon emissions in building systems, especially detailed discussions on carbon sequestration and emission reduction technologies [34,35].
The latest developments in the field of ecological emergy and carbon footprint analysis for building systems mainly focus on the following aspects: (1) utilizing ecological emergy methods to assess the resource efficiency and environmental impacts of buildings, including material flow analysis, energy flow analysis, and life cycle assessment. These studies aim to quantify energy consumption, material usage, and waste generation at different stages of the building life cycle; and (2) examining the contribution of buildings to carbon emissions by evaluating the carbon content of building materials, energy consumption during construction, and energy utilization during the operational phase. These studies help guide building design and operations to reduce negative impacts on climate change [36,37].
However, the comparative analysis between ecological emergy and low-carbon perspectives, as two different viewpoints, is not well known to the public. The similarities and differences between the two have also not been explored, which is the starting point of this study. The aim of this research is to provide help for building managers in enhancing the sustainability of building systems through the findings and insights presented in this paper.
The specific research objectives of this paper address the following issues: (1) What are the contributions of different stages in building systems from the perspectives of emergy and carbon emissions? (2) How do typical feedback structures affect the sustainability of building systems? (3) How can ecological sustainable measures enhance the evaluation of building systems?
2. Materials and Methods
2.1. Research Framework
In order to demonstrate the overall idea of this paper, the research framework was designed and organized (Figure 1) to provide a clearer understanding of the research approach for the primary reader.
The research framework of this study is depicted in Figure 1. The left side illustrates renewable energy, non-renewable resources, and inputs from artificial services [38,39].
The entire system is divided into five modules, namely the five stages of the full life cycle (A/B/C/D/E stages) located at the top; renewable and non-renewable energy inputs located on the left; the impact of improvement strategies and feedback systems located on the right; outputs of the building system located at the bottom, including economic impacts, environmental impacts, and losses; and in the middle are the two types of methods for the building system, LCA–emergy and LCA–carbon emission.
The research framework provides a pathway for implementing the entire study. Various information flows, material flows, and energy flows enter the building system, utilizing quantitative calculation methods for emergy and carbon emissions. The interference of feedback subsystems is considered, and the sustainable status of the building system is analyzed in the end.
2.2. Life Cycle Assessment (LCA) Method
LCA, an established method, systematically evaluates the environmental and resource impacts of a product, process, or service throughout its entire life cycle (Figure 2). It comprehensively considers stages from raw material extraction to manufacturing, use, maintenance, and final disposal. LCA aims to quantify and assess the environmental, economic, and social impacts associated with a specific product or process. The typical LCA process involves four key steps: goal and scope definition, life cycle inventory, life cycle impact assessment, and interpretation. In the goal and scope phase, the objectives, boundaries, and functional unit of the LCA are determined. The life cycle inventory phase entails data collection on raw material consumption, energy usage, and waste generation. The life cycle impact assessment phase analyzes and interprets the collected data to evaluate environmental and resource-related impacts. Finally, in the interpretation phase, the results are communicated to support decision-making and facilitate improvements. LCA enables the comparison of environmental performance among different products or processes, identification of influential factors, and guidance for sustainable design and decision-making. It finds extensive application in various sectors, such as buildings, energy, transportation, food, and textiles [40,41,42].
The LCA methodology described in this article is defined according to the standard ISO 14040:2006: environmental management, life cycle assessment, and principles and framework. This standard establishes the fundamental principles and framework for conducting LCA, including goal and scope definition, life cycle phase partitioning, functional unit definition, and more.
In Figure 2, six stages of the building system are included, specifically highlighting the building design phase. In this phase, the calculations for emergy, energy, and carbon emissions are all based on the input of labor costs.
2.3. LCA–Emergy Approach
2.3.1. Emergy Theory
The emergy method is employed to evaluate the sustainability of building systems, utilizing ecological principles. It involves quantitatively measuring and calculating the energy exchanges between the building system and the environment. These measurements are then converted into comparable indicators to assess the impact of the building system on the ecosystem [43].
The ecological emergy method typically includes the following steps: (1) system boundary determination: identifying the scope of the assessment for the building system, including the interactions between the building and its surrounding environment; (2) data collection: gathering relevant data on energy inputs and outputs, including energy consumption, material usage, waste generation, etc.; (3) energy flow analysis: analyzing the pathways and transformation processes of energy within the building system based on the collected data. This can involve examining energy acquisition, utilization, and emissions, among other factors; (4) energy quantification: converting energy measurements into standard units for comparison and computation purposes; (5) ecological emergy calculation: applying ecological principles to convert energy interactions into ecological emergy. This can encompass considering energy sources, environmental impacts, and the capacity of ecosystems to recover; (6) data analysis and interpretation: analyzing and interpreting the ecological emergy data to evaluate the sustainability performance of the building system. This may involve comparisons with other building systems and analyzing the impacts of different design and operational measures.
The emergy method is more comprehensive compared to ISO/EN standards 14040 and 15978.
ISO 14040 is an international standard that provides guidance on the methodology of the Life Cycle Assessment (LCA). It emphasizes considering the entire product life cycle from the input of materials and energy to waste generation. The standard defines four phases of LCA: goal and scope definition, inventory analysis, impact assessment, and interpretation. By adopting the ISO 14040 standard, a systematic approach can be employed to assess environmental impacts and make the results more comparable and transparent.
EN 15978 is a European standard used to assess the overall sustainability of buildings and infrastructure. It emphasizes the life cycle assessment of buildings, including aspects such as resource consumption, energy use, and environmental impacts. The EN 15978 standard defines methods for calculating the environmental impacts of building materials and energy use and provides a systematic framework for evaluation.
Through the ecological emergy method, the comprehensive performance of a building system in terms of energy utilization, environmental impacts, and ecosystem restoration can be assessed. This helps guide architectural design and operational decisions, promoting the development of the building industry towards greater sustainability.
2.3.2. Emergy Calculation Model
Emergy calculation model can be found in Table 1.
2.3.3. Emergy Indicators
This paper utilizes three core indicators of emergy to assess the ecological sustainability of building systems. The specific parameter types and details can be found in Table 2.
The Whole Life Energy Analysis of the building stages is based on energy consumption as an indicator, collecting and calculating the energy in each stage of the building’s life cycle. Unlike emergy analysis, energy calculations do not include calculations for material flow or information flow. However, the advantage of an energy analysis is its ability to accurately measure the energy values at each stage, providing architects and managers with tangible impacts and meaningful references. The energy calculation for the operational stage of the building in this study is predicted and analyzed according to national standards.
2.4. LCA–Carbon Emission Model of Five Processes
Figure 3 visually represents the carbon emission trajectories of the building system using a comprehensive life cycle approach. It integrates carbon emissions throughout five key stages: namely, building material production, building material transportation, building construction, building operation, and building demolition. The corresponding calculation formulas for each stage are provided in Figure 3 [44].
2.5. Feedback Subsystem Analysis
The building system, functioning as a complex operational entity, is subject to diverse feedback information throughout its operation. This feedback can be classified into three categories based on their types: information flow, material flow, and energy flow. Moreover, considering the feedback structure, these systems can be categorized into three distinct types: open-loop feedback systems, closed-loop feedback systems, and cross-feedback systems. This article explores the influence of these three feedback systems to enhance the precision of overall system operations and elevate the effectiveness of sustainable building systems.
Figure 4 illustrates the specific structures of these three categories. Compared to the open-loop feedback system, the closed-loop feedback system and cross-feedback system have the greatest corrective effect on the entire building system but also impose an increased burden on its operation. It is important to emphasize that the impact of the cross-feedback system exhibits nonlinear effects, which increases the uncertainty of changes in emergy and carbon emissions.
3. Case Study
3.1. Case Introduction
This building case is a newly constructed ecological building complex with a primary focus on commercial activities, planned to operate for 50 years. The total building area is approximately 60,000 square meters and is divided into three building modules interconnected by corridors. The key feature of the entire building is its response to climate change, incorporating sustainability design from both ecological and low-carbon perspectives, as shown in Figure 5. The sustainable design strategies include seven categories: ecological grass ditch, ecological vegetation buffer zone, artificial ecological wetland, ecological infiltration basin, ecological rainwater garden, permeable paving surface, and ecological tree box filter.
Here are the specific spatial parameters for a commercial complex building with an area of 60,000 square meters:
Total building area: 60,000 square meters. Commercial space ratio: 40% (24,000 square meters), including retail stores, shopping malls, and other commercial spaces. Office space ratio: 30% (18,000 square meters), including offices, meeting rooms, and shared workspaces. Restaurant space ratio: 20% (12,000 square meters), including restaurants, cafes, and fast-food outlets. Public area facilities: including leisure areas, children’s playgrounds, green landscapes, outdoor terraces, etc., occupying the remaining 10% of the area (6000 square meters). Number of parking spaces: determined based on requirements. Typically, ample parking spaces are provided in a commercial complex. Assuming 1 parking space is provided per every 100 square meters of commercial space, the approximate total number of parking spaces would be around 240.
The sustainable design strategies in this case include: (1) energy efficiency: utilizing efficient insulation materials, energy-saving equipment, and smart control systems to reduce energy consumption, as well as incorporating renewable energy sources such as solar and wind power; (2) material selection: choosing renewable, environmentally friendly, and low-carbon emission building materials to reduce reliance on finite resources and lower the carbon footprint of the construction; (3) water resource management: implementing low-flow faucets, water-saving appliances, and rainwater harvesting systems to minimize the use of freshwater resources and establish effective wastewater treatment; (4) building layout and design: optimizing building orientation and layout to maximize natural lighting and ventilation, reducing the need for artificial lighting and air conditioning systems; (5) waste management: implementing effective waste sorting, recycling, and disposal systems to minimize waste and pollutants generated during construction activities; (6) green spaces: increasing green coverage and incorporating landscape design around the building to provide a comfortable outdoor environment and promote biodiversity conservation; (7) sustainable operation and maintenance: establishing an efficient energy management system and conducting regular inspections and maintenance of equipment to ensure the long-term high performance of the building. These diverse sustainable design strategies aim to decrease the carbon footprint, resource consumption, and negative environmental impacts of the building, ultimately achieving a more sustainable approach to design and operation.
3.2. Date Collection
This study entails extensive computation and necessitates the collection and processing of data. The dataset can be broadly classified into two types: basic data and corresponding emergy conversion rates and carbon emission factors. The basic data are further categorized into three groups: namely, information flow data, energy flow data, and material flow data. The emergy conversion rate data encompass information flow emergy conversion rates, energy flow emergy conversion rates, and material flow emergy conversion rates [38]. The carbon emission factors are obtained from reputable institutions like the Intergovernmental Panel on Climate Change (IPCC) [39]. It is crucial to highlight that the feedback subsystems of the entire building system have been considered to rectify the basic dataset. Figure 6 visually presents the process of data collection and processing in this study.
4. Results
4.1. LCA–Emergy Analysis
4.1.1. Dominated Contributor of Five Processes
The total life cycle energy of the entire building system is analyzed and calculated from an emergy perspective. Figure 7 illustrates the specific energy calculations and changes in proportions across five stages. The analysis encompasses emergy calculations for durations of 20, 30, and 50 years. Predictive calculations based on an ecological model are used for the building operation and building demolition stages. Figure 7 clearly presents the emergy proportion changes in the five stages of the building system over time. For instance, considering a building operating for 20 years, the highest emergy proportions are observed in the building operation stage and building material production stage, accounting for a total proportion of 84.5%. Specifically, the emergy proportion of the building operation stage is 60.3%, while the building material production stage contributes 24.2%. After 30 years of operation, these proportions increase to 91.8%, 71.7%, and 20.1%, respectively. In the case of operation exceeding 50 years, the proportions further rise to 96.5%, 89.4%, and 7.11%.
As the building’s service life extends, there is a notable trend where emergy consumption during the building operation stage steadily increases while the emergy proportions of the other stages decline. To enhance the sustainability and emergy performance of the entire building system, it is crucial to pay specific attention and conduct a thorough analysis of the building operation stage. For reference regarding unit emergy values, the literature [19] provides the necessary information.
The various stages of the building system can be identified as follows: Stage 1 represents the building material production stage, Stage 2 corresponds to the building material transportation phase, Stage 3 denotes the building construction stage, Stage 4 signifies the building operation stage, and Stage 5 refers to the building demolition stage.
In Figure 7, as the lifespan of the building system increases, the emergy proportion at the building operation stage increases. This is mainly due to the increased consumption of electricity, heat energy, and the wear and tear of the building during the operation stage. Consequently, the emergy proportion at the building material production stage decreases. The longer the building operates, the greater the proportion of emergy at the operation stage and the smaller the proportion at the material stage. These findings are consistent with the current research [45,46], highlighting the central role of the building operation stage. The emergy proportions of specific equipment vary for different building types and users during the building operation stage, as it involves multiple devices.
4.1.2. Sustainable Analysis
To conduct a sustainability analysis from the emergy perspective, three indicators need to be calculated: EYR, ELR, and ESI. This article analyzes the changes in the sustainability status of the entire building system by calculating these indicators for the first year, 20 years, 30 years, and 50 years. Figure 8 shows the parameter values at these four time points.
Figure 8 presents the trends of three indicators in the study. Using EYR as an example, the emergy output of the entire building system diminishes while the input increases during the operation, indicating a decline in the overall system efficiency. In comparison to the first year, EYR drops by 38.4% after 20 years, 55.8% after 30 years, and 76.4% after 50 years. Regarding ELR, as the operating time increases, the environmental pressure proportionately escalates, with respective increments of 40.9%, 50.5%, and 78.1% across the four time periods. Due to significant fluctuations in EYR and ELR, the ESI indicator experiences substantial variations, ranging from 2.7 to 1.2/0.6/0.2 (transiting from a sustainable state to an unsustainable state). The sustainability of the entire building system visibly deteriorates, necessitating the replenishment of the material flow, information flow, and energy flow within the building system.
As the operational lifespan of building systems increases, it inevitably leads to a decrease in the operational efficiency of these systems, resulting in a reduction in energy value productivity. The decline in building system efficiency also necessitates more environmental inputs (material flow, energy flow, and information flow), leading to an increase in environmental load and ultimately resulting in a sustained decrease in the energy value sustainability parameters (Figure 8). This is consistent with the characteristics of the current research literature on building energy values [46].
4.1.3. The Impact of Feedback Systems
An analysis of the sustainability indicators, specifically the ESI objective, has been conducted considering three feedback input models: material flow, information flow, and energy flow. The aim is to evaluate the influence of the feedback system by examining the magnitude of variations in the indicators. Figure 9 visually illustrates the trend of ESI parameter changes within the feedback system context.
Figure 9 showcases the changes in the sustainability ESI indicator under the influence of three feedback systems. Based on the initial ESI value of 2.7 in the first year, the open-loop feedback system demonstrates the most substantial correction to the final sustainability indicator, followed by the closed-loop feedback system and, finally, the cross-feedback system. This pattern indicates that the open-loop feedback system has the greatest impact and yields more noticeable errors, while the cross-feedback system performs optimally. Considering material flow, energy flow, and information flow, the material flow exerts the greatest influence, followed by energy flow, with information flow having the least impact. This hierarchy stems from the fact that, within the building system, material input holds the highest priority, followed by energy and information input.
4.1.4. Sensitivity Analysis of Emergy View
Given the extensive dataset in this study, conducting a sensitivity analysis on the data becomes crucial, as it has a substantial impact on the ultimate sustainability assessment. Therefore, detailed analysis of the sensitivity of the data is essential to understand its influence on the final sustainability status. The data in this research are divided into two categories: basic data and emergy conversion rates. Different calculation standards result in fluctuating differences in the conversion rates. Therefore, this paper is based on six assumptions: namely, 5%, −5%, 8%, −8%, 10%, and −10% data fluctuations to test the effect of sustainability parameter change. The selected indicators are EYR, ELR, and ESI.
Figure 10 illustrates the data fluctuations under six hypothetical scenarios. From the range of fluctuations around the midpoint, it can be observed that the larger the variations in basic data, the greater the changes in sustainability parameters. Taking the ESI parameter as an example, the calculations reveal that, under a 5% variation in basic data, the magnitude of ESI change is 1.1%. Under five different hypothetical scenarios, including the −5%, 8%, −8%, 10%, and −10% variations, the magnitudes of ESI change are 1.3%, 2%, 2.6%, 4.9%, and 7.6%, respectively. From the data, it can be observed that the change trend follows a nonlinear pattern.
To provide a clearer indication of the changing trends in data sensitivity, Figure 11 illustrates the predicted and demonstrated sensitivity trends for three parameters: EYR, ELR, and ESI. Notably, the trends for EYR (Figure 11(1)) and ELR (Figure 11(2)) remain relatively stable, displaying a close-to-linear change pattern. However, ESI exhibits greater fluctuations. As ESI is derived from EYR and ELR, this increases the uncertainty in ESI due to the overlapping effects of uncertainties in these component parameters, resulting in more significant variations. Consequently, based on the observed trends in Figure 11, it is evident that conducting data sensitivity analysis for the entire building system’s emergy is indispensable.
Through sensitivity analysis, we can understand the extent to which different parameters affect the sustainability indicators. This helps us identify which parameters have a greater impact on system sustainability and provides guidance for optimizing design and decision-making. Sensitivity analysis also provides quantitative information on how parameters affect sustainability objectives. This assists decision-makers in making informed decisions when balancing different parameter choices to achieve more optimized sustainability outcomes.
4.1.5. LCA–Energy Analysis
In the entire calculation process of the building system, energy consumption calculation and monitoring are essential. The commercial complex case in this article was designed and constructed according to the latest building energy efficiency standard [47]. The energy consumption target for new commercial public buildings is 106 kWh/(m2·a), and the total energy consumption of the entire building is 6.36 × 10⁶ kWh.
Energy-saving design of the building system is aimed at reducing carbon emissions and improving energy efficiency by optimizing the building’s energy use and minimizing energy waste. Here are some energy-saving design measures for the building system in this article:
(1) Building envelope design: optimizing the building’s orientation and window placement to maximize natural daylighting and ventilation, reducing the need for artificial lighting and air conditioning.
(2) Insulation design: using high-efficiency insulation materials for walls, roofs, and floors to reduce heat transfer and energy loss.
(3) To optimize energy usage and reduce carbon emissions, it is recommended to implement efficient heating and cooling systems. This can be achieved by utilizing energy-efficient equipment such as ground source heat pumps, air source heat pumps, or solar-powered air conditioning. These technologies help minimize energy consumption and contribute to a more sustainable and environmentally friendly building operation.
(4) Lighting system optimization: using efficient LED lighting fixtures equipped with smart control systems to automatically adjust brightness and switch status based on needs, reducing electricity consumption.
(5) Smart energy management system: implementing intelligent monitoring and control technologies to monitor real-time energy usage, optimize energy allocation and usage, and reduce energy waste.
(6) Water resource management: installing efficient faucets, showerheads, and flush systems, as well as rainwater collection and utilization devices, to reduce water consumption and energy usage.
(7) To decrease the dependence on conventional energy sources and lower carbon emissions, it is advisable to promote the adoption of renewable energy sources. This can be accomplished by increasing the utilization of solar panels and wind power. By incorporating these renewable energy technologies, the building can reduce its environmental impact and contribute to a more sustainable energy future.
By taking a comprehensive approach and tailoring the design to suit the specific characteristics of the building case discussed in this article, it is possible to maximize the energy-saving performance of the building system. This optimization will result in reduced carbon emissions and make a significant contribution to the sustainable development goals.
According to the test and calculation data in this article: (1) maintenance, structural repairs, and energy upgrades have improved energy efficiency by approximately 13.8%; (2) the use of insulation materials can reduce energy losses by about 8.41%; (3) the solar energy system used in this study can increase the building’s annual electricity supply by approximately 6.43%; (4) energy-efficient lighting systems save about 3.78% of electricity; (5) smart energy monitoring systems reduce waste and can improve efficiency by approximately 8%, according to the test data; (6) the rainwater collection system saves about 16 tons of water annually; (7) renewable energy primarily includes the solar energy system, while wind energy data are currently incomplete and require long-term monitoring.
4.2. LCA–Carbon Emission Analysis
To identify the primary types of stages in the building system from a carbon emissions perspective, calculations and analyses are carried out. Additionally, a sensitivity analysis is conducted on the overall building data to ensure the reliability and feasibility of the analysis. The findings of each stage’s analysis are presented in Figure 12, Figure 13, Figure 14, Figure 15 and Figure 16. For reference regarding carbon emission factors in this section, please consult Reference [48].
4.2.1. The Carbon Emission of the Building Material Production Stage
From the perspective of carbon emissions, building materials are expected to be one of the main influencing factors. This can be observed in Figure 12, which shows a carbon emissions data matrix for 14 types of materials. In the figure, “1” represents materials that have carbon emissions output. Taking steel as an example, there are corresponding outputs for the carbon emissions levels ranging from 2000 to 3000, indicating that it falls within that range (actual carbon emissions of 2198 tCO2; 30-year calculation period). Similar patterns can be observed for other materials. In terms of emissions volume, cement has the highest emissions level, followed by steel, then iron, while other materials have emissions at a uniform level.
Note: The value 1 represents the presence of carbon emissions for the material. The heatmap represents the level of carbon emissions quantity.
4.2.2. The Carbon Emission of the Building Material Transportation Stage
The carbon emissions in the transportation sector are determined by calculating the consumption of fossil fuels, with diesel fuel consumption being the standard in this study. After collecting and analyzing the relevant data, the total carbon emissions during the entire construction transport stage are found to be 265 tCO2. While this quantity may appear relatively small compared to the overall carbon emissions of the building system, its significance should not be underestimated. It is worth noting that the carbon emissions pathway analyzed in this study encompasses two aspects: firstly, from building material factories to processing bases such as concrete mixing stations, and secondly, from processing bases to construction sites.
4.2.3. The Carbon Emission of the Building Construction Stage
The various components of the building system can be categorized as follows: A—labor and service, B—water supply and sewage system treatment facilities, C—heating and cooling systems, D—electricity installations, E—telecommunications system, and F—elevator system.
Figure 13 illustrates the carbon footprint calculations during the construction phase. In terms of the proportions of carbon emissions, the electricity system has the highest operational carbon emissions (D subsystems: approximately 31% share), followed by the HVAC subsystem (C subsystems: approximately 26% share), the artificial service input (A subsystems: approximately 15% share), the water supply and treatment system (B subsystems: approximately 12% share), the telecommunications engineering system (E subsystems: approximately 9% share), and the elevator system (F subsystems: approximately 7% share).
Figure 14 presents a proportionate analysis of carbon emissions for the six subsystems during the construction phase. The figure clearly highlights the primary types of carbon emissions. In the artificial service system, machine diesel fuel emissions contribute the most to carbon dioxide emissions. For the water system, the use of steel materials results in the highest carbon emissions. The primary factor leading to carbon dioxide emissions in the other systems is the consumption of fossil fuels.
4.2.4. The Carbon Emission in the Building Operation Stage
In this study, the operational phase of a building pertains to the carbon emissions generated during the construction phase over a specific period. Considering the typical lifespan of commercial buildings in China, which is approximately 50 years [45], the carbon emissions calculations are based on this duration. The main calculation types encompass electricity consumption, water supply, and heating. The total carbon emissions for the entire 50-year period amount to 3.26 × 10⁵ tCO2. Among these, electricity accounts for the highest carbon dioxide emissions, followed by heating, with water supply contributing the least.
4.2.5. The Carbon Emission in the Building Demolition Stage
According to Figure 15, the proportion of carbon dioxide emissions from various building materials during the demolition phase is depicted. Concrete exhibits the highest carbon dioxide emissions, followed by steel, glass, bricks, PVC, aluminum, and diesel, among others. The carbon emissions from the first four building materials contribute to 91.9% of the entire demolition phase, emphasizing the need for special attention. As the buildings in this study have not yet reached the demolition phase, the carbon emissions for each type are calculated based on 5%. It is important to note that there might be some errors in estimating the carbon emissions, thus necessitating long-term monitoring and corrections.
4.2.6. LCA–Carbon Emissions Analysis
When considering the carbon emissions data from all five stages of the building life cycle, it becomes evident that the operational stage holds the most substantial impact, contributing to approximately 90% of the total carbon emissions from the entire building system. The calculation period for carbon emissions in the operational stage is set at 50 years. To mitigate carbon emissions during this stage, the following measures can be implemented:
(1) Improve energy efficiency: Use efficient insulation materials, low-energy-consuming equipment, and systems to reduce energy demand.
(2) Adopt renewable energy sources: Increase the utilization of renewable energy, such as solar panels and wind power, to decrease the reliance on conventional energy sources and minimize carbon emissions.
(3) Optimize heating and cooling systems: Utilize efficient heating and cooling equipment and implement smart controls to adjust temperatures and humidity levels based on occupancy and weather conditions. This optimization enhances energy efficiency and reduces carbon emissions associated with HVAC operations.
(4) Water resource management: Implement water-saving equipment and systems to minimize water waste and energy consumption.
(5) Regular maintenance and monitoring: Ensure the proper functioning of equipment and systems, and promptly address issues such as leaks and energy wastage.
By considering these comprehensive measures, it is possible to effectively reduce carbon emissions during the operational stage of a building while improving its environmental friendliness.
4.2.7. Sensitivity Analysis of Carbon Emissions View
Based on the information provided in Section 4.2.4, it can be deduced that, throughout the entire operational stage of the building, the primary contributor to carbon emissions is the electrical power system. Therefore, this section focuses on sensitivity analysis regarding variations in electrical carbon emissions data. Six assumptions are set in this section, including a 5%, 8%, and 10% increase and a −5%, −8%, and −10% decrease in electrical data. These variations are examined to assess the sensitivity of the overall building carbon emissions. Figure 16 displays the trend of sensitivity changes.
Figure 16 depicts the trend of logarithmic normal distribution under six assumptions. It can be observed that, as the range of assumptions expands, the sensitivity exhibits a geometric progression, becoming increasingly unpredictable. Therefore, in order to ensure the accuracy of carbon emission calculations in the building system, strict control should be exercised over the fluctuation of foundational data and carbon emission factors. The results of this study indicate that fluctuations exceeding 8% may lead to unforeseen research outcome fluctuations. Hence, during data collection and verification, meticulous selection and actual recording should be rigorously employed.
5. A Comprehensive Discussion
5.1. The Research Findings and Discussion
In this article, the sustainability of the building system is examined through a comprehensive analysis that considers emergy, energy consumption, and carbon emissions across its entire life cycle. By conducting calculations and organizing data from these three perspectives, a holistic understanding of the building’s sustainability performance is obtained.
Similar conclusions: Irrespective of whether the emergy or carbon emissions perspective is considered, the operational phase of the building consistently emerges as the primary influencing stage, with its impact proportion progressively growing over time. However, the study acknowledges that the operational phase of commercial buildings introduces complexities due to the diverse inputs and outputs involved, including foot traffic, operating hours, and maintenance. These factors contribute to the multifaceted nature of the analysis conducted in this study.
Differences: While the operational phase’s significance in terms of emergy, energy consumption, and carbon emissions is recognized across different perspectives, the specific proportions may differ. This variability in proportions offers valuable insights for architects and building managers to consider when making decisions regarding sustainable practices in building design and management. Consequently, a nuanced understanding of the differing impacts within the operational phase can inform more targeted and effective strategies to optimize sustainability throughout the building’s life cycle.
With regards to the emergy method, it is important to critically evaluate its strengths and limitations in comparison to ISO/EN standards 14040 and 15978. While the emergy method offers a broader scope and a holistic assessment of energy consumption throughout the life cycle of a building system, its application in scientific research and its comparisons with the existing standards have been relatively limited. Therefore, further empirical studies and validation are necessary to fully understand its effectiveness and potential contributions.
In terms of its strengths, the emergy method provides a comprehensive understanding of environmental implications by considering not only the environmental impacts but also emphasizing the quantification of energy inputs, outputs, and transformations. This approach allows for a more integrated analysis of the sustainability aspects, enabling a deeper understanding of the resource utilization efficiency, energy conservation, and overall environmental protection.
However, it is essential to critically assess the limitations and potential drawbacks of the emergy method. While ISO/EN standards provide standardized guidance and frameworks that ensure comparability and transparency of the results, the emergy method may lack the same level of acceptance and widespread adoption in scientific research and practice. The absence of comprehensive evaluations and comparisons with previous studies in the literature highlights the need for a critical analysis of its limitations and gaps.
The highlight of this article is the integration of two research methods to assess the sustainability of a building system from both ecological and carbon footprint perspectives. This approach has not been extensively explored by researchers thus far [49,50,51,52,53,54].
To address these shortcomings, future research should aim to conduct in-depth comparative studies of the emergy method and carbon footprint based on ISO/EN standards, examining their effectiveness in different contexts, industries, and product types. Such studies would contribute to the knowledge base by providing empirical evidence and insights into the relative advantages and disadvantages of each approach.
5.2. Limitations and Shortcomings in the Research
From an emergy perspective, the overall sustainability of the building system is inadequate, with the most critical sustainability indicator (ESI) continuously decreasing. Sustainable improvements are needed to enhance sustainability. The ESI indicator experiences substantial variations, ranging from 2.7 to 1.2/0.6/0.2 (transiting from a sustainable state to an unsustainable state).
Building carbon sinks refers to the process of absorbing and storing carbon dioxide in the air through building and land use practices. They play an important role in sustainable architecture and urban planning. Building carbon sinks can help reduce greenhouse gas concentrations in the atmosphere, especially carbon dioxide. They are a crucial component of sustainable building and urban planning. By maximizing the utilization of natural resources, reducing energy consumption, and mitigating greenhouse gas emissions, building carbon sinks contribute to establishing a more sustainable society and environment.
Based on the identified deficiencies at both levels, optimization strategies and their effectiveness validation are carried out in Section 5.3.
5.3. Improvement and Optimization Measures
5.3.1. Measures for Improving Ecological Emergy Perspective
To enhance the sustainability, this architectural design integrates a range of sustainable features depicted in Figure 5. These include eco-pavement, eco-garden, small-scale ecological wetlands, and ecological landscapes. Apart from improving the overall sustainability of the building system, these ecological designs also play a role in carbon reduction efforts by contributing to carbon sequestration to some extent. With the incorporation of these features, the building design not only promotes environmental conservation but also supports the goal of reducing carbon emissions.
The results obtained from the calculations for EYR, ELR, and ESI are presented in Figure 17. These indicators help mitigate the environmental pressure on the overall building system and enhance sustainability. However, due to the limited design area, the improvement effect is not significant. The sustainability improvement is approximately 4.1% (ESI indicator).
5.3.2. Measures from the Perspective of Carbon Sinks
Vegetation also contributes to regional carbon reduction, and the carbon reduction types involved in this case include vegetation carbon reduction and material carbon reduction. The calculation formulas can be found in Table 3.
Considering a calculation period of 50 years, the total carbon reduction calculated using the formulas in Table 3 can reach 24.6 tCO2. Although the overall carbon reduction effect may not be significant, this is due to limitations in land area and the volume of building materials.
Therefore, for architects and engineers, increasing the proportion of ecological design in land use and the share of carbon sequestration building materials is an essential path to carbon reduction.
6. Conclusions
In the face of worsening climate conditions, this study has explored sustainable architecture, particularly through the utilization of ecological emergy and carbon emissions calculation models. It has conducted calculations and assessments throughout the entire life cycle of buildings, providing new insights for relevant practitioners. Additionally, this paper has also considered the impact of feedback subsystems in the building system and validated the effectiveness of open-loop feedback systems, closed-loop feedback systems, and cross-feedback systems. This further enhances the accuracy of the entire sustainable building process.
When considering the emergy and carbon emissions perspectives, the operational stage of a building demonstrates the highest emergy consumption and carbon emissions throughout its life cycle. However, the proportions of these two factors are not equivalent. As the building system remains in operation, the emergy consumption and carbon emissions in the other four stages progressively decrease, while those in the operational stage gradually increase. It is important to note that this change is not linear but varies over time, reflecting the complex dynamics involved in the building’s life cycle.
However, there are contents in this study that require further investigation. The building system is a complex and dynamically evolving system, requiring research on the dynamic emergy and carbon footprint of the entire building system. The next step in research is to explore the sustainable dynamic characteristics from the perspectives of emergy and carbon footprint, with a particular focus on incorporating artificial intelligence and neural network prediction models into the study of sustainable building systems.
This study provides a new perspective for architects and building managers by coupling ecological and low-carbon technologies to achieve sustainable improvement in building systems. For example: (1) Design optimization: By evaluating the ecological emergy and carbon footprint of different design options, architects can make informed decisions to optimize the sustainability performance of buildings. They can identify areas of high energy consumption or carbon emissions and implement design strategies to minimize them. (2) Performance evaluation: These methods enable architects and building managers to assess the ecological and carbon performance of existing buildings. By quantifying the energy consumption and carbon emissions of a building throughout its life cycle, they can identify areas of inefficiency and prioritize improvements, leading to energy savings, cost reductions, and reduced environmental impact. (3) Decision-making support: Evaluating ecological emergy and carbon footprint provide data-driven information that supports decision-making processes. Architects and building managers can compare different design alternatives, material choices, or operational strategies based on their ecological and carbon impact. This helps in making more sustainable choices that align with environmental goals and regulatory requirements. (4) Communication and marketing: Highlighting the ecological emergy and low carbon footprint of a building can enhance its market value and reputation. Clients and stakeholders increasingly value sustainable design and construction practices. By quantifying and communicating the environmental benefits, architects and building managers can attract environmentally conscious clients, differentiate themselves in the market, and establish a positive brand image. Overall, the methods of ecological emergy and carbon footprint provide architects and building managers with essential tools to integrate sustainability considerations into their decision-making processes, helping them create more environmentally friendly and efficient buildings.
Author Contributions
Conceptualization, H.W.; methodology, H.W.; software, H.H., Z.H. and J.Z.; formal analysis, Q.Z., J.Z. and H.W.; investigation, H.H. and J.Z.; writing—original draft preparation, H.W. and H.H.; writing—review and editing, H.W. and H.H.; resources, H.W., H.H. and J.Z.; visualization, H.W. and H.H.; supervision, H.W. and Q.Z.; and funding acquisition, H.W. and Z.H. All authors have read and agreed to the published version of the manuscript.
Funding
This research was funded by the Doctoral Fund of Hubei University of Technology: “Research on the protection of modern educational architectural heritage from the perspective of sustainable development” (grant number BSQD2019044). Major Projects of Philosophical and Social Science Research in Universities in Jiangsu Province (grant number. 2023SJZD131). Research on protection and regeneration of modern educational buildings in Wuhan based on BIM technology (grant number IWHS20192017).
Institutional Review Board Statement
Not applicable.
Informed Consent Statement
Not applicable.
Data Availability Statement
The data presented in this study are available within this article.
Acknowledgments
The authors are thankful for the support from Hubei University of Technology, Jiangsu University of Science and Technology, Southeast University to conduct this research.
Conflicts of Interest
The authors declare no conflict of interest.
Appendix A

Table A1.
The emergy of building material production stage.
| Item | Basic Data | Unit | Carbon Emission Factors [39] | UEVs [19] |
|---|---|---|---|---|
| Steel | 2.06 × 10⁷ | Kg | 2.67 tCO2/t | 2.1 × 10¹² sej/kg |
| Cement | 3.88 × 10⁶ | Kg | 0.07 tCO2/t | 2.94 × 10¹² sej/kg |
| Gravel | 1.57 × 10⁶ | Kg | 16 kgCO2/kg | 1.27 × 10¹² sej/kg |
| Brick | 3.13 × 10⁶ | Kg | 0.24 kgCO2/kg | 2.79 × 10¹² sej/kg |
| Lime | 2.56 × 10⁵ | Kg | 0.44 tCO2/t | 1.28 × 10¹² sej/kg |
| Sand | 2.39 × 10⁶ | Kg | 2.51 kgCO2/t | 1.27 × 10¹² sej/kg |
| Water | 4.87 × 10⁵ | Kg | 0.82 kgCO2/m3 | 2.67 × 10⁹ sej/kg |
| Iron | 5.28 × 10⁵ | Kg | 2.05 tCO2/t | 3.15 × 10¹² sej/kg |
| Wood | 1.40 × 10⁶ | Kg | 0.31 kgCO2/kg | 6.68 × 10¹¹ sej/kg |
| Glass | 2.89 × 10⁵ | Kg | 1.4 kgCO2/kg | 1.07 × 10¹² sej/kg |
| Polyester | 3.79 × 10³ | Kg | 72.65 tCO2/t | 7.34 × 10¹² sej/kg |
| Adhesive | 6.43 × 10³ | Kg | 1.1 kgCO2/kg | 7.25 × 10¹¹ sej/kg |
| Bituminous | 7.50 × 10³ | Kg | 0.04 kgCO2/kg | 2.4 × 10¹² sej/kg |
| Aluminum | 5.20 × 10³ | Kg | 15.8 tCO2/t | 9.65 × 10¹¹ sej/kg |
| Ceramic tile | 3.88 × 10⁴ | Kg | 0.74 tCO2/t | 2.43 × 10¹² sej/kg |
| Polystyrene | 4.21 × 10³ | Kg | 3.78 kgCO2/kg | 5.23 × 10¹² sej/kg |
| Fly ash | 4.87 × 10³ | Kg | 0.18 tCO2/t | 1.78 × 10¹³ sej/kg |
| PVC | 6.10 × 10³ | Kg | 4.79 kgCO2/kg | 7.49 × 10¹² sej/kg |
| Diesel fuel | 4.21 × 10¹⁰ | J | 3.797 tCO2/t | 1.36 × 10⁵ sej/J |
Table A2.
The emergy of the building construction stage.
| Item | Data | Unit | UEVs |
|---|---|---|---|
| Land use | 4.74 × 10¹⁰ | J | 9.42 × 10⁴ sej/J |
| Solar | 3.56 × 10⁹ | J | 1.00 × 100 sej/J |
| Steel | 4.31 × 10⁶ | Kg | 3.53 × 10¹² sej/kg |
| PVC | 6.95 × 10³ | Kg | 7.49 × 10¹² sej/kg |
| Brass | 6.12 × 10³ | Kg | 1.33 × 10¹² sej/kg |
| Glass fiber | 6.95 × 10³ | Kg | 2.28 × 10¹² sej/kg |
| Iron | 2.42 × 10⁴ | Kg | 3.15 × 10¹² sej/kg |
| Ceramic | 4.81 × 10⁵ | Kg | 2.43 × 10¹² sej/kg |
| Glass | 3.48 × 10⁶ | Kg | 1.07 × 10¹² sej/kg |
| Cement | 4.41 × 10⁶ | Kg | 2.94 × 10¹² sej/kg |
| Water | 3.98 × 10⁴ | Kg | 2.67 × 10¹² sej/kg |
| Gravel | 4.98 × 10⁴ | Kg | 1.27 × 10¹² sej/kg |
| Steel | 3.81 × 10⁵ | Kg | 2.1 × 10¹² sej/kg |
| Aluminum | 4.89 × 10³ | Kg | 9.65 × 10¹¹ sej/kg |
| Glass wool | 7.47 × 10³ | Kg | 7.28 × 10¹² sej/kg |
| Brass | 7.04 × 10³ | Kg | 1.33 × 10¹³ sej/kg |
| Copper | 7.16 × 10³ | Kg | 1.52 × 10¹² sej/kg |
| Copper | 1.11 × 10⁴ | Kg | 1.52 × 10¹² sej/kg |
| Steel | 7.47 × 10⁵ | Kg | 2.1 × 10¹² sej/kg |
| Rubber | 5.78 × 10⁴ | Kg | 5.48 × 10¹² sej/kg |
| Polyester | 6.47 × 10⁴ | Kg | 7.34 × 10¹² sej/kg |
| Iron | 4.50 × 10⁴ | Kg | 3.15 × 10¹² sej/kg |
| Ceramics | 5.61 × 10⁴ | Kg | 2.43 × 10¹² sej/kg |
| Plastic | 8.22 × 10⁴ | Kg | 4.37 × 10¹² sej/kg |
| Glass | 3.16 × 10⁴ | Kg | 1.07 × 10¹² sej/kg |
| Copper | 4.65 × 10⁴ | Kg | 1.52 × 10¹² sej/kg |
| PVC | 5.51 × 10⁴ | Kg | 7.49 × 10¹² sej/kg |
| Glass | 7.34 × 10⁴ | Kg | 1.07 × 10¹² sej/kg |
| Steel | 5.61 × 10⁴ | Kg | 2.1 × 10¹² sej/kg |
| Steel | 1.74 × 10⁵ | Kg | 2.1 × 10¹² sej/kg |
| Rubber | 4.40 × 10³ | Kg | 5.48 × 10¹² sej/kg |
| Iron | 7.38 × 10³ | Kg | 3.15 × 10¹² sej/kg |
| Glass | 7.49 × 10³ | Kg | 1.07 × 10¹² sej/kg |
| Diesel fuel | 6.47 × 10⁸ | J | 1.36 × 10⁵ sej/J |
Table A3.
The emergy of the building operation stage.
| Item | Data | Unit | UEVs |
|---|---|---|---|
| Solar | 6.14 × 10¹² | J | 1.00 × 100 sej/J |
| Electricity | 8.82 × 10¹⁵ | J | 6.39 × 10⁴ sej/J |
| Heat | 4.53 × 10¹² | J | 2.01 × 10⁶ sej/J |
| Water | 3.12 × 10⁸ | kg | 2.67 × 10⁹ sej/kg |
Table A4.
The emergy of the building renewal stage.
| Item | Data | Unit | UEVs |
|---|---|---|---|
| PVC | 8.69 × 10³ | Kg | 2.22 × 10¹¹ sej/kg |
| Cement | 3.60 × 10⁵ | Kg | 2.94 × 10¹² sej/kg |
| Water | 7.25 × 10⁶ | Kg | 2.67 × 10⁹ sej/kg |
| Diesel fuel | 5.15 × 10⁶ | Kg | 1.36 × 10⁵ sej/kg |
Table A5.
The emergy of the building demolition stage.
| Item | Data | Unit | UEVs |
|---|---|---|---|
| Glass | 3.23 × 10⁶ | Kg | 2.21 × 10¹¹ sej/kg |
| Iron | 1.73 × 10⁷ | Kg | 2.31 × 10¹¹ sej/kg |
| PVC | 1.32 × 10⁴ | Kg | 2.22 × 10¹¹ sej/kg |
| Aluminum | 2.02 × 10⁴ | Kg | 2.21 × 10¹¹ sej/kg |
| Bricks | 3.40 × 10⁴ | Kg | 2.03 × 10¹¹ sej/kg |
| Concrete | 7.00 × 10⁵ | Kg | 1.19 × 10¹² sej/kg |
| Diesel fuel | 5.46 × 10⁹ | J | 1.36 × 10⁵ sej/J |
References
- Goubran, S.; Walker, T.; Cucuzzella, C.; Schwartz, T. Green building standards and the United Nations’ Sustainable Development Goals. J. Environ. Manag. 2023, 326, 116552. [Google Scholar] [CrossRef] [PubMed]
- Guidetti, E.; Ferrara, M. Embodied energy in existing buildings as a tool for sustainable intervention on urban heritage. Sustain. Cities Soc. 2023, 88, 104284. [Google Scholar] [CrossRef]
- Noyce, G.L.; Smith, A.J.; Kirwan, M.L.; Rich, R.L. Oxygen priming induced by elevated CO2 reduces carbon accumulation and methane emissions in coastal wetlands. Nat. Geosci. 2023, 16, 63–68. [Google Scholar] [CrossRef]
- Jiang, P.; Sonne, C.; You, S. Dynamic Carbon-Neutrality Assessment Needed to Tackle the Impacts of Global Crises. Environ. Sci. Technol. 2022, 56, 9851–9853. [Google Scholar] [CrossRef] [PubMed]
- Chen, R.; Tsay, Y.-S.; Zhang, T. A multi-objective optimization strategy for building carbon emission from the whole life cycle perspective. Energy 2023, 262, 125373. [Google Scholar] [CrossRef]
- Du, Q.; Wang, Y.; Pang, Q.; Hao, T.; Zhou, Y. The dynamic analysis on low-carbon building adoption under emission trading scheme. Energy 2023, 263, 125946. [Google Scholar] [CrossRef]
- Zhang, J.; Ma, L. Urban ecological security dynamic analysis based on an innovative emergy ecological footprint method. Environ. Dev. Sustain. 2021, 23, 16163–16191. [Google Scholar] [CrossRef]
- Zhang, J.; Ma, L. Environmental Sustainability Assessment of a New Sewage Treatment Plant in China Based on Infrastructure Construction and Operation Phases. Emergy Analysis. Water 2020, 12, 484. [Google Scholar] [CrossRef]
- Oliveira, M.; Cocozza, A.; Zucaro, A.; Santagata, R.; Ulgiati, S. Circular economy in the agro-industry: Integrated environmental assessment of dairy products. Renew. Sustain. Energy Rev. 2021, 148, 111314. [Google Scholar] [CrossRef]
- Zhang, J.; Srinivasan, R.S.; Peng, C. A Systematic Approach to Calculate Unit Emergy Values of Cement Manufacturing in China Using Consumption Quota of Dry and Wet Raw Materials. Buildings 2020, 10, 128. [Google Scholar] [CrossRef]
- Zhang, J.; Zhang, H.; Asutosh, A.T.; Sun, N.; Fu, X.; Wang, H.; Li, X. Ecological sustainability assessment of building glass industry in China based on the point of view of raw material emergy and chemical composition. Environ. Sci. Pollut. Res. 2023, 30, 40670–40697. [Google Scholar] [CrossRef] [PubMed]
- Alibaba, M.; Pourdarbani, R.; Manesh, M.H.K.; Ochoa, G.V.; Forero, J.D. Thermodynamic, exergo-economic and exergo-environmental analysis of hybrid geothermal-solar power plant based on ORC cycle using emergy concept. Heliyon 2020, 6, e03758. [Google Scholar] [CrossRef] [PubMed]
- Yadegaridehkordi, E.; Hourmand, M.; Nilashi, M.; Alsolami, E.; Samad, S.; Mahmoud, M.; Alarood, A.A.; Zainol, A.; Majeed, H.D.; Shuib, L. Assessment of sustainability indicators for green building manufacturing using fuzzy multi-criteria decision making approach. J. Clean. Prod. 2020, 277, 122905. [Google Scholar] [CrossRef]
- Paneru, S.; Jahromi, F.F.; Hatami, M.; Roudebush, W.; Jeelani, I. Integration of Emergy Analysis with Building Information Modeling. Sustainability 2021, 13, 7990. [Google Scholar] [CrossRef]
- Wang, J.; Xu, S.; Ma, G.; Gou, Q.; Zhao, P.; Jia, X. Emergy analysis and optimization for a solar-driven heating and cooling system integrated with air source heat pump in the ultra-low energy building. J. Build. Eng. 2023, 63, 105467. [Google Scholar] [CrossRef]
- Thomas, T.; Praveen, A. Emergy parameters for ensuring sustainable use of building materials. J. Clean. Prod. 2020, 276, 122382. [Google Scholar] [CrossRef]
- Yi, H.; Srinivasan, R.S.; Braham, W.W.; Tilley, D.R. An ecological understanding of net-zero energy building: Evaluation of sustainability based on emergy theory. J. Clean. Prod. 2017, 143, 654–671. [Google Scholar] [CrossRef]
- Li, D.; Du, B.; Zhu, J. Evaluating old community renewal based on emergy analysis: A case study of Nanjing. Ecol. Model. 2021, 449, 109550. [Google Scholar] [CrossRef]
- Chen, X.; Wang, H.; Zhang, J.; Zhang, H.; Asutosh, A.T.; Wu, G.; Wei, G.; Shi, Y.; Yang, M. Sustainability Study of a Residential Building near Subway Based on LCA-Emergy Method. Buildings 2022, 12, 679. [Google Scholar] [CrossRef]
- Cui, W.; Hong, J.; Liu, G.; Li, K.; Huang, Y.; Zhang, L. Co-Benefifits Analysis of Buildings Based on Different Renewal Strategies: The Emergy-Lca Approach. Int. J. Environ. Res. Public Health 2021, 18, 592. [Google Scholar] [CrossRef]
- Wang, H.; Liu, Y.; Zhang, J.; Zhang, H.; Huang, L.; Xu, D.; Zhang, C. Sustainability Investigation in the Building Cement Production System Based on the LCA-Emergy Method. Sustainability 2022, 14, 16380. [Google Scholar] [CrossRef]
- Hu, S.; Zhang, Y.; Yang, Z.; Yan, D.; Jiang, Y. Challenges and opportunities for carbon neutrality in China’s building sector—Modelling and data. Build. Simul. 2022, 15, 1899–1921. [Google Scholar] [CrossRef]
- Zhang, N.; Luo, Z.; Liu, Y.; Feng, W.; Zhou, N.; Yang, L. Towards low-carbon cities through building-stock-level carbon emission analysis: A calculating and mapping method. Sustain. Cities Soc. 2022, 78, 103633. [Google Scholar] [CrossRef]
- Gan, L.; Liu, Y.; Shi, Q.; Cai, W.; Ren, H. Regional inequality in the carbon emission intensity of public buildings in China. Build. Environ. 2022, 225, 109657. [Google Scholar] [CrossRef]
- Huo, T.; Ma, Y.; Xu, L.; Feng, W.; Cai, W. Carbon emissions in China’s urban residential building sector through 2060: A dynamic scenario simulation. Energy 2022, 254, 124395. [Google Scholar] [CrossRef]
- Wang, X.; Du, Q.; Lu, C.; Li, J. Exploration in carbon emission reduction effect of low-carbon practices in prefabricated building supply chain. J. Clean. Prod. 2022, 368, 133153. [Google Scholar] [CrossRef]
- Lou, Y.; Yang, Y.; Ye, Y.; He, C.; Zuo, W. The economic impacts of carbon emission trading scheme on building retrofits: A case study with U.S. medium office buildings. Build. Environ. 2022, 221, 109311. [Google Scholar] [CrossRef]
- Liu, W.; Zuo, B.; Qu, C.; Ge, L.; Shen, Q. A reasonable distribution of natural landscape: Utilizing green space and water bodies to reduce residential building carbon emissions. Energy Build. 2022, 267, 112150. [Google Scholar] [CrossRef]
- Gan, L.; Ren, H.; Cai, W.; Wu, K.; Liu, Y.; Liu, Y. Allocation of carbon emission quotas for China’s provincial public buildings based on principles of equity and efficiency. Build. Environ. 2022, 216, 108994. [Google Scholar] [CrossRef]
- Grinham, J.; Fjeldheim, H.; Yan, B.; Helge, T.D.; Edwards, K.; Hegli, T.; Malkawi, A. Zero-carbon balance: The case of House Zero. Build. Environ. 2022, 207, 108511. [Google Scholar] [CrossRef]
- Zhang, Y.; Jiang, X.; Cui, C.; Skitmore, M. BIM-based approach for the integrated assessment of life cycle carbon emission intensity and life cycle costs. Build. Environ. 2022, 226, 109691. [Google Scholar] [CrossRef]
- Kang, Y.; Xu, W.; Wu, J.; Li, H.; Liu, R.; Lu, S.; Rong, X.; Xu, X.; Pang, F. Study on comprehensive whole life carbon emission reduction potential and economic feasibility impact based on progressive energy-saving targets: A typical renovated ultra-low energy office. J. Build. Eng. 2022, 58, 105029. [Google Scholar] [CrossRef]
- Röck, M.; Saade, M.R.M.; Balouktsi, M.; Rasmussen, F.N.; Birgisdottir, H.; Frischknecht, R.; Habert, G.; Lützkendorf, T.; Passer, A. Embodied GHG emissions of buildings—The hidden challenge for effffective climate change mitigation. Appl. Energy 2020, 258, 114107. [Google Scholar] [CrossRef]
- Li, B.; Pan, Y.; Li, L.; Kong, M. Life Cycle Carbon Emission Assessment of Building Refurbishment: A Case Study of Zero-Carbon Pavilion in Shanghai Yangpu Riverside. Appl. Sci. 2022, 12, 9989. [Google Scholar] [CrossRef]
- Petrović, B.; Zhang, X.; Eriksson, O.; Wallhagen, M. Life Cycle Cost Analysis of a Single-Family House in Sweden. Buildings 2021, 11, 215. [Google Scholar] [CrossRef]
- He, M.; Ma, H. Ecological efect life cycle assessment of house buildings based on emergy footprint model. Sci. Rep. 2023, 13, 16441. [Google Scholar] [CrossRef]
- Wang, J.; Liu, W.; Sha, C.; Zhang, W.; Liu, Z.; Wang, Z.; Wang, R.; Du, X. Evaluation of the impact of urban morphology on commercial building carbon emissions at the block scale—A study of commercial buildings in Beijing. J. Clean. Prod. 2023, 408, 137191. [Google Scholar] [CrossRef]
- Odum, H.T. Environmental Accounting. Emergy and Environmental Decision Making; John and Wiley and Sons: Hoboken, NJ, USA, 1996; pp. 32–34. [Google Scholar]
- Intergovernmental Panel on Climate Change (IPCC). Climate Change 2014: Mitigation of Climate Change. Contribution of Working Group III to the Fifth Assessment Report of the Intergovernmental Panel on Climate Change; World Meteorological Organization (WMO) and United Nations Environment Programme (UNEP): New York, NY, USA, 2014. [Google Scholar]
- Guinée, J.B. (Ed.) Handbook on Life Cycle Assessment: Operational Guide to the ISO Standards; Springer: Berlin/Heidelberg, Germany, 2018. [Google Scholar]
- Weidema, B.P.; Norris, G.A. Comparative life cycle assessment: Towards best practice in product carbon footprinting. J. Ind. Ecol. 2019, 23, 563–574. [Google Scholar]
- Hellweg, S.; Canals, L.M. (Eds.) Handbook of Life Cycle Assessment (LCA) of Textiles and Clothing; Woodhead Publishing: Cambridge, UK, 2014. [Google Scholar]
- Andrić, I.; Pina, A.; Ferrão, P.; Lacarrière, B.; Le Corre, O. The impact of renovation measures on building environmental performance: An emergy approach. J. Clean. Prod. 2017, 162, 776–790. [Google Scholar] [CrossRef]
- GB/T 51366-2019; Standard for Building Carbon Emission Calculation in China. Ministry of Housing and Urban-Rural Development of the People’s Republic of China: Beijing, China, 2019. Available online: http://zjj.panzhihua.gov.cn/ztzl/szsnjnljxc/jsbz/4207183.shtml (accessed on 1 September 2023).
- Ding, P.; Guo, S.; Wang, D.; Yang, Z. Emergy-based evaluation of the energy-saving effect of building retrofitting: A case study in China. Energy Build. 2019, 182, 305–315. [Google Scholar]
- Li, J.; Zhang, X.; Sun, H.; Xu, W. Emergy analysis of energy consumption and environmental impact in China’s construction industry. J. Clean. Prod. 2020, 258, 120741. [Google Scholar]
- GB 50352-2019; Uniform Standard for Civil Building Design. Ministry of Housing and Urban-Rural Development of the People’s Republic of China: Beijing, China, 2019. Available online: https://www.mohurd.gov.cn/gongkai/zhengce/zhengcefilelib/201905/20190530_240715.html (accessed on 1 September 2023).
- CPCD, China Products Carbon Footprint Factors Database. Available online: lca.cityghg.com (accessed on 28 October 2023).
- GB 55015-2021; General Code for Energy Efficiency and Renewable Energy Use in Buildings. Ministry of Housing and Urban-Rural Development of the People’s Republic of China: Beijing, China, 2021. Available online: https://www.mohurd.gov.cn/gongkai/zhengce/zhengcefilelib/202110/20211013_762460.html (accessed on 1 September 2023).
- Xu, Q.; Wang, Y. Emergy evaluation of the ecological performance for green buildings: A review. Renew. Sustain. Energy Rev. 2019, 113, 109302. [Google Scholar]
- Zhang, H.; Zhou, P.; Li, B. Emergy-based life cycle assessment of buildings: A critical review. Renew. Sustain. Energy Rev. 2020, 130, 109964. [Google Scholar]
- Wang, Z.; Wu, S.; Gao, X. Emergy analysis of energy retrofit strategies in residential buildings: A case study in China. J. Clean. Prod. 2021, 284, 125507. [Google Scholar]
- Huang, Y.; He, C.; Chen, T. Comparing emergy analysis with life cycle assessment for building sustainability evaluation: A case study of a residential building in China. Build. Environ. 2022, 209, 108749. [Google Scholar]
- Ma, Y.; Zhang, X.; Li, M. Life cycle assessment and emergy evaluation of green roofs: A comparative study. J. Clean. Prod. 2022, 338, 129736. [Google Scholar]
Figure 1.
Research framework.
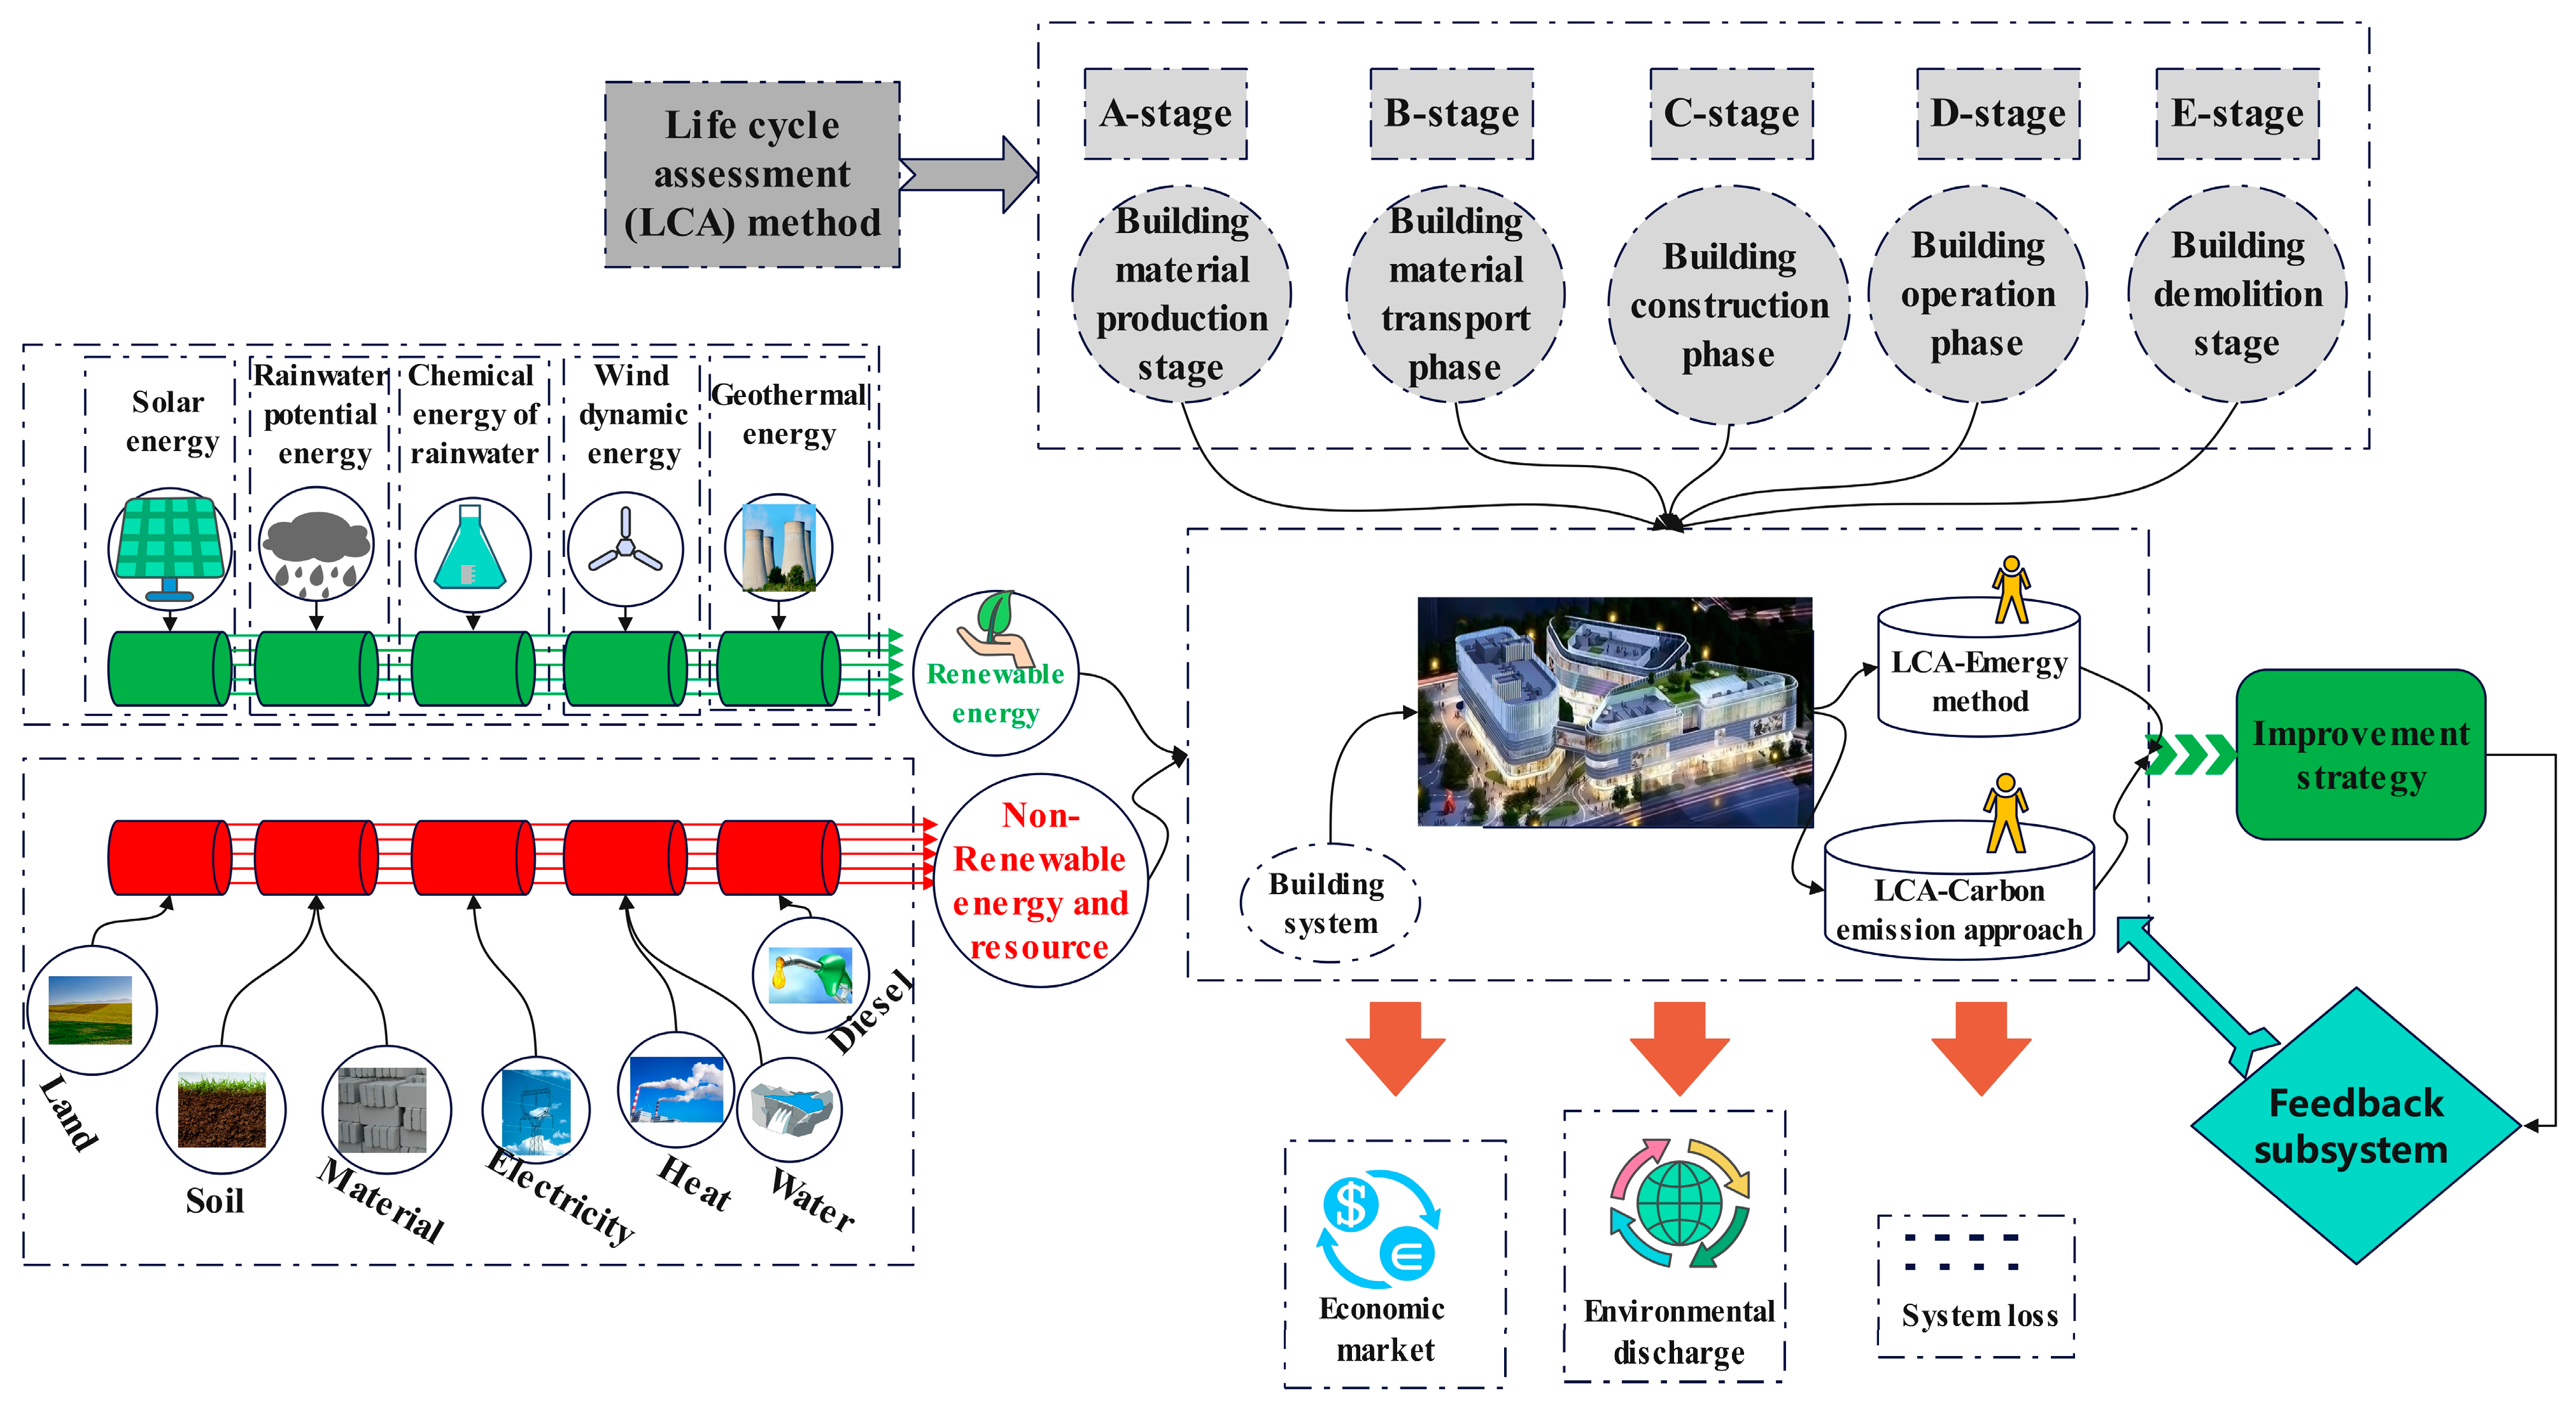
Figure 2.
LCA assessment process for building systems.

Figure 3.
The carbon emission of five processes.

Figure 4.
Three typical feedback systems.

Figure 5.
Case selection and ecological measures.

Figure 6.
Data processing structure diagram.

Figure 7.
Emergy analysis of the building system.

Figure 8.
Trends in sustainability indicators.

Figure 9.
Sustainability impact of the feedback system.

Figure 10.
Sensitivity analysis of six assumptions.

Figure 11.
Single trends in sensitivity analysis of the six assumptions.

Figure 12.
Distribution of carbon emissions.

Figure 13.
The carbon emission proportions of six subsystems. (A—Labor and service; B—Water supply and sewage system treatment facilities; C—Heating and cooling systems; D—Electricity installations; E—Telecommunications system; F—Elevator system).
Figure 13.
The carbon emission proportions of six subsystems. (A—Labor and service; B—Water supply and sewage system treatment facilities; C—Heating and cooling systems; D—Electricity installations; E—Telecommunications system; F—Elevator system).

Figure 14.
The carbon emission distribution of six subsystems. (A) Labor and service; (B) Water supply and sewage system treatment facilities; (C) Heating and cooling systems; (D) Electricity installations; (E) Telecommunications system; (F) Elevator system.
Figure 14.
The carbon emission distribution of six subsystems. (A) Labor and service; (B) Water supply and sewage system treatment facilities; (C) Heating and cooling systems; (D) Electricity installations; (E) Telecommunications system; (F) Elevator system.

Figure 15.
The carbon emission proportion of the building demolition stage.

Figure 16.
The sensitivity values of carbon emissions due to changes in the electrical data.

Figure 17.
Sustainable differences before and after.

Table 1.
Emergy calculation paths.
| Types | Equation and Explanations | |
|---|---|---|
| Solar irradiation emergy | (1) | |
| represents the solar emergy in the construction process. A refers to the site surface area. J represents the amount of solar radiation [39]. is the surface albedo (0.7). denotes the construction time. represents the unit emergy values. | ||
| Mass calculation | (2) | |
| represents the emergy of mass. refers to the amount of mass. represents the unit emergy value. | ||
| Electricity calculation | (3) | |
| represents the emergy of electricity in the building system. denotes the quantity of electricity. is the unit emergy value of electricity. | ||
| Water emergy calculation | (4) | |
| represents the water emergy. refers to the volume of water. is the density of water. G represents the Gibbs energy of water (4.92 J/g). denotes the transformity of water. represents the water emergy in the building operation stage. refers to the water | ||
| Diesel fuel emergy calculation | (5) | |
| represents the emergy of the diesel fuel. refers to the amount of diesel oil used in the building system. denotes the calorific value of diesel fuel. represents the unit emergy value of diesel fuel. | ||
| Gasoline emergy calculation | (6) | |
| represents the emergy of gasoline. refers to the quantity of gasoline used. denotes the calorific value of gasoline. represents the unit emergy of gasoline. | ||
| Human labor emergy calculation | (7) | |
| represents the emergy of human labor. refers to the working time, typically 8 hours. denotes the number of employed workers. represents the number of working days. is the unit emergy of human labor. | ||
Table 2.
Emergy indexes list.
| Indicators | Equations | Explanations |
|---|---|---|
| Emergy Yield Ratio (EYR) | The ecological emergy method quantifies the relationship between the emergy acquired and the emergy consumed within a system, providing a ratio that reflects the input–output dynamics of emergy in the system. | Output emergy/input emergy. |
| Environmental Loading Ratio (ELR) | By quantifying the environmental resources consumed per unit of energy output, the ecological emergy method evaluates the environmental burden produced by a system. This assessment provides insights into the extent of environmental impact resulting from the system’s operations. | Resource consumption emergy/Comprehensive output emergy. |
| Emergy Sustainability Indicator (ESI) | The ecological emergy method combines the EYR and ELR indicators to provide a comprehensive evaluation of a system’s sustainability. This approach offers a holistic assessment of both the system’s environmental impact and its efficiency in utilizing resources. | EYR/ELR |
Table 3.
Carbon sink pathways of this study.
| Types | Names | Equations | Explanations |
|---|---|---|---|
| Vegetation and Soil Carbon Reduction | Average Organic Carbon in vegetation units | is the soil bulk density; is the average organic carbon storage; is the thickness of the ith layer soil; is the average gravel content larger than 2 mm. | |
| Total Soil Organic Carbon in regional area | is the area of grid unit j, is the average organic carbon density of unit j; n is the total number of soil area grid units. | ||
| Carbon Reduction in Building Materials | Classic Concrete Carbonation Estimation Model Path | d is the carbonation depth. is the effective diffusion coefficient. is the concentration. is the amount of carbon dioxide absorbed of a volume of concrete. t is the carbonation time. |
Disclaimer/Publisher’s Note: The statements, opinions and data contained in all publications are solely those of the individual author(s) and contributor(s) and not of MDPI and/or the editor(s). MDPI and/or the editor(s) disclaim responsibility for any injury to people or property resulting from any ideas, methods, instructions or products referred to in the content. |
© 2023 by the authors. Licensee MDPI, Basel, Switzerland. This article is an open access article distributed under the terms and conditions of the Creative Commons Attribution (CC BY) license (https://creativecommons.org/licenses/by/4.0/).
Share and Cite
MDPI and ACS Style
Wang, H.; Huang, H.; Zhang, J.; Hu, Z.; Zhou, Q. Environmental Processes Assessment of a Building System Based on LCA–Emergy–Carbon Footprint Methodology. Processes 2023, 11, 3113. https://doi.org/10.3390/pr11113113
AMA Style
Wang H, Huang H, Zhang J, Hu Z, Zhou Q. Environmental Processes Assessment of a Building System Based on LCA–Emergy–Carbon Footprint Methodology. Processes. 2023; 11(11):3113. https://doi.org/10.3390/pr11113113
Chicago/Turabian StyleWang, Hechi, Haojun Huang, Junxue Zhang, Zhanfang Hu, and Qi Zhou. 2023. "Environmental Processes Assessment of a Building System Based on LCA–Emergy–Carbon Footprint Methodology" Processes 11, no. 11: 3113. https://doi.org/10.3390/pr11113113
Note that from the first issue of 2016, this journal uses article numbers instead of page numbers. See further details here.