Article

Deformation Characteristics and Permeability Properties of Cap Rocks in Gas Storage of Depleted Reservoirs under Alternating Load

1
State Key Laboratory of Geomechanics and Geotechnical Engineering, Institute of Rock and Soil Mechanics, Chinese Academy of Sciences, Wuhan 430071, China
2
University of Chinese Academy of Sciences, Beijing 100049, China
3
PipeChina West East Gas Pipeline Company, Shanghai 200120, China
*
Author to whom correspondence should be addressed.
Processes 2023, 11(11), 3114; https://doi.org/10.3390/pr11113114
Submission received: 24 July 2023 / Revised: 27 October 2023 / Accepted: 28 October 2023 / Published: 30 October 2023
(This article belongs to the Section Energy Systems)

Abstract

:
Gas reservoirs have significant engineering characteristics of injection and extraction. The reservoir cap rock is subjected to cyclic alternating loading and has the potential risk of seal failure. Therefore, it is necessary to study the stress−percolation−damage mechanism of the reservoir cap rock in depleted gas reservoirs. The rock Mechanics Test System (MTS) was used to study the permeability characteristics of a typical mud shale cap layer under different loading and unloading rates, analyze the deformation characteristics and permeability performance evolution law of the rock under the confining pressure alternation, and study the effects of loading and unloading rate, confining pressure and number of cycles on the permeability of the cap rock. The test results show that with the increase in the number of cycles, the hysteresis loop moves in the direction of axial strain increase offset. The overall morphology is presented as an elongated type, and the damage of the specimen is small in the cyclic confining pressure; At the beginning of the cycling period, the permeability decreases with the increase in the confining pressure in the form of a negative exponential. At the later stage of the cycling period, the permeability basically stays unchanged, and is maintained at a low level; At low confining pressure, permeability also decreases in a negative exponential form with the increase in the number of confining pressure cycles; The greater the loading and unloading rate at the beginning of the cycle, the more the permeability decreases; There is a tendency of sealing improvement under cyclic loading in the gas storage of depleted reservoirs with mud shale as the cap layer. The results of the study can provide technical parameters for the evaluation of the cap sealing of gas storage of depleted reservoirs.

1. Introduction

Gas storage in depleted gas reservoirs has many advantages such as a large gas storage scale, high safety factor, low investment, fast payback period, etc. It plays an irreplaceable role in emergency natural gas peaking and strategic reserves, and in ensuring energy security. Due to seasonal differences in natural gas demand, adequate reserves are the key to ensuring a stable supply. Moreover, poor gas prices in summer and winter, and natural gas peak bargaining are the main drivers for the development of gas storage in Europe and the United States [1]. In China’s natural gas “production, transportation, storage, marketing and use” system, “storage” is the weakest link. By the end of 2022, China had built 24 gas storage reservoirs, forming an engineering volume of about 190 × 108 m3, including 20 gas storage of depleted reservoirs and 4 salt cavern storage reservoirs. The engineering volume of gas storage reservoirs accounts for about 5% of natural gas consumption (2022), and there is still a large gap between the required for a safe reserve of about 15% [2,3]. According to the outlook of China’s natural gas consumption, it still needs to build a strategic reserve storage space of about 600 × 108 m3. The demand for gas storage space in China is huge, and accelerating the construction of gas storage is the first problem that must be solved to develop the natural gas industry. Sealability is the primary factor in determining the suitability of a gas reservoir for storage. More than 100 gas storage safety accidents have occurred worldwide, 10% of which are due to sealing failure of the gas storage cap rock [4,5]. The gas storage reservoir cap rock has a direct impact on the scale of the reservoir and the preservation of natural gas, and its sealing is a key issue related to the storability of the captive structure and the environmental safety, which determines the success of the site selection and construction of the gas storage reservoir [6]. Unlike oil and gas reservoir exploration and development studies, the evaluation of the sealability of the gas reservoir should not only evaluate the static sealability under the original stress state but also pre-consider the influence of the cap layer’s elastic-plastic deformation and fault slip misalignment under the cyclic injection and extraction alternating stress after the reservoir is built. It is also necessary to accurately assess the dynamic sealability under long-term alternating loads [7,8]. Therefore, in order to ensure the reservoir cap stability under the special working conditions of periodic high flow rate and strong injection and extraction of gas reservoirs, the study of the stress−percolation−damage mechanism under multi-field coupling of reservoir cap rocks in depleted gas reservoirs is carried out to provide a theoretical basis for reservoir operation upper limit pressure optimization. It is important to improve the gas storage efficiency and guarantee the long-term stability of gas storage.
Many scholars have conducted rock stress sensitivity experiments to study the variation pattern of permeability of rock samples with increasing/decreasing confining pressure/effective stress. The relationship between sandstone permeability and overlying formation pressure is investigated by Fatt and Davis [9]. The results show that the relationship between permeability and overburden pressure is negatively correlated and varies significantly in the low-pressure area. Zhang et al. [10] have conducted triaxial compression tests to establish the relationship between stress−strain curves and permeability coefficients. Wang et al. [11] have studied the deformation characteristics and mechanical parameters of limestone under different unloading pressures and velocities. Dong et al. [12] have tested that the stress sensitivity of permeability and porosity of shale is much greater than that of sandstone. Liu et al. [13] indicate that crack closure is the main factor leading to the reduction in shale permeability. During the natural gas injection and production process, the reservoir cap rock will be subjected to alternating loads resulting in changes in effective stress. Cracks within the rock will open or close, resulting in changes in rock pore structure, permeability, mechanical strength, and other parameters [14]. Jiang et al. [15] have designed a cyclic loading test to investigate permeability, acoustic emission properties and energy dissipation properties and have established damage variables for coal and energy dissipation. Meng et al. [16,17,18] have studied the variation law of permeability of coal rock, granite, sandstone, and volcanic ash under cyclic loading under different confining pressures by MTS815 rock mechanics experiments. The strength, deformation characteristics, and expansion characteristics of the rocks are also discussed. Zhang et al. [14] establish a damage intrinsic model of the cap layer by conducting simultaneous permeability testing experiments with triaxial cyclic loading and unloading. The permeability change law and damage law of the rock under cyclic loading are studied. Yuan Xi et al. [19] find that the deformation of coal samples under each unloading condition has obvious step-like characteristics by conducting three different unloading tests under different unloading conditions, such as constant axial pressure unloading, increasing axial pressure unloading, and axial pressure unloading at the same time. Zhang et al. [20] find that the rock deformation gradually changes from elastic to plastic and finally ruptures with the continuous unloading of the confining pressure by conducting rheological tests of unloading the confining pressure under different stress paths.
Previous research has mostly been conducted using a single factor, such as simple axial loading and unloading, or confining pressure unloading path to obtain the law of strength deformation damage. However, the engineering characteristic of “strong injection and extraction” of gas reservoirs makes the cap rock always under the cyclic load of pressurization and decompression. The current gas reservoir cap evaluation system is still based on the static analysis method targeting the current state of the cap rock. Static analysis methods have achieved relatively rich research results, while the evolution of cover confinement under alternating injection and extraction is less studied [21,22]. The static method makes it more difficult to comprehensively evaluate the actual seal performance of the gas reservoir cap. Research on the effects of multi-period stress changes and intermittent periods of stress changes on permeability, especially the rock mechanical properties and permeability evolution patterns under alternating confining pressure, has not received much attention from researchers. The engineering of gas reservoirs is characterized by the unloading−loading process of the confining pressure, while the study of permeability characteristics in this process has a clear research application scenario. Therefore, we investigated the deformation characteristics and the evolution of permeability performance of the cap rock of the gas reservoir with different loading and unloading rates of the confining pressure. The effect of loading and unloading rate, confining pressure and number of cycles on the reservoir cap permeability was obtained. This research result can provide technical parameters for the evaluation of gas reservoir cap sealing in depleted gas reservoirs.

2. Experimental Methodology

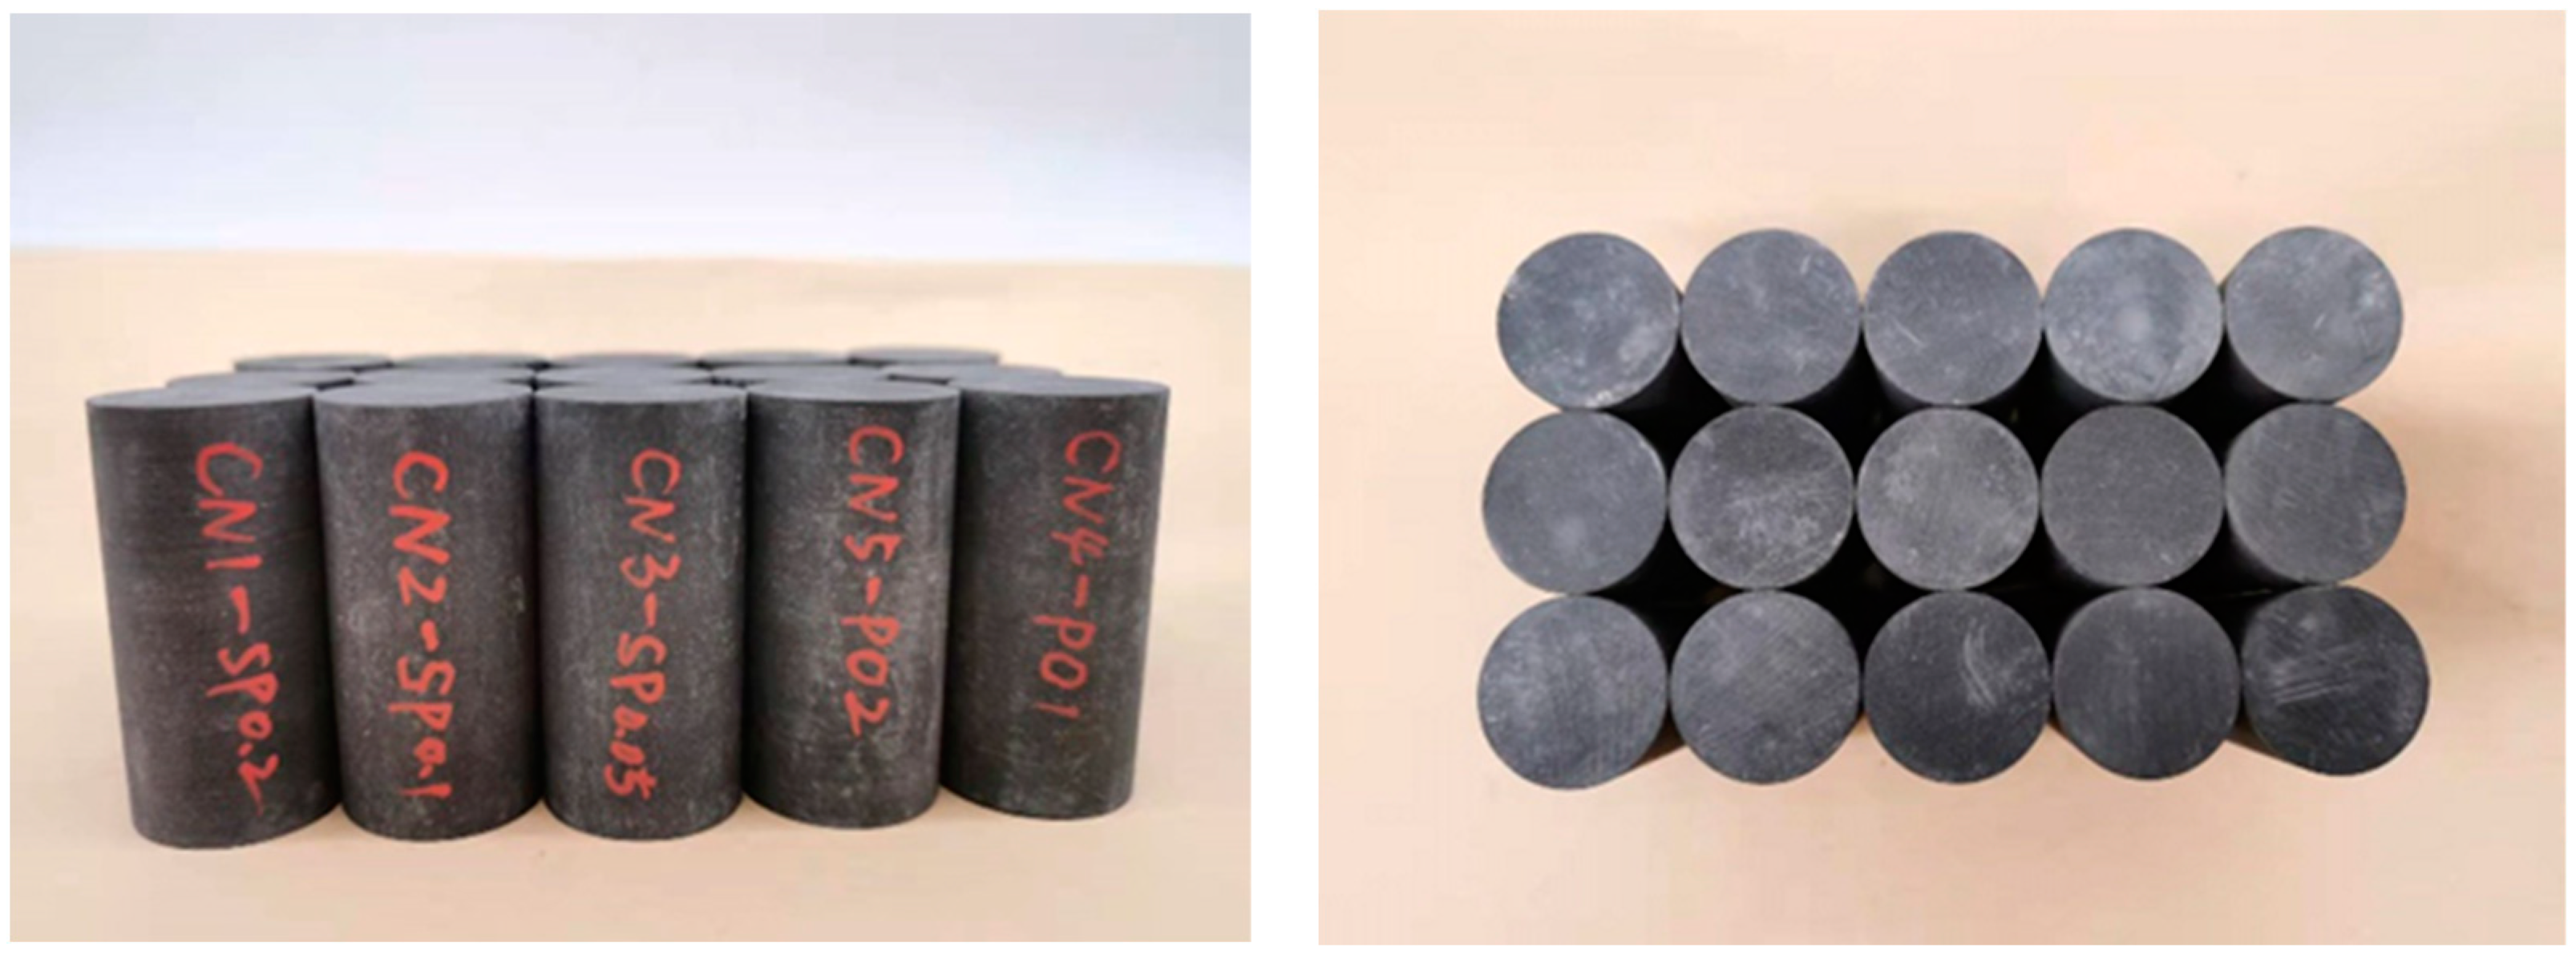
2.1. Rock Material and Sample Preparation

The specimens were taken from Changning County, Yibin City, Sichuan Province, which is a mud shale of Longmaxi Formation with uniaxial compressive strength of 74.7 MPa and modulus of elasticity of 11.42 GPa. Its mineral composition is shown in Table 1. The specimens were processed using the International Society of Rock Mechanics (ISRM) standard. Samples were processed into standard cylinders by wire cutting along the vertical laminae direction from the same bulk rock, with 25 mm diameter and 50 mm length, ensuring as much as possible that it would minimize the effect of the shale’s anisotropy on the experimental results. The upper and lower surfaces were dry-polished, and the parallelism was controlled within ±0.03 mm. The processed specimens are shown in Figure 1.

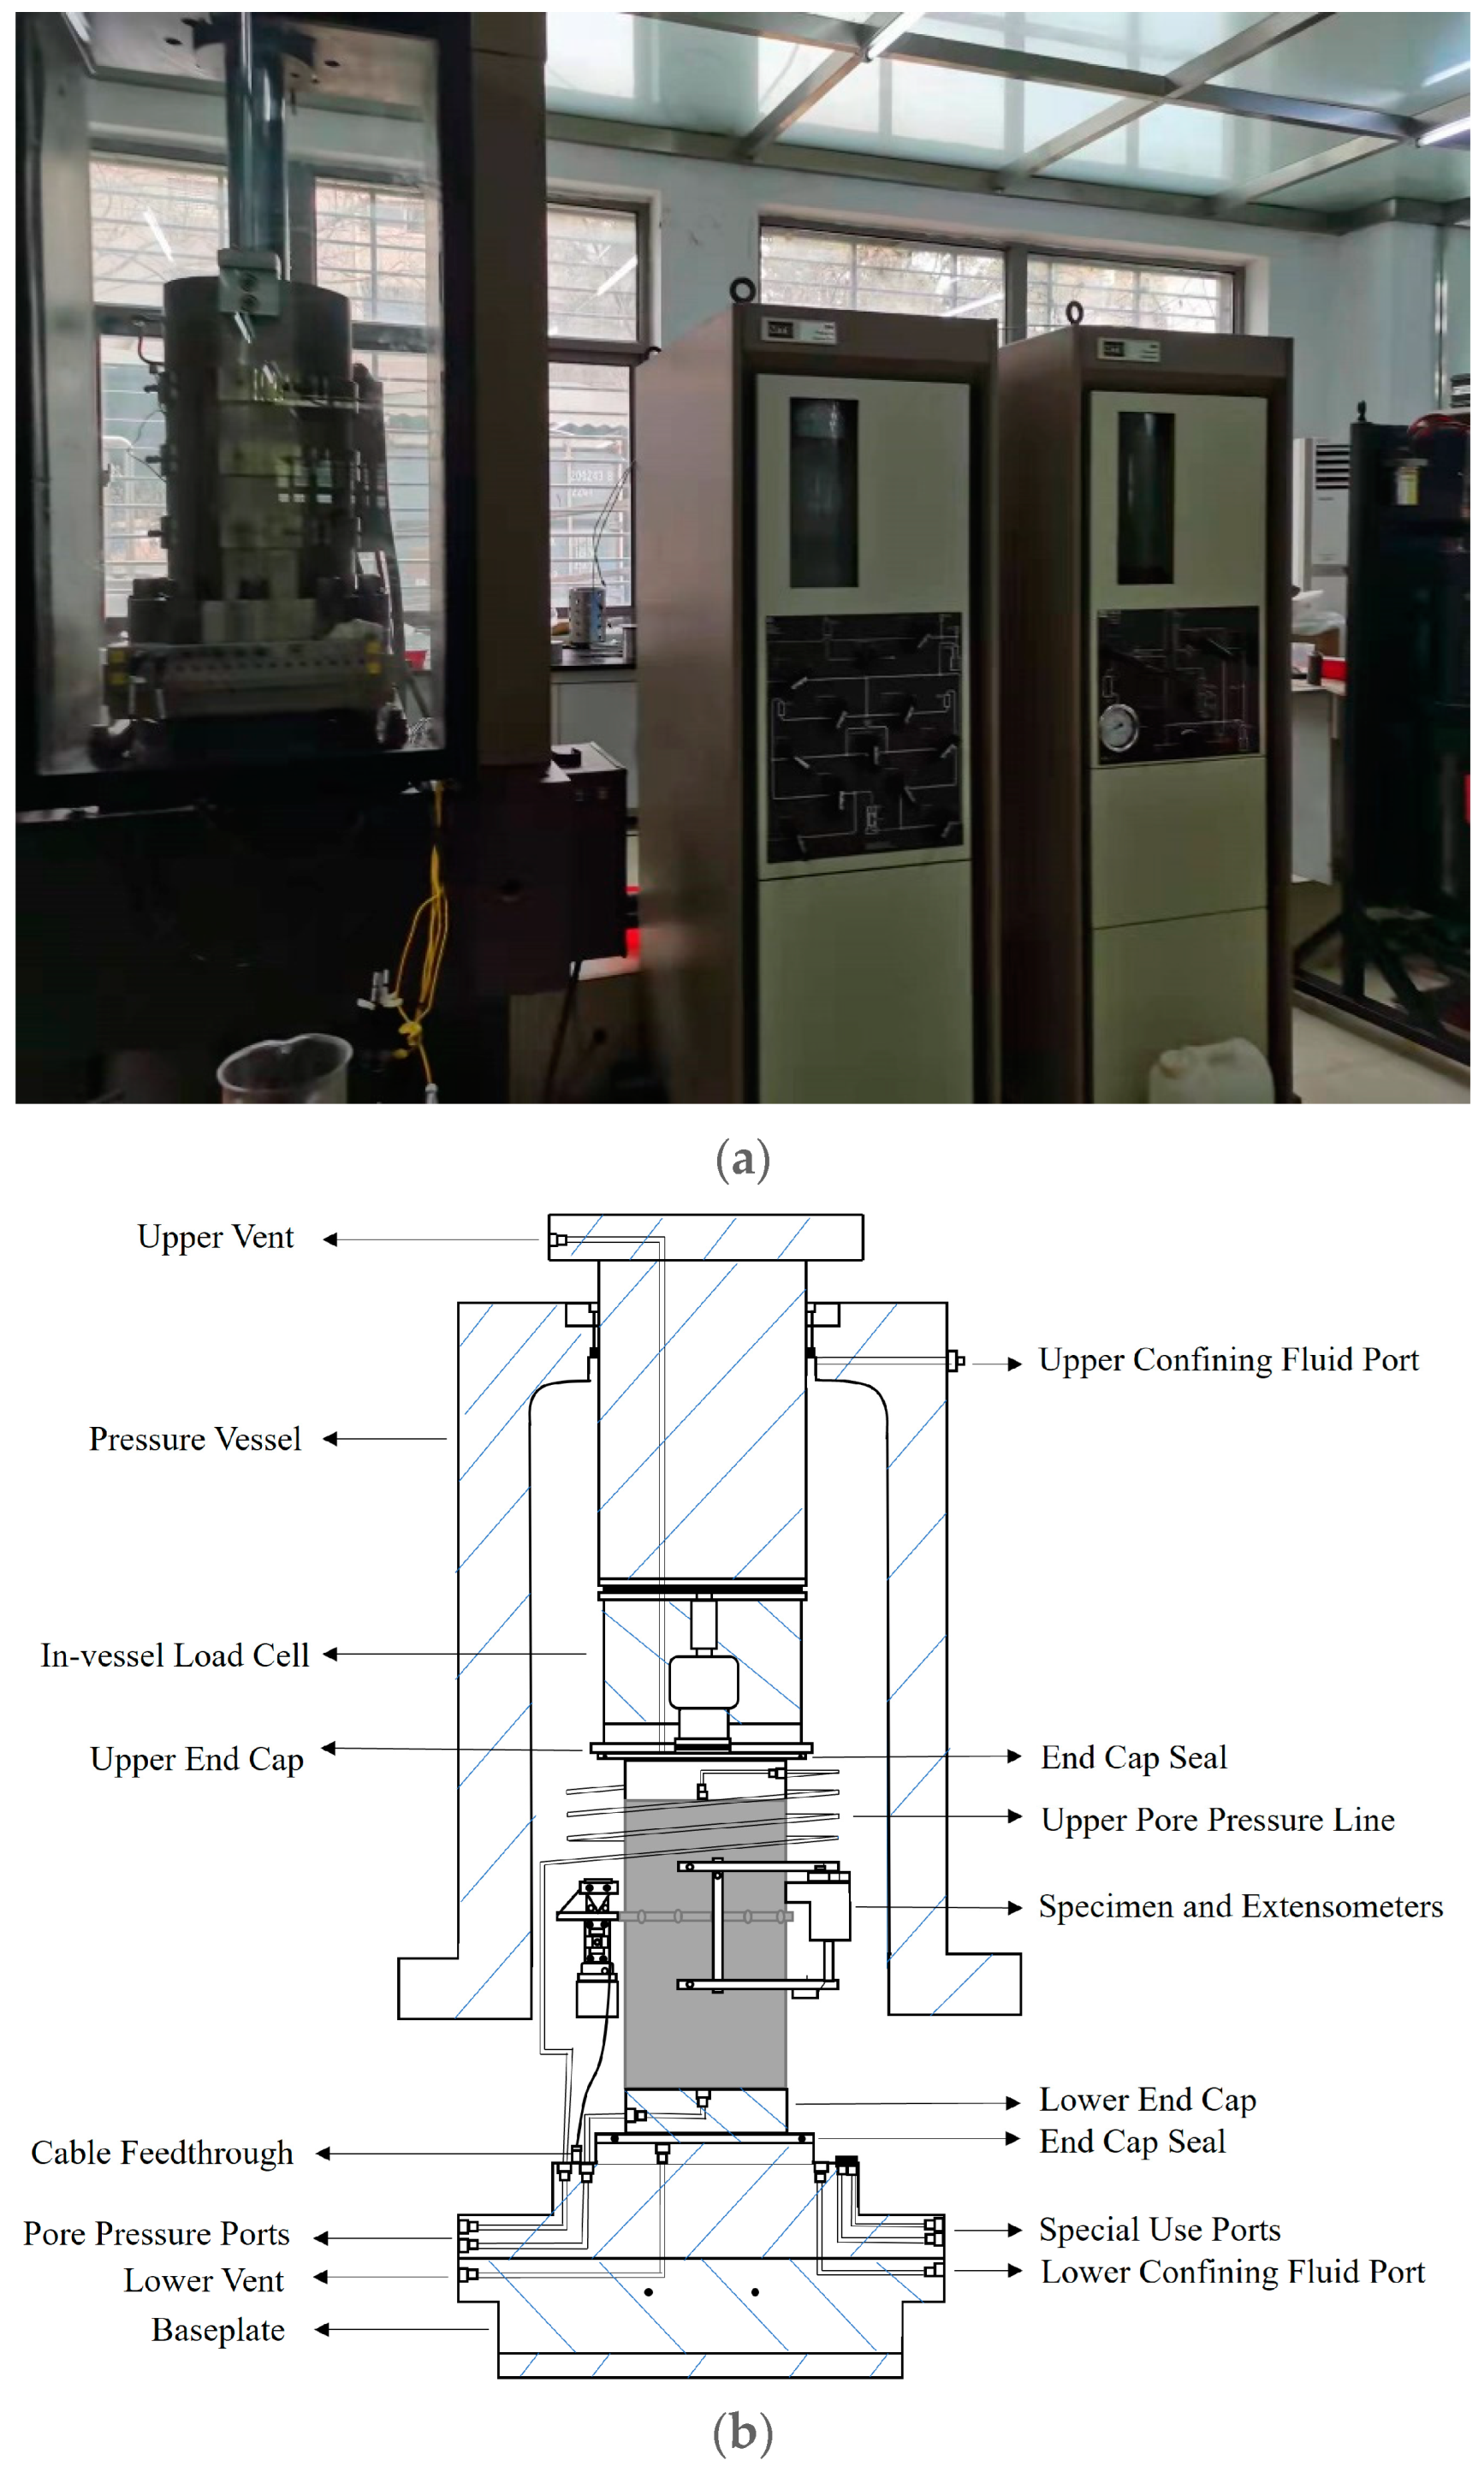
2.2. Lab Test Apparatus
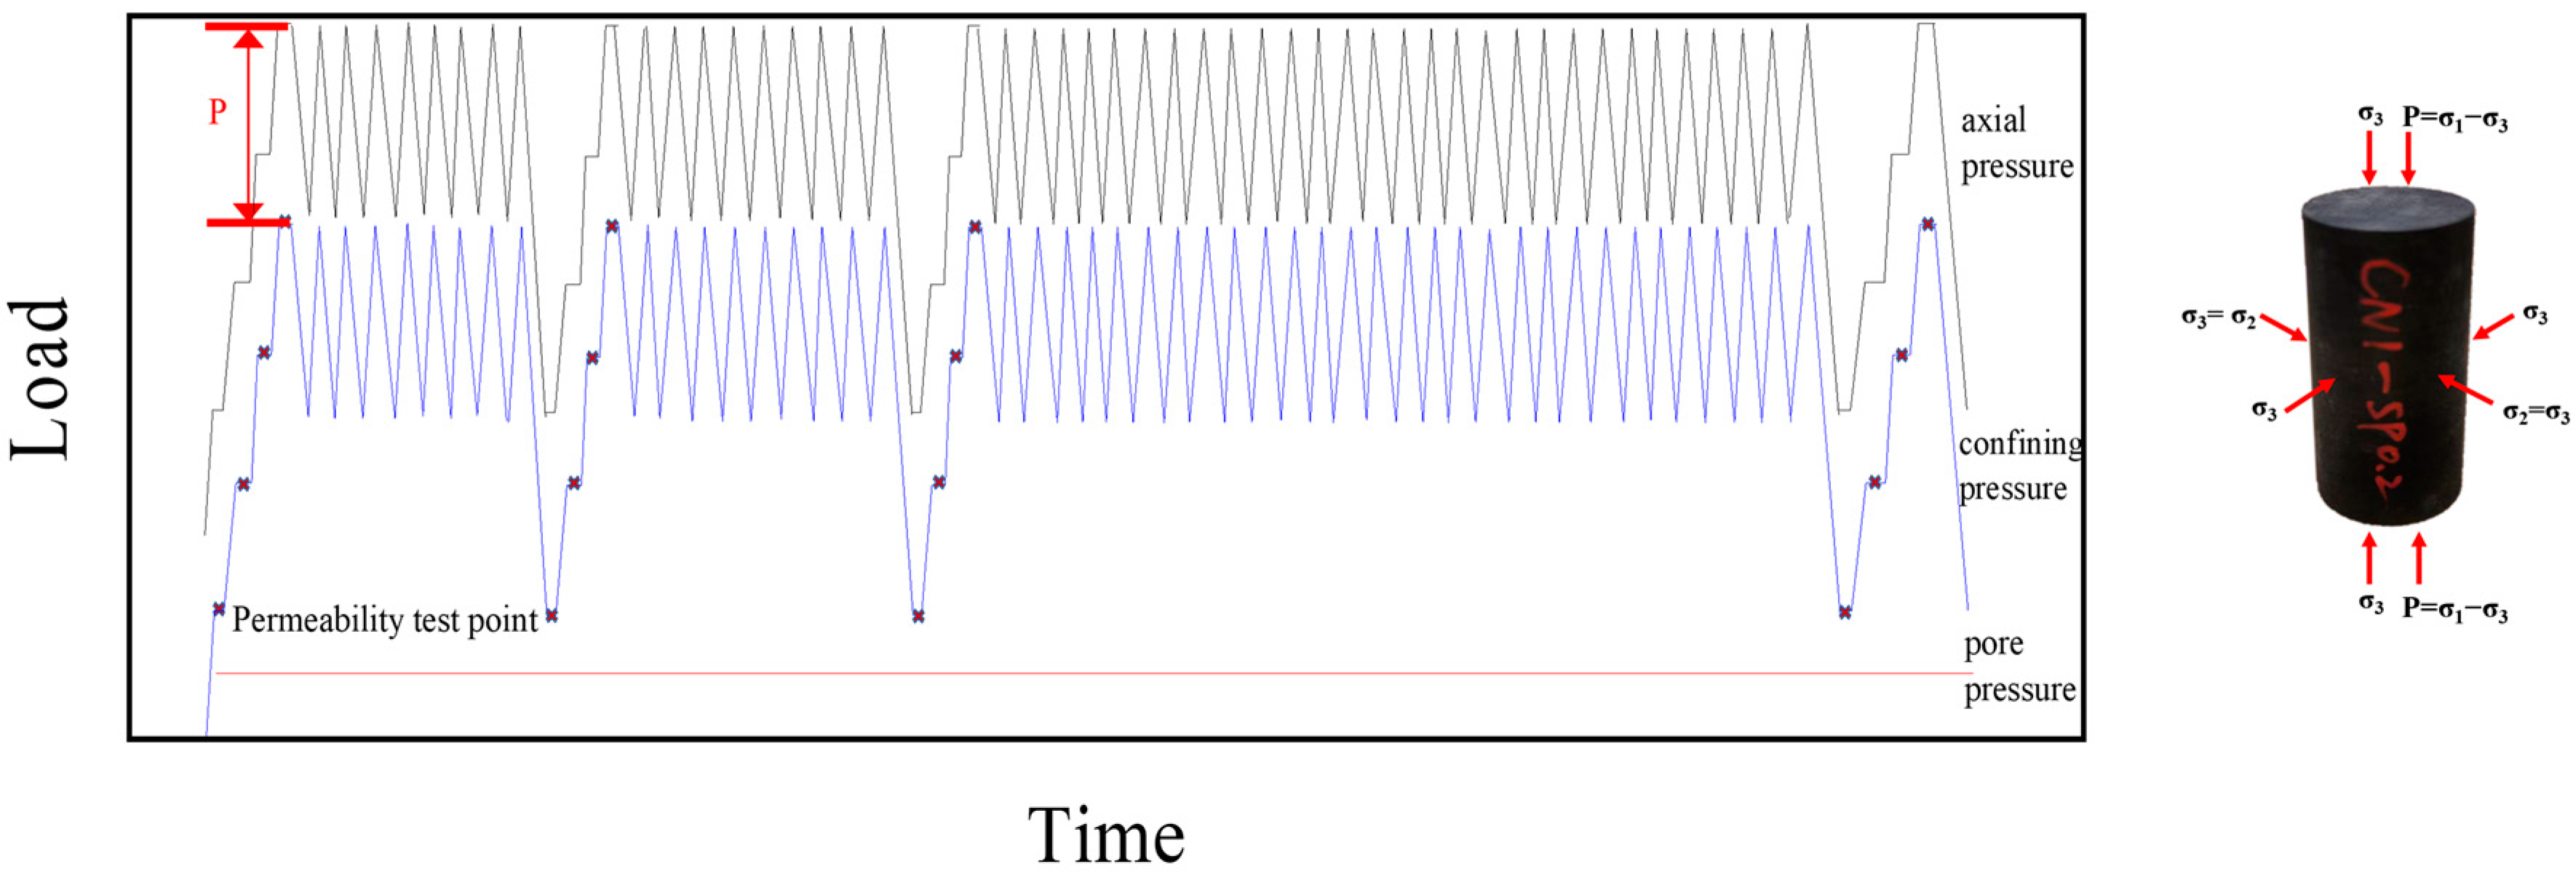
The test is based on the MTS815.04 rock mechanics test system of the State Key Laboratory of Wuhan Institute of Geotechnics, Chinese Academy of Sciences. The test apparatus is shown in Figure 2. Main technical parameters: (1) vertical maximum output force: 4600 kN; (2) vertical piston stroke: 100 mm; (3) maximum confining pressure: 140 MPa; (4) strain rate adaptation range: 10−2~10−7 1/s; (5) fatigue frequency: 0.001~0.5 Hz; (6) overall stiffness of test frame: 11.0 × 10⁹ N/m.
The test system is loaded smoothly, with high accuracy of measurement and control. All test processes and data are controlled and collected by computer, avoiding misreadings and errors of manual readings.

2.3. Test Scheme

For the reservoir cap, simulating the effective stress changes in the formation caused by gas injection and extraction with cyclic confining pressure and fixed pore pressure tests is closer to the real situation than cyclic pore pressure and fixed confining pressure tests. Three sets of tests were set up to investigate the effects of different confining pressures, loading and unloading rates, and number of cycles on the deformation behavior and permeability evolution of mud shale. The specimens were numbered as CN1−SP0.2, CN2−SP0.1 and CN3−SP0.05, respectively. The specific scheme is listed in Table 2.
Considering the test conditions and the duration of the test, we selected three different rates for the confining pressure to qualitatively investigate the effect of loading and unloading rates on the permeability and deformation characteristics of the rock. The loading rate of deviatoric stress and pore pressure was 0.2 MPa/s for all three groups. The confining pressure loading and unloading rates were 0.2 MPa/s, 0.1 MPa/s and 0.05 MPa/s for CN1−SP0.2, CN2−SP0.1 and CN3−SP0.05 specimens, respectively. Based on the S6 depleted gas reservoir storage, the difference in pore pressure during working is 15 MPa, which can be regarded as an effective stress change of 15 MPa. So, the cyclic upper and lower limit difference of the experimental design of the confining pressure is 15 MPa. Since the specimen is shale, it is difficult to load on a very high pore pressure under the experimental conditions, so a pore pressure of 5 MPa that could be achieved was selected. Simultaneous cycling of confining pressure and axial pressure keeps the effective stress cycling between 20 and 35 MPa. In the real injection and extraction process, the rate is small. It is difficult to test at the real rate in the labs. So, three rates are selected to qualitatively study the effect of rate. Keeping the deviatoric stress and pore pressure constant, the cyclic loading and unloading tests of confining pressure were conducted at the rate of 0.2 MPa/s, 0.1 MPa/s and 0.05 MPa/s, and the cyclic range of the confining pressures was 25 MPa to 40 MPa. The permeability was tested at 10, 20, 30 and 40 MPa for the 1st, 10th, 20th and 50th cycles, respectively. The cyclic loading and unloading paths are shown in Figure 3.

2.4. Test Procedure

Step 1: Wrap the sample with a heat-shrinkable tube and add strain gauges in the annulus direction for recording the radial displacement. Then, load it onto the MTS rock mechanics experiment system and record the axial displacement using LVDT sensors (Figure 4).
Step 2: Preload the deviatoric stress to 1 MPa, then apply the confining pressure and pore pressure sequentially. Finally, load the deviatoric stress to the set value.
Step 3: Keeping the state constant and saturate the rock sample for 3 h before the first measurement point.
Step 4: Use the transient method of liquid measurement of permeability. Before measurement, each pressure point is stabilized for 10 min. Set the inlet pressure at 6 MPa and outlet pressure at 1 MPa, which is equivalent to the initial value of the pore pressure of the rock sample at 5 MPa. Rest for 1 h, and obtain the curve of the pressure difference between the outlet and inlet decreasing with time.
Step 5: According to the test scheme, the cycles of the confining pressure are carried out at different rates of loading and unloading, and the permeability is measured at different confining pressures and different cycle times. The force and displacement changes throughout the test are also recorded.

3. Results and Discussion

3.1. Deformation Characteristics Analysis

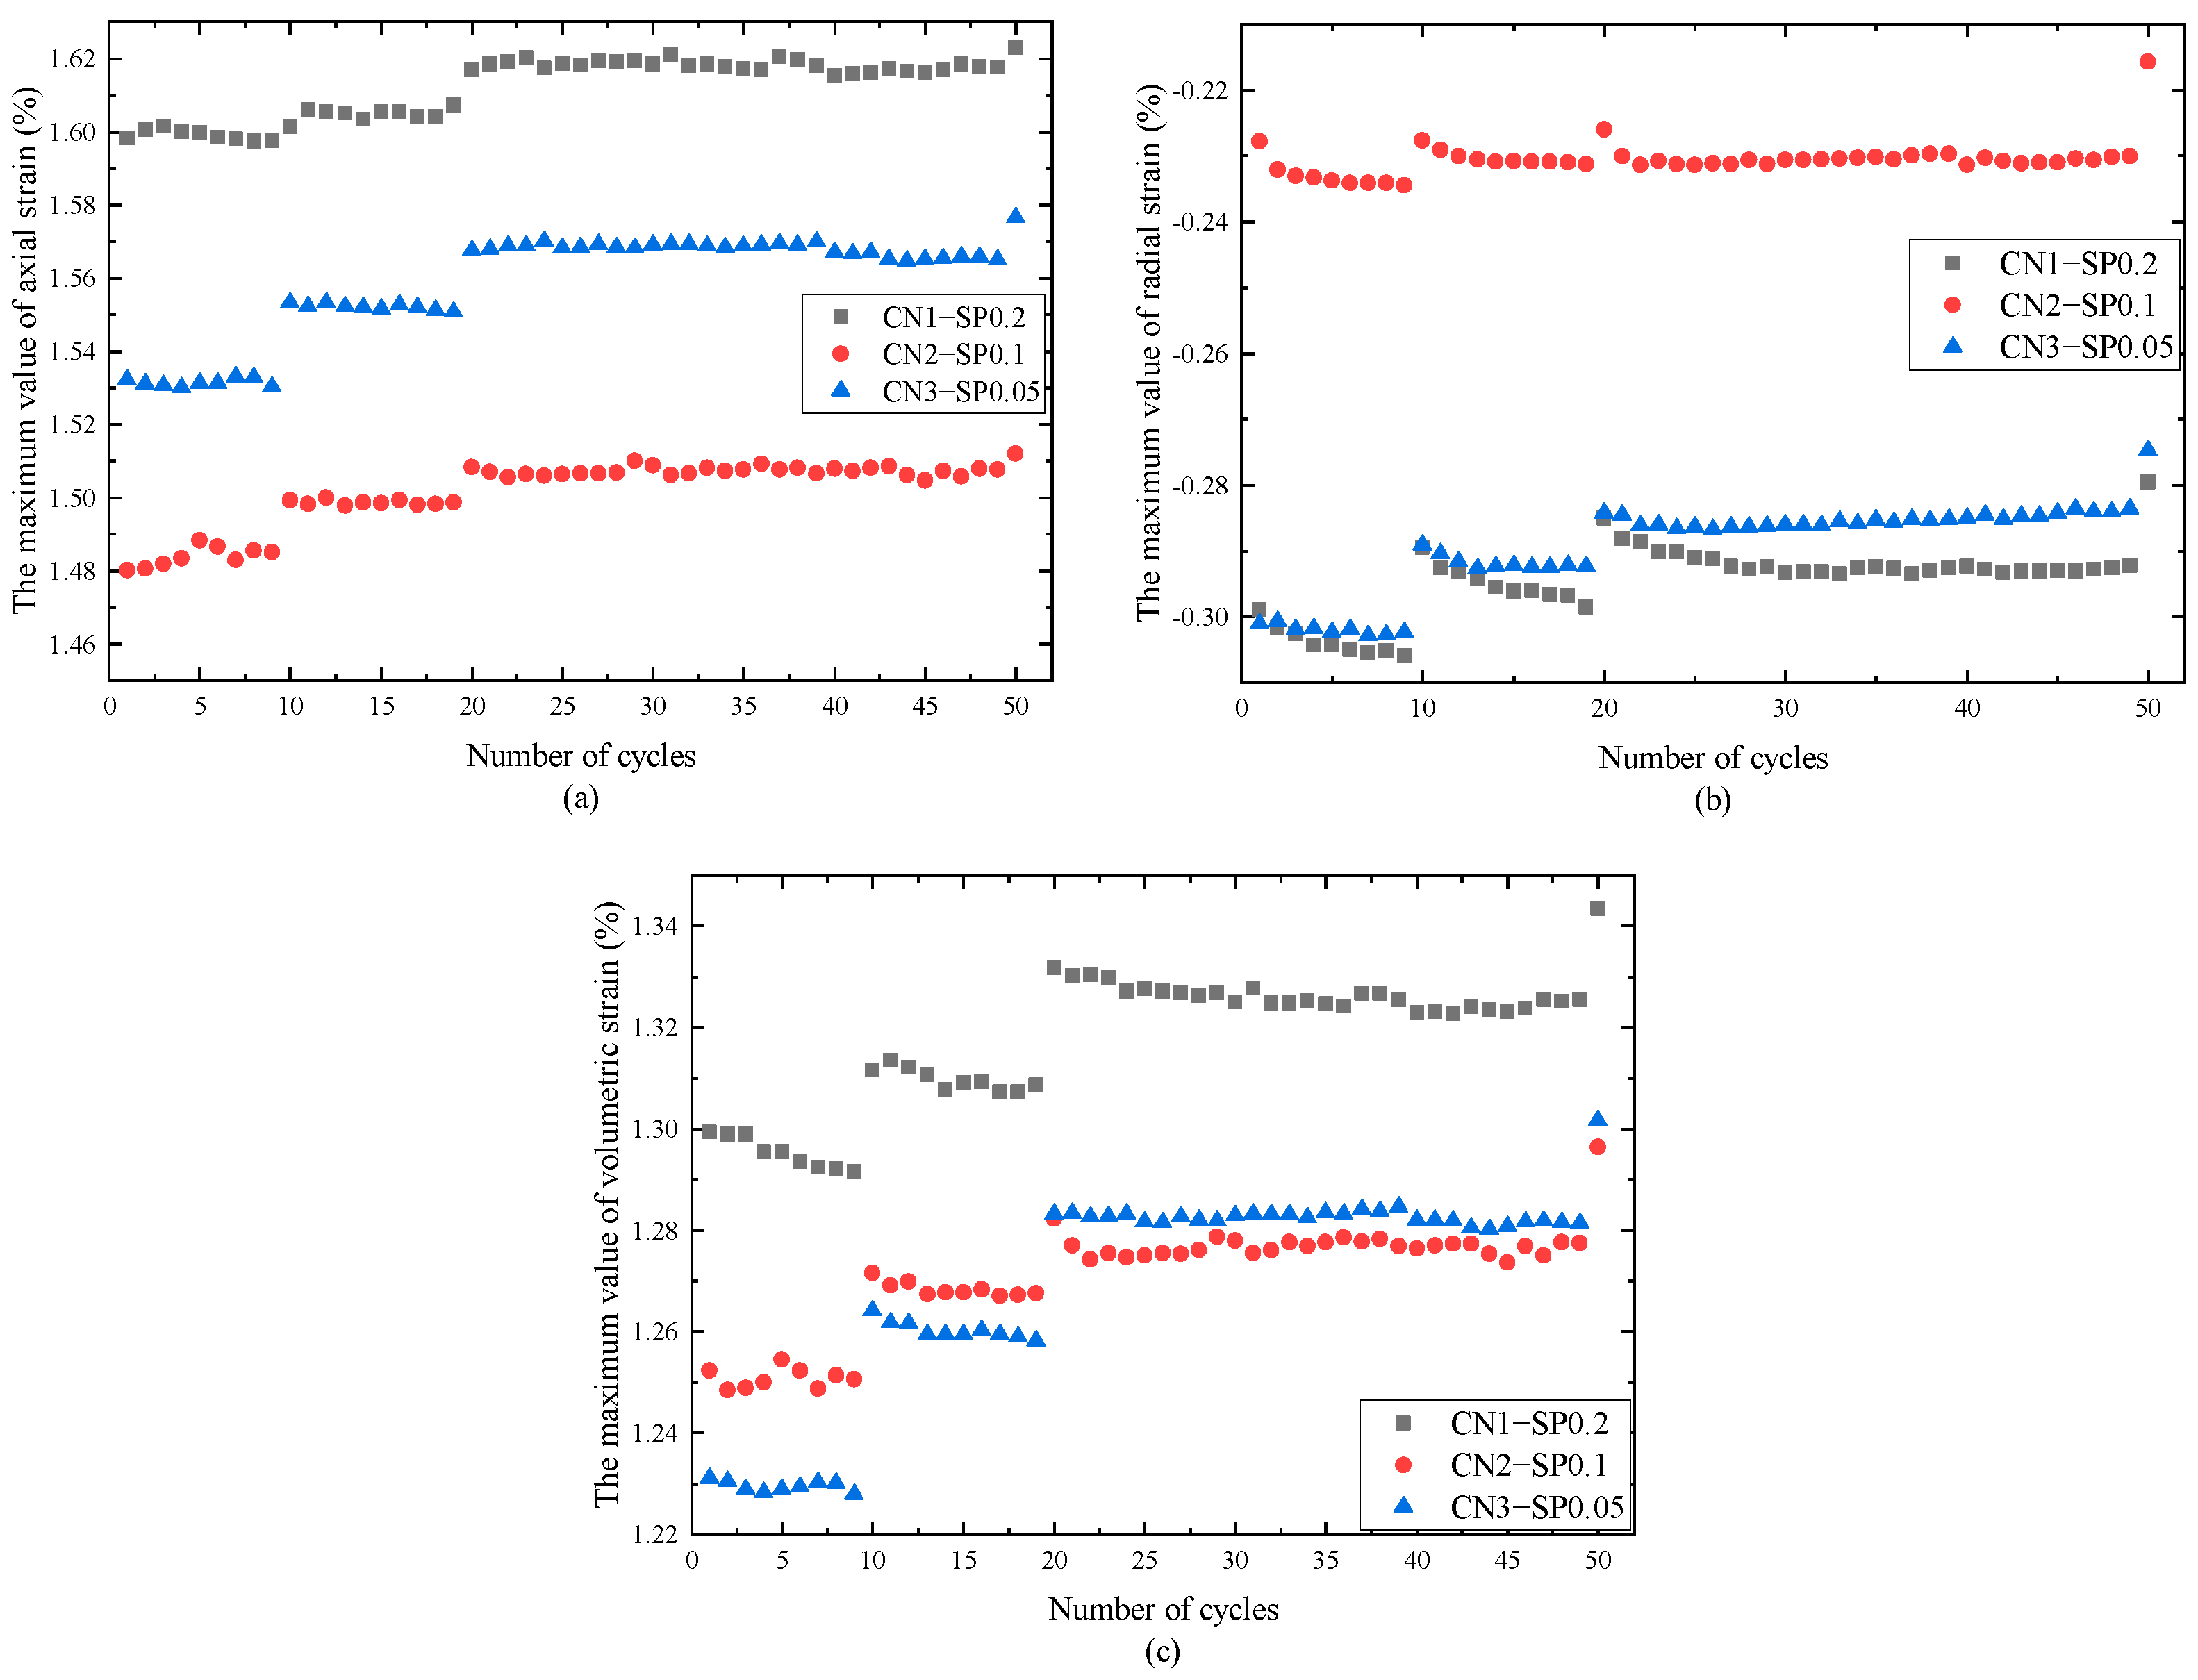
3.1.1. Analysis of Strain Characteristics in the Process of Confining Pressure Loading

The strain variation curves of the mud shale with the confining pressure under the triaxial loading and unloading cycle are shown in Figure 5. The axial strain decreases gradually with the decrease in the confining pressure. The radial strain also decreases gradually during the process of confining pressure unloading. In the range of 10 MPa to 40 MPa, the axial strain variation range of the specimen with the loading and unloading rate of 0.2 MPa/s is larger than that of the specimen with the rate of 0.05 MPa/s, 1.62% and 1.56%, respectively. The specimen with the rate of 0.1 MPa/s has the smallest variation range of 1.51%.
The axial strain, radial strain and volumetric strain when the confining pressure reaches the upper limit pressure (40 MPa) in each cycle are shown in Figure 6. The maximum value of axial strain increases significantly after each long-time stabilization of the confining pressure, and the maximum value of axial strain tends to rise during rapid loading and unloading, but the rise is small. Because of the stage of long-time stabilization of the confining pressure, the axial deformation has sufficient time to develop. The rock sample creeps and the axial strain increases significantly. During the rapid loading stage, the deformation has a hysteresis effect relative to the loading of the force, which leads to a slow change in the maximum value of the axial strain. The maximum value of radial strain has a significant increase after a long-time stabilization phase of the confining pressure, but with the rapid change of the confining pressure, its value slowly decreases; however, all of them are larger than the maximum value of the previous phase. Since the volumetric strain is closely related to the damage [23,24], we further compared the trend of the volumetric strain per cycle between the samples. The volumetric strain also changes significantly after a long period of stability in the confining pressure. At the beginning of the confining pressure cycle, the axial strain and radial strain of the specimens show an obvious increasing trend, indicating that the confining pressure cycle has a closing effect on the microfractures, pores, etc. inside the specimens, and the compactness is further enhanced. After the number of cycles reaches 20, the deformation of the specimens is basically unchanged.

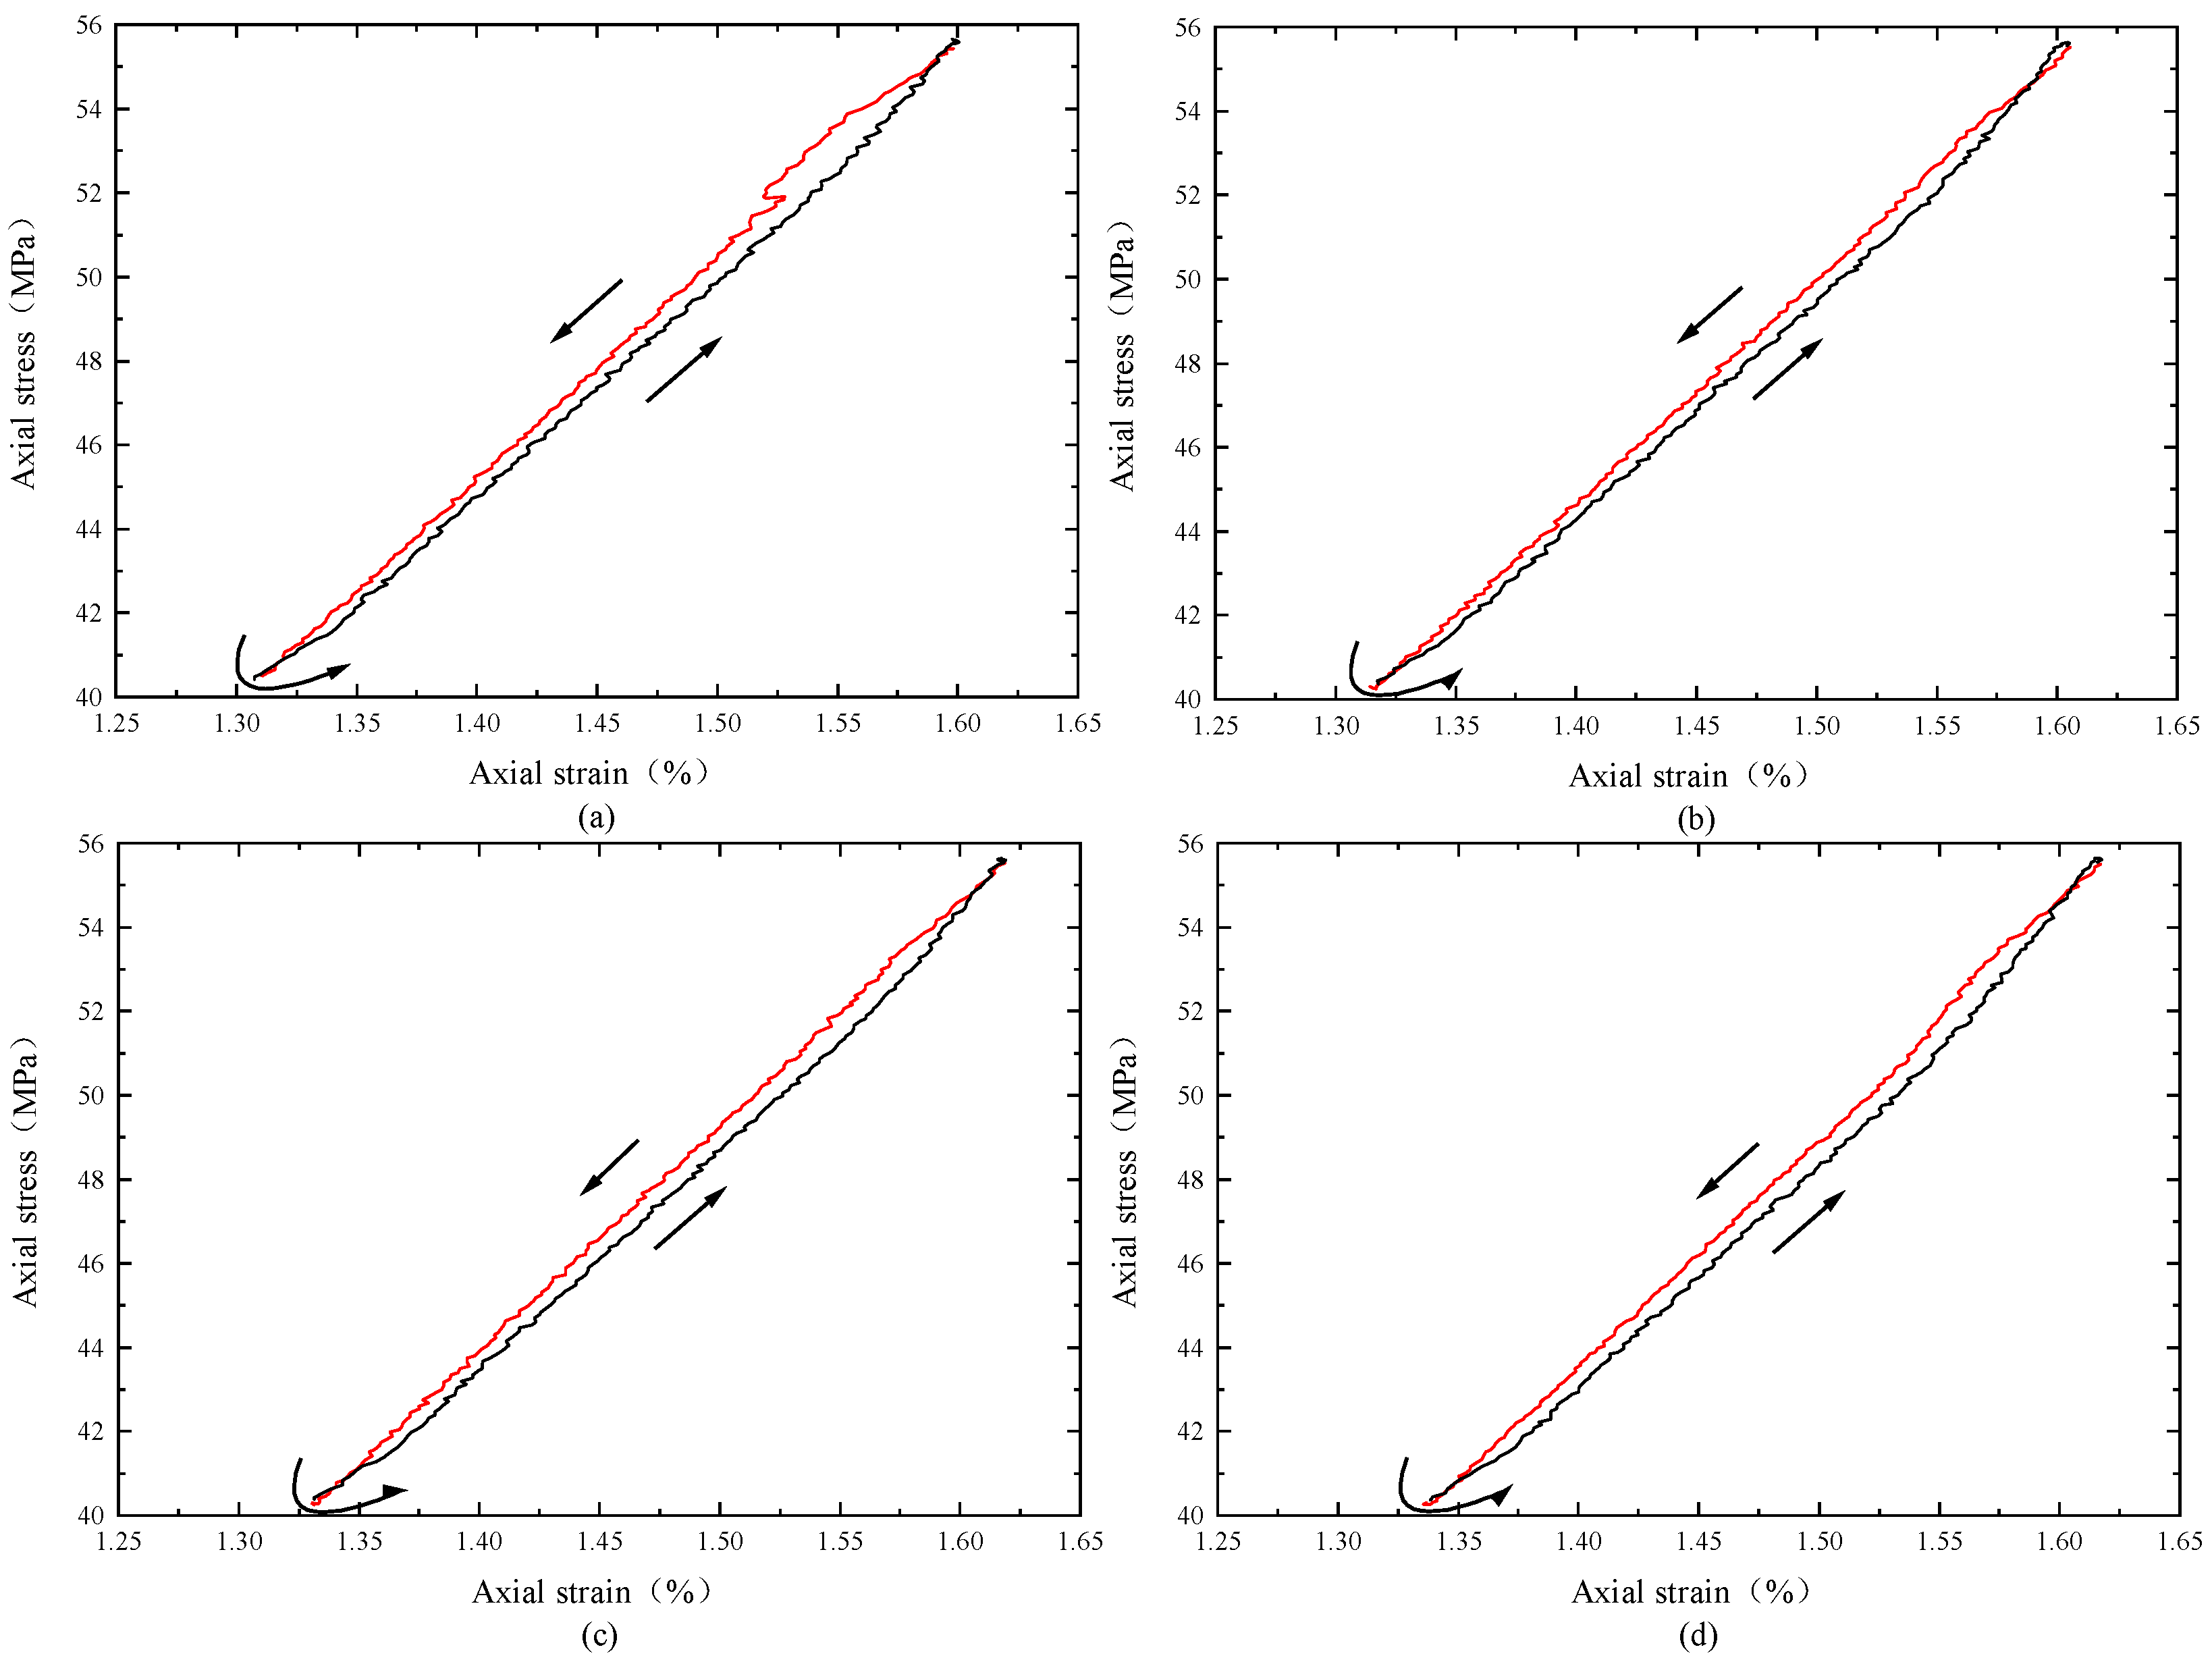
3.1.2. Hysteresis Loop Curve Analysis

Since the change characteristics of each specimen curve tend to be the same during cyclic loading and unloading, the curves of a typical specimen CN1−SP0.2 are selected to extract the hysteresis loop in each cyclic cycle for analysis. The approximately closed area formed between the unloading curve and the loading curve is called the hysteresis loop. The hysteresis loop area is the area of the region formed by this hysteresis loop (ABCDA area in Figure 7). The reason why the two curves do not coincide is that there are crack defects inside the specimen, and the dissipation of some energy under cyclic loading causes the unloading curve not to return along the original path of the loading curve. The size of the hysteresis loop area reflects the energy dissipation of the rock and the size of the internal damage. There is a positive correlation between the two, i.e., the larger the hysteresis loop area, the greater the energy dissipation and the greater the internal damage.
Due to the fact that the hysteresis loops overlap a lot in the actual cyclic process, it is difficult to see the essential difference between them. Each hysteresis loop has a similar shape, so four hysteresis loops were selected for display (Figure 8). Combined with the relationship between the maximum value of strain and the number of cycles in Figure 6, this reflects the change rule of the specimen. Unlike the axial compression cyclic process in which the loading process curve is located above the unloading process curve, the unloading process curve is located above the loading process curve in the confining pressure cyclic process. This is because the effect of deviatoric stress is weakened in the confining pressure loading process, which is equivalent to the axial pressure unloading process in the cyclic axial pressure test. Therefore, it is essentially similar to the hysteresis loop in cyclic axial compression, but there are differences in the form of expression. As the number of cycles increases, the hysteresis loop moves in the direction of increasing axial strain, which is consistent with the change in stress−strain curves in the graded cyclic unloading-addition confining pressure test carried out by Miao et al. [25]. It indicates that the cracks and pores of the rock samples are gradually compressed to a greater extent as time increases. The overall shape of the hysteresis loops is also elongated, reflecting that the damage of the specimens is less within the set cyclic pressure range.

3.2. Analysis of Factors Influencing Permeability

Since mud shale specimens are characterized by low permeability, the transient method is used to calculate the permeability of mud shale specimens. Assuming that the fluid properties are constant and the fluid is not compressed and stored in the specimen (i.e., the fluid volume is constant), and based on the curve of the pressure difference between the inlet and outlet decreasing with time, by Equation (1):
K = μ β V l n ( P i P f ) 2 t ( A s L s )
the permeability is obtained.
Where V is the volume of the upper and lower chambers, cm3, where V1 = V2; ΔPi is the initial differential pressure, MPa; ΔPf is the final differential pressure, MPa; Δt is the duration, s; Ls is the length of the specimen, cm; As is the cross-sectional area of the specimen, cm2; μ is the gas viscosity, Pa·s; and β is the gas compression coefficient, Pa−1.

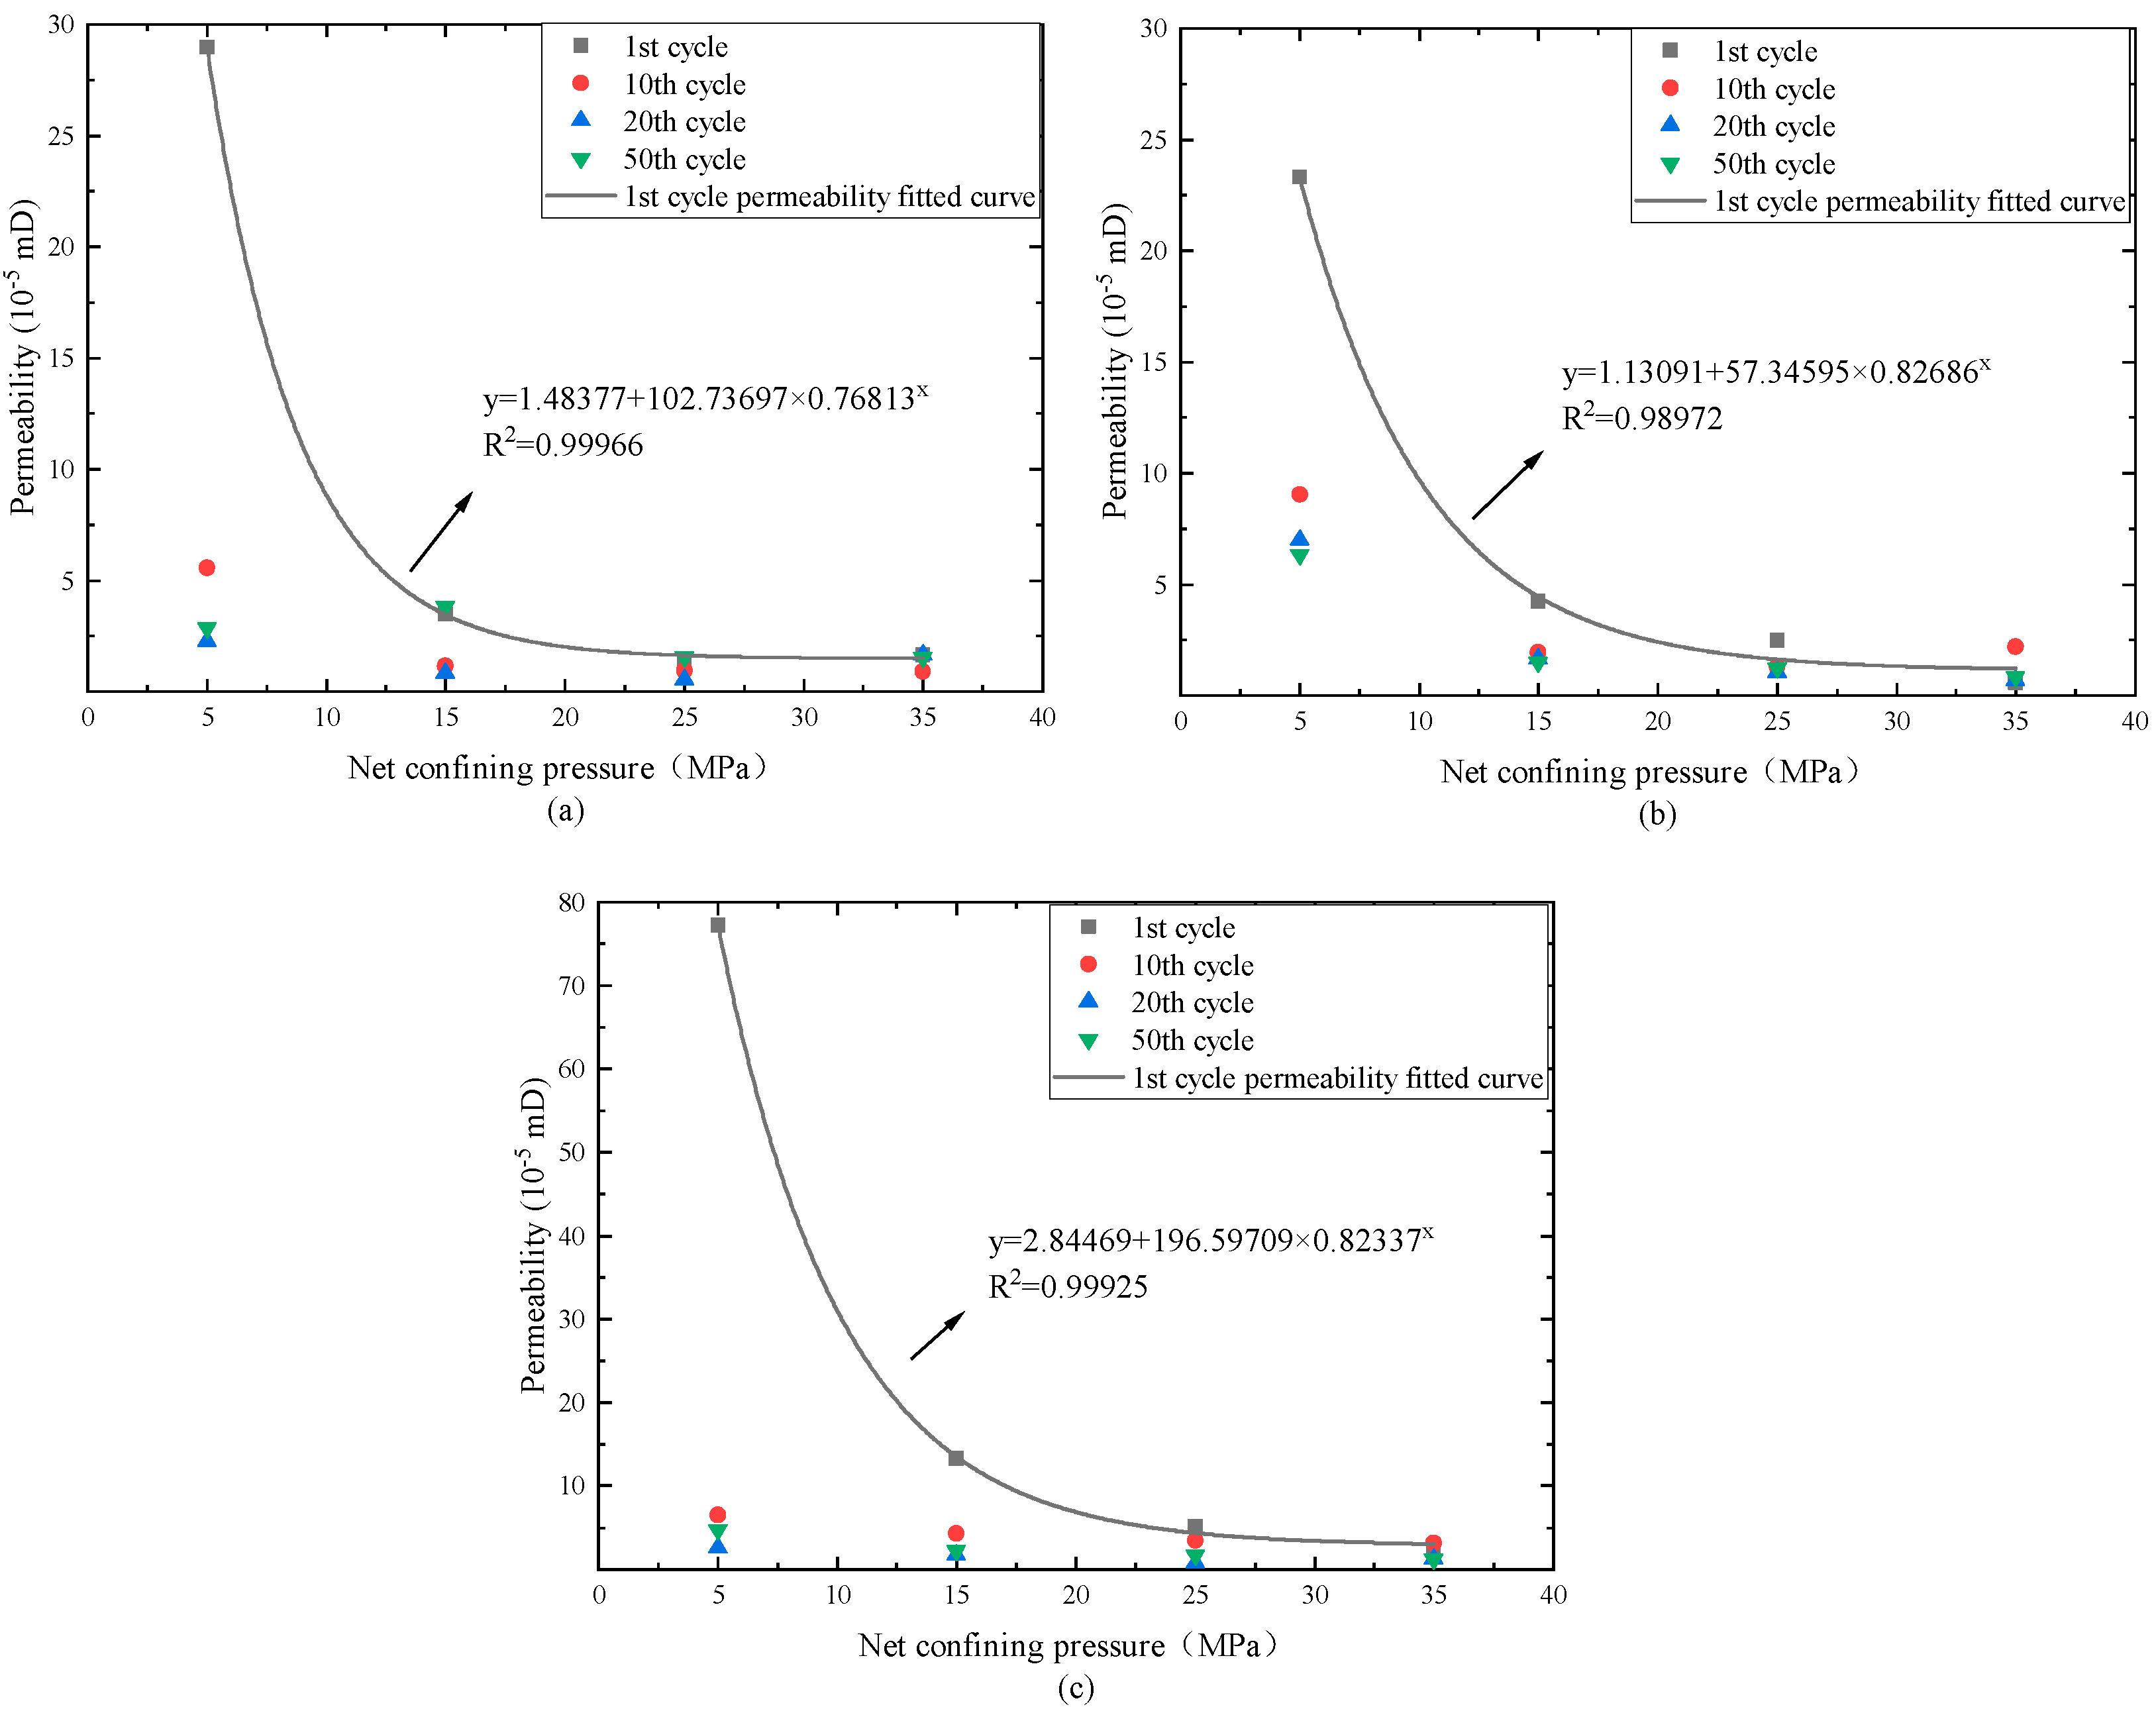
3.2.1. Relationship between Permeability and Confining Pressure

The permeability evolution of the mud shale specimens under different net confining pressures is shown in Figure 9. As can be seen from the figure, the permeability of the shale specimens under different rates of cyclic loading and unloading is basically the same as the trend of cyclic confining pressure. In the first cycle, the permeability of the specimen decreases with the increase in the net confining pressure. The evolution of the permeability and net confining pressure satisfies the negative exponential function. Compared with the permeability at a net confining pressure of 5 MPa, the permeability of specimens with loading and unloading rates of 0.2 MPa/s, 0.1 MPa/s and 0.05 MPa/s decreases by 94.3%, 97.6% and 96.8% at a net confining pressure of 35 MPa, respectively. After the tenth cycle, the specimen permeability remains unchanged and maintained at a low level with the loading of the net confining pressure. The possible reason is that the first few cycles of the specimen are mainly the compacting stage of the pores and cracks. With the increase in the confining pressure, the greater the degree of closure of the pores and cracks, and the permeability decreases significantly. The recovery degree is not high after the partial unloading of the confining pressure. With the increase in the number of cycles, the compacting degree of the pores and cracks in the later stage is maintained at a high level, and the degree of influence of the confining pressure on the specimen becomes smaller, so the change of the permeability with the confining pressure is not obvious. Combined with the reservoir injection and extraction application, if the change of stress during the confining pressure loading and unloading is consistent with the change of reservoir stress during gas injection and extraction, it indicates that the sealing of the capping mud shale tends to further improve during the operation interval of gas injection and extraction, and does not lead to damage with the increase in the number of injection and extraction.

3.2.2. Relationship between Permeability and Loading/Unloading Rate

A comparison of the permeability of the specimens with different loading and unloading rates at each cycle number is shown in Figure 10. In the first ten cycles, except for the data point with a net confining pressure of 5 MPa and a loading/unloading rate of 0.1 MPa/s, the permeability of the specimen with a confining pressure loading/unloading rate of 0.05 MPa/s is the largest, while the permeability of the specimen with a confining pressure loading/unloading rate of 0.2 MPa/s is the smallest, and the permeability of the specimen with a confining pressure loading/unloading rate of 0.1 MPa/s is in between. This suggests that the greater the loading and unloading rate at the beginning of the cycle, the more the permeability decreases. In general, a smaller number of cycles and a smaller loading/unloading rate are more favorable for producing elastic deformation. After a cycle number of 20, the correlation between permeability and loading and unloading rates is not significant. It may be due to the fact that in the later stages of the cycle, the pores and cracks within the rock compact, and the loading and unloading rates become less influential on the rock samples. This suggests that the rate of loading and unloading is not the main controlling factor for permeability change in the later stages of the cycle. The permeability of the measured mud cover under the same confining pressure tends to decrease and does not show a trend of increasing permeability with the increasing number of cycles. Presumably, the rock is in a compact state at this stage, and no obvious structural damage has occurred.

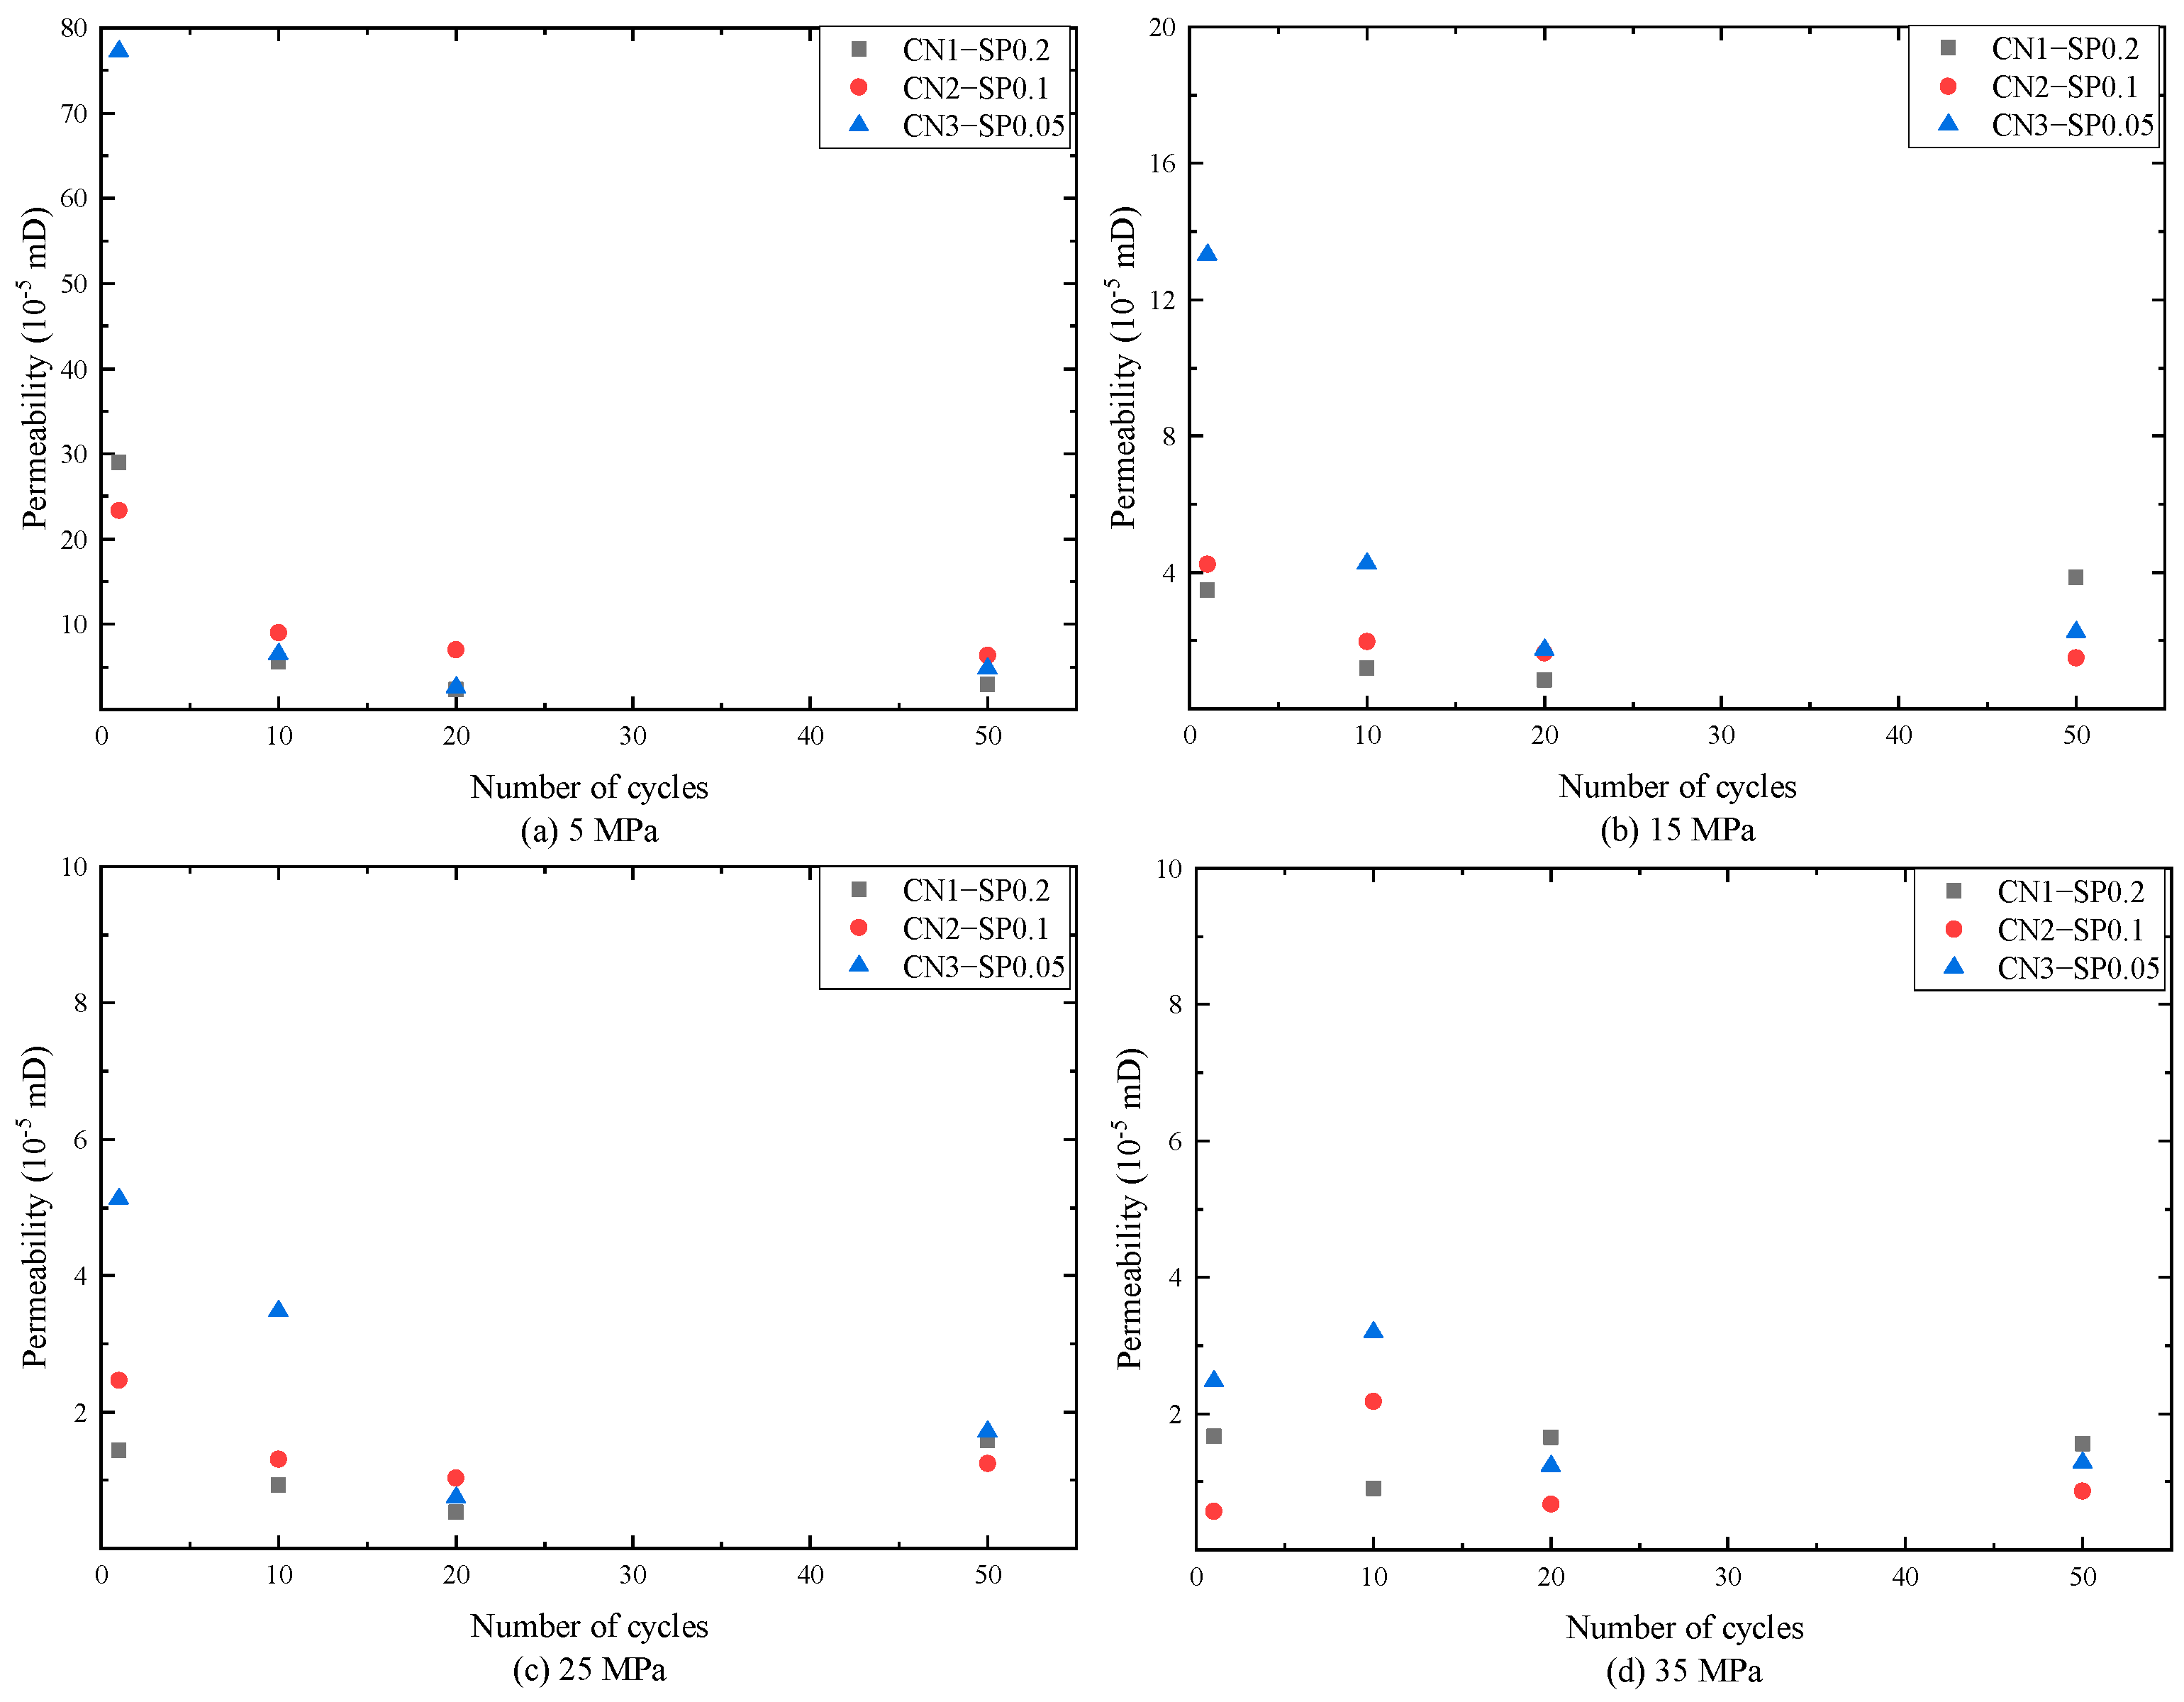
3.2.3. Relationship between Permeability and Number of Cycles

The evolution of the permeability of the mud shale specimens with the number of cycles is shown in Figure 11. The specimens in Figure 11 are at different confining pressure loading rates. In the process of cyclic confining pressure, permeability is measured at 4 different net confining pressure values in (a)−(d).
The correlation between the permeability and the number of cycles is not obvious at net confining pressures of 15 MPa, 25 MPa, and 35 MPa. However, the permeability is maintained at less than 20% of the initial permeability. At a net confining pressure of 5 MPa, the permeability and the number of cycles satisfy the exponential function:
K = a b · c n
The data points in Figure 11a were fitted to obtain Table 3.
Because the value of c is between 0 and 1, the permeability of each specimen tends towards a constant, when the number of cycles n tends to infinity. This is due to the rapid increase in pore and fracture closure at low confining pressure so the decrease in permeability at the beginning of the cycle is significant. In the later stages of the cycle and high confining pressure, most of the pores and fractures have been closed to a large extent, so the change in permeability is small. When the permeability is low enough, the effect of equipment testing errors becomes apparent.
It can be seen that the values of parameter c of the exponential function satisfied by the variation of permeability with the number of cycles at low confining pressure are close to each other when the confining pressure is alternating and the range of confining pressure variation fails to produce obvious structural damage to the rock.

4. Conclusions

Gas reservoirs are subject to alternating loads during operation, which affect the permeability performance of the cap rock. Through simultaneous testing of the permeability of mud shale under the confining pressure cyclic loading and unloading test, the deformation characteristics of cap rock and the relationship between permeability and confining pressure, number of alternating strains and loading/unloading rate were studied, and the following conclusions were obtained.
(1)
Only minor fluctuations in the strain maximum occur during the rapid cyclic stage of the confining pressure. Significant changes in the strain maximum occur during the steady pressure stage, where a large number of cracks and pores within the specimen are closed.
(2)
With the increase in the cycle number, the hysteresis loop moves in the direction of increasing axial strain, and the overall morphology appears to be elongated, indicating that the specimen is less damaged within the confining pressure range of the cycle.
(3)
In the first cycle, the permeability decreases negatively and exponentially with the increase in the circumferential pressure. The permeability at a net confining pressure of 35 MPa decreases by about 95% compared with that at a net confining pressure of 5 MPa. After the tenth cycle, the permeability basically remains unchanged and is maintained at a low level.
(4)
At low confining pressure, the permeability decreases in a negative exponential form with the increase in the number of cycles of confining pressure.
(5)
The greater the loading and unloading rate at the beginning of the cycle, the more the permeability decreases. The rate of loading and unloading is not the main controlling factor for permeability change in the later stages of the cycle.
(6)
There is a tendency for sealing improvement under cyclic loading in the gas storage of depleted reservoirs with mud shale as the cap layer. If the pressure of the cycle does not reach the fatigue damage threshold of the cap rock, the cap rock can remain intact and the sealing performance of the reservoir is guaranteed.

Author Contributions

Q.Y.: Writing—original draft. Y.G.: Project administration, Supervision, Writing—review & editing. H.L.: Resources, Supervision. Y.S.: Writing—review & editing. D.W.: Resources. H.Z.: Resources. X.C.: Funding acquisition. All authors have read and agreed to the published version of the manuscript.

Funding

This work was supported by the National Natural Science Foundation of China (No. 52104046).

Data Availability Statement

Data will be made available on request.

Conflicts of Interest

The authors declare no conflict of interest.

Nomenclature

σ1First principal stress
σ2Second principal stress
σ3Third principal stress
PDeviatoric stress
σStress
σdmaxMaximum stress
σdminMinimum stress
εStrain
εdmaxMaximum strain
εdminMinimum strain
VVolume of chambers
ΔPiInitial differential pressure
ΔPfFinal differential pressure
ΔtTime difference
LsLength of the specimen
Ascross-sectional area of the specimen
μGas viscosity
βGas compression coefficient
a,b,cParameters fitted
nCycle number

References

  1. Zhang, G.X.; Li, B.; Zheng, D.W.; Ding, G.S.; Wei, H.; Qian, P.S.; Li, C. Challenges to and proposals for underground gas storage(UGS)business in China. Nat. Gas Ind. 2017, 37, 153–159. [Google Scholar] [CrossRef]
  2. Hong, B.; Cong, W.; Fu, D.H.; Song, Z. Lessons for China from U.S. and European natural gas storage management and pricing practices. Int. Pet. Econ. 2014, 22, 23–29, 109. [Google Scholar]
  3. Su, X.; Zhang, L.; Li, Y. Status and development trend of foreign underground gas storages. Nat. Gas Oil 2007, 7, 1–4. [Google Scholar]
  4. Evans, D.J. A review of underground fuel storage events and putting risk into perspective with other areas of the energy supply chain. Geol. Soc. Lond. Spec. Publ. 2009, 313, 173–216. [Google Scholar] [CrossRef]
  5. Bruno, M.S.; Lao, K.; Diessl, J.; Childers, B.; Xiang, J.; White, N.; van der Veer, E. Development of improved caprock integrity analysis and risk assessment techniques. Energy Procedia 2014, 63, 4708–4744. [Google Scholar] [CrossRef]
  6. Wang, S.J. Micropore Structure and Remaining Oil Distribution Characteristics of Clastic Reservoir Based on Digital Core. Master’s Thesis, Northeast Petroleum University, Daqing, China, 2023. [Google Scholar] [CrossRef]
  7. Zheng, D.W.; Xu, H.C.; Wang, J.M.; Sun, J.C.; Zhao, K.; Li, C.; Shi, L.; Tang, L.G. Key evaluation techniques in the process of gas reservoir being converted into underground gas storage. Pet. Explor. Dev. Online 2017, 44, 840–849. [Google Scholar] [CrossRef]
  8. Sun, J.C.; Xu, H.C.; Wang, J.M.; Shi, L.; Li, C.; Tang, L.G.; Zhong, R. Injection-production mechanisms and key evaluation technologies for underground gas storages rebuilt from gas reservoirs. Nat. Gas Ind. B 2018, 5, 616–622. [Google Scholar] [CrossRef]
  9. Fatt, I.; Davis, D.H. Reduction in Permeability With Overburden Pressure. J. Pet. Technol. 1952, 4, 16. [Google Scholar] [CrossRef]
  10. Zhang, D.M.; Yang, Y.S.; Chu, Y.P.; Zhang, X.; Xue, Y.G. Influence of loading and unloading velocity of confining pressure on strength and permeability characteristics of crystalline sandstone. Results Phys. 2018, 9, 1363–1370. [Google Scholar] [CrossRef]
  11. Wang, Z.Q.; Zhang, L.M.; Sun, H.; Zhang, Y.H.; Kuang, S.Y. Experimental study of mechanical properties of limestone under different unloading velocities. Rock Soil Mech. 2011, 32, 1045–1050, 1277. [Google Scholar] [CrossRef]
  12. Dong, J.J.; Hsu, J.Y.; Wu, W.J.; Shimamoto, T.; Hung, J.H.; Yeh, E.C.; Wu, Y.H.; Sone, H. Stress-dependence of the permeability and porosity of sandstone and shale from TCDP Hole-A. Int. J. Rock Mech. Min. Sci. 2010, 47, 1141–1157. [Google Scholar] [CrossRef]
  13. Liu, H.; Wang, W.H.; Chen, M.J.; Hu, X.H.; Guo, Y.D.; Zeng, Y. Research on the stress sensitivity experiment of Fuling Longmaxi shale reservoirs. Petrochem. Ind. Technol. 2019, 26, 155–158. [Google Scholar] [CrossRef]
  14. Zhang, G.Q.; Fan, Z.W.; Zeng, D.Q.; Zhang, J.F.; Mao, H.J.; Mi, L.D.; Jia, Y.W.; Yang, X.S.; Jing, X. Damage law of reservoir cap rock of gas storage under alternating load. Fault-Block Oil Gas Field 2021, 28, 769–774. [Google Scholar]
  15. Jiang, C.B.; Duan, M.K.; Yin, G.Z.; Wang, J.G.; Lu, T.Y.; Xu, J.; Zhang, D.M.; Huang, G. Experimental study on seepage properties, AE characteristics and energy dissipation of coal under tiered cyclic loading. Eng. Geol. 2017, 221, 114–123. [Google Scholar] [CrossRef]
  16. Meng, Q.B.; Liu, J.F.; Ren, L.; Pu, H.; Chen, Y.L. Experimental Study on Rock Strength and Deformation Characteristics Under Triaxial Cyclic Loading and Unloading Conditions. Rock Mech. Rock Eng. 2021, 54, 777–797. [Google Scholar] [CrossRef]
  17. Chu, Y.P.; Sun, H.T.; Zhang, D.M. Experimental study on evolution in the characteristics of permeability, deformation, and energy of coal containing gas under triaxial cyclic loading-unloading. Energy Sci. Eng. 2019, 7, 2112–2123. [Google Scholar] [CrossRef]
  18. Feng, X.T.; Gao, Y.H.; Zhang, X.W.; Wang, Z.F.; Zhang, Y.; Han, Q. Evolution of the mechanical and strength parameters of hard rocks in the true triaxial cyclic loading and unloading tests. Int. J. Rock Mech. Min. Sci. 2020, 131, 104349. [Google Scholar] [CrossRef]
  19. Yuan, X.; Zhang, J.W. Deformation and permeability characteristic of outburst coal under step unloading conditions. J. China Coal Soc. 2017, 42, 1451–1457. [Google Scholar] [CrossRef]
  20. Zhang, L.Y.; Zhang, Q.Y.; Yang, S.Y.; Sui, B.; Yang, W.D.; Wang, Y.F.; Wang, C.; Yuan, S.B. Analysis of unloading confining pressure triaxial rheological tests of diabase in Dagangshan Dam side. J. Cent. South Univ. (Sci. Technol.) 2015, 46, 1034–1042. [Google Scholar] [CrossRef]
  21. Ma, X.H.; Zheng, D.W.; Shen, R.C.; Wang, C.Y.; Luo, J.H.; Sun, J.C. Key technologies and practice for gas field storage facility construction of complex geological conditions in China. Pet. Explor. Dev. 2018, 45, 507–520. [Google Scholar]
  22. Wei, G.Q.; Zheng, Y.L.; Qiu, X.S.; Sun, J.C.; Shi, L.; Lai, X. Geological theory and application of underground gas storage in China. Acta Pet. Sin. 2019, 40, 1519–1530. [Google Scholar] [CrossRef]
  23. Chen, J.; Du, C.; Jiang, D.Y.; Fan, J.Y.; He, Y. The mechanical properties of rock salt under cyclic loading-unloading experiments. Geomech. Eng. 2016, 10, 325–334. [Google Scholar] [CrossRef]
  24. Roberts, L.A.; Buchholz, S.A.; Mellegard, K.D.; Düsterloh, U. Cyclic Loading Effects on the Creep and Dilation of Salt Rock. Rock Mech. Rock Eng. 2015, 48, 2581–2590. [Google Scholar] [CrossRef]
  25. Miao, S.J.; Duan, Y.X.; Liu, C.K.; Lu, X.A. Mechanical characteristics of siltstone under staged cyclic unloading-loading confining pressure. J. Civ. Environ. Eng. 2022, 91, 1–9. [Google Scholar]
Figure 1. Test sample diagram.
Processes 11 03114 g001
Figure 2. (a) MTS rock mechanics test system. (b) Triaxial cell.
Processes 11 03114 g002
Figure 3. The loading path used in the tests.
Processes 11 03114 g003
Figure 4. Test specimen placed in the MTS rock mechanics test system.
Processes 11 03114 g004
Figure 5. Confining pressure−strain curves for different samples (a) CN1−SP0.2 (b) CN2−SP0.1 (c) CN3−SP0.05.
Processes 11 03114 g005
Figure 6. Relationship between the maximum value of strain and number of cycles (a) Axial strain (b) Radial strain (c) Volumetric strain.
Processes 11 03114 g006
Figure 7. Stress−strain hysteresis loop formed under cyclic loading and unloading conditions.
Processes 11 03114 g007
Figure 8. Hysteresis loop of specimen CN1−SP0.2 at different cycle times (a) 1st (b) 11th (c) 21st (d) 48th.
Processes 11 03114 g008
Figure 9. Relationship between normalized permeability and net confining pressure during confining pressure loading (a) CN1−SP0.2 (b) CN2−SP0.1 (c) CN3−SP0.05.
Processes 11 03114 g009
Figure 10. Comparison of normalized permeability for different loading/unloading rates (a) 1st cycle (b) 10th cycle (c) 20th cycle (d) 50th cycle.
Processes 11 03114 g010
Figure 11. Relationship between normalized permeability and number of cycles at different net confining pressures.
Processes 11 03114 g011
Table 1. Changning Mud Shale mineral composition.
Mineral CompositionQuartzPotash FeldsparPlagioclaseCalciteDolomiteClay Minerals
Content (%)35.48.64.121.55.824.6
Table 2. Specific scheme.
Specimen IDConfining Pressure (MPa)Pore Pressure (MPa)Deviatoric Stress (MPa)Confining Pressure Loading Rate (MPa/s)
CN1−SP0.225−405150.2
CN2−SP0.125−405150.1
CN3−SP0.0525−405150.05
Table 3. Fitting information of permeability and number of cycles at a net confining pressure of 5 MPa.
Specimen IDFitting Equation between Permeability and Number of Cycles at a Net Confining Pressure of 5 MPaR2
CN1−SP0.2 K = 2.47729 + 33.74139 × 0.78488 n 0.99762
CN2−SP0.1 K = 6.49218 + 20.69962 × 0.81229 n 0.9991
CN3−SP0.05 K = 3.69289 + 106.04515 × 0.69367 n 0.99804
Disclaimer/Publisher’s Note: The statements, opinions and data contained in all publications are solely those of the individual author(s) and contributor(s) and not of MDPI and/or the editor(s). MDPI and/or the editor(s) disclaim responsibility for any injury to people or property resulting from any ideas, methods, instructions or products referred to in the content.

