Article

Removal of Pyridine from Aqueous Solutions Using Lignite, Coking Coal, and Anthracite: Adsorption Kinetics

1
School of Chemical and Environmental Engineering, China University of Mining and Technology (Beijing), Beijing 100083, China
2
State Key Laboratory of Complex Nonferrous Metal Resources Clean Utilization, Kunming 650093, China
*
Author to whom correspondence should be addressed.
Processes 2023, 11(11), 3118; https://doi.org/10.3390/pr11113118
Submission received: 22 September 2023 / Revised: 19 October 2023 / Accepted: 30 October 2023 / Published: 31 October 2023
(This article belongs to the Section Separation Processes)

Abstract

:
A novel coking wastewater treatment technique is proposed based on the principles of the circular economy. By utilizing coal as an adsorbent for organic pollutants in coking wastewater, the treated coal can be introduced into the coking system after the adsorption and flocculation sedimentation processes. This creates a closed-loop system with zero coking wastewater emissions. We investigated the potential of adsorption for the removal of pyridine. Batch experiments were conducted using lignite, coking coal, and anthracite as adsorbents. Both coking coal and anthracite showed favorable adsorption properties for the chosen contaminants. The experimental data were analyzed utilizing various models, including pseudo-first-order and pseudo-second-order kinetic equations, as well as intraparticle diffusion and Bangham. This study aimed to identify the rate-limiting step in the adsorption process. The results revealed that the adsorption of pyridine onto the three coal types followed pseudo-second-order kinetics. The rate-limiting mechanisms may include both boundary-layer diffusion and intraparticle diffusion. The effect of pH on coal adsorption and the activation energy of pyridine adsorption by coking coal were also examined. Adsorption offers a promising approach in advanced wastewater treatment, with coking coal emerging as a cost-effective adsorbent for addressing persistent organic pollutants during the adsorption process.

1. Introduction

Coking wastewater is generated during the purification of coal oven gas, the carbonization of coal, and the recovery of by-products in the coking process. It typically contains a wide array of complex inorganic and organic pollutants. These include phenolic compounds, pyridine, indole, quinoline, ammonium, sulfate, cyanide, thiocyanate, polynuclear aromatic hydrocarbons, polycyclic nitrogen-containing acyclic compounds, among others. Most of these pollutants are refractory in nature and are recognized for their toxic, mutagenic, and carcinogenic properties [1,2,3,4].
Biological treatment methods, such as the anoxic–oxic (A-O), anaerobic–anoxic–aerobic (A1-A2-O), and sequencing batch reactor (SBR) systems, are commonly employed for treating coking wastewater [5,6,7]. Studies have indicated that the organic constituents in coking wastewater can adversely affect these biological treatments. This leads to a notable presence of residual oxygen-consuming substances in the treated wastewater [8]. The inherent slowness of biological treatment processes can be attributed to the presence of organic components with significant biological toxicity and large molecular sizes, including compounds like phenolic, pyridine, indole, and quinoline. Furthermore, biological treatment systems have inherent limitations in their resilience and recovery rates. After an accident or disruption, a full recovery can take more than 20 days. Notably, toxic pyridine and its derivatives present significant risks to both humans and animals due to their toxicity and carcinogenic properties [9,10]. When released into the environment, pyridine can be introduced into organisms through air inhalation, dietary consumption, dermal exposure, and its effects on aquatic ecosystems. Once introduced into the ecological cycle, these toxic substances can accumulate in higher organisms through the food chain, posing further risks. Pyridine can enter the human body through various pathways, and its risks encompass both acute and long-term toxicities. The maximum permissible concentration of pyridine in air for human inhalation is 4 mg/m3. Prolonged exposure to high concentrations of pyridine vapor or direct skin contact with it can lead to poisoning, especially when its vapor concentration exceeds 3600 ppm. It is important to note that pyridine can mix with water in any proportion. Consequently, even when coking wastewater complies with the discharge standard, it still poses a serious threat to the aquatic environment [11].
Adsorption technology involves capturing solutes from wastewater based on the principle of adsorption, with the purpose of purifying wastewater. Generally, porous adsorbents are used, commonly including activated carbon, diatomaceous earth, fly ash, slag, and sulfonated coal. However, this treatment technology is expensive, the adsorbent is non-regenerative, and it is not suitable for treating wastewater with high concentrations; therefore, it is mostly used for the deep treatment of wastewater. A study analyzed the deep treatment of coking wastewater. It introduced relevant flocculants into the secondary sedimentation tank for post-biological phenol removal and incorporated facilities like coke and activated carbon adsorption towers. The results indicated a COD removal rate of around 80% to 90% [12]. While adsorption is a recognized method for treating industrial wastewater, its application in the coking industry has been somewhat limited. Among the various adsorbents available, activated charcoal is widely acknowledged as the most extensively used and effective option [11]. However, its broad adoption is hindered by the significant costs of its materials [12,13,14]. Consequently, many researchers are exploring cost-effective and easily accessible alternative adsorbents [14,15].
Adsorbents can be employed in combination with other methods to enhance the efficiency of wastewater treatment. Researchers, including Xu Gelian [16] et al., conducted an investigation into the effectiveness of utilizing pulverized coal, coke powder, activated carbon, and fly ash as adsorbents in combination with a biochemical treatment for coking wastewater remediation. Their findings indicated that by introducing a small amount of adsorbent into the biochemical treatment process, the removal efficiency of non-biodegradable organic substances could be enhanced. The removal rates of pollutants ranged from 20% to 80%, depending on the adsorption rate of the specific adsorbent employed.
In a similar study by Zhang Jinsong [15] et al., the authors produced a coke-quenching powder via a process involving wet coke quenching, followed by subsequent steps of drying, crushing, sieving, and activation. The resulting powder was utilized as an adsorbent in the treatment of coking wastewater. Their study showed that the chemical oxygen demand (COD) removal rate reached 64.3%, and the adsorbent exhibited favorable decolorization and deodorization effects on the wastewater.
The principles of the circular economy present a fresh approach to resource utilization and waste management, challenging the traditional linear economic model characterized by “take, make, waste”. Instead, the circular economy strives to create value from resources for as long as possible and to reuse and recycle resources at the end of the life cycle, thus creating a closed loop. This paper describes a novel technology and process for the treatment of coking wastewater. This method integrates coal into the coking process, achieving comprehensive recycling and zero wastewater emissions. It embodies the concept and practice of treating and recycling all wastewater generated in the production process without discharging any wastewater into the external environment. The investigation into pyridine adsorption by various coal types establishes the theoretical foundation for this innovative approach [17]. The primary objective of the study is to analyze the adsorption of compounds related to pyridine in simulated coking plant wastewater. It systematically assesses and compares the adsorption capacities and kinetics of lignite, coking coal, and anthracite using various models.

2. Materials and Methods

2.1. Test Materials

Pyridine, with a purity exceeding 99.5%, was procured from Shanghai Chemical Company and was used as the adsorbate in this study. The simulated used pyridine concentration was 25 mg·L−1.
The lignite sample was sourced from Shenli Coal Mine, a subsidiary of Shenhua Group Co., Ltd. (Baiyin, China). Samples of coking coal and anthracite were sourced from Linhuan Coal Preparation Plant and Chengjiao Coal Preparation Plant (Zhengzhou, China), respectively, both owned by Henan Coal Chemical Industry Group Co., Ltd. (Zhengzhou, China). These coal samples underwent initial crushing, grinding, and sieving through a 74 μm sieve. Subsequently, they were oven-dried at 120 °C for 2 h. Once dried, the adsorbent was securely stored in sealed glass containers. The same adsorbent material was consistently employed in all conducted experiments.

2.2. Analysis of Test Samples

The phase analysis of coal was conducted using an X-ray diffractometer (Saarbrucken, Lower Saxony, Germany). The operating parameters were as follows: tube voltage ranging from 20 to 60 kV (in 1 kV increments), tube current ranging from 10 to 60 mA, temperature ranging from room temperature to 1200 °C, maximum output of 3 kW, stability within ±0.01%, a goniometer radius of ≥200 nm, and the ability to continuously adjust the goniometer circle diameter. The minimum step size was 0.0001°, and the angle range covered from −110° to 168°.
The surface characteristics of these samples were examined using Scanning Electron Microscopy (SEM) with a ZEISS Gemini 300 (Oberkochen, Oberkochen, Germany). During the SEM operation, standard procedures were followed, and the equipment automatically adjusted the voltage uniformly. Firstly, all samples were subjected to deionized water washing and then dried at 105 °C; a conductive adhesive was applied to the sample stage, and coal powder was evenly distributed onto the adhesive surface. Subsequently, a gentle blowing device was used to remove any loose coal particles that did not adhere to the adhesive. Subsequently, Scanning Electron Microscopy was carried out. Surface morphology and pore structures of the coal particles were observed using SEM at both low and high magnifications after the samples were coated with a thin layer of gold spray.
FTIR spectra for the three coal types were acquired using KBr discs with a Fourier Transform Infrared Spectroscopy instrument (Saarbrucken, Lower Saxony, Germany) to investigate their surface functional groups. Initially, 1 mg of the coal sample was weighed and combined with 200 mg of spectroscopic-grade KBr. The mixture was then thoroughly blended and placed into a mortar for fine grinding. Upon achieving a finely ground mixture, it was transferred to a pellet press. A pressure of approximately 30–40 MPa was applied to compress the mixture into a thin pellet. This pellet was then placed into the infrared spectrometer for spectral scanning. Once the scanning process was completed, an infrared spectrum graph was generated. Subsequent analysis and identification of the infrared spectrum graph were conducted using computer software. Typically, the infrared spectrum covered a wavelength range from 400 cm−1 to 4000 cm−1 with a resolution of 4 cm−1, and the sample underwent 64 scans.
N2 adsorption isotherm measurements were carried out with a surface area analyzer, specifically the BELSORP-max model from BEL-JAPAN, Inc., (Toyonaka, Japan) to assess the specific surface areas of the lignite, coking coal, and anthracite samples. The specific surface area of coal samples was determined according to the BET calculation formula. Drawing from the research by Stephen Brunauer, Paul Hugh Emmett, and Edward Teller, the multi-molecular layer adsorption theory was formulated. This theory derived its multi-molecular layer adsorption formula based on conventional statistical methodologies. The BEL fully automatic nitrogen adsorption instrument is founded on the principles of the multi-molecular layer adsorption theory. Under a constant adsorption temperature, the adsorption of nitrogen on the surface of coal samples at different pressures was measured. A plot of P v ( P o p ) against P P 0 was generated, and the slope and intercept of the resulting straight line were used to determine the monolayer saturation adsorption quantity Vm. With the cross-sectional area of a single nitrogen molecule known, the specific surface area of the coal samples was calculated. The BET calculation formula is as follows:
P v ( P o p ) = 1 V m + C 1 V m × P P 0
where P is the measured pressure value, Pa; P 0 is the saturation vapor pressure, Pa; V is the nitrogen adsorption amount, mg·g−1, V m is the nitrogen monolayer saturation adsorption amount, mg·g−1; and C is a constant related to the adsorption rate.
The pore size distribution of the coal samples is determined using the following formula:
ln P P 0 = 2 γ N × V m × cos θ k R × T × r k
where γ N is the surface tension of liquid nitrogen; V m is the molar volume of liquid nitrogen, L·mol−1; θ k is the angle of contact between the outer wall of the solid surface and the interface of the curved moon; R is the parameter of the ideal gas, 8.314 J·K−1·mol−1; T is the adsorption temperature of isothermal adsorption, K.
The average pore size of coal samples is calculated as follows:
d p r o e = 4 V p o r e S B E T
where d p r o e is the relative pressure of V p o r e is the volume of adsorbed nitrogen gas, cm3; and S B E T is the BET specific surface area, cm2·g−1.

2.3. Batch Adsorption Studies

To study the adsorption of pyridine on three unique types of coals, batch-mode sorption equilibrium experiments were conducted. For each trial, we prepared fresh pyridine solutions by dissolving pyridine in deionized water. The concentrations of these solutions were then determined using a UV/VIS spectrophotometer (Shanghai, China). During the adsorption experiments, we added coal adsorbents into conical flasks containing 200 mL of pyridine solution. These flasks were then placed on an incubator shaker (Shanghai, China). The conical flasks were agitated at a constant speed of 200 rpm for varying durations within an incubator shaker operating at 60 °C. At specific time intervals, samples were extracted from the flasks to determine the residual pyridine concentration in the solution. The remaining concentration of pyridine in each flask was analyzed using a UV/VIS spectrophotometer (Shanghai, China). The adsorption rate of coal for pyridine in water samples was determined by measuring the UV absorption and then calculated using the specified equation:
Q t = ( C 0 C t ) V m
where Qt (mg·g−1) is the quantity of pyridine removed at time t by a unit mass of the adsorbent, C0 (mg·L−1) is the initial pyridine concentration, Ct (mg·L−1) is the pyridine concentration at time t, m (g·L−1) is the amount of adsorbent added, and V (mL) is the pyridine solution’s volume.
Studies have shown that the pH of a solution has a significant impact on the efficacy of adsorption. The pH value crucially affects both the state of organic compounds and the surface charge of the adsorbent, leading to changes in the intermolecular interactions of these compounds. In our pH experiments, a 25 mg·L−1 pyridine aqueous solution was prepared, and 2 g of coal was added to each sample, followed by a 30 min incubation. The pH of the solution was meticulously controlled within the range of 2–11 by the addition of either HCl or NaOH solution, and pH measurements were conducted using a pH meter (Columbus, OH, USA). To mitigate evaporation, the pyridine solutions were securely placed in 100 mL conical flasks fitted with glass stoppers and agitated using a magnetic stirrer. Blank experiments were also conducted to assess the impact of pyridine vaporization, and the experimental data were adjusted to compensate for any pyridine loss during the experiments.
Adsorption experiments were conducted at different temperatures to determine the equilibrium point and maximum removal capacity for pyridine (11 °C, 26 °C, and 41 °C) and their time intervals. A wavelength of 256 nm was employed for the pyridine measurements.

2.4. The UV Analysis Method

A substance’s ability to absorb light is selective. Each specific substance exhibits its maximum absorbance at a particular wavelength, and the higher the absorbance, the more precise the test results. The maximum absorption wavelength of each substance is selected for use in the determination of the concentration of organic substances later. To determine the wavelength of the maximum absorbance of each organic substance, the UV-4802S (Shanghai, China) UV spectrophotometer was used to conduct a full-wavelength scanning of 1000 mg·L−1 of pyridine as an organic substance, and the wavelength vs. absorbance spectrograms were used to determine the wavelengths of maximum absorption of the respective organic substances.

2.5. Adsorption Models

In the effective design of a sorption treatment plant, it is imperative to provide an accurate description and prediction of the adsorption rate, as this directly affects the necessary residence time for an efficient adsorption uptake [18,19]. Sorption reactions can be categorized into physical and chemical adsorption processes, depending on the nature of the forces involved [20]. The adsorption rate is influenced not only by the specific type of adsorption process but also by the external diffusion of the solute into the bulk liquid phase. This diffusion occurs through the boundary layer surrounding the solid particles, and they enter the pores within the liquid medium [19,20,21]. The rate of the adsorption process is determined by the slowest step, which can involve either the external mass transfer of solutes or the internal diffusion within the adsorbent particles. Enhancing the rate of the slowest step can lead to an overall improvement in the adsorption rate. It is crucial to identify the rate-controlling step of the adsorption process to study and enhance the efficiency of the adsorption process [18]. The sorption mechanism and potential rate-controlling steps were investigated using kinetic models.
Adsorption studies often use various rate equations to describe the kinetics of the process. These equations encompass the pseudo-first-order model, the pseudo-second-order model, the intraparticle diffusion model, and the Bangham model.

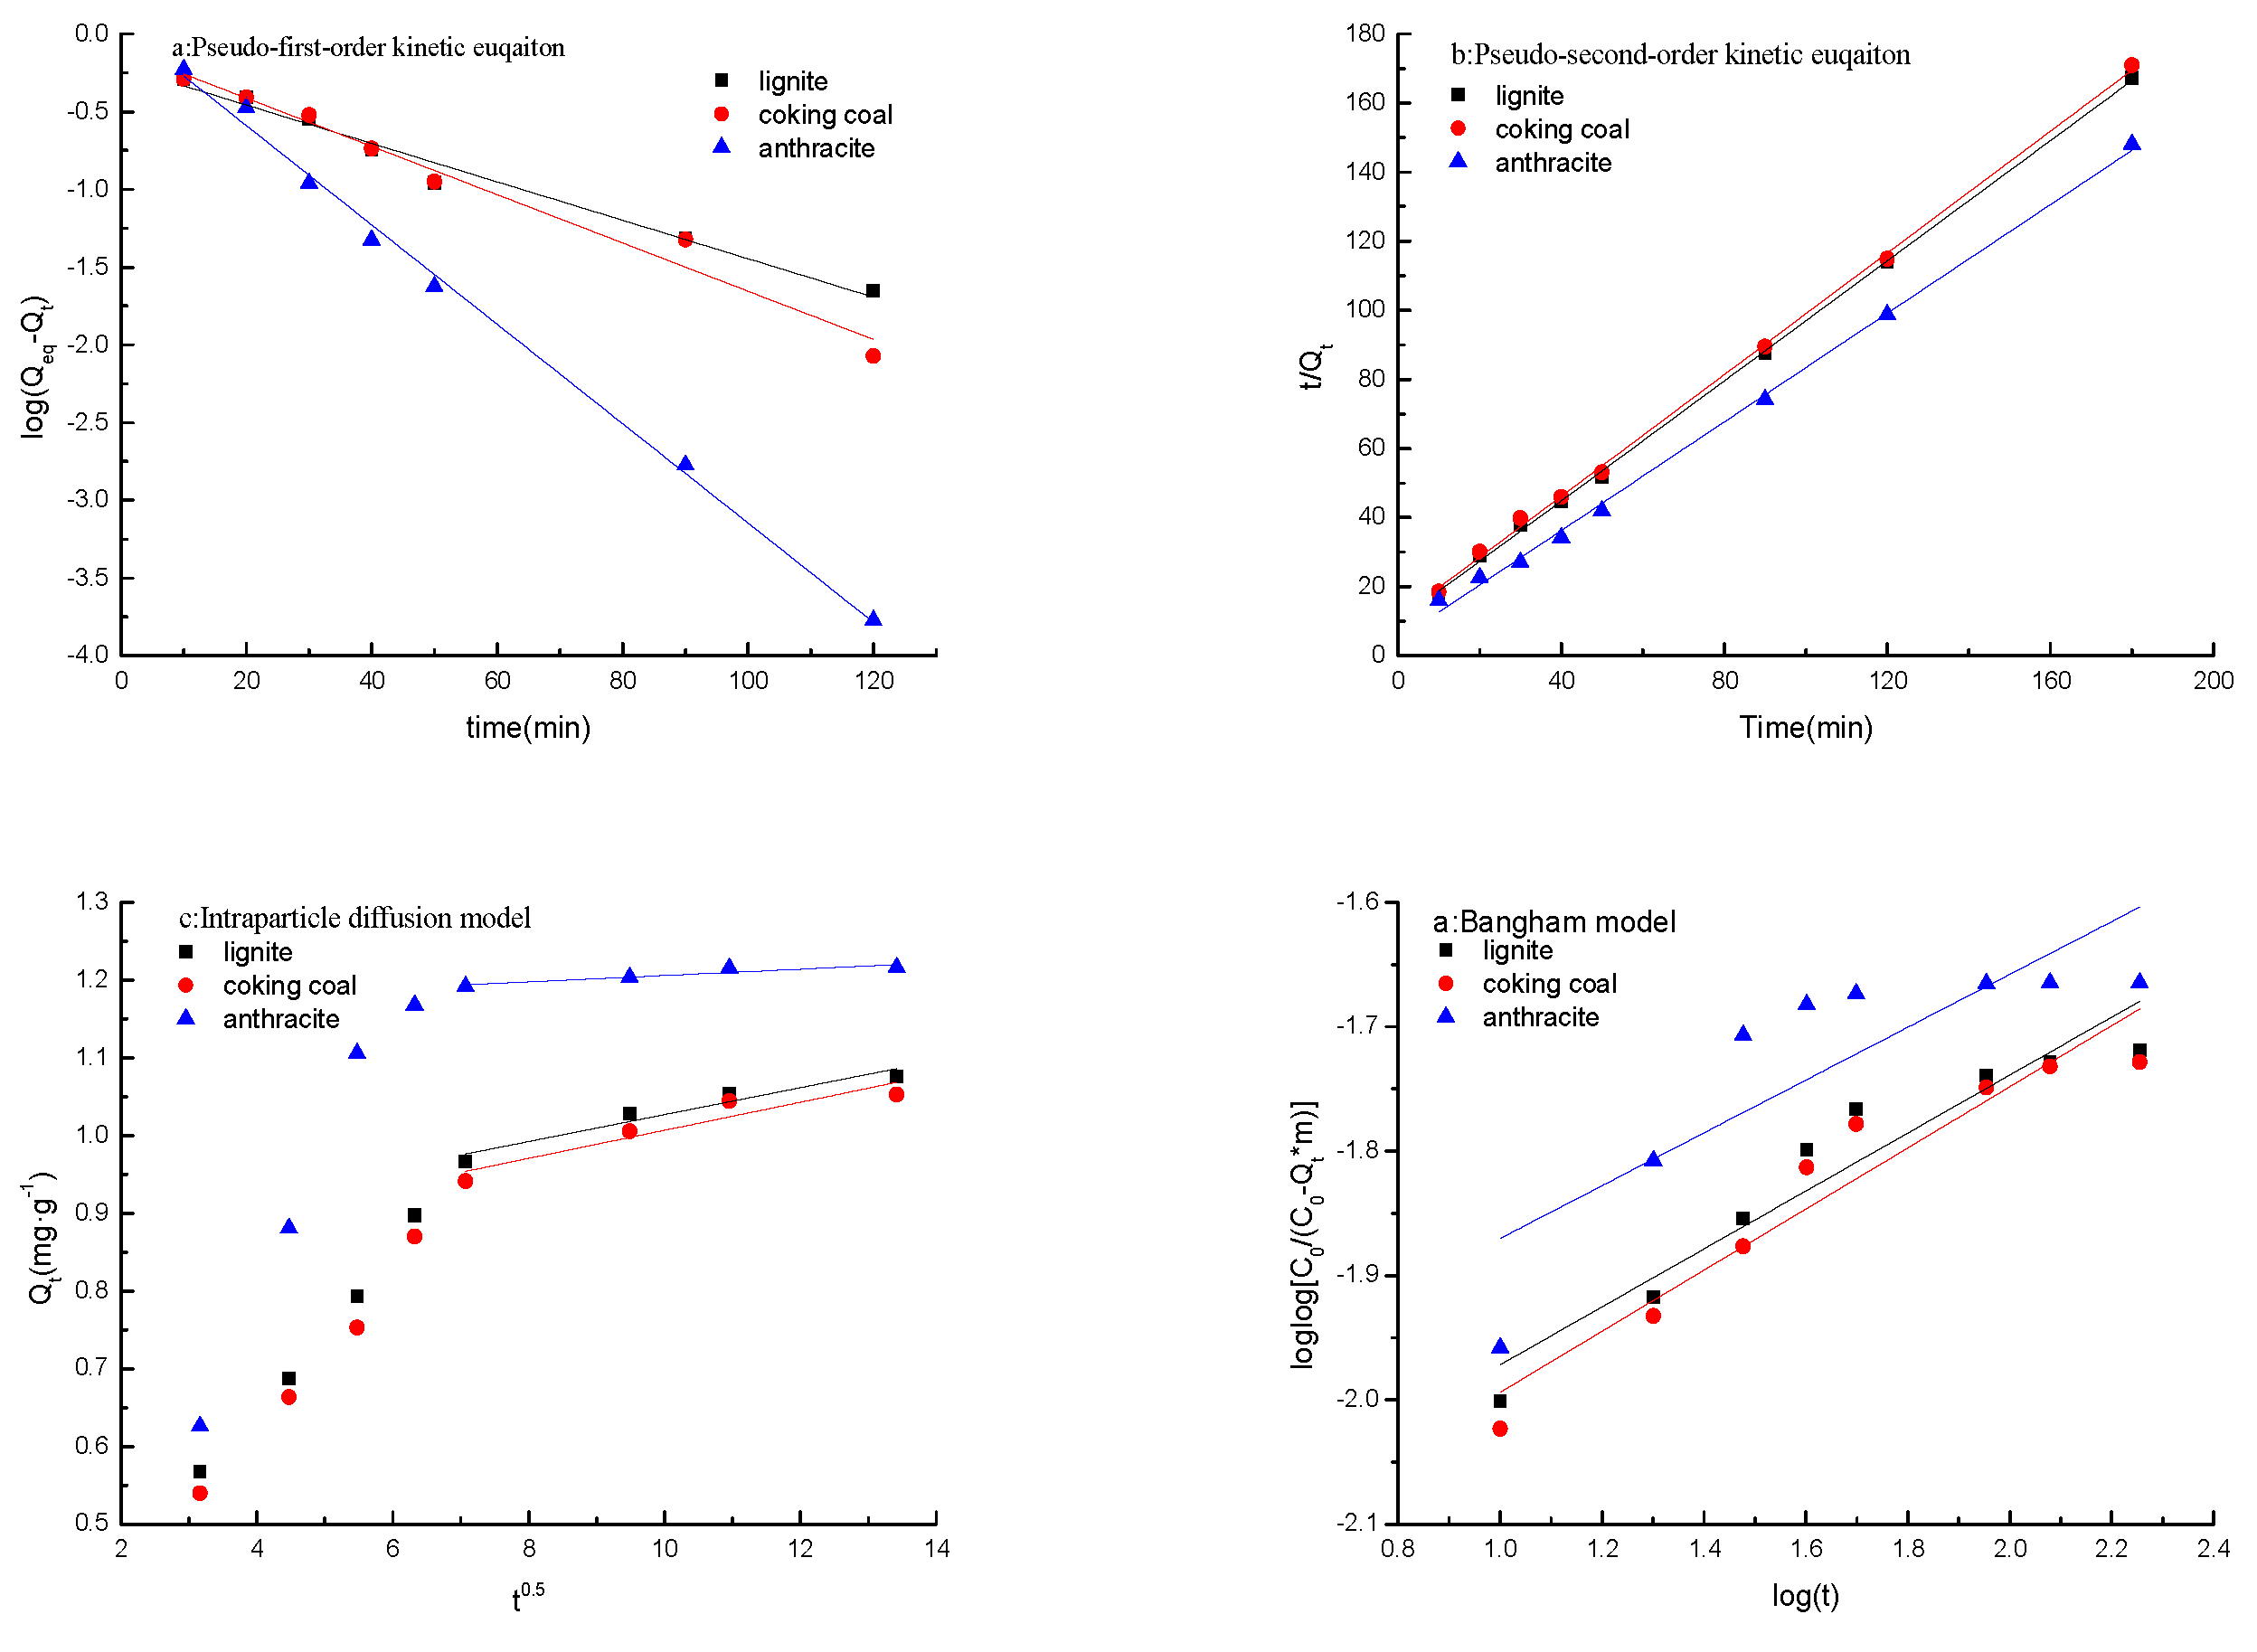
2.5.1. Pseudo-First-Order Kinetic Equation

The Lagergren pseudo-first-order rate equation is a commonly used rate equation for sorption, first presented by Lagergren in 1898 [22,23,24,25]. It can be expressed as follows:
d Q t d t = k 1 ( Q e q Q t )
The equation for the pseudo-first-order kinetic model can be integrated to yield the following expression:
Q t = Q e q ( 1 e k 1 t )
The pseudo-first-order kinetic equation can be expressed in its linear form as follows:
l o g ( Q e q Q t ) = l o g Q e q [ k 1 2.303 t ]
The boundary conditions are Q e q = 0 at t = 0 and Q t = Q e q at t = t, where Q e q (mg·g−1) is the amount of pyridine adsorbed at equilibrium; Q t (mg·g−1) is the amount of pyridine adsorbed at time t (min); and k1 (min−1) is the pseudo-first-order rate constant.
The straight-line plots of l o g ( Q e q Q t ) against t have been tested to obtain parameters of k1 and Q e q .

2.5.2. Pseudo-Second-Order Kinetic Equation

The pseudo-second-order kinetic equation [26,27], proposed by Ho and Mackay in 1986 [26], is as follows:
d Q t d t = k 2 Q e q Q t 2
where Q e q (mg·g−1) is the amount of pyridine adsorbed at equilibrium; Q t (mg·g−1) is the amount of pyridine adsorbed at time t (min); and k2 (g·mg−1·min−1) is the pseudo-second-order rate constant.
The integration form of the pseudo-second-order kinetic equation is as follows:
1 ( Q e q Q t ) = 1 Q e q + k 2 t
The linear form of the pseudo-second-order kinetic equation can be represented as follows:
t Q t = 1 k 2 Q e q 2 + t Q e q
The boundary conditions are Q t = 0 at t = 0 and Q t = Q e q at t = t.
The t/ Q t versus t plots were examined to determine the parameters of k2, h, and Q e q . When the adsorption process follows the pseudo-second-order model, plotting t/ Q t against t yields a linear relationship with a positive y-axis intercept and a slope equal to k2. Utilizing the pseudo-second-order kinetic equation provides a more comprehensive understanding of the adsorption behavior and is consistent with the rate-controlling steps, unlike the pseudo-first-order kinetic equation.
The pseudo-second-order rate expression has a special feature with which the initial sorption rate at t = 0, denoted as h (mg·g−1 min−1), can be calculated [24,28,29]. The calculation of the initial sorption rate h is given by the following equation:
h = k 2 × Q e q 2
where Q e q (mg·g−1) is the amount of pyridine adsorbed at equilibrium.

2.5.3. The Intraparticle Diffusion Model

The internal diffusion phenomenon of the porous material is very complicated. It is affected not only by the pore diffusion but also by the surface diffusion of a pore. The intraparticle diffusion model, proposed by Weber–Morris [30,31], is employed to study the diffusion within the inner pores, which is frequently the rate-controlling step. The intraparticle diffusion kinetic equation can be expressed as follows:
Q t = k 3 t 0.5 + m
The pseudo-second-order kinetic equation can be utilized to calculate the initial sorption rate, h. The intraparticle diffusion rate constant k3 (mg·g−1·min−0.5) and the intercept m (mg·g−1) can also be obtained from the equation, where the intercept represents the boundary layer thickness, and the larger it is, the stronger the boundary effect will be [30].
In cases where the adsorption plot exhibits multi-linearity, it signifies a three-step adsorption process. The initial steep segment of the adsorption curve can be attributed to the diffusion of adsorbate molecules from the liquid phase to the external surface of the adsorbent or the boundary layer diffusion of solute molecules. The adsorption process typically exhibits three distinct stages in the kinetic study. The adsorption process can be divided into three stages. First, there is a noticeable increase in the adsorption rate, which can be attributed to the diffusion of adsorbate molecules from the solution to the external surface of the adsorbent or the boundary layer diffusion of solute molecules. The second stage is characterized by a gradual increase in adsorption, with intraparticle diffusion becoming the rate-limiting step. The third and final stage is the equilibrium stage, where the adsorption reaches a point of no significant increase [32].
The straight-line plots of Qt against t0.5 have been employed to determine the parameters of k3 and m. If the line passes through the origin, it signifies that intraparticle diffusion is the sole rate-controlling step. However, if the adsorption plot does not intersect the origin, it implies that the rate-limiting step involves additional processes such as internal mass transfer and boundary-layer mass transfer, rather than being solely governed by intraparticle diffusion [32,33]. The value of K3 can be determined by calculating the gradient of the linear portion of the curve. The intercept of the graph corresponds to the thickness of the boundary layer [34].

2.5.4. Bangham Model

The Bangham kinetic equation [35] that was presented by Bangham is expressed as follows:
d Q t d t = k 4 ( C 0 Q t m ) γ t γ 1
The integrated form of the Bangham model has been developed to describe the adsorption process:
Q t = C 0 m C 0 m e x p ( k 4 m t γ )
The line form of the Bangham model has been formulated and is as follows:
l o g   l o g ( C 0 C 0 Q t m ) = l o g ( k 4 m 2.3 ) + γ l o g t
The boundary conditions are Q t = 0 at t = 0 and Q t = Q e q at t = t, where C0 (mg·L−1) is the initial adsorbate concentration in solution, m (mg·L−1) is the adsorbent concentration, k4 is the proportionality constant, and γ is a constant.
The straight-line plots of l o g   l o g ( C 0 C 0 Q t m ) against log t have been tested to obtain parameters of k4 and γ. The data can be utilized to verify if the Bangham equation [36,37] establishes pore diffusion as the rate-controlling step.

3. Results

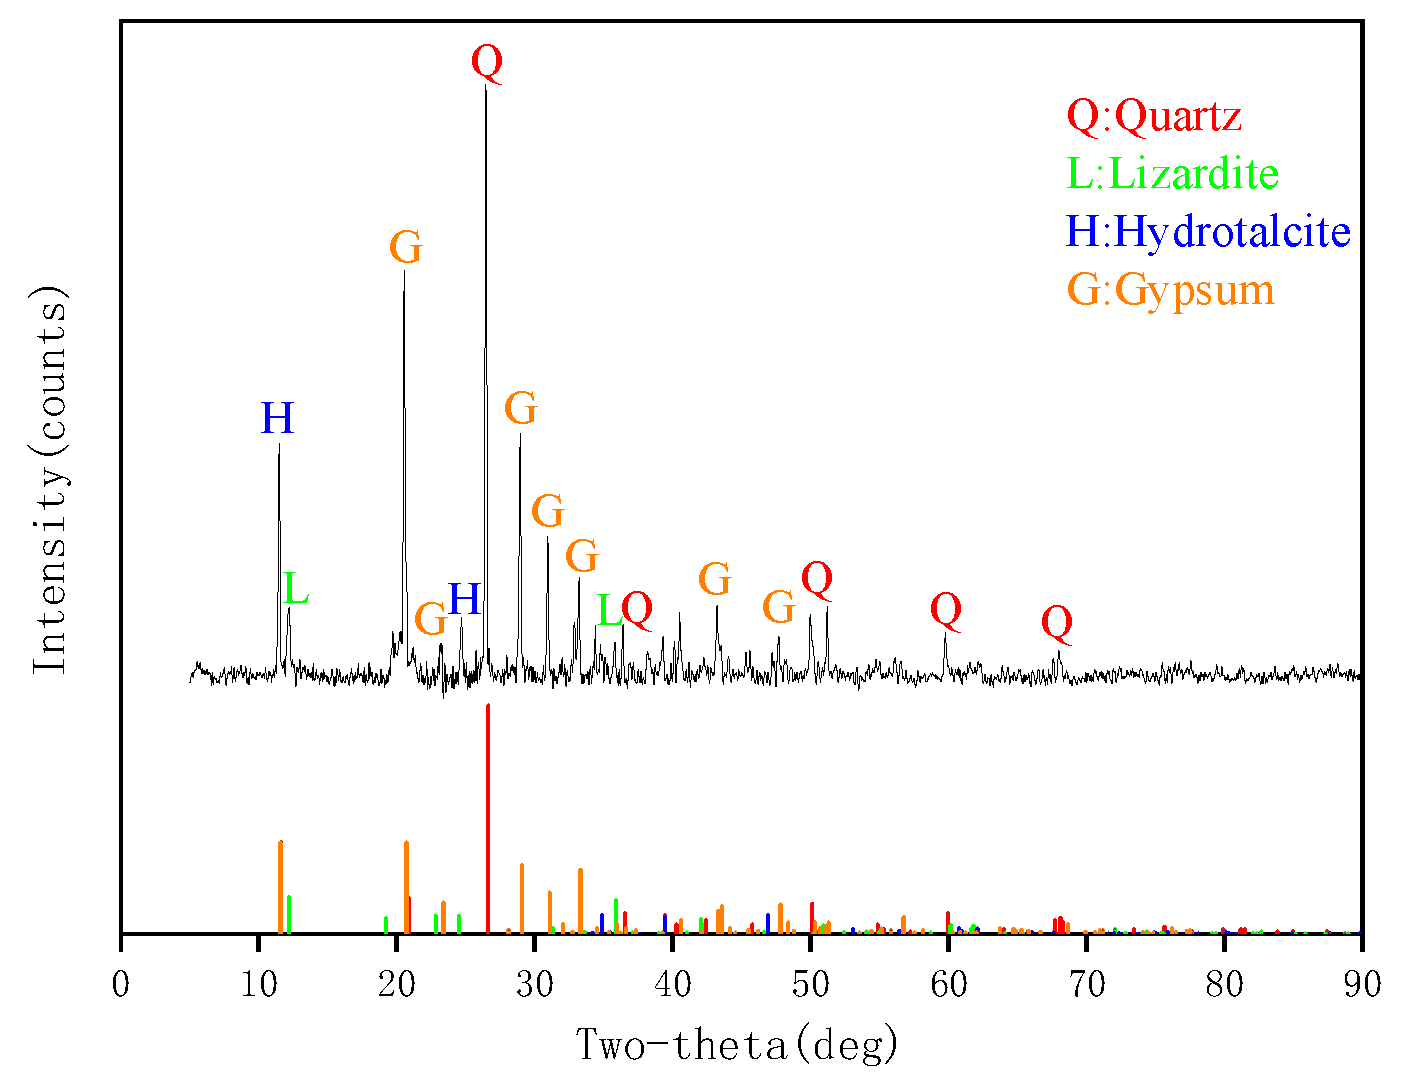
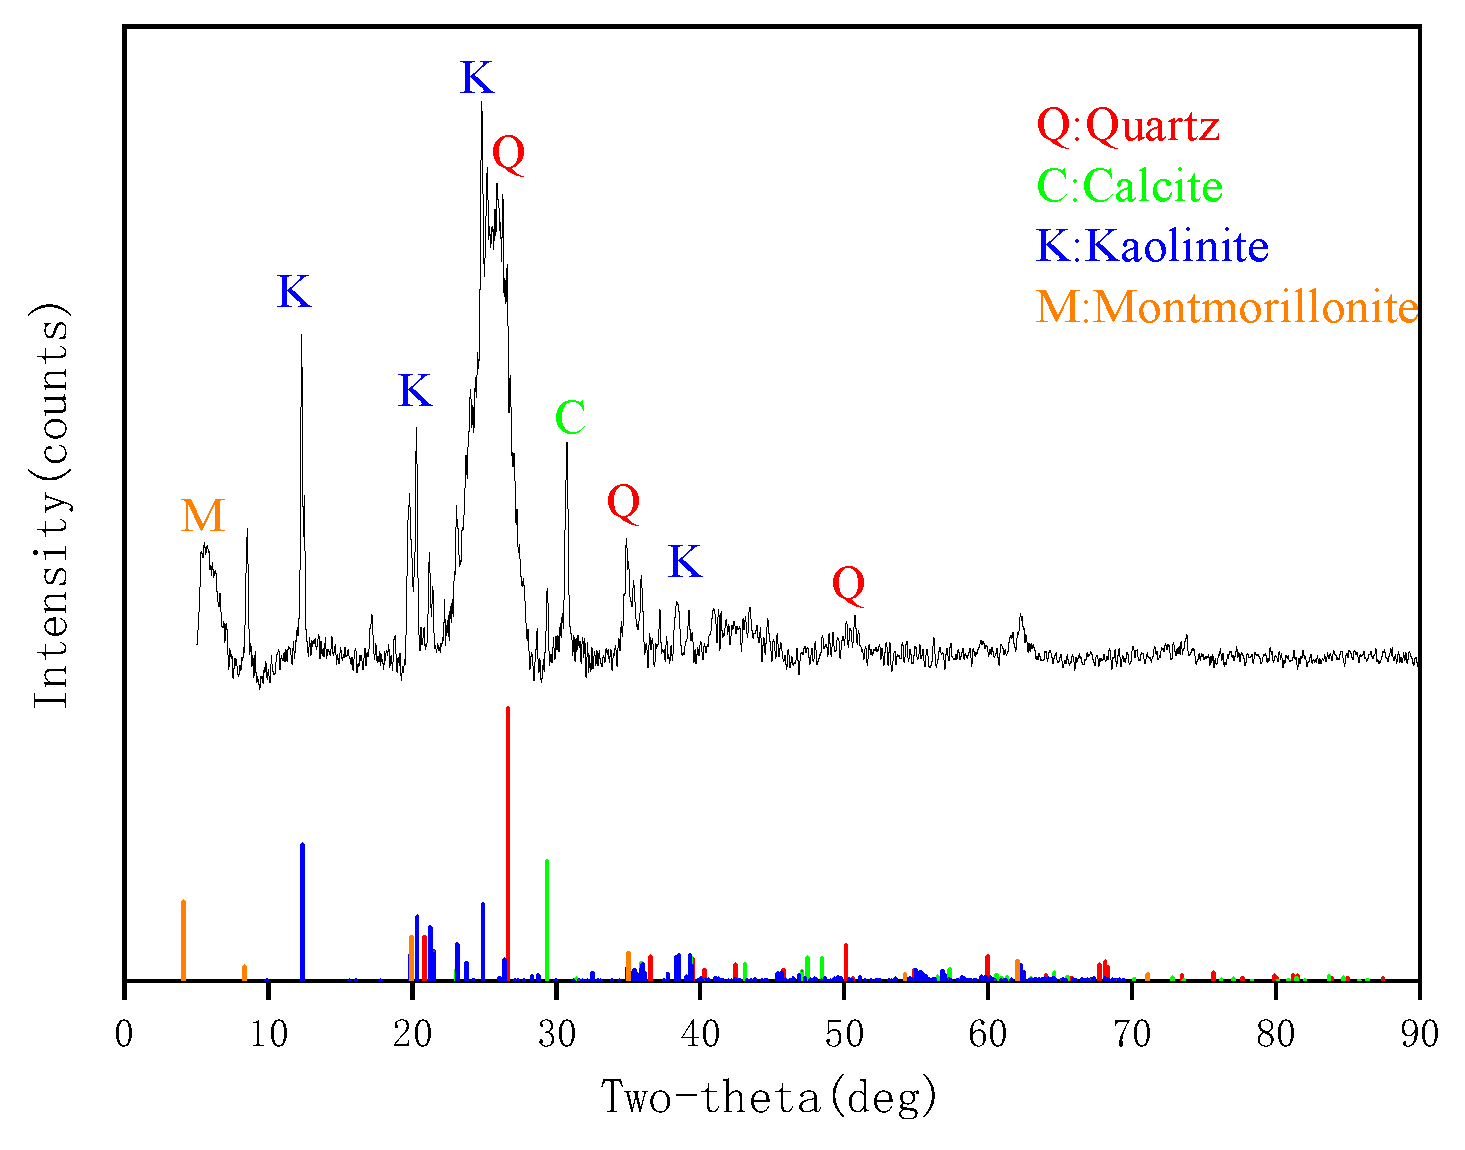
3.1. Composition of Lignite, Coking Coal, and Anthracite

Figure 1, Figure 2 and Figure 3 illustrate the X-ray diffraction patterns of lignite, coking coal, and anthracite.
After comparing the X-ray diffraction peaks with an X-ray standard card (JCPDS), “label them accordingly”. The XRD results in Figure 1 shows the lignite sample that, besides containing coal, still contains gangue minerals, including large amounts of quartz with a small amount of calcite, illite and montmorillonite, mica, and pearl clay minerals.
The XRD result in Figure 2 shows the coking coal sample that, besides containing coal, still contains gangue minerals, including large amounts of kaolinite and quartz with a small amount of calcite among others.
The XRD result in Figure 3 shows the anthracite sample that, besides containing coal, still contains gangue minerals, primarily including kaolinite and quartz with a small amount of calcite, montmorillonite, mica, and nacrite.
The analysis showed that the three coal samples contained minor amounts of gangue, and the predominant minerals of the gangue determined their quality. The composition of coal is the main factor affecting the adsorption test, and clay minerals have less influence on it due to their low content, and hence, their influence is not addressed in the subsequent discussion.

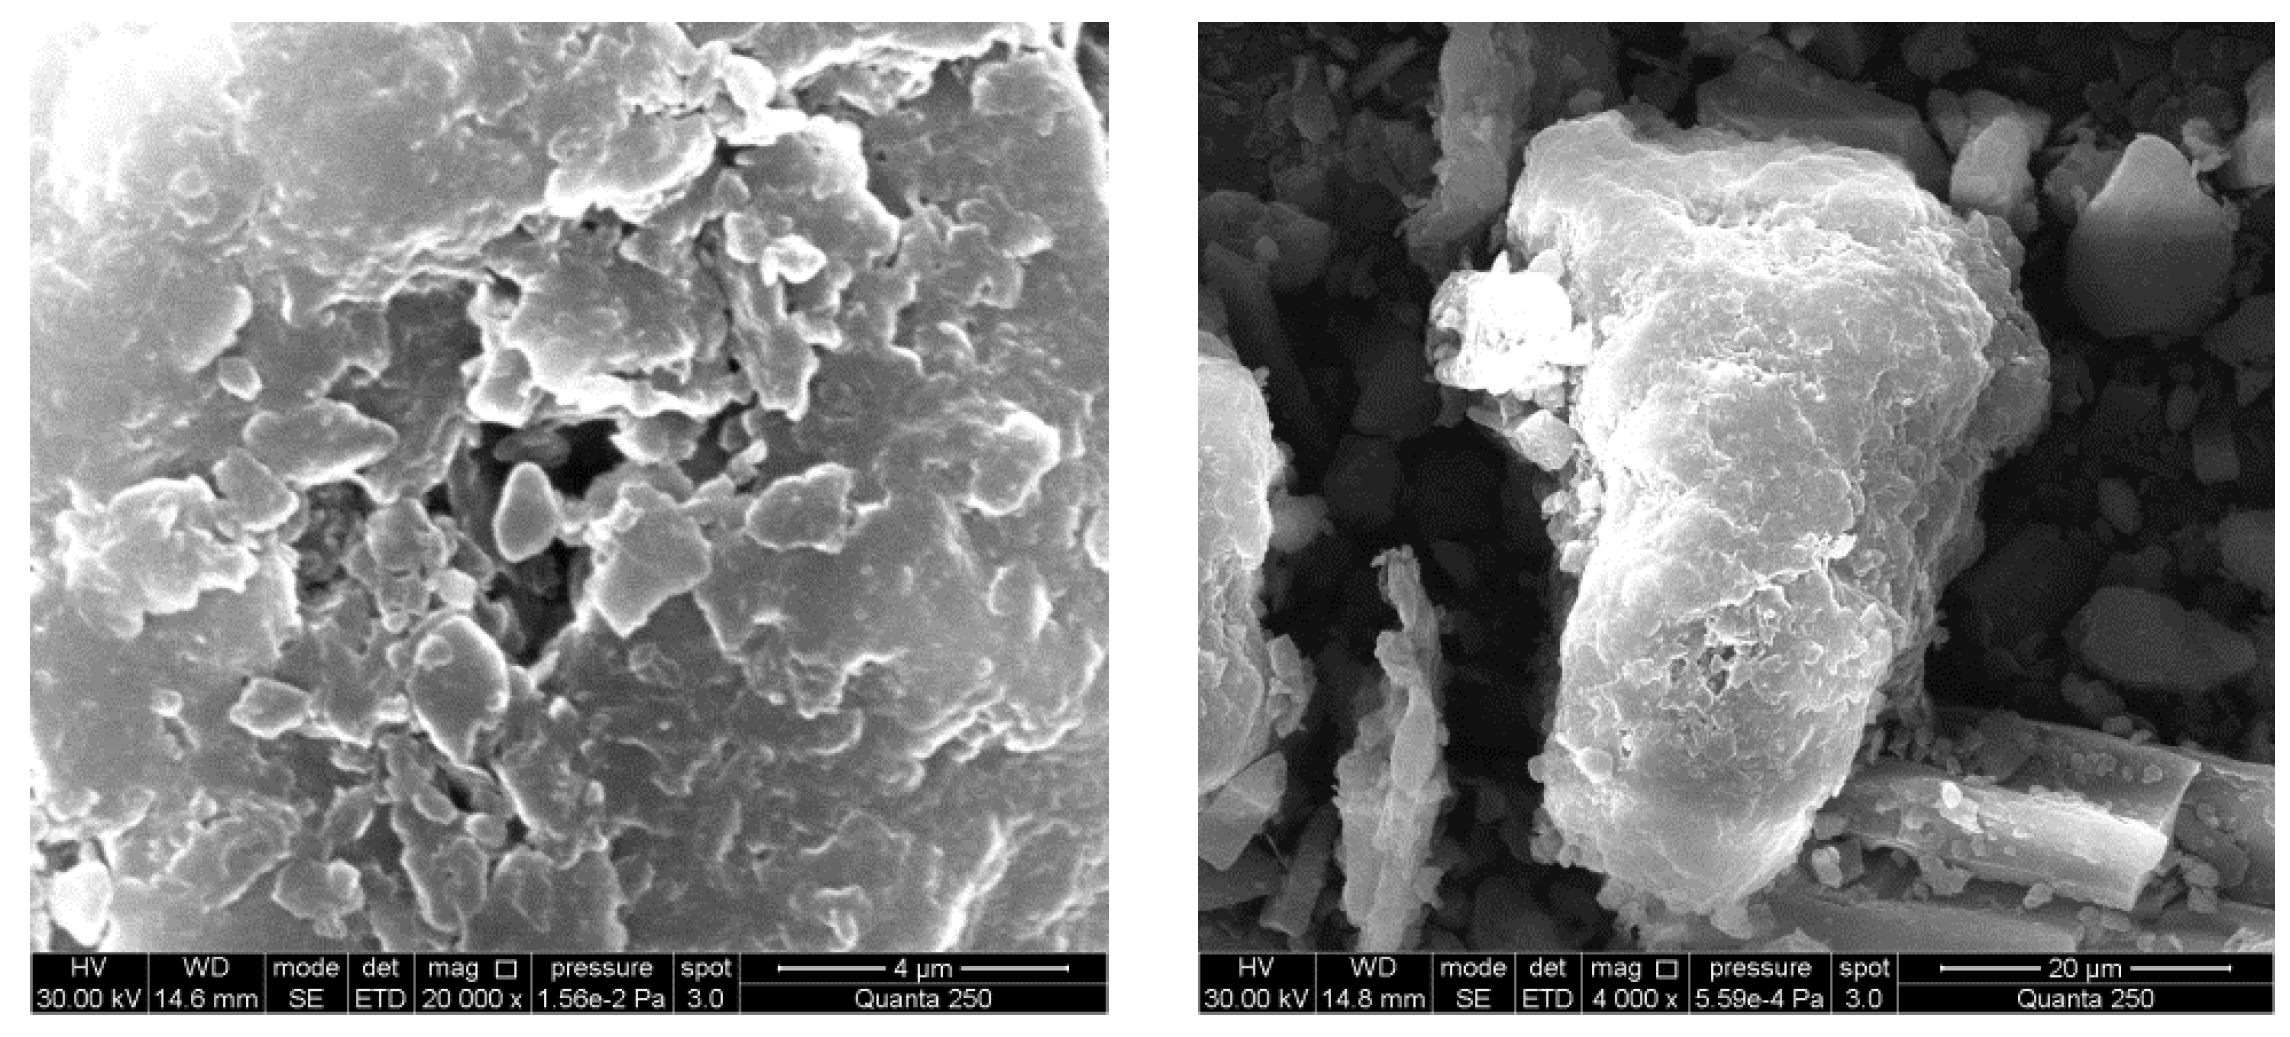
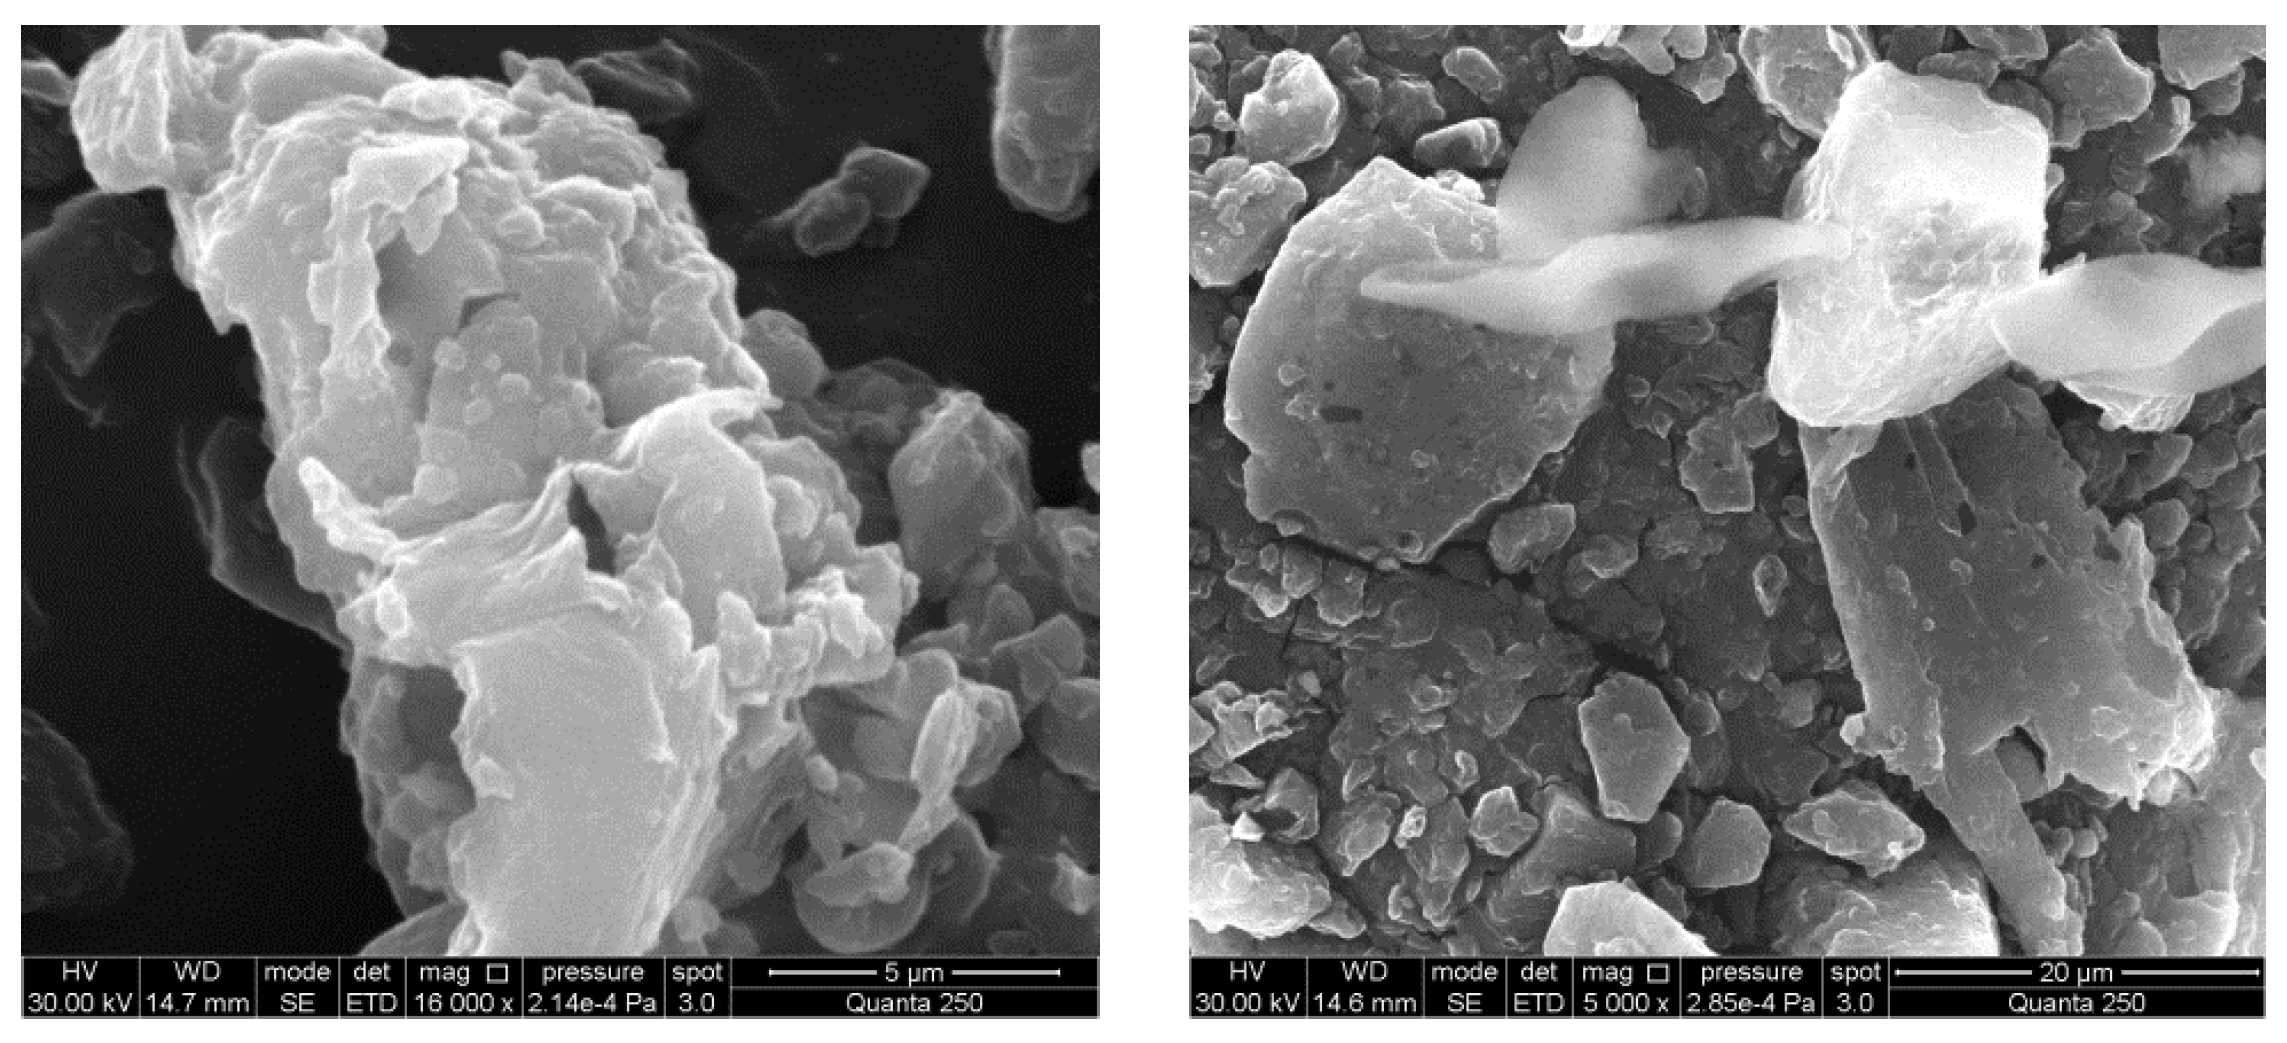
3.2. SEM Analysis of Adsorbents
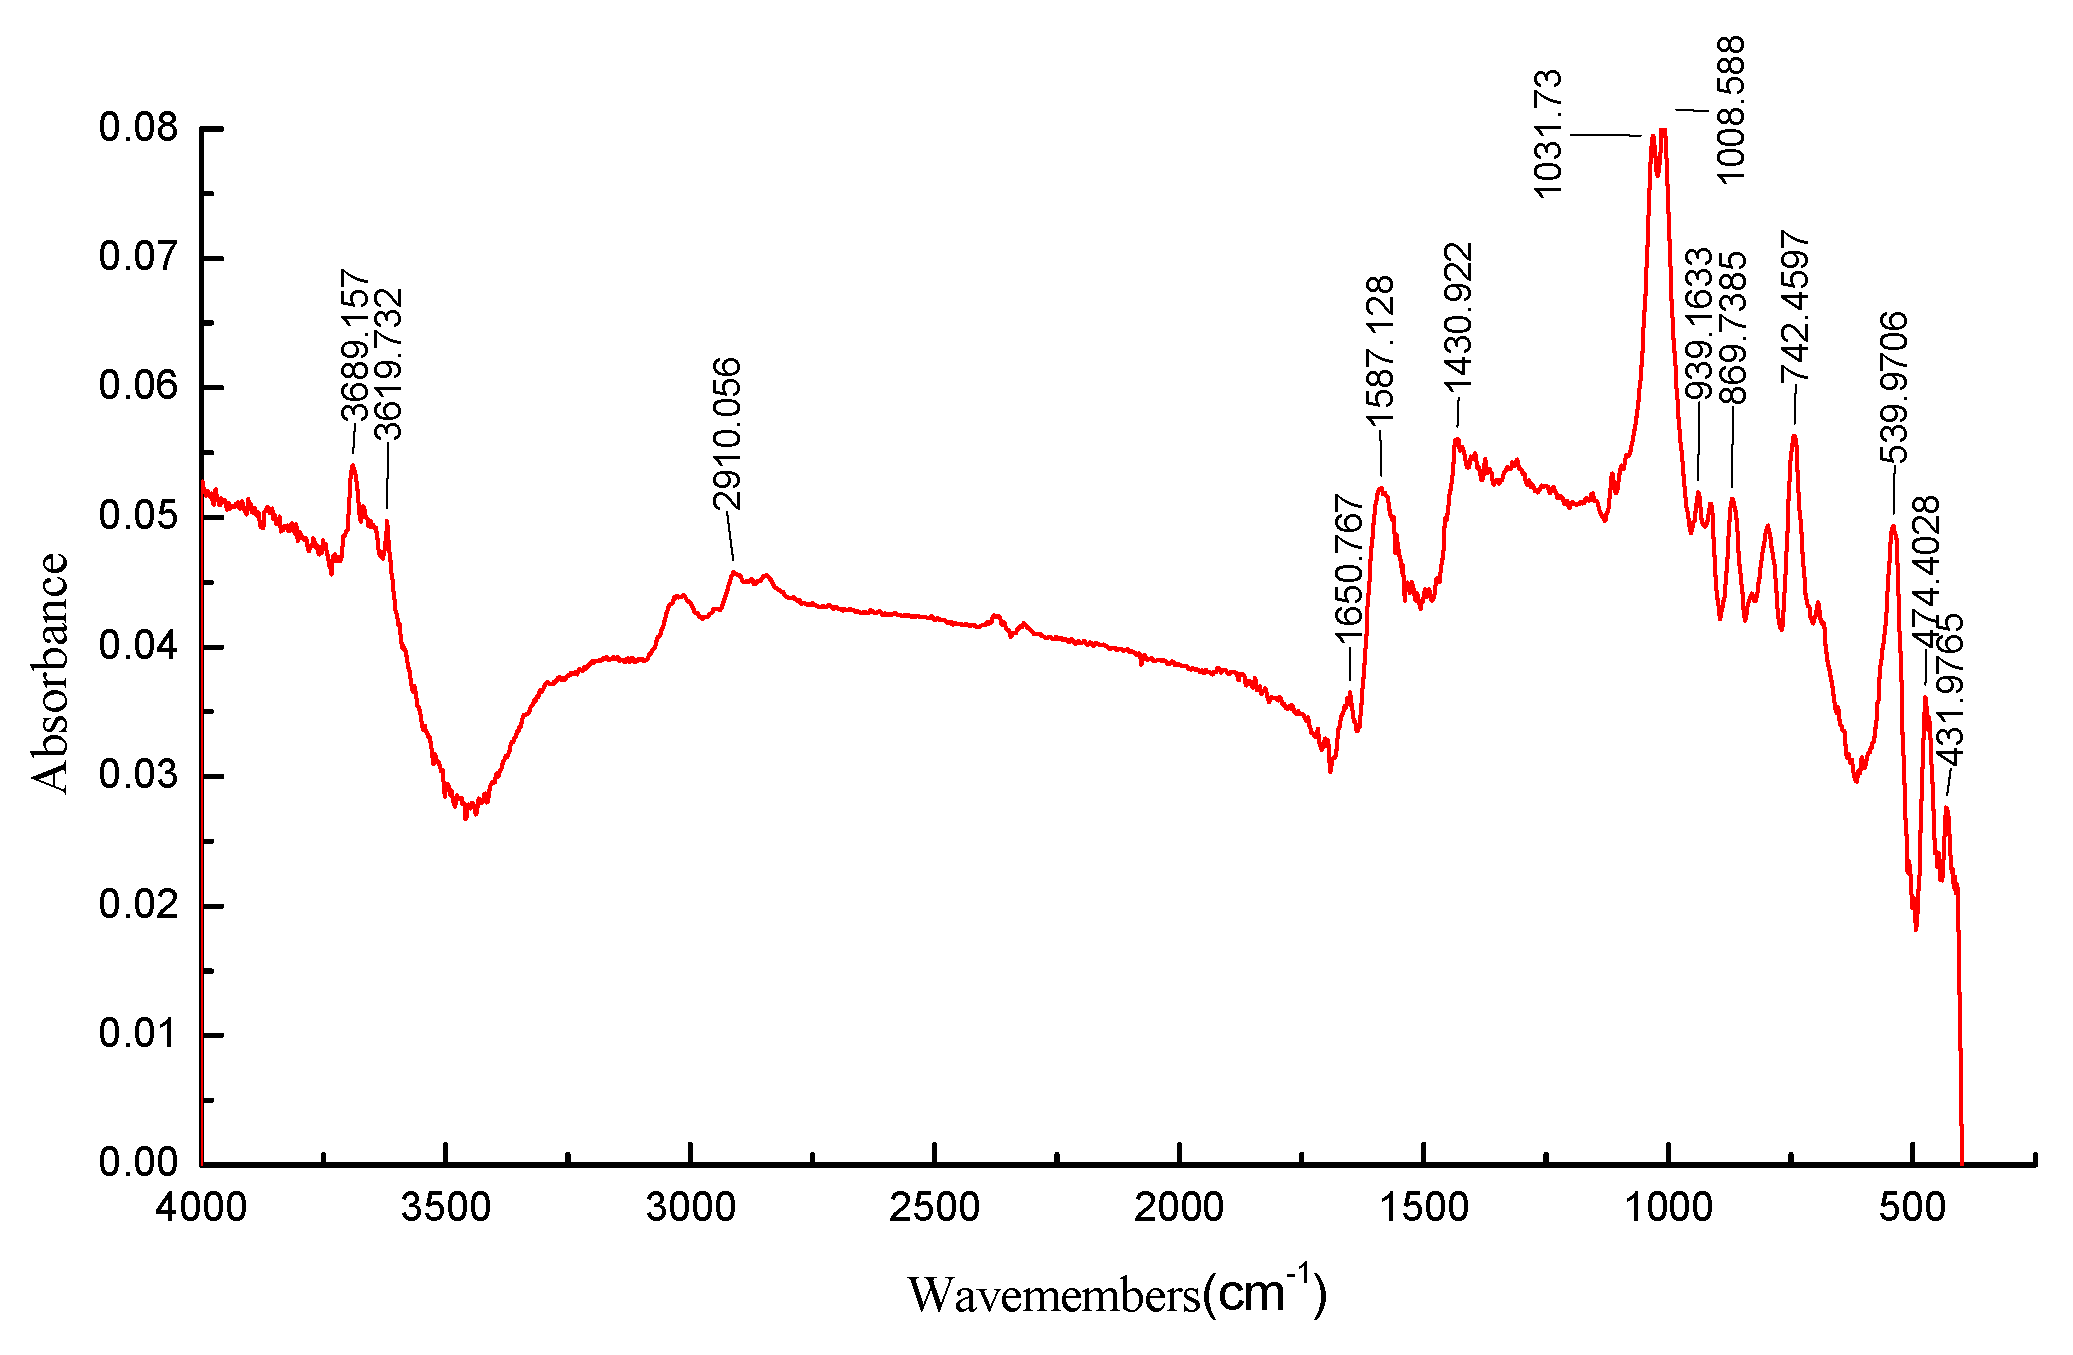
Figure 4, Figure 5 and Figure 6 showcase the Scanning Electron Microscopy (SEM) images of lignite, coking coal, and anthracite. It is evident from the images that the surface of coking coal appears to be rougher compared to the other two coal samples. Additionally, anthracite has a higher number of micropores.

3.3. FTIR Analysis

The FTIR spectra of lignite, coking coal, and anthracite are illustrated in Figure 5, Figure 6 and Figure 7.
According to Figure 7, Figure 8 and Figure 9 and the infrared spectroscopic analysis [38,39], the comparative infrared spectral analysis of the coal samples showed that the absorption peaks at 3600~3200 cm−1 decreased with the increase in the degree of metamorphism, indicating that the -OH decreased with the increase in the degree of metamorphism. The absorption peak at 1330~1132 cm−1 decreases with the increase in the degree of coal denaturation, indicating that the Hanyang functional group decreases with the increase in the degree of coal denaturation. Therefore, as the degree of coal denaturation increases, the content of aromatic nuclei in the coal molecular structure increases, and the non-aromatic structures and oxygen-containing functional groups gradually decrease.
By comparing Figure 5, Figure 6 and Figure 7, it was observed that i, the average length of the alkyl side chain in the condensed ring, reduced as the coalification degree increased. Both the amounts of oxygen-containing functional group and carbonyl also decreased with the increase in the degree of coalification. There are oxygen-containing functional groups and carbonyls in different metamorphic degrees of coals, including lignite, coking coal, and anthracite.

3.4. The Specific Surface Area

According to Table 1, the specific surface area of lignite, coking coal, and anthracite were determined to be 6.0876 m2·g−1, 5.7864 m2·g−1, and 6.1479 m2·g−1, respectively.

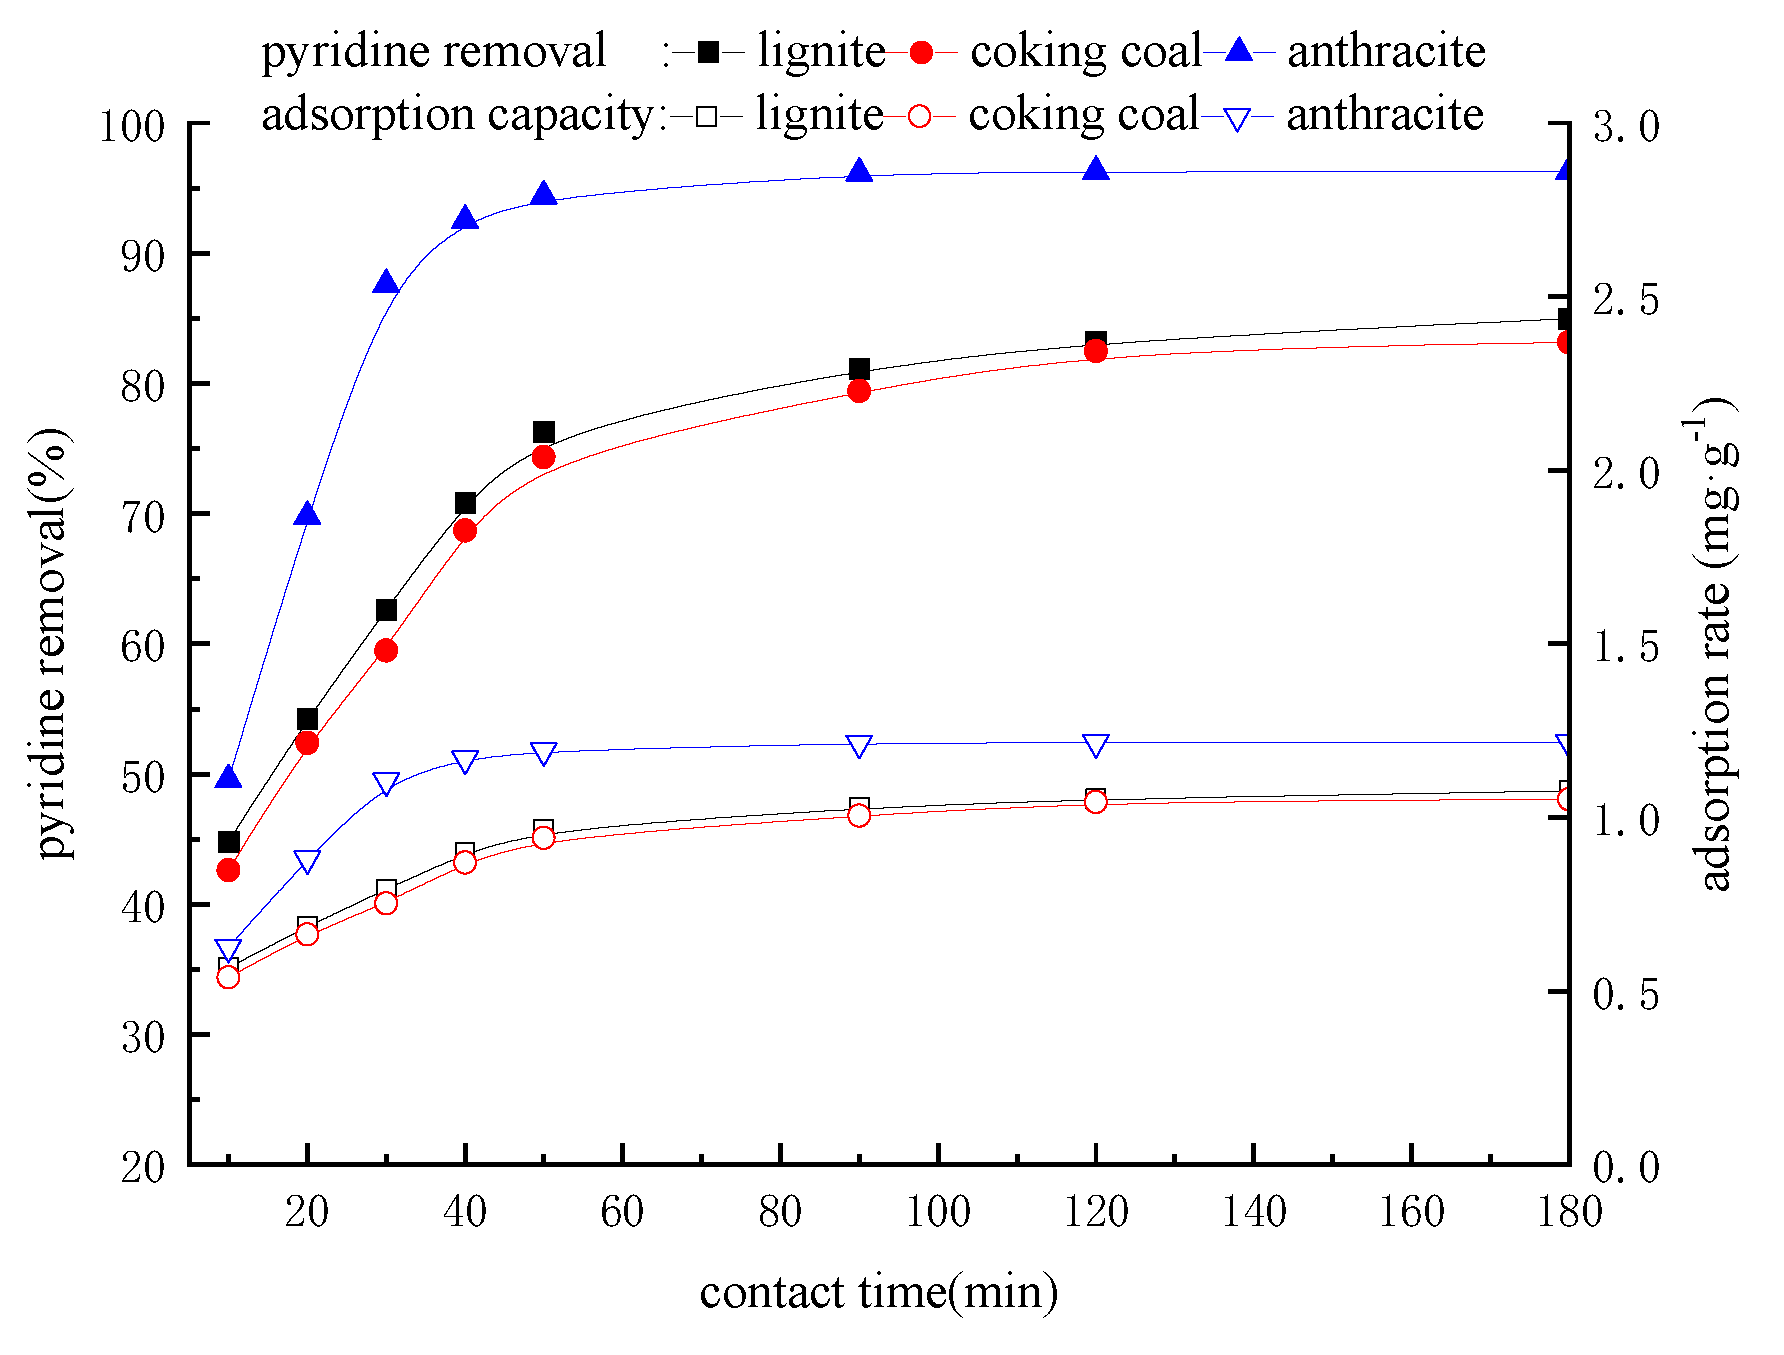
3.5. Effect of Contact Time

Figure 10 illustrates the adsorption rate and pyridine removal efficiency at different contact times.
As depicted in Figure 10, the adsorption rate and pyridine removal efficiencies of lignite, coking coal, and anthracite exhibit a gradual decrease within the initial 60 min. Subsequently, they reach a quasi-equilibrium state after 80 min, with no significant further increase in removal observed thereafter. Anthracite demonstrates superior adsorption rate and pyridine removal efficiency compared to the other two coal types. This remarkable performance can be attributed to the largest reduction in specific surface area, which is directly correlated with the adsorption rate.

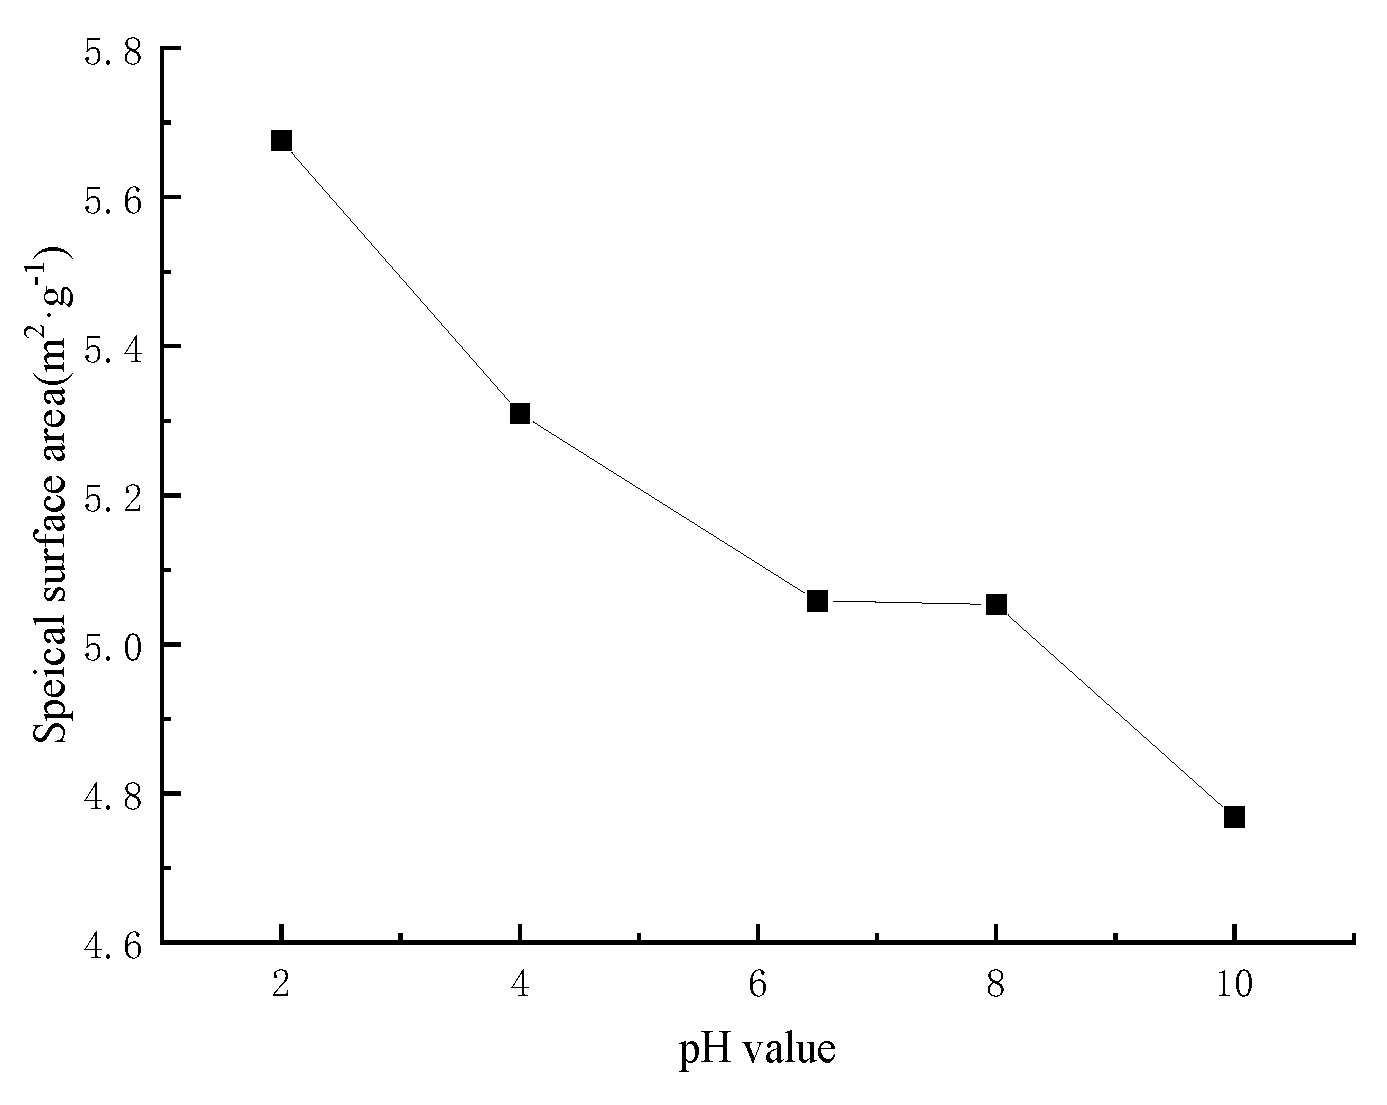
3.6. Effect of pH on Specific Surface Area

The research focused on coal as the subject of study, and soaking experiments were performed using solutions with varying pH levels. Subsequently, the coal samples were subjected to analysis using the BEL automatic adsorption instrument to ascertain their specific surface areas’ variation patterns associated with pH, as illustrated in the figure below.
Figure 11 depicts the correlation between pH levels and the specific surface area of coking coal. The graph reveals that the specific surface area decreases as the pH value rises from 2.0 to 6.0. Between pH 6.0 and 8.0, the specific surface area remains relatively stable, but it undergoes a sharp decline beyond pH 8.0. The analysis also suggests that hydrochloric acid solutions with known pH values do not substantially alter the coal sample’s macromolecular or fundamental structure. This suggests that the acidity of the oxygen-containing functional groups on the coal surface is predominantly unaltered [39,40,41,42,43]. The observed increase in coking coal’s specific surface area, as depicted in Figure 11, can be attributed to the removal of sulfate and alkali-soluble minerals from the coal’s surface through the application of hydrochloric acid. Figure 11 vividly underscores the substantial influence of pH on the coal’s specific surface area, a critical factor to consider when studying its adsorption behavior.

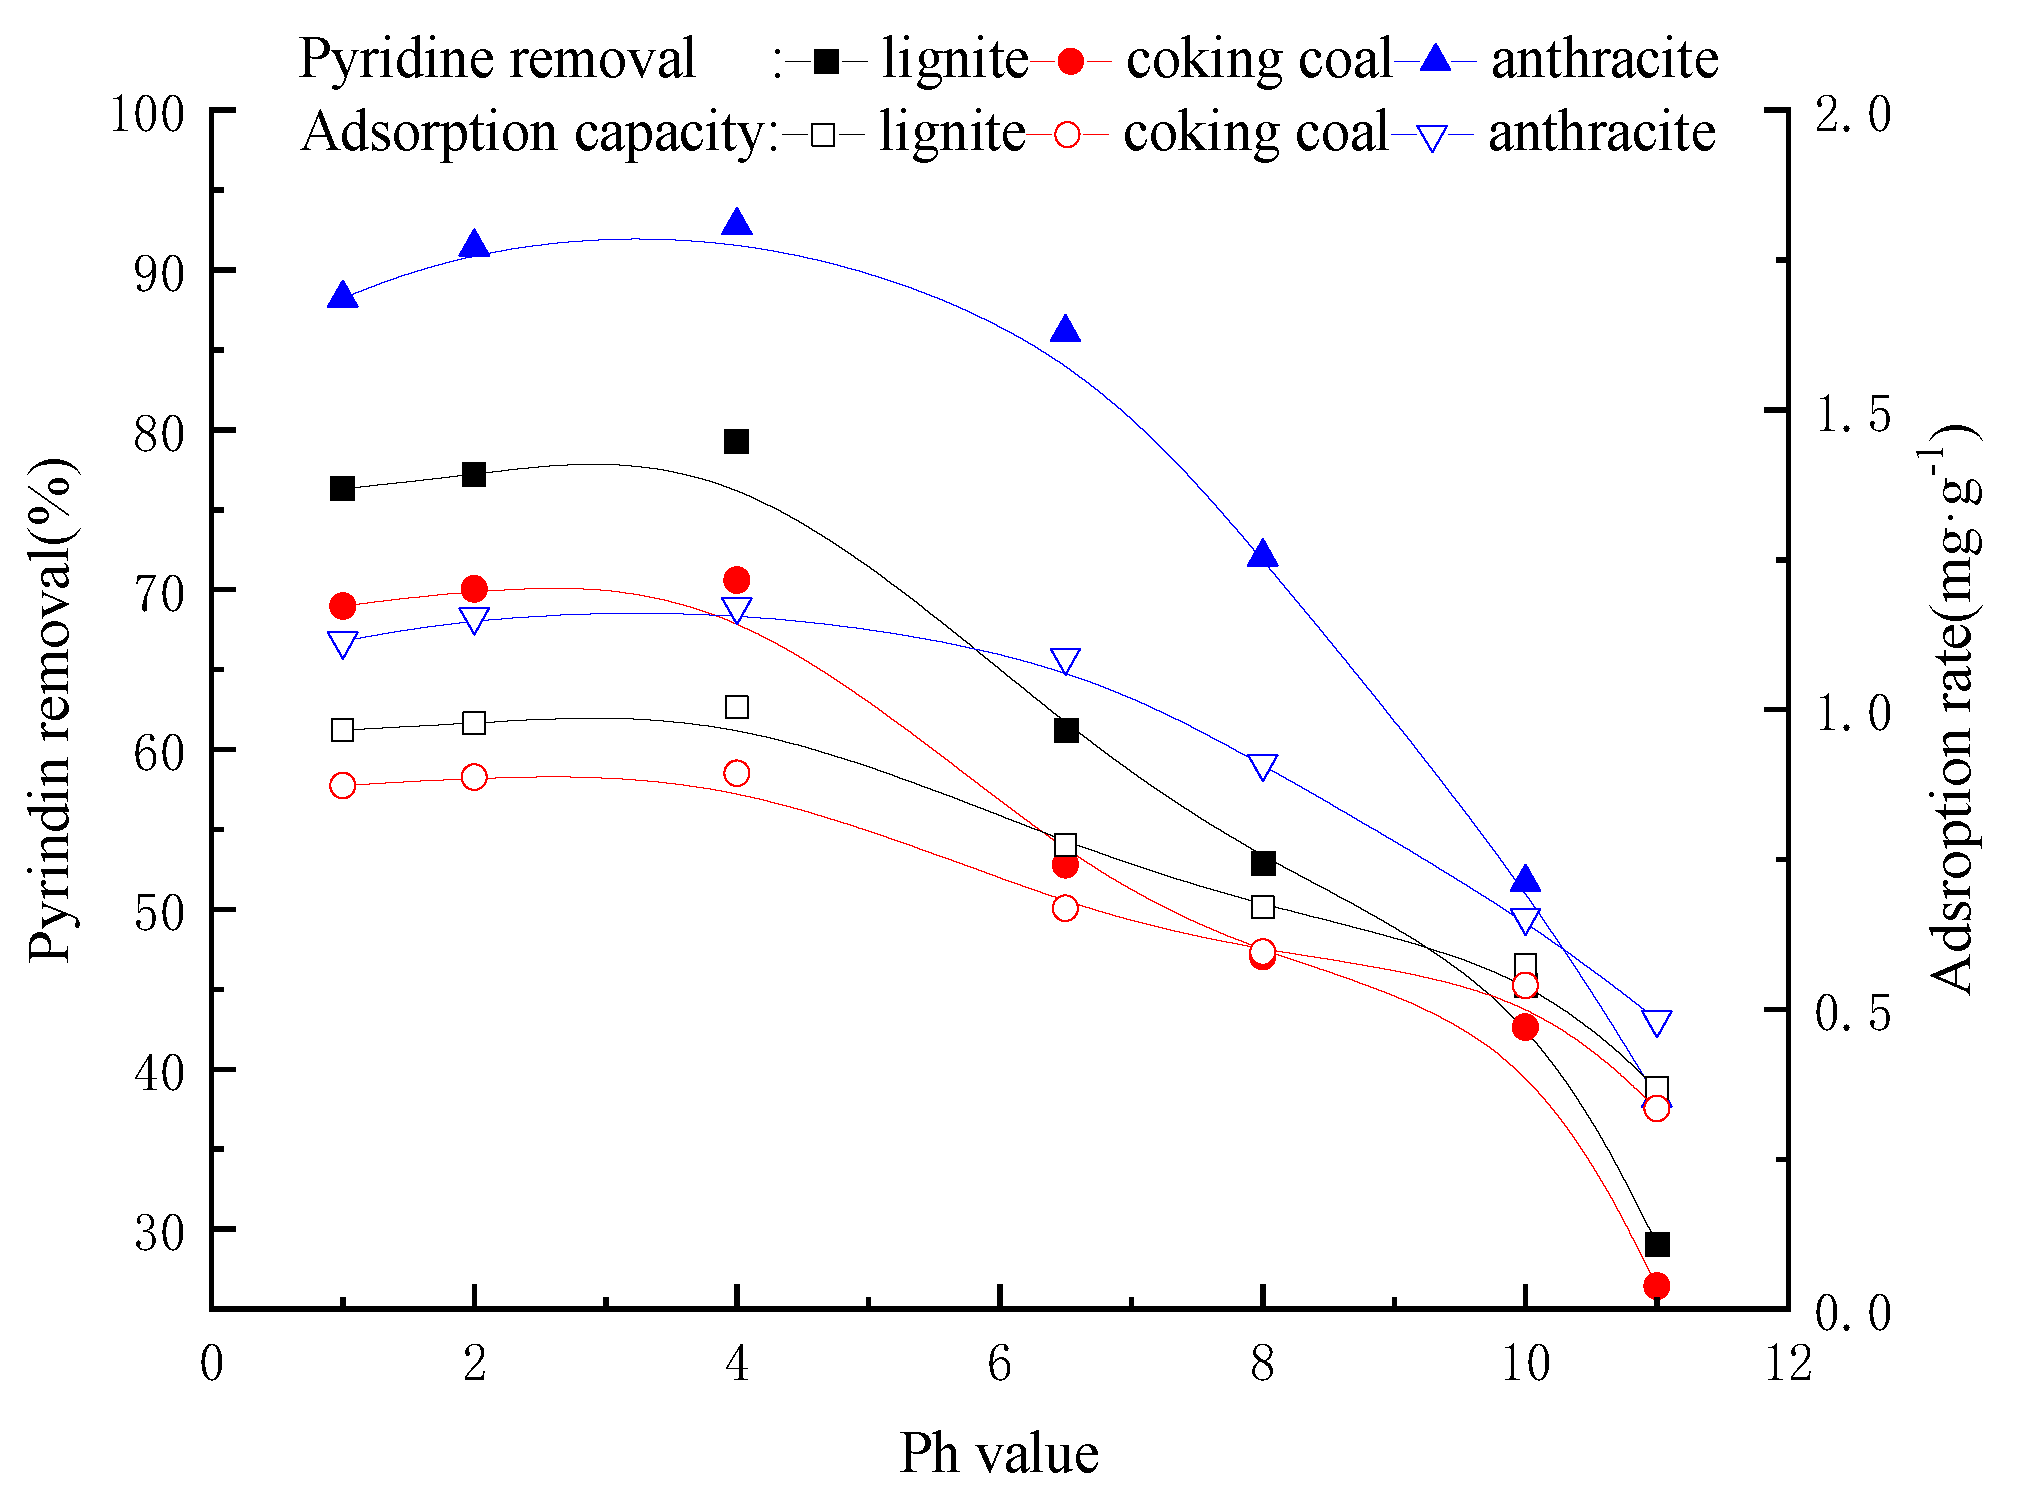
3.7. Effect of pH on Coal Adsorption

Figure 12 illustrates the influence of pH on the adsorption of pyridine from aqueous solutions onto lignite, coking coal, and anthracite. The data presented in Figure 12 indicate that a pH of 4.0 is the optimal condition for achieving the highest pyridine removal efficiency for all three types of coal. Under low pH conditions, ranging from 1.0 to 4.0, the coal’s adsorption rate substantially increases, followed by a gradual decrease as the pH level rises to 14. This phenomenon can be attributed to the reduction in the specific surface area of coal as the pH increases from 1 to 11, which is supported by specific surface area measurements. Furthermore, the distribution of pyridine molecules in different pH solutions depends on the concentration of hydrogen ions in the solution. In acidic solutions, pyridine molecules exist in the form of pyridinium cations, whereas in alkaline solutions, the majority of pyridine molecules exist as neutral species. Such neutral entities are prone to forming ion pairs or coordination complexes.

3.8. Kinetics Models

The equation constants and correlation coefficients extracted from the experimental data were subjected to linear regression analysis, employing the linear forms of the model equations shown in Figure 11. The results of this analysis are depicted in Table 2, and the calculations were performed via software tools such as Origin 2018 and 1st Opt.
The experimental data clearly indicate that the pseudo-first-order rate equation was not an ideal match. Furthermore, the model used in this research is limited to describing the initial adsorption rate within the range of 20–40%, as previously observed by Gerente and Hemashree et al. Further adjustments to the equation might be necessary for longer sorption durations. In the case of lignite, coking coal, and anthracite, the pseudo-second-order rate equation proved to be a better fit compared to the pseudo-first-order rate equation. The correlation coefficients obtained ranged from 0.9975 to 0.9993, further substantiating the appropriateness of utilizing the pseudo-second-order model for detailing the pyridine adsorption process on these coal types.
The Qeq values, calculated as Qeq(calc) and sourced from experimental data, aligned closely with the pseudo-second-order rate equation, as mirrored by Qeq(exp) values in Table 2. This consistency underscores that the pseudo-second-order rate model provides a superior approximation for the sorption of pyridine onto lignite, coking coal, and anthracite. The initial sorption rate values (h) were derived from the pseudo-second-order rate expression. Based on the obtained k2 values, the sorption trend is identified to be anthracite > coking coal > lignite. This observation is explainable by the disparity in their specific surface areas, highlighting the influence of surface area variations on the sorption behavior of pyridine. Specifically, anthracite has the largest surface area while lignite has the smallest.
The intraparticle diffusion model, depicted in Figure 13, enables the assessment of the influences of both intraparticle diffusion and boundary-layer diffusion on the sorption rate. The low correlation coefficients obtained from the Bangham model confirm that the adsorption process is not exclusively controlled by intraparticle diffusion. This insinuates that the overall adsorption rate involves multiple simultaneous processes, contributing to the adsorption process.

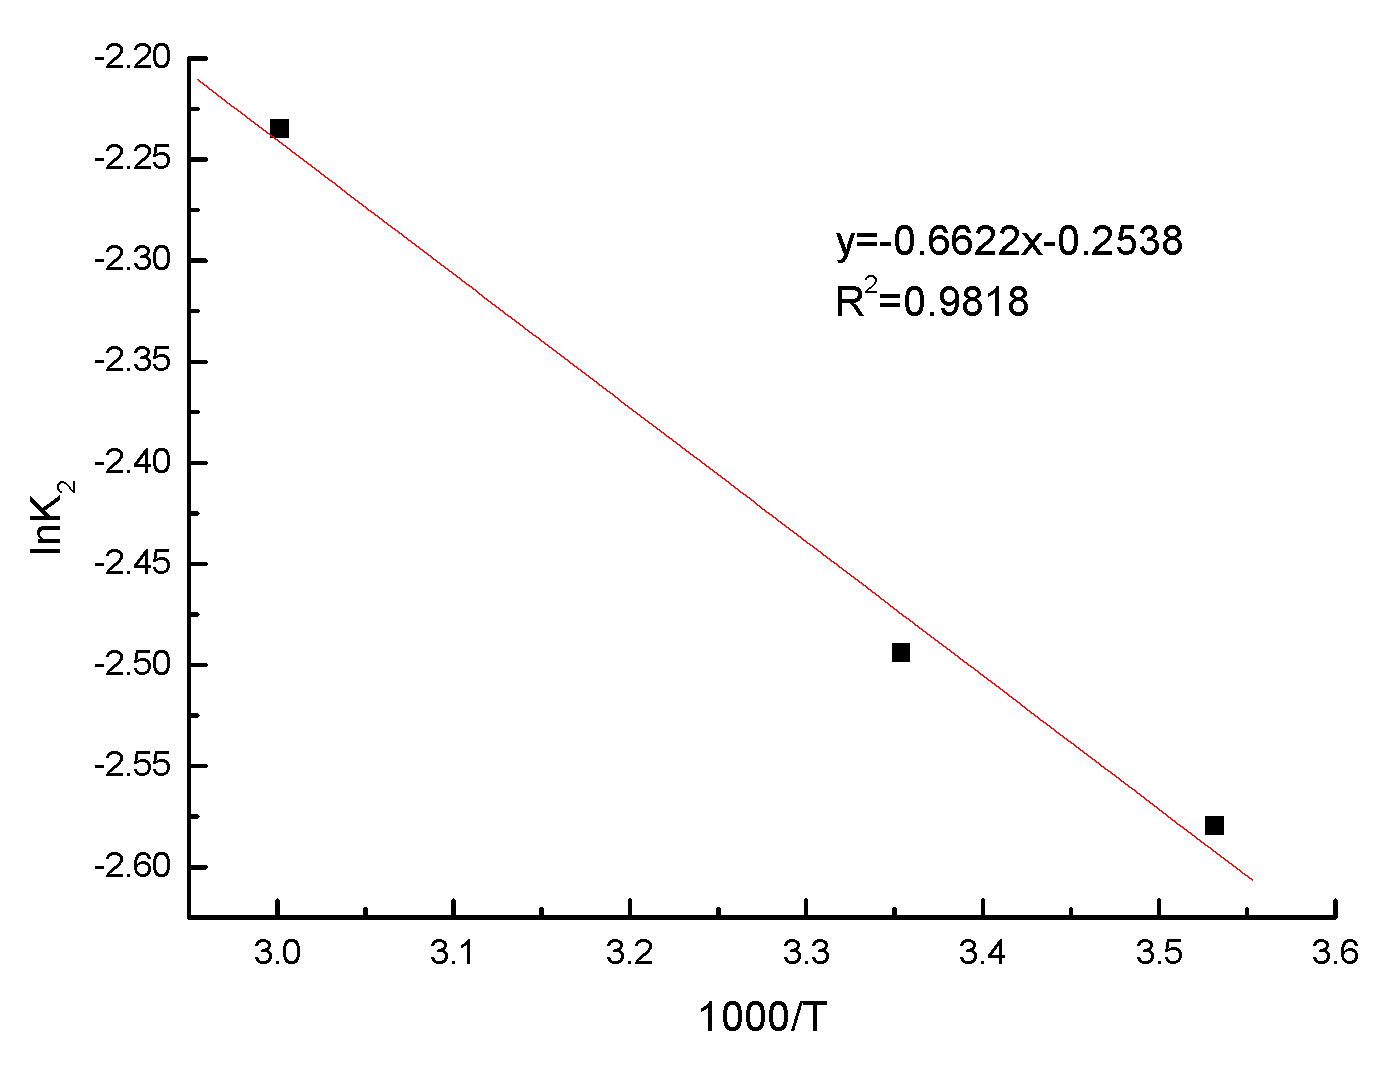
3.9. Adsorption Activation Energy Calculation

The activation energy for pyridine adsorption on coking coal was determined. The results obtained from the kinetic model calculations indicate that the pyridine adsorption onto coking coal can be accurately described by the pseudo-second-order kinetic equation. In the pseudo-second-order kinetic equation, the rate constant for the adsorption reaction is represented by k2. The fundamental concept of absolute reaction rate theory is the notion of the energy barrier of the activated complex that emerges during the conversion of reactants into products. The theory of absolute reaction rate, which centers around the concept of surmounting an energy barrier, can be extended to investigate the kinetics of adsorption, where the adsorption process can be activated by surpassing a sorption barrier [44]. In the Arrhenius equation, the adsorption rate constant k2 was substituted for the reaction rate constant, assuming that the effects of temperature on the activation enthalpy and entropy changes in the adsorption process were negligible and could be disregarded. The equation was derived from the Arrhenius formula [45].
k 2 = k 0 e x p ( E a R T )
In this context, k2 denotes the rate constant of the adsorption reaction, expressed in units of g·mg−1·min−1, k0 is the frequency factor, Ea denotes the activation energy in kJ·mol−1, and R corresponds to the ideal gas constant with a value of 8.314 J·K−1·mol−1. The temperature, measured in Kelvin, is represented by T.
By calculating the logarithm of the above equation, the equation that is obtained is as follows:
l n k 2 = l n k 0 E a R T
In this context, Figure 14 shows the linear regression for 103/T and ln k2, where a straight line is plotted to represent the relationship between these two variables. The equation of the straight line resulting from the linear regression analysis for 103/T and ln k2 is lnk2 = −0.6622/T − 0.2538 (R2 = 0.9818), and the R-squared value associated with this model is 0.9818. The slope of the linear regression equation obtained in this context provides the activation energy of adsorption, which is calculated as Ea = 5.51 kJ·mol−1.
Typically, the activation energy for physical adsorption falls in the range of 5–40 kJ·mol−1, as usually observed [46]. However, for chemical adsorption, the activation energy is generally higher, exceeding 83.72 kJ·mol−1 [47]. The relatively low activation energy of adsorption (5.51 kJ/mol) for pyridine onto coking coal indicates that the adsorption process is primarily driven by physical interactions and is relatively straightforward or facile.

4. Conclusions

  • The experimental data were analyzed using various kinetic models. Among them, the pseudo-second-order rate kinetics model provided the most accurate representation of the adsorption processes.
  • The surface of all three coal types predominantly featured acidic oxygen-containing functional groups. When treated with hydrochloric acid solutions, the specific surface area of the coking coal increased. Of the three coal varieties, anthracite showed the highest pyridine adsorption rate.
  • Insights from the Bangham model support that the sorption processes encompass both intraparticle and boundary-layer diffusions. The activation energy for pyridine adsorption onto coking coal was determined to be 5.51 kJ·mol−1, indicating that the process primarily involves physical adsorption.

Author Contributions

Conceptualization, H.X.; Methodology, H.X.; Validation, Q.S. and J.C.; Formal analysis, J.C.; Investigation, S.L., J.W., Q.S. and J.C.; Data curation, S.L. and J.C.; Writing—original draft, H.X.; Writing—review & editing, J.D.; Visualization, J.W.; Project administration, G.H. All authors have read and agreed to the published version of the manuscript.

Funding

This work was supported by the National Key Research and Development Program of China (2021YFC2902601), the State Key Laboratory of Complex Nonferrous Metal Resources Clean Utilization (CNMRCUKF2107), and the Fundamental Research Funds for the Central Universities (2020QN08).

Data Availability Statement

The data presented in this study are available on request from the corresponding author. The data are not publicly available.

Conflicts of Interest

The authors declare no conflict of interest.

References

  1. Ma, X.Y.; Wang, X.C.; Liu, Y.J.; Gao, J.; Wang, Y.K. Variations in toxicity of semi-coking wastewater treatment processes and their toxicity prediction. Ecotoxcol. Environ. Safe 2017, 138, 163–169. [Google Scholar]
  2. Meng, X.; Ning, P.; Xu, G.; Cao, H. Removal of coke powder from coking wastewater by extraction technology. Sep. Purif. Technol. 2017, 175, 506–511. [Google Scholar]
  3. Tamang, M.; Paul, K.K. Advances in treatment of coking wastewater—A state of the art review. Water Sci. Technol. 2022, 85, 449–473. [Google Scholar] [PubMed]
  4. Ma, D.H.; Liu, C.; Zhu, X.B.; Liu, R.; Chen, L.J. Acute toxicity and chemical evaluation of coking wastewater under biological and advanced physicochemical treatment processes. Environ. Sci. Pollut. R. 2016, 23, 18343–18352. [Google Scholar]
  5. Kwarciak-Kozlowska, A.; Worwag, M. The Impact of an Ultrasonic Field on the Efficiency of Coke Wastewater Treatment in a Sequencing Batch Reactor. Energies 2021, 14, 17. [Google Scholar]
  6. Liu, Y.; Wu, Z.-y.; Peng, P.; Xie, H.-B.; Li, X.-Y.; Xu, J.; Li, W.-H. A pilot-scale three-dimensional electrochemical reactor combined with anaerobic-anoxic-oxic system for advanced treatment of coking wastewater. J. Environ. Manag. 2020, 258. [Google Scholar] [CrossRef]
  7. Li, B.; Sun, Y.-L.; Li, Y.-Y. Pretreatment of coking wastewater using anaerobic sequencing batch reactor (ASBR). J. Zhejiang Univ. Sci. B 2005, 6, 1115–1123. [Google Scholar]
  8. Qin, Z.; Wei, C.; Wei, T.; Li, Z.M.; Pang, Z.J.; Luo, P.; Feng, C.H.; Qiu, G.L.; Wei, C.H.; Wu, H.Z.; et al. Evolution of biochemical processes in coking wastewater treatment: A combined evaluation of material and energy efficiencies and secondary pollution. Sci. Total Environ. 2022, 807, 13. [Google Scholar]
  9. Dong, Y.R.; Zhang, J.T. Testing the genotoxicity of coking wastewater using Vicia faba and Hordeum vulgare bioassays. Ecotoxicol. Environ. Safe 2010, 73, 944–948. [Google Scholar]
  10. Zhao, J.L.; Jiang, Y.X.; Yan, B.; Wei, C.H.; Zhang, L.J.; Ying, G.G. Multispecies Acute Toxicity Evaluation of Wastewaters from Different Treatment Stages in a Coking Wastewater-Treatment Plant. Environ. Toxicol. Chem. 2014, 33, 1967–1975. [Google Scholar]
  11. Zhang, T. Research on coking wastewater treatment technology in the metallurgical industry. Sichuan Nonferrous Met. 2022, 2, 55–57+65. [Google Scholar]
  12. Fu, X.; Zhou, S. Application of coking wastewater treatment in metallurgical industry. Metall. Equip. 2017, 23, 67–69. [Google Scholar]
  13. Song, X.L.; Wang, C.; Liu, M.Q.; Zhang, M. Advanced treatment of biologically treated coking wastewater by persulfate oxidation with magnetic activated carbon composite as a catalyst. Water Sci. Technol. 2018, 77, 1891–1898. [Google Scholar] [CrossRef] [PubMed]
  14. Jiang, W.X.; Zhang, W.; Li, B.J.; Duan, J.; Lv, Y.; Liu, W.D.; Ying, W.C. Combined Fenton oxidation and biological activated carbon process for recycling of coking plant effluent. J. Hazard. Mater. 2011, 189, 308–314. [Google Scholar] [CrossRef] [PubMed]
  15. Gao, L.; Li, S.; Wang, Y.; Gui, X.; Xu, H. Pretreatment of Coking Wastewater by an Adsorption Process Using Fine Coking Coal. Physicochem. Probl. Miner. Process. 2016, 52, 422–436. [Google Scholar]
  16. Lian, X.G.; An, X.C.; Jing, S.J. Research on the Joint Application of Bio-process and Absorbent Addition in Treatment of Waste Water from Coke Chemistry Plant. Coal Process. Compr. Util. 2000, 4, 27–29. [Google Scholar]
  17. Burmistrz, P.; Rozwadowski, A.; Burmistrz, M.; Karcz, A. Coke dust enhances coke plant wastewater treatment. Chemosphere 2014, 117, 278–284. [Google Scholar] [CrossRef]
  18. Gao, Q.Y.; Wang, L.; Li, Z.P.; Xie, Y.Q.; He, Q.Q.; Wang, Y.T. Adsorptive Removal of Pyridine in Simulation Wastewater Using Coke Powder. Processes 2019, 7, 459. [Google Scholar] [CrossRef]
  19. Ghosh, T.K.; Biswas, P.; Bhunia, P.; Kadukar, S.; Banerjee, S.K.; Ghosh, R.; Sarkar, S. Application of coke breeze for removal of color from coke plant wastewater. J. Environ. Manag. 2022, 302, 12. [Google Scholar] [CrossRef]
  20. Zhang, C.; Chen, Z.L.; Li, J.F.; Guo, Y.M.; Cheng, F.Q. Removal of recalcitrant organic pollutants from bio-treated coking wastewater using coal-based carbonaceous materials. Desalination Water Treat. 2017, 88, 75–84. [Google Scholar] [CrossRef]
  21. Choudhary, R.K.; Chaudhari, P.K. Removal of pollutants of coking wastewater by adsorption. Desalination Water Treat. 2017, 75, 45–57. [Google Scholar] [CrossRef]
  22. Sahoo, P.; Das, R.; Das, N. Adsorptive removal of phenol from aqueous solutions and coking wastewater by coke produced from hard and soft coking coals. Desalination Water Treat. 2017, 86, 139–149. [Google Scholar] [CrossRef]
  23. Xu, H.X.; Wang, Y.T.; Huang, G.; Fan, G.X.; Gao, L.H.; Li, X.B. Removal of Quinoline from Aqueous Solutions by Lignite, Coking Coal and Anthracite. Adsorption Kinetics. Physicochem. Probl. Miner. Process. 2016, 52, 397–408. [Google Scholar]
  24. Rodriguez-Narciso, S.; Lozano-Alvarez, J.A.; Salinas-Gutierrez, R.; Castaneda-Leyva, N. A Stochastic Model for Adsorption Kinetics. Adsorpt. Sci. Technol. 2021, 2021, 21. [Google Scholar] [CrossRef]
  25. Islam, M.A.; Chowdhury, M.A.; Mozumder, M.S.I.; Uddin, M.T. Langmuir Adsorption Kinetics in Liquid Media: Interface Reaction Model. ACS Omega 2021, 6, 14481–14492. [Google Scholar] [CrossRef]
  26. Ezzati, R. Derivation of Pseudo-First-Order, Pseudo-Second-Order and Modified Pseudo-First-Order rate equations from Langmuir and Freundlich isotherms for adsorption. Chem. Eng. J. 2020, 392, 12. [Google Scholar] [CrossRef]
  27. Regazzoni, A.E. Adsorption kinetics at solid/aqueous solution interface: On the boundaries of the pseudo-second-order rate equation. Colloids Surface A 2020, 585, 124093. [Google Scholar] [CrossRef]
  28. Sun, X.F.; Ma, L.Q.; Ye, G.C.; Wu, L.; Li, J.H.; Xu, H.X.; Huang, G. Phenol adsorption kinetics and isotherms on coal: Effect of particle size. Energy Sources Part A 2021, 43, 461–474. [Google Scholar] [CrossRef]
  29. Xu, H.J.; Zhang, X.P.; Zhang, Y.D. Modification of biochar by Fe2O3 for the removal of pyridine and quinoline. Environ. Technol. 2018, 39, 1470–1480. [Google Scholar] [CrossRef]
  30. Wang, J.L.; Guo, X. Adsorption kinetic models: Physical meanings, applications, and solving methods. J. Hazard. Mater. 2020, 390, 18. [Google Scholar] [CrossRef]
  31. Zhang, J.F. Physical insights into kinetic models of adsorption. Sep. Purif. Technol. 2019, 229, 11. [Google Scholar] [CrossRef]
  32. Reczek, L.; Michel, M.M.; Kusmierek, K.; Swiatkowski, A.; Siwiec, T. Sorption of 4-chlorophenol and lead(II) on granular activated carbon: Equilibrium, kinetics and thermodynamics. Desalination Water Treat. 2017, 62, 369–376. [Google Scholar] [CrossRef]
  33. Alaei, R.; Javanshir, S.; Behnamfard, A. Treatment of gold ore cyanidation wastewater by adsorption onto a Hydrotalcite-type anionic clay as a novel adsorbent. J. Environ. Health Sci. 2020, 18, 779–791. [Google Scholar] [CrossRef] [PubMed]
  34. Ofomaja, A.E.; Naidoo, E.B. Biosorption of copper from aqueous solution by chemically activated pine cone: A kinetic study. Chem. Eng. J. 2011, 175, 260–270. [Google Scholar] [CrossRef]
  35. Korkut, F.; Saloglu, D. Synthesis, characterization, and tetracycline adsorption behavior of activated carbon dopped alginate beads: Isotherms, kinetics, thermodynamic, and adsorption mechanism. Desalination Water Treat. 2020, 206, 315–330. [Google Scholar] [CrossRef]
  36. Secula, M.S.; Cretescu, I.; Diaconu, M. Adsorption of Acid Dye Eriochrome Black t from Aqueous Solutions onto Activated Carbon. Kinetic and Equilibrium Studies. J. Environ. Prot. Ecol. 2014, 15, 1583–1593. [Google Scholar]
  37. Varank, G.; Demir, A.; Yetilmezsoy, K.; Top, S.; Sekman, E.; Bilgili, M.S. Removal of 4-nitrophenol from aqueous solution by natural low-cost adsorbents. Indian J. Chem. Technol. 2012, 19, 7–25. [Google Scholar]
  38. Hao, P.Y.; Meng, Y.J.; Zeng, F.G.; Yan, T.T.; Xu, G.B. Quantitative Study of Chemical Structures of Different Rank Coals Based on Infrared Spectroscopy. Spectrosc. Spectr. Anal. 2020, 40, 787–792. [Google Scholar]
  39. Hu, Y.Y.; Zhang, Q.T.; Zhou, G.; Wang, H.Y.; Bai, Y.L.; Liu, Y.J. Influence Mechanism of Surfactants on Wettability of Coal with Different Metamorphic Degrees Based on Infrared Spectrum Experiments. ACS Omega 2021, 6, 22248–22258. [Google Scholar] [CrossRef]
  40. Ghorai, S.; Ghosh, B.; Chandaliya, V.K.; Singh, R.; Dash, P.S.; Mal, D. Difference in structural chemistry of non-coking and coking coal using acid treatment demineralization technique. Int. J. Coal Prep. Util. 2019, 42, 788–808. [Google Scholar] [CrossRef]
  41. Jaiswal, Y.; Pal, S.L.; Jaiswal, H.; Jain, A.; Kush, L.; Rai, D.; Tatar, D. An investigation of changes in structural parameters and organic functional groups of inertinite rich lignite during acid treatment processes. Energy Sources Part A 2021. [Google Scholar] [CrossRef]
  42. Mou, P.W.; Pan, J.N.; Niu, Q.H.; Wang, Z.Z.; Li, Y.B.; Song, D.Y. Coal Pores: Methods, Types, and Characteristics. Energy Fuel 2021, 35, 7467–7484. [Google Scholar] [CrossRef]
  43. Zhang, L.J.; Li, Z.H.; Yang, Y.L.; Zhou, Y.B.; Kong, B.; Li, J.H.; Si, L.L. Effect of acid treatment on the characteristics and structures of high-sulfur bituminous coal. Fuel 2016, 184, 418–429. [Google Scholar] [CrossRef]
  44. Bai, W.L.; Qian, M.M.; Li, Q.X.; Atkinson, S.; Tang, B.; Zhu, Y.C.; Wang, J.F. Rice husk-based adsorbents for removing ammonia: Kinetics, thermodynamics and adsorption mechanism. J. Environ. Chem. Eng. 2021, 9, 11. [Google Scholar] [CrossRef]
  45. Zheng, L.P.; Yan, G.Y.; Gu, Q.; Xie, L.S.; Long, J.L. Mesoporous V-doped TiO2 Nanoparticles as New Adsorbents for the Removal of Methylene Blue from Color Textile Wastewater. Chin. J. Struct. Chem. 2015, 34, 56–68. [Google Scholar]
  46. Wei, S.X.; Chen, W.; Li, Z.L.; Liu, Z.Z.; Xu, A. Synthesis of cationic biomass lignosulfonate hydrogel for the efficient adsorption of Cr(VI) in wastewater with low pH. Environ. Technol. 2022, 14, 2134–2147. [Google Scholar] [CrossRef]
  47. Al-Shehri, H.S.; Alanazi, H.S.; Shaykhayn, A.M.; Alharbi, L.S.; Alnafaei, W.S.; Alorabi, A.Q.; Alkorbi, A.S.; Alharthi, F.A. Adsorption of Methylene Blue by Biosorption on Alkali-Treated Solanum incanum: Isotherms, Equilibrium and Mechanism. Sustainability 2022, 14, 2644. [Google Scholar] [CrossRef]
Figure 1. X-ray diffraction patterns of lignite.
Processes 11 03118 g001
Figure 2. X-ray diffraction patterns of coking coal.
Processes 11 03118 g002
Figure 3. X-ray diffraction patterns of anthracite.
Processes 11 03118 g003
Figure 4. SEM images of raw lignite.
Processes 11 03118 g004
Figure 5. SEM images of raw coking coal.
Processes 11 03118 g005
Figure 6. SEM images of raw anthracite.
Processes 11 03118 g006
Figure 7. FTIR analysis patterns of lignite.
Processes 11 03118 g007
Figure 8. FTIR analysis patterns of coking coal.
Processes 11 03118 g008
Figure 9. FTIR analysis patterns of anthracite.
Processes 11 03118 g009
Figure 10. The impact of contact time on the adsorption rate and pyridine removal efficiency of lignite, coking coal, and anthracite [23].
Processes 11 03118 g010
Figure 11. Effect of pH on the specific surface area of coking coal at 25 °C.
Processes 11 03118 g011
Figure 12. The influence of pH value on the adsorption rate and the pyridine removal efficiency of lignite, coking coal, and anthracite.
Processes 11 03118 g012
Figure 13. The experimental data regarding pyridine adsorption onto lignite, coking coal, and anthracite were subjected to fitting using various models, including the pseudo-first-order and pseudo-second-order kinetic equations, as well as the intraparticle diffusion and Bangham models.
Processes 11 03118 g013
Figure 14. Plot of lnk2 versus 1000/T for pyridine adsorption onto coking coal.
Processes 11 03118 g014
Table 1. The determined specific surface area of lignite, coking coal, and anthracite [21].
MethodSpecific Surface Area S/ m2·g−1
LigniteCoking CoalAnthracite
BET method6.08765.78646.1479
Table 2. The constant values and correlation coefficients obtained via linear regression analysis for the pseudo-first-order and pseudo-second-order rate expressions, as well as the intraparticle diffusion and Bangham models, applied to the experimental data of pyridine adsorption onto lignite, coking coal, and anthracite.
AdsorbentsPseudo-first-order kinetics model
Qeq(exp)/mg·g−1Qeq(calc)/mg·g−1K1/min−1R2
lignite1.080.620.02850.9790
coking coal1.050.790.03580.9739
anthracite1.221.120.07360.9956
AdsorbentsPseudo-second-order kinetics model
Qeq(calc)/mg·g−1K2/g·mg−1·min−1h/mg·g−1·min−1R2
lignite1.150.08610.110.9993
coking coal1.140.08260.110.9988
anthracite1.270.14030.230.9975
AdsorbentsIntraparticle diffusion model
K3/mg·g−1·min−0.5interceptR2
lignite0.01730.85360.9116
coking coal0.01800.82630.8294
anthracite0.00411.16500.8264
AdsorbentsBangham model
K4γR2
lignite0.00720.23290.9072
coking coal0.00660.24560.9118
anthracite0.00950.21230.6682
Disclaimer/Publisher’s Note: The statements, opinions and data contained in all publications are solely those of the individual author(s) and contributor(s) and not of MDPI and/or the editor(s). MDPI and/or the editor(s) disclaim responsibility for any injury to people or property resulting from any ideas, methods, instructions or products referred to in the content.

