Article

Exploration of Eco-Friendly Hydrochar’s Potential in Advanced Oxidative Processes for Dicamba Degradation within a Circular Bio-Economy Framework

by
Tiago Guimarães
1,
Elisa Maria Gomes da Silva
2,
Adalin Cezar Moraes de Aguiar
2,
Marcelo Moreira da Costa
3,
Kamila Cabral Mielke
2,
Kassio Ferreira Mendes
2,
Antonio Alberto da Silva
2,
Ana Paula de Carvalho Teixeira
4 and
Renata Pereira Lopes Moreira
1,*
1
Chemistry Department, Federal University of Viçosa, Viçosa 36570-900, MG, Brazil
2
Phytotechnics Department, Federal University of Viçosa, Viçosa 36570-900, MG, Brazil
3
Forest Engineer Department, Federal University of Viçosa, Viçosa 36570-900, MG, Brazil
4
Chemistry Department, Federal University of Minas Gerais, Belo Horizonte 31270-901, MG, Brazil
*
Author to whom correspondence should be addressed.
Processes 2023, 11(11), 3244; https://doi.org/10.3390/pr11113244
Submission received: 25 October 2023 / Revised: 13 November 2023 / Accepted: 15 November 2023 / Published: 17 November 2023

Abstract

:
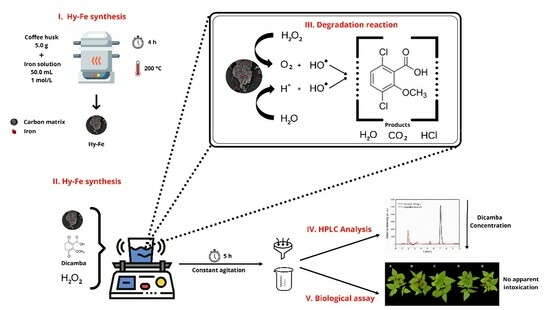
Dicamba, renowned for its limited sorption capacity, presents a substantial risk of contaminating surface and groundwater if the disposal of spray tank effluent is not adequately controlled. In this work, a dicamba effluent underwent treatment through a Fenton-like process employing an iron/hydrochar (Hy-Fe) composite, synthesized via hydrothermal methods using coffee husk as the precursor. The Hy-Fe displayed carbon, hydrogen, and nitrogen levels of 52.30%, 5.21%, and 1.49%, respectively. Additionally, the material exhibited a specific surface area measuring 9.00 m2 g−1. The presence of the γ-Fe2O3 phase within the composite was confirmed through X-ray diffraction analysis. The Fenton-like process employing Hy-Fe demonstrated approximately 100% degradation of dicamba within 5 h. The treated effluent underwent toxicity evaluation via biological assays using beans (Phaseolus vulgaris) as indicator plants, revealing no observable signs of intoxication. These findings were corroborated by High-Performance Liquid Chromatography, providing additional confirmation of the degradation results. Additionally, decontamination of personal protective equipment potentially contaminated with dicamba was also assessed. The Hy-Fe composite demonstrated reusability across three degradation cycles, achieving degradation percentages of 100%, 70%, and 60%, respectively. The Hy-Fe composite demonstrates substantial potential for use in a Fenton-like process. This process is characterized by its simplicity, speed, and sustainability. The notable effectiveness, evidenced by high degradation rates and minimal toxicity, underscores its suitability as a practical solution for addressing dicamba contamination.

Graphical Abstract

1. Introduction

Herbicides stand out as the most extensively employed agrochemicals in global agriculture. In Brazil, the herbicide consumption surpasses 50% of the total volume of agrochemicals sold [1]. This prevalence is attributed to herbicides being a primary method of weed control for a wide range of agricultural crops [2]. However, the indiscriminate use of these compounds represents a high risk of environmental contamination [3]. The application of herbicides without a comprehensive understanding of their behavior and interactions with the soil can lead to a loss of efficiency, intoxication of sensitive crops, and contamination of surface and groundwater [4].
Several herbicides have a high potential for environmental contamination, such as dicamba (3,6-dichloro-2-methoxybenzoic acid). This compound belongs to the benzoic acid chemical group and acts as an auxin mimetic [5]. It is widely used in weed control in corn, soybeans, wheat, pastures, as well as in uncultivated areas such as fences and roads [6]. Dicamba is highly soluble in water, with a solubility of 6.50 g L−1 at 25 °C. Additional noteworthy properties include a partition coefficient (Kow) of 0.47 and a pKa of 1.87. Due to its low pKa, dicamba remains in the anionic form under most soil pH conditions and, consequently, has a low sorption coefficient and high mobility in soil [3].
Given the mentioned characteristics, dicamba possesses a high susceptibility to be transported by rainwater, and its inappropriate use has resulted in surface and groundwater contamination [7]. Furthermore, improper disposal of effluent from spray tanks containing dicamba can result in the poisoning of crops and even contribute to the development of resistant weeds [8]. It is noteworthy that inadequately decontaminated spray tanks can contribute to the cross-contamination of agricultural chemicals. Contamination of drinking water and vegetables are the greatest causes of human exposure to agrochemicals [9]. Dicamba may be associated with birth defects, cancer, neurological disorders, kidney poisoning, liver and reproductive system [10].
Another crucial point to highlight is the improper disposal of effluent in spraying tanks, which can result in the contamination of subsequent crops and even the emergence of resistant weeds [11]. A feasible alternative would be to degrade the effluent in the spray tanks before discharging it into the environment [12]. Numerous researchers have explored the degradation of organic pollutants through Advanced Oxidative Processes (AOPs) to generate highly reactive oxygen species (ROS) from ozone (O3) [13], hydrogen peroxide (H2O2) [14], UV light [15], TiO2 [16], among others. Among the generated radicals, the hydroxyl radical (·OH) stands out for its superior oxidation capacity, possessing an oxidation potential (E0) of 2.80 V [17].
The ·OH can be generated through the classical Fenton reaction, involving the decomposition of hydrogen peroxide in the presence of ferrous ions. Other oxidation states of iron, such as Fe2+ or Fe0, along with other metals like copper and zinc, configure the Fenton-like reaction, which can take place either homogeneously or heterogeneously [18,19]. One advantage of the heterogeneous system is the potential for catalyst separation and its reuse in different reaction cycles [20]. This process is highly effective in eliminating organic pollutants from wastewater and has the potential to achieve the complete mineralization of these compounds [21].
Biochar, a solid material formed from the thermochemical decomposition of biomass in an oxygen-limited environment [22], finds extensive use in environmental contaminant remediation processes [23]. Its porous nature, large specific surface area, and capability to adsorb toxic compounds make it valuable in mitigating potential harm to living beings [24]. In addition, its characteristics also allow its use as a support for different catalysts, which are applied for the most diverse environmental applications [25].
On the other hand, iron-based materials are commonly utilized in processes for removing contaminants, either in the form of oxides for use as adsorbents [26], or in metallic form [27]. Iron has the advantages of being environmentally safe, low cost, non-toxic and highly accessible, as it is one of the most abundant metallic elements in the earth’s crust [28]. The use of biochar as a support for zero-valence iron nanoparticles (nZVI) facilitates effective dispersion of the nanoparticles, leading to higher efficiency in the pollutant degradation process [29].
Therefore, the goal of this work is to present an innovative approach utilizing an iron/hydrochar (Hy-Fe) composite synthesized through a one-pot hydrothermal synthesis process using coffee husks. This composite is specifically engineered to target the degradation of remaining dicamba residues in spray tanks through a heterogeneous Fenton-like reaction. Comprehensive evaluations were conducted to determine the physical-chemical properties of the produced composite, along with an examination of various reaction parameters. Additionally, biological assays employing beans (Phaseolus vulgaris) as a sensitive indicator plant were employed to assess the composite’s effectiveness. Combining these innovative elements, this research aims to present a groundbreaking solution for the degradation of dicamba residues in spray tanks.

2. Materials and Methods

2.1. The Standards and Reagents

All standards and reagents used are of analytical grade. Ferrous sulfate heptahydrate (CAS 7782-63-0), sodium hydroxide (NaOH) (CAS 1310-73-2), hydrochloric acid (HCl) (CAS 7647-01-10), hydrogen peroxide (H2O2) (CAS 7722-84-1), and aluminum sulfate (Al2(SO4)3.16H2O (CAS10043-01-3) were purchased from Vetec. All solutions were prepared with purified water type 1, which was obtained by Milli-Q® system (Millipore, Bedford, MA, USA). The dicamba standard used in this work was Atrazine-Pestanal® (Analytical Standard, 98.80% purity Sigma Chem. Co. Germany—Darmstadt, Germany).

2.2. Precursor Biomass

Arabica coffee husk (Coffea arabica) was collected in the City of Alegre, Espírito Santo, Latitude 201°450′4900″ S, Longitude: 411°310′5900″ W, during the November 2020 harvest period. The straws were washed with distilled water and dried at 80 °C in an oven for 48 h. Then, the material was ground in a knife mill and subsequently subjected to a hydrothermal synthesis process. Under these conditions, the material exhibits remarkable stability, retaining its key characteristics over an extended duration. The hydrochar and iron composite were synthesized in 2021, specifically between March and July. Subsequent characterization was conducted from July to September of the same year, and the degradation assays took place at the end of 2021 and the beginning of 2022.

2.3. Composite Production

To produce the iron/hydrochar composite (Hy-Fe), initially, 5.00 g of coffee husk were added in an autoclave, together with 50.00 mL of iron solution 1.00 mol L−1, and heated at 200 °C for 4 h, with a heating ramp of 10 °C min−1. The system containing the composite was centrifuged for 30 min at 3000 rpm, and then submitted to four washing steps, the first with 50.00 mL of Milli-Q® water and the others with 50.00 mL of ethanol each. The Hy-Fe was dried in an oven for 24 h and stored under refrigeration at −20 °C.

2.4. Hy-Fe Characterization

The determination of the zero-charge point (pHZCP) of Hy-Fe was performed according to the methodology adapted from Wang et al. (2008) [30]. For this, 100.00 mg of Hy-Fe were transferred to 100.00 mL of NaCl solution (0.10 mol L−1) under different pH conditions (2, 3, 4, 5, 6, 7, 8, 9, 10, 11 and 12), adjusted with HCl or NaOH solutions, both at 0.10 mol L−1. After 24 h, under 100 rpm stirring at 25 °C, the solutions were filtered, and the final pH of the solution was measured. All assays were performed in triplicate.
Elemental analysis of carbon, hydrogen, and nitrogen (CHN) present in the Hy-Fe was performed using an elemental analyzer (Vario MACRO) equipped with a conductivity detector. The combustion tube was set up at 1150 °C and the reduction tube at 850 °C. Sulfanilamide was used as CHN standard (C = 41.81%, N = 16.26%, H = 4.65%, S = 18.62%, mass %). Semiquantitative analysis by X-ray fluorescence spectroscopy (XRF) was performed to determine the inorganic constituents of Hy-Fe.
Thermogravimetric analyses (TG/DTG) were performed in a Shimadzu instrument, model DTG–60H, with a heating rate of 10 °C min−1, in an alumina crucible, up to 1000 °C, and using a synthetic. The changes in the Hy-Fe functional groups were analyzed by infrared spectroscopy in a Bruker VERTEX 70 instrument using the Attenuated Total Reflectance (ATR) method in the range of 350–4000 cm−1. The Hy-Fe crystal structure was determined by X-ray diffraction on a D8-Discover diffractometer. The crystalline phase was identified by comparing the Bragg angle, interlayer space, relative intensity of the diffraction peaks, and position of the Bragg peak with standard JCPDS files.
Raman spectroscopy was performed on a micro-Raman spectrometer (Renishaw InVia) equipped with a Nd-YAG la (λ = 514 nm) and a 50× objective lens (Olympus B × 41), and the Raman spectrum acquisition time for each sample was set to 10 s. The surface area and porous structure of Hy-Fe were determined by N2 adsorption isotherms using Quantachrome Instruments, model Nova 1200e. Samples were weighed at approximately 150 mg and previously degassed at 250 °C for 5 h. The Mössbauer spectra were obtained from analysis in a spectrometer (CMTE Model MA250) of the Applied Physics Laboratory of CDTN (Nuclear Technology Development Center), with constant acceleration and 57Co source and rhodium (Rh) matrix. The analyses were performed without field application and at room temperature (298 K).
The materials were analyzed by TEM using a JEOL JEM 1400 (120 kV) microscope (Tokyo, Japan). Surface morphology and elemental analysis of Hy-Fe were performed by Scanning Electron Microscopy (SEM) coupled with an Energy Dispersive X-ray Spectrometer (EDS) on a JEOL model JSM-6010LA Scanning Electron Microscope. This microscope has a resolution of 4 nm (with a 20 kV beam), magnification of 8× to 300,000×, and an accelerating voltage of 500 V at 20 kV. Electron gun with pre-centered tungsten filament. Everhart-Thornley detector for secondary electron imaging and solid-state detector for backscattered electrons with variable topography, composition, and shading contrast Silicon drift detector for EDS analysis with 133 eV resolution

2.5. Dicamba Degradation Assay

The dicamba removal evaluation by Hy-Fe were performed in batch. In general, a certain amount of the material was added to a 100.00 mL of the dicamba standard solution, or commercial product, at the stipulated concentration for each study step (1.00, 10.00, or 50.00 mg L−1). These assays were carried out to investigate the impact of reaction time, initial dicamba concentrations, Hy-Fe dosage, and system agitation on dicamba degradation. The studies were performed in triplicate.
In the initial assessment, the results obtained for Hy-Fe were compared with those observed for the biochar produced via pyrolysis (Py-Fe). The synthesis and characterization data for Py-Fe were previously published in another article [31], and applied under the same reaction conditions. The Py-Fe synthesis was conducted in two different steps. First Fe (II) was adsorbed by biochar, produced from arabica coffee husks (Coffea arabica), as reported in previous work [32]. Second, chemical reduction of Fe(II), adsorbed on biochar surface, was carried by NaBH4. The Py-Fe was separated through vacuum filtration and dried in a rotary evaporator for 2 h and stored under refrigeration at −20 °C.

2.6. Optimization of the Degradation Process

The procedure was carried out in accordance with previous work [33]. To determine the influence of reaction time on the degradation of dicamba, 100.00 mL of dicamba solution (50.00 mg L−1) were placed under constant stirring with 0.20 g of Hy-Fe, 1.00 mL of H2O2 (1.00 mmol L−1) and 1.00 mL of aluminum sulfate solution (1.00 mol L−1) at a temperature of 25 °C. At pre-set times, aliquots of 1.00 mL were taken from the system, which were filtered through a cellulose acetate membrane (0.45 µm pore size and 13 mm diameter) and analyzed by High Performance Liquid Chromatography (HPLC).
To determine the influence of the initial concentration of dicamba on the degradation reaction, 100.00 mL of dicamba solution at different concentrations (1.00, 10.00 and 50.00 mg L−1) were placed under constant stirring with 0.20 g of Hy-Fe, 1.00 mL of H2O2 (1.00 mmol L−1) and 1.00 mL of aluminum sulfate solution (1.00 mol L−1) at a temperature of 25 °C. At pre-established times, aliquots of 1.00 mL were removed from the system, filtered on cellulose acetate membrane (0.45 µm pore size and 13 mm diameter) and analyzed by HPLC.
To determine the influence of Hy-Fe dose on the degradation reaction of dicamba, 100.00 mL of dicamba solution (50.00 mg L−1) was placed under constant stirring with different doses of Hy-Fe (1.00, 6.00 and 10.00 mg L−1). The other parameters remained constant: 1.00 mL of H2O2 (1.00 mmol L−1) and 1.00 mL of aluminum sulfate solution (1.00 mol L−1) at a temperature of 25 °C. At pre-set times, aliquots of 1.00 mL were removed from the system, filtered on cellulose acetate membrane (0.45 µm pore size and 13 mm diameter) and analyzed by HPLC.
To determine the influence of the agitation of the system on the degradation reaction of dicamba, 100.00 mL of dicamba solution (50.00 mg L−1) were placed under agitation on an orbital table at 3000 rpm in constant period, sporadic agitation (1 min agitation at 3000 rpm every 30 min of reaction) or complete resting. The other parameters remained constant: 0.20 g of Hy-Fe, 1.00 mL of H2O2 (1.00 mmol L−1) and 1.00 mL of aluminum sulfate solution (1.00 mol L−1) at a temperature of 25 °C. At pre-set times, aliquots of 1.00 mL were removed from the system, filtered on cellulose acetate membrane (0.45 µm pore size and 13 mm diameter) and analyzed by HPLC.
It is essential to emphasize that great care was exercised to ensure that no more than 10% of the total sample volume was collected in the process of aliquot collection, thus preserving the sample’s representativeness.
To determine the utilization of Hy-Fe in different degradation cycles, after the reaction, the composite was recovered by filtration, dried, and subjected to a further degradation step. The HPLC system used for identification and quantification was a Shimadzu SCL-10A VP system controller (Kyoto, Japan), equipped with an LC-10AD VP pump, SPD-10A VP UV detector, SCL-10A VP control center and Rheodyne injector (injection volume 30 µL). The HPLC operating conditions were: C18 column, Keystone NA (Keystone Scientific, Bellefonte, PA, USA); oven temperature 35 °C; mobile phase consisting of acetonitrile: phosphoric acid solution 0.01 mol L−1 (1:1 v/v); flow rate of 1.00 mL min−1 and quantification was performed at 275 nm using a photodiode array detector.

2.7. Evaluation with Sensitive Plant Species

The biological evaluation used bean (Phaseolus vulgaris) as an indicator species, in which three seeds were sown in 0.33 dm3 plastic pots filled with yellow Latosol. After the emergence of the plants, a thinning was performed, leaving two plants per pot. When the bean plants reached the V3 physiological stage, dicamba solutions were applied in different pots, simulating a field application of commercial solutions, control solutions, and solutions from different degradation systems, which are presented in Table 1.
The application was performed using a CO2 pressurized sprayer, equipped with two TT 11002 tips, spaced at 0.50 m, maintained at a pressure of 25 lb pol−2 and a spray volume of 200 L ha−1. At 21 days after application (DAA), intoxication scores were assigned to the bean plants, being zero for absence of symptoms and 100 for plant death. The aerial part of the plants was also collected and the material was placed in paper bags, properly identified, and placed in an oven at a temperature of 70 °C until it reached a constant dry mass.

2.8. Decontamination of Personal Protective Equipment (PPE)

An experiment was conducted simulating the contamination of Personal Protective Equipment (PPE) by dicamba (50.00 mg L−1). The application occurred in the same manner as for the other sensitive indicator plant experiments. Then, the PPE was subjected to four washing steps, using 10 L of water in each of the washes. The wastewater from the different washing steps was collected, and the samples were filtered through cellulose acetate membrane (0.45 µm pore size and 13 mm diameter) and analyzed by High Performance Liquid Chromatography (HPLC). The assays were performed in triplicate.

3. Results and Discussion

3.1. This Hy-Fe Characterization

The determination of the zero-charge point (pHZCP) for the produced Hy-Fe was carried out, and the result is showed in Figure S1 (Supplementary Material). As observed, the pHZCP of Hy-Fe was determined to be at pH 7.30. The pHZCP denotes the range in which the final pH remains constant regardless of the initial pH, indicating that the surface acts as a buffer [34]. It is important to note that pHZCP values can vary based on factors such as the thermochemical process used in carbonization, the raw material employed, and the ash content.
Table 2 presents the elemental composition of Hy-Fe. The carbon, hydrogen, nitrogen, and sulfur contents were found to be 52.30%, 5.21%, 1.49%, and 0.24%, respectively. Typically, carbonaceous materials exhibit carbon contents ranging from 40% to 60% [35]. In this context, the generated Hy-Fe demonstrated carbon values within the aforementioned range. Additionally, the hydrogen, nitrogen, and sulfur contents were observed to fall within the anticipated ranges for carbonaceous materials [36,37].
The Hy-Fe was submitted to thermogravimetric analysis (TG/DTG) under oxidizing atmosphere, and the thermogram is shown in Figure 1. It can be seen that there are distinct regions. The first event (up to 110 °C) can be attributed to dehydration of the hydrochar. The second event can be attributed to the release of volatile organic matter (up to 300 °C); and the third event would be the thermal decomposition of cellulose (from 300 °C to 430 °C), accounting for the stage with the most substantial mass loss (approximately 90%). These results are consistent with the findings reported in the literature. The observed variations are attributed to factors such as the heating rate, sample mass, equipment utilized, and the inherent variability of the raw material [38]. Ghani et al. (2013) noted regions of cellulose decomposition very similar to those found in this study when they produced biochar from rubber tree sawdust [39].
Hy-Fe was also analyzed by the Fourier transform infrared (FTIR), and its spectrum is shown in Figure 2. A band at 1027 and 1118 cm−1, corresponding to the νC-O type vibration, can be observed. Additionally, there is a band at 1327 and 1439 cm−1, assigned to the stretching vibration of the carbon-carbon double bond (νC=C). Another band at 2100 cm−1 is assigned to the stretching of the νC=C bond, while the band at 2095 cm−1 is attributed to the asymmetric stretches of aliphatic νCH. Lastly, a band at 3331 cm−1 corresponds to the stretching vibration of hydroxyl groups (νOH) [40].
The diffractogram obtained for Hy-Fe (Figure 3) indicates a structure with low crystallinity. As observed, the X-ray diffraction shows diffraction peaks of Hy-Fe at 2θ = 20.3–25.4°, corresponding to graphite diffraction planes (002) [41] and at 2θ = 40.0 and 2θ = 68.7°, indicating the presence of γ-Fe2O3 in the material [42]. Similar results have been documented in other works, including those by Zhou et al. (2021) [43], and Chu et al. (2020) [44], where magnetic biochar was employed for pollutant treatments.
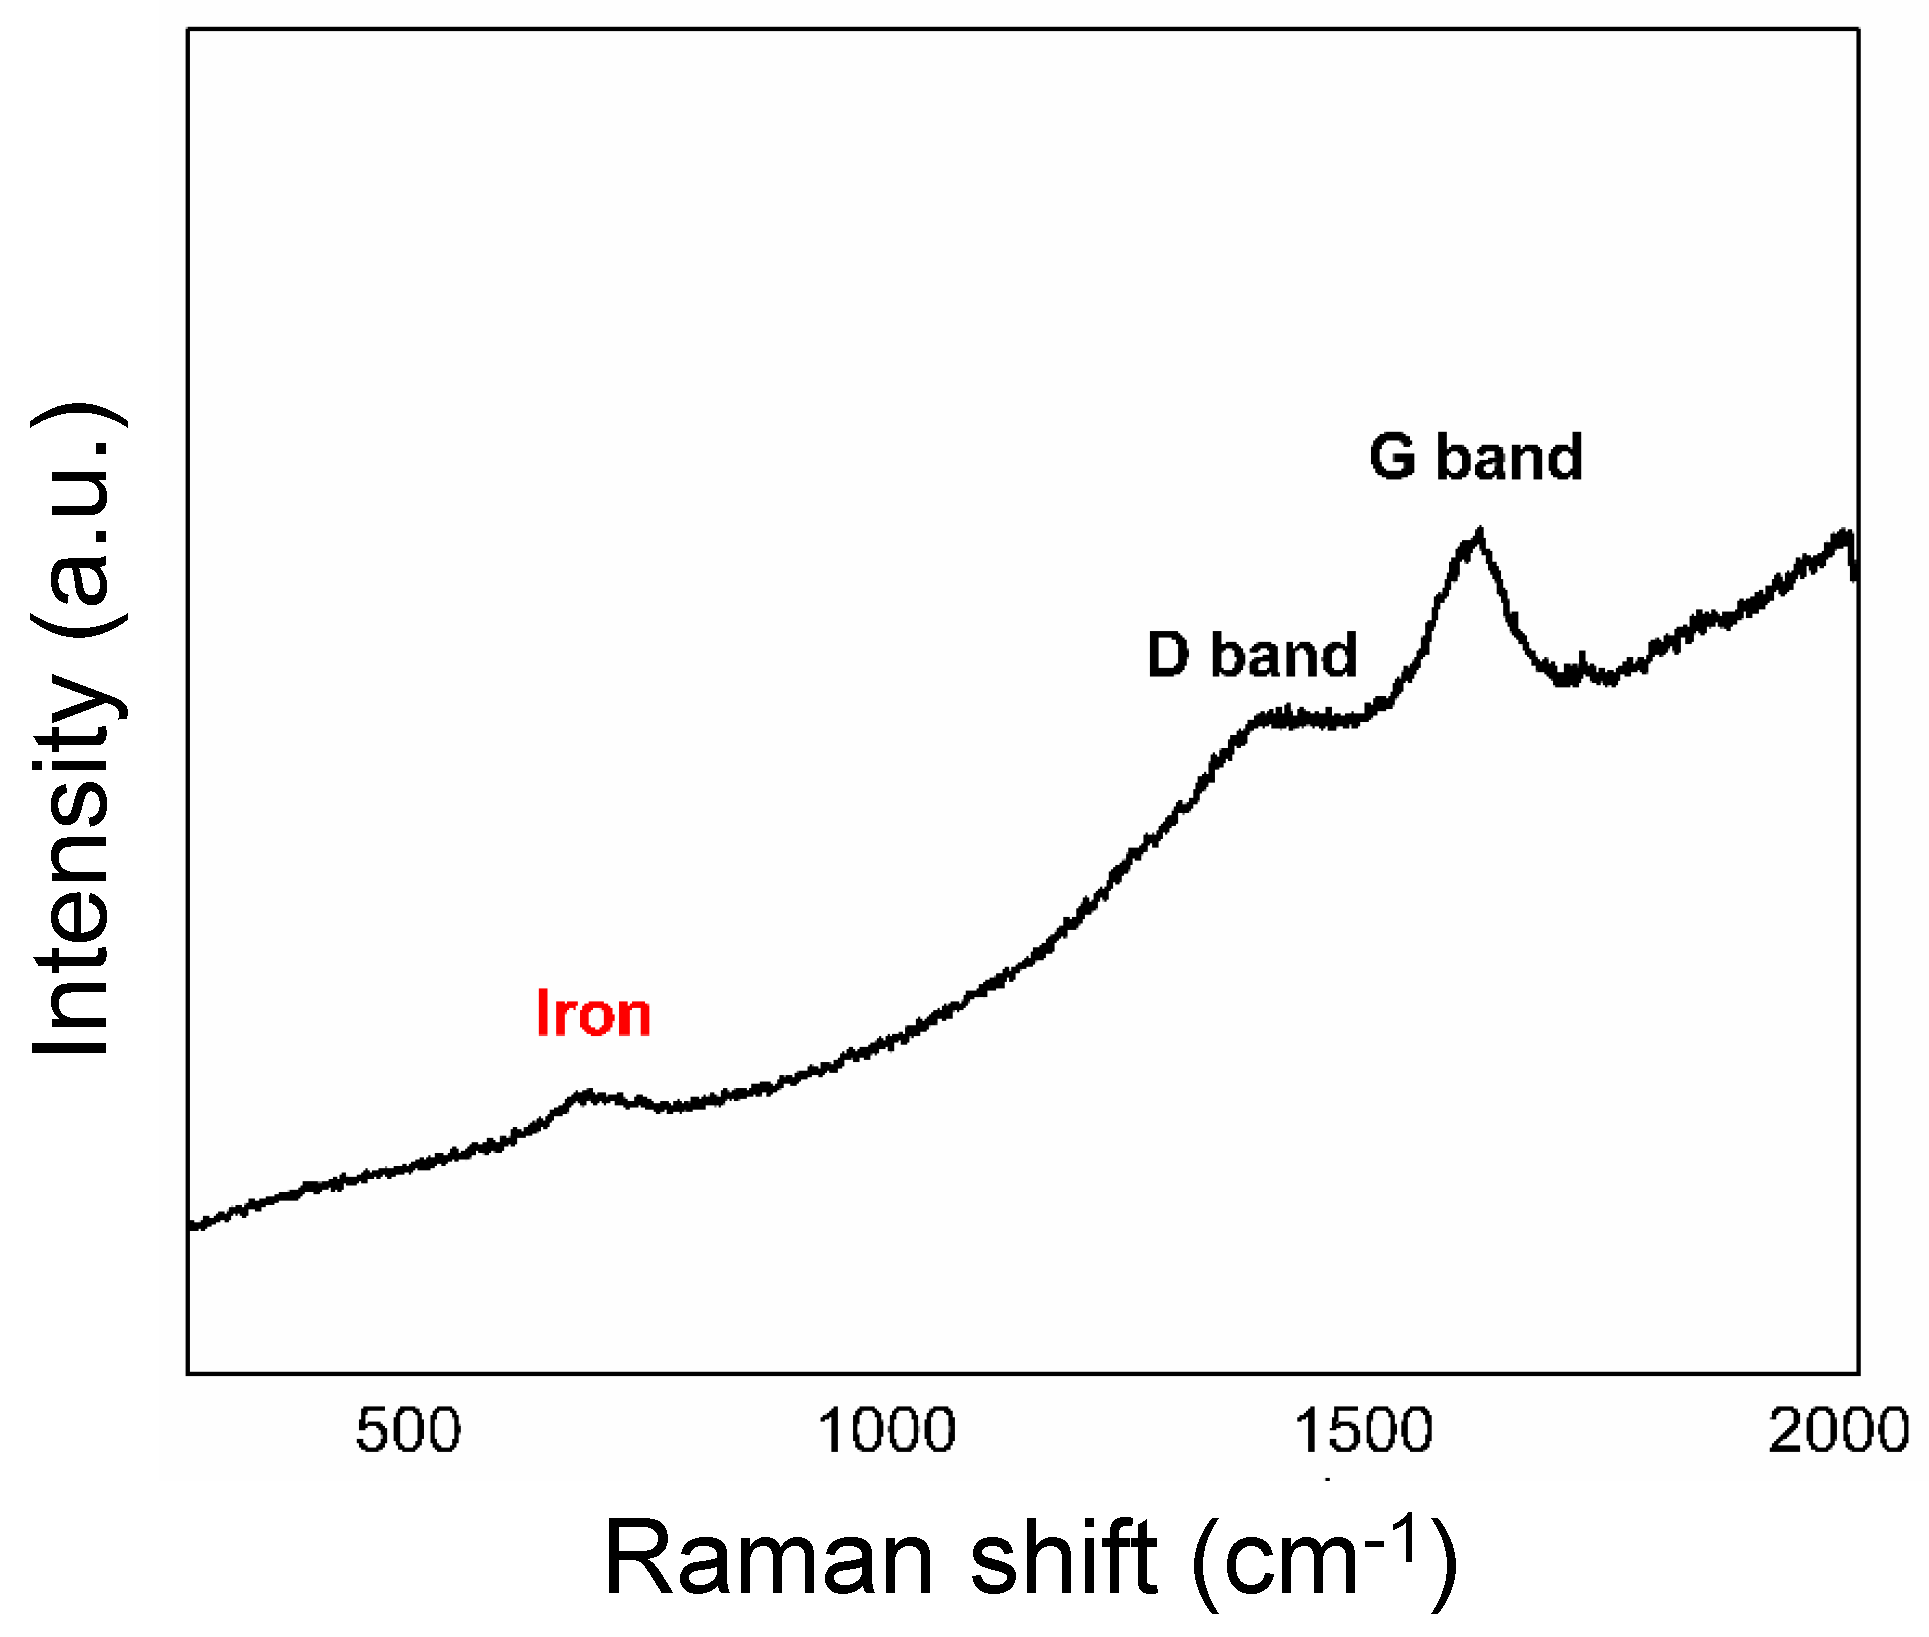
In Raman spectroscopy (Figure 4), the band at 1380 cm−1, denoted as the D band, is attributed to disorganized or defective carbon structures, while the band at 1595 cm−1, referred to as the G band, is associated with graphitic carbon structures [41]. The ID/IG ratio, showing the degree of disorder in the material (Hy-Fe), was 0.85. This value was close to 0.78, which was obtained by Debalina et al. (2020). These authors produced a magnetic biochar from sugar cane bagasse via pyrolysis [45]. A band was also observed at 679 cm−1, attributed to the stretching vibration mode of the Fe-O bonds. Similar results were described by Gasparov et al. (2000) [46].
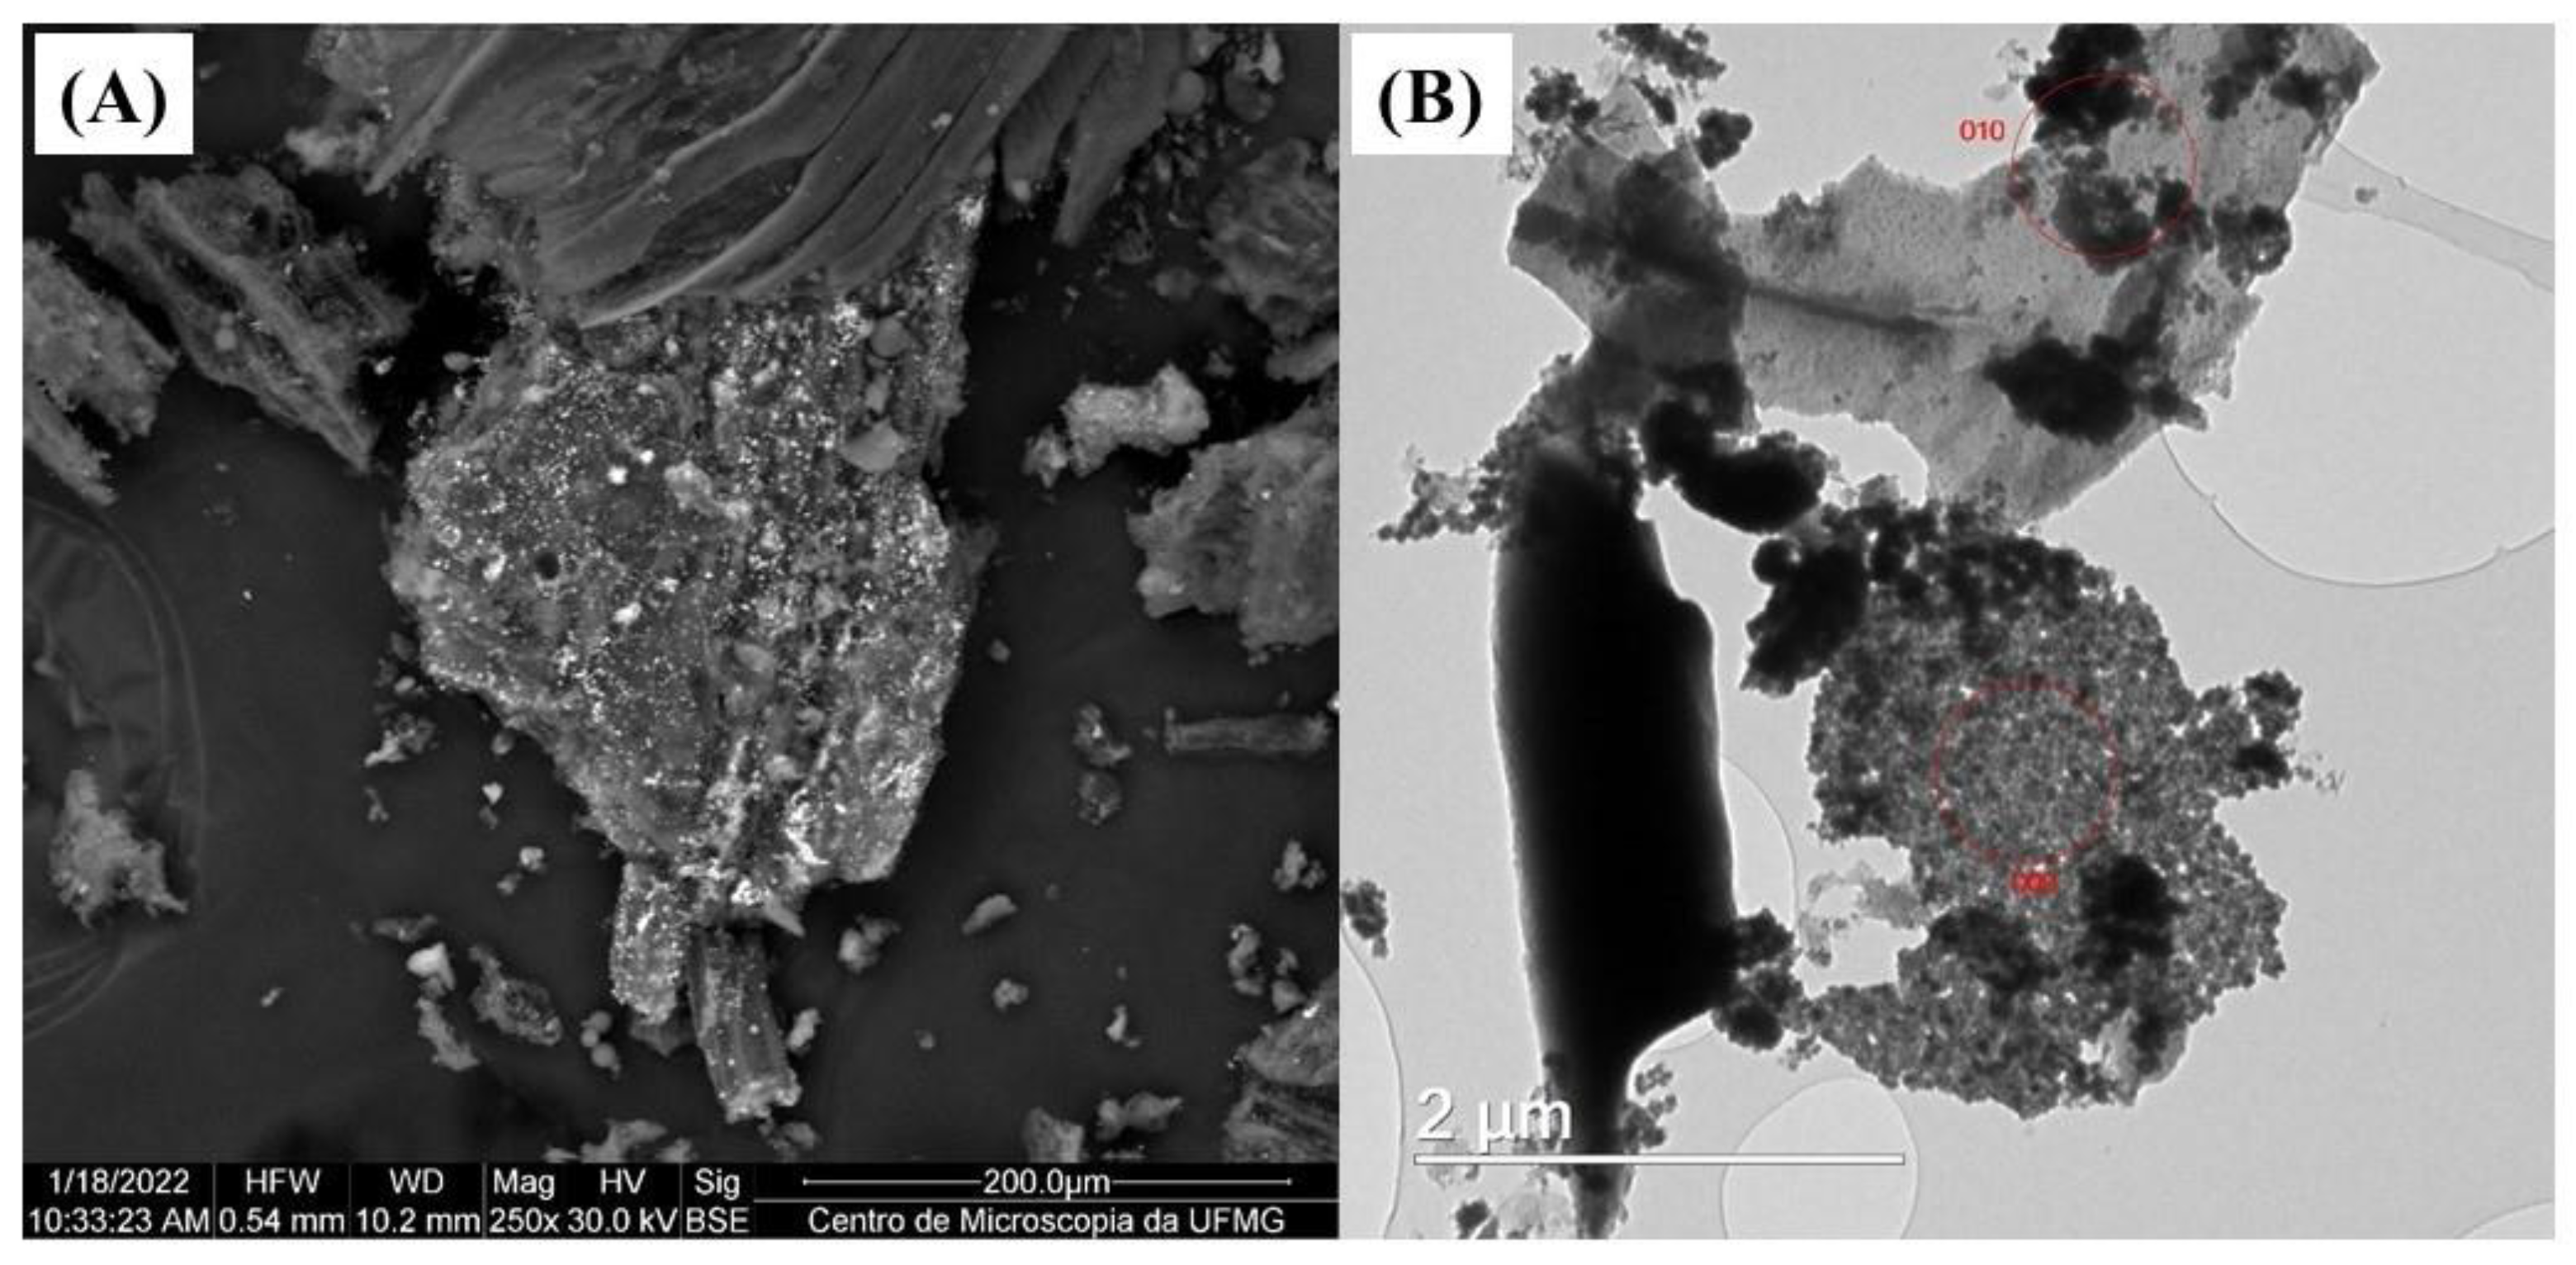
N2 adsorption/desorption isotherms were performed on Hy-Fe, and the results are shown in Figure S2. The material presented a specific surface area of 9.01 m2 g−1. This result aligns with hydrochar that has not undergone any activation process [47]. To analyze the surface morphology of Hy-Fe, Scanning Electron Microscopy (SEM) and Transmission Electron Microscopy (TEM) were utilized. The results are shown in Figure 5A,B, respectively.
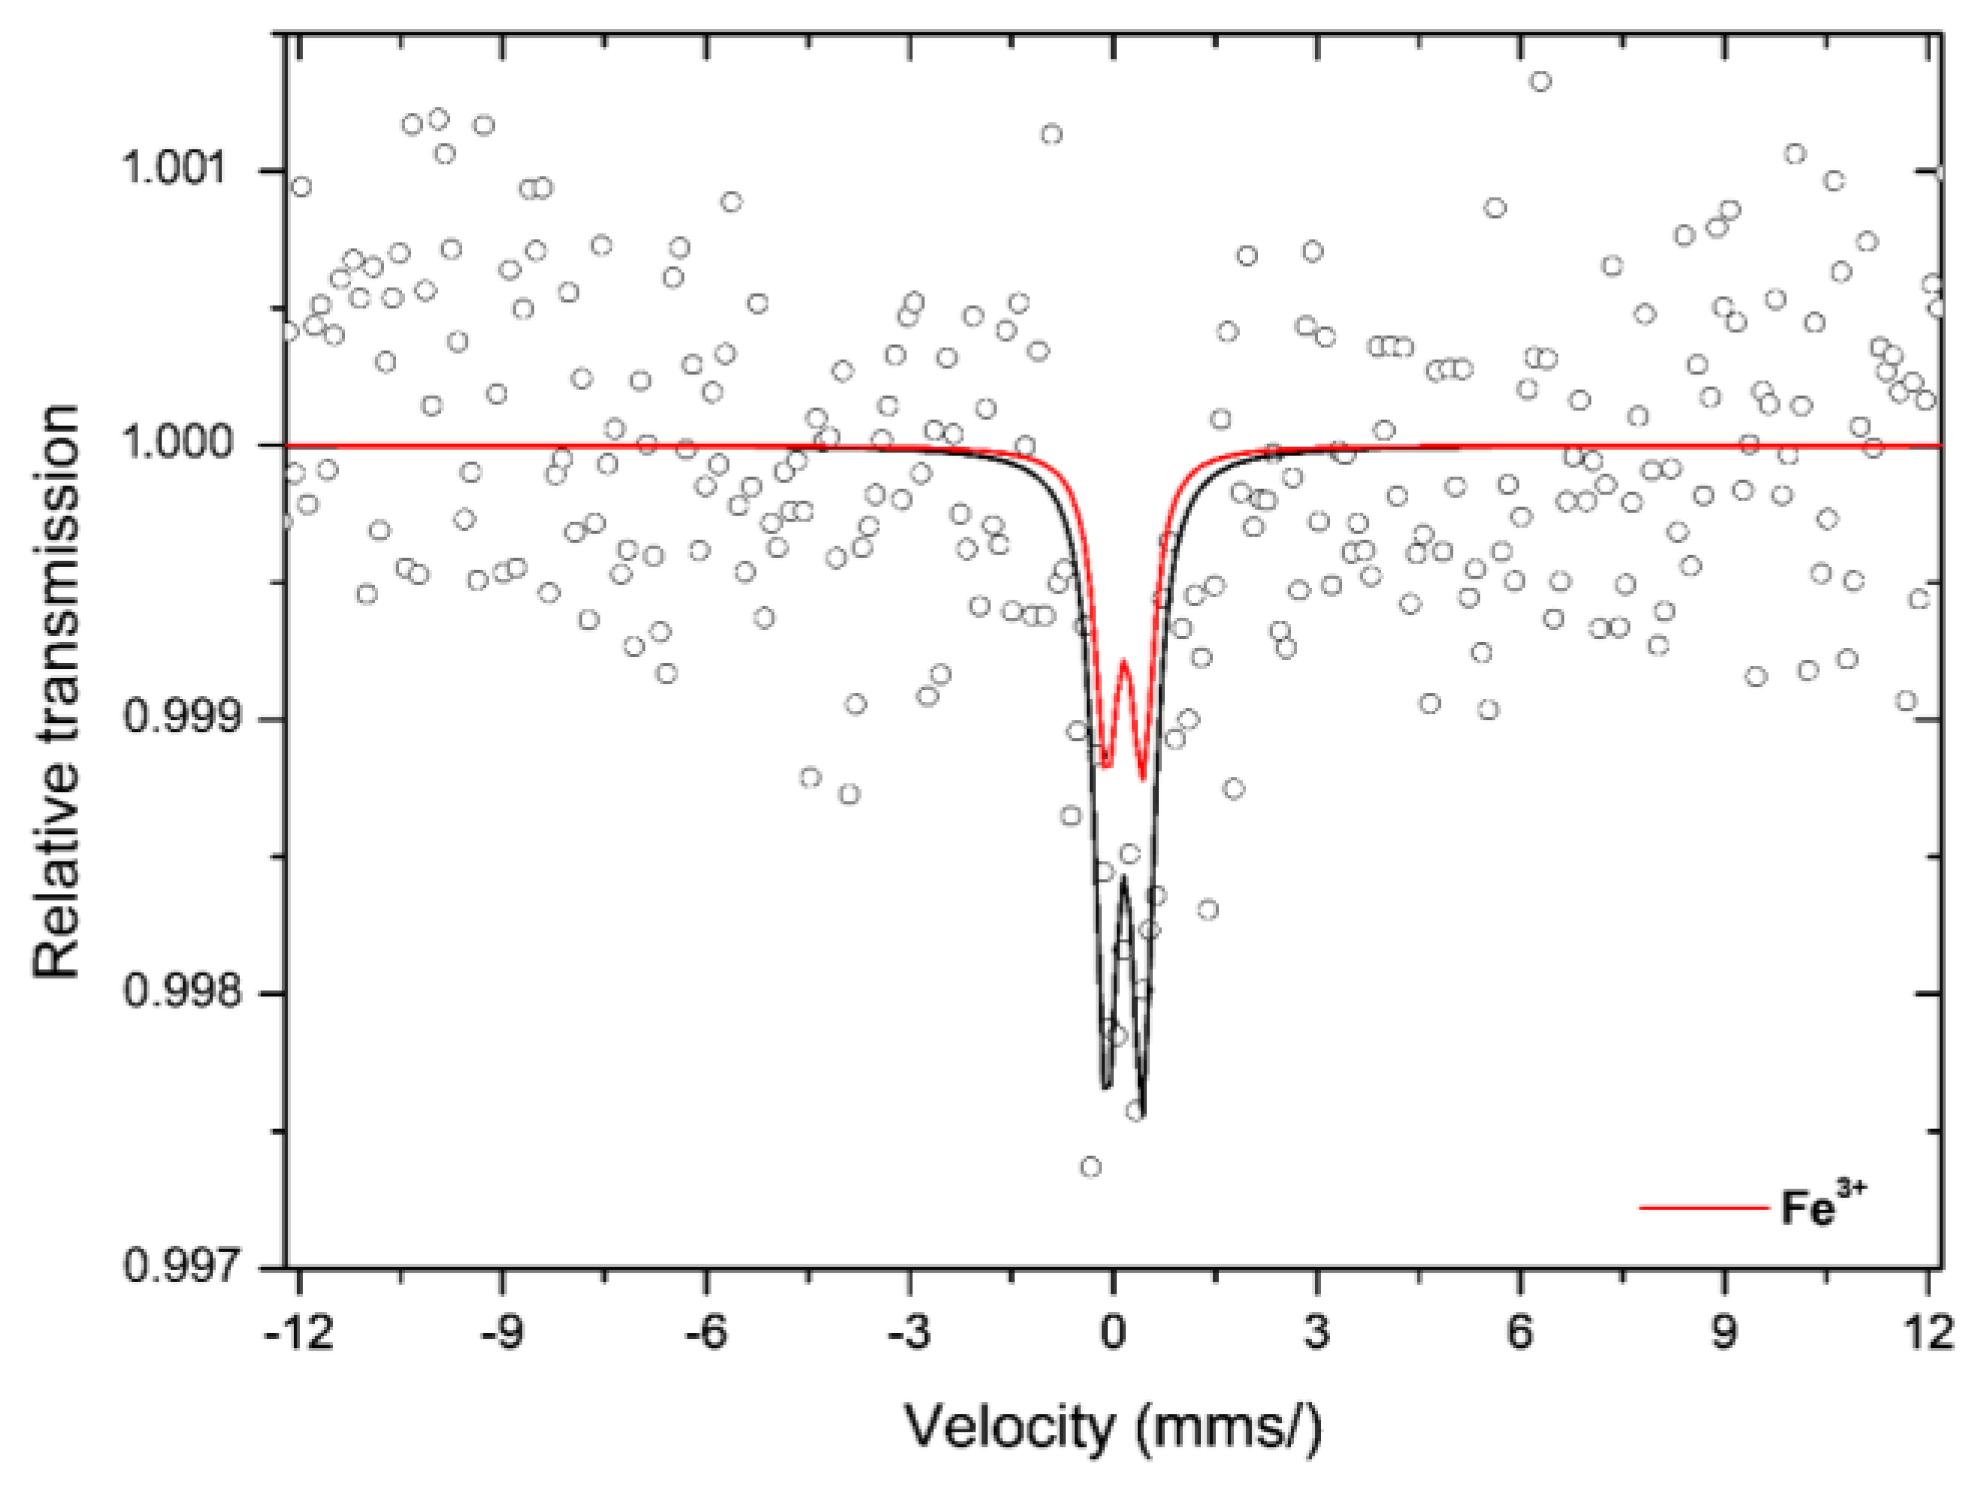
Hy-Fe showed a porous surface with macro and micro pores. These findings align with those reported by Jiang et al. (2019) for biochar supported with nano iron particles [48]. The formation of carbon lamellae, with iron particles exhibiting greater color intensity, was observed through TEM [49]. The EDS chemical element mapping of Hy-Fe (Figures S3 and S4, Supplementary Material) was performed to investigate the elements present on the surface of the material. The main constituent elements were identified as carbon (C), oxygen (O), and iron (Fe). It was also possible to observe that the iron particles are homogeneously distributed on the surface of Hy-Fe. Through X-ray fluorescence (XRF), it was possible to investigate the contents of compounds present in the inorganic fraction of Hy-Fe, and the results are presented in Table S1 (Supplementary Material). As observed, Fe2O3 is the compound present in the higher quantity in the inorganic fraction of Hy-Fe. Additionally, the contents of Al, Si, S, and P are also relatively high, while to a lesser extent, there is a presence of K, Ca, and Co. The Mössbauer spectrum of Hy-Fe is shown in Figure 6 and the hyperfine parameters are presented in Table S2 (Supplementary Material).
The Mössbauer spectrum at 298 K of Hy-Fe was fitted with an independent hyperfine field distribution model, indicating the presence of hematite. In addition to hematite, a duplet appears, presumably due to paramagnetic Fe3+, as observed in the structure of iron oxides undergoing superparamagnetic relaxation, such as hematite and/or goethite with very small average particle size [50]. These results corroborate those found through chemical mapping, that the iron particles are dispersed on the surface of the hydrochar.

3.2. Dicamba Degradation Assay

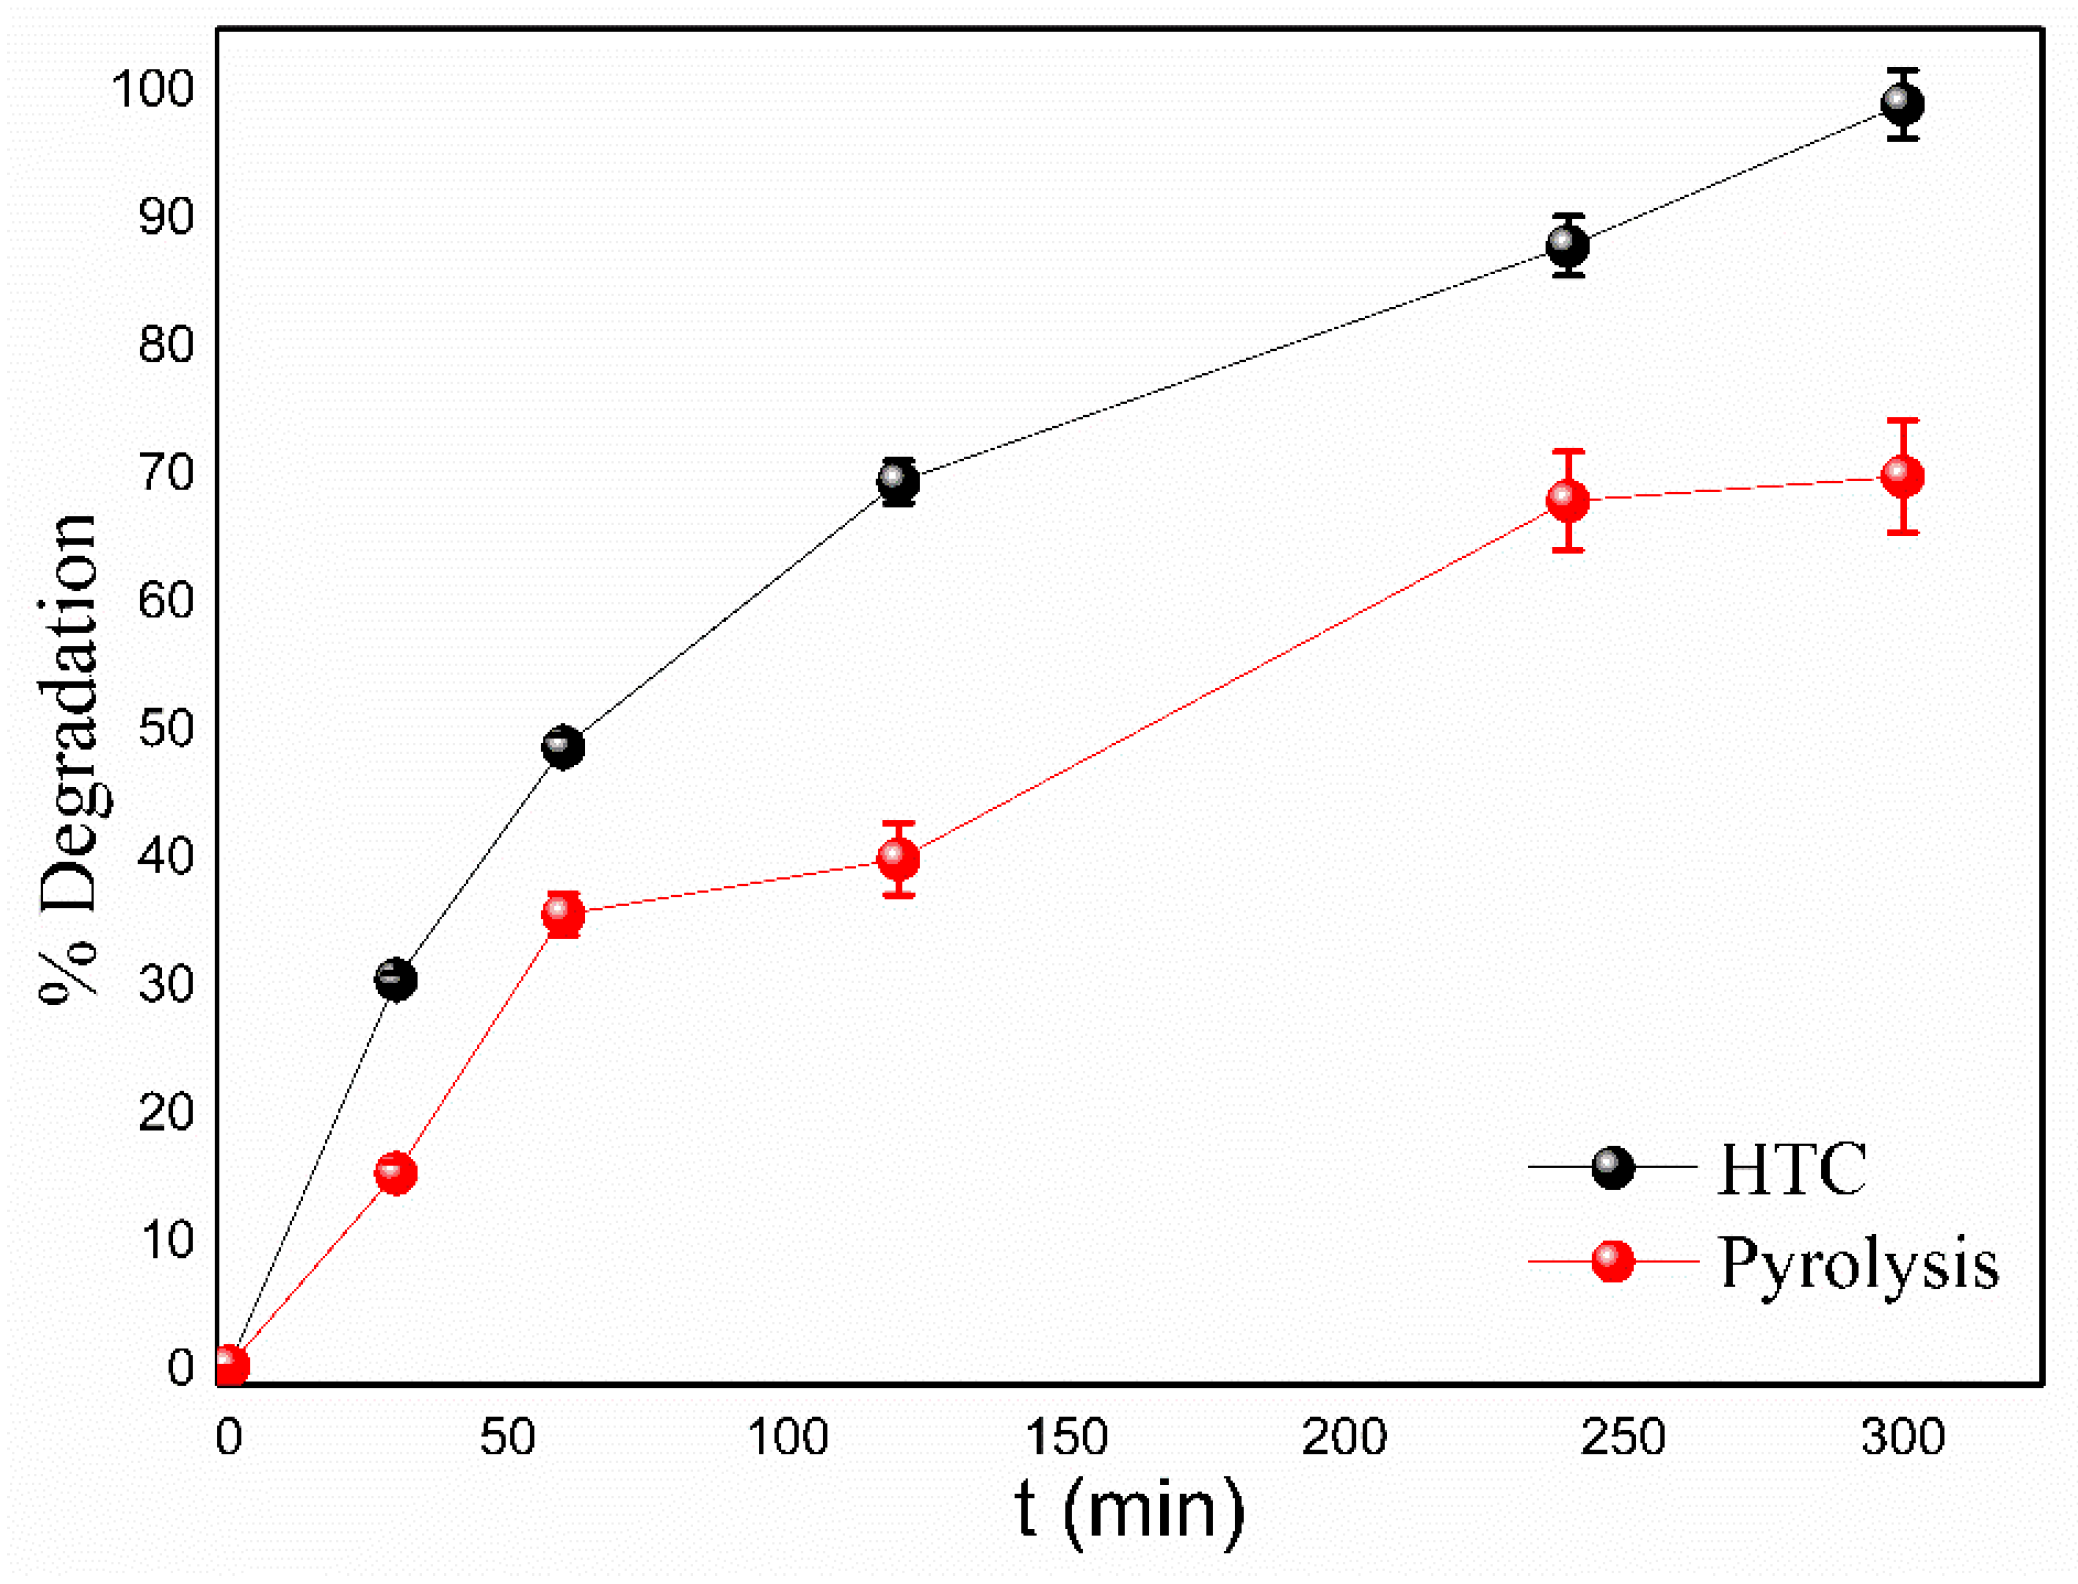
First, a standard dicamba solution was injected into the HPLC, and the chromatogram under optimized analysis conditions is shown in Figure S5 (Supplementary Material). The standard has a retention time (RT) of about 7 min. After the retention time determination, the degradation assays were performed in steps. Initially, control experiments were conducted to compare the reaction efficiency of biochars produced through pyrolysis and hydrothermal synthesis, and the results are shown in Figure 7. As observed, both materials can be utilized in the dicamba degradation process. However, the hydrochar produced via hydrothermal synthesis demonstrated superior degradation results (100%) compared to the biochar produced via pyrolysis (70%). This behavior agrees with that described by Shan et al. (2021), who observed that the hydrochar produced via hydrothermal synthesis presented better properties when compared to a biochar produced via pyrolysis. According to the authors, the hydrochar presented a greater amount of active sites, oxygen functional groups (OFGs), heteroatoms, sp2 carbon, persistent free radicals (PFR’s), defective sites, and vacancies [51]. Another advantage of using hydrothermal synthesis is that the entire Hy-Fe preparation process is carried out in a single step [52]. Control experiments were conducted specifically to assess the adsorption of dicamba by Hy-Fe, but the observed removal efficiency was surprisingly low, measuring only around 3%. These findings align with previous results obtained by our research group [33].
H2O2 was added at the onset of the reaction, along with the other reagents. The concentration used was determined based on the literature findings, considering an excess [53,54], as well as on previous work [33]. It is important to note that the reactions were consistently interrupted to conduct the analyses. The inclusion of aluminum sulfate solution in the system is based on the fact that the presence of Al species enhances the production of reactive oxygen species (ROS), as reported by Ruipérez et al. [55]. Degradation reactions are markedly influenced by the initial concentration of the pollutant. Thus, in the second step, experiments were conducted to evaluate the influence of the initial concentration of dicamba on the degradation system, and the results are shown in Figure 8.
As shown in Figure 8, 100% degradation was achieved within 300 min of reaction for all three initial dicamba concentrations. These concentrations were chosen to simulate a field condition, with three different washing steps of the spray tank. In the third step, experiments were conducted to evaluate the importance of agitation in the degradation system, and the results are shown in Figure 9. As observed, the degradation process occurs even with the solution at rest, reaching 90% degradation in 5 h. On the other hand, when the solution is exposed to constant stirring, the degradation percentage reaches its maximum (100%). According to the results for the system at rest, sporadic agitation and constant agitation showed remarkable similarity, facilitating the conditions for treating these effluents under field conditions.
In the fourth step, experiments were conducted to assess the influence of the Hy-Fe dose on the degradation system, and the results are presented in Figure S6 (Supplementary Material). The degradation reaction is notably influenced by the Hy-Fe dose, and for a dose of 1.00 g L−1, the reaction achieves 100% degradation within 300 min. However, when the solution is exposed to a higher dose of Hy-Fe (6.00 g L−1), the degradation time decreases to 240 min, and for the dose of 10.00 g L−1, more than 90% is degraded within 120 min.
In the fifth step, experiments were conducted to assess the potential use of the Hy-Fe system in different reaction cycles, and the results are shown in Figure 10. It can be observed that the efficiency of Hy-Fe in the degradation of dicamba decreases with each degradation cycle, going from 95% degradation in the first cycle to 65% and 60% in the second and third cycles, respectively. This reduction can be attributed to the saturation of the degradation sites.
For the trials involving the treatment of PPE, first, the residual concentration of dicamba in the wash waters of the contaminated PPE was quantified by HPLC, as shown in Figure S7 (Supplementary Material). The limit of quantification was previously determined in work conducted by the research group to be 0.21 ± 0.02 mg L−1. It can be observed that after the first wash, the concentration of dicamba is approximately 4.00 mg L−1. However, in subsequent washes, the dicamba concentration became negligible, falling below the quantification limit of the equipment. Hence, the degradation assays and assessment of degradation by-products through biological assays were conducted using the wastewater from the initial washing step (L1). The chromatogram of the degraded dicamba solution is shown in Figure S8 (Supplementary Material), demonstrating nearly 100% degradation. Notably, only one reaction byproduct is observed after 5 h of reaction.

3.3. Biological Assay with the Fenton-like Degraded Solutions

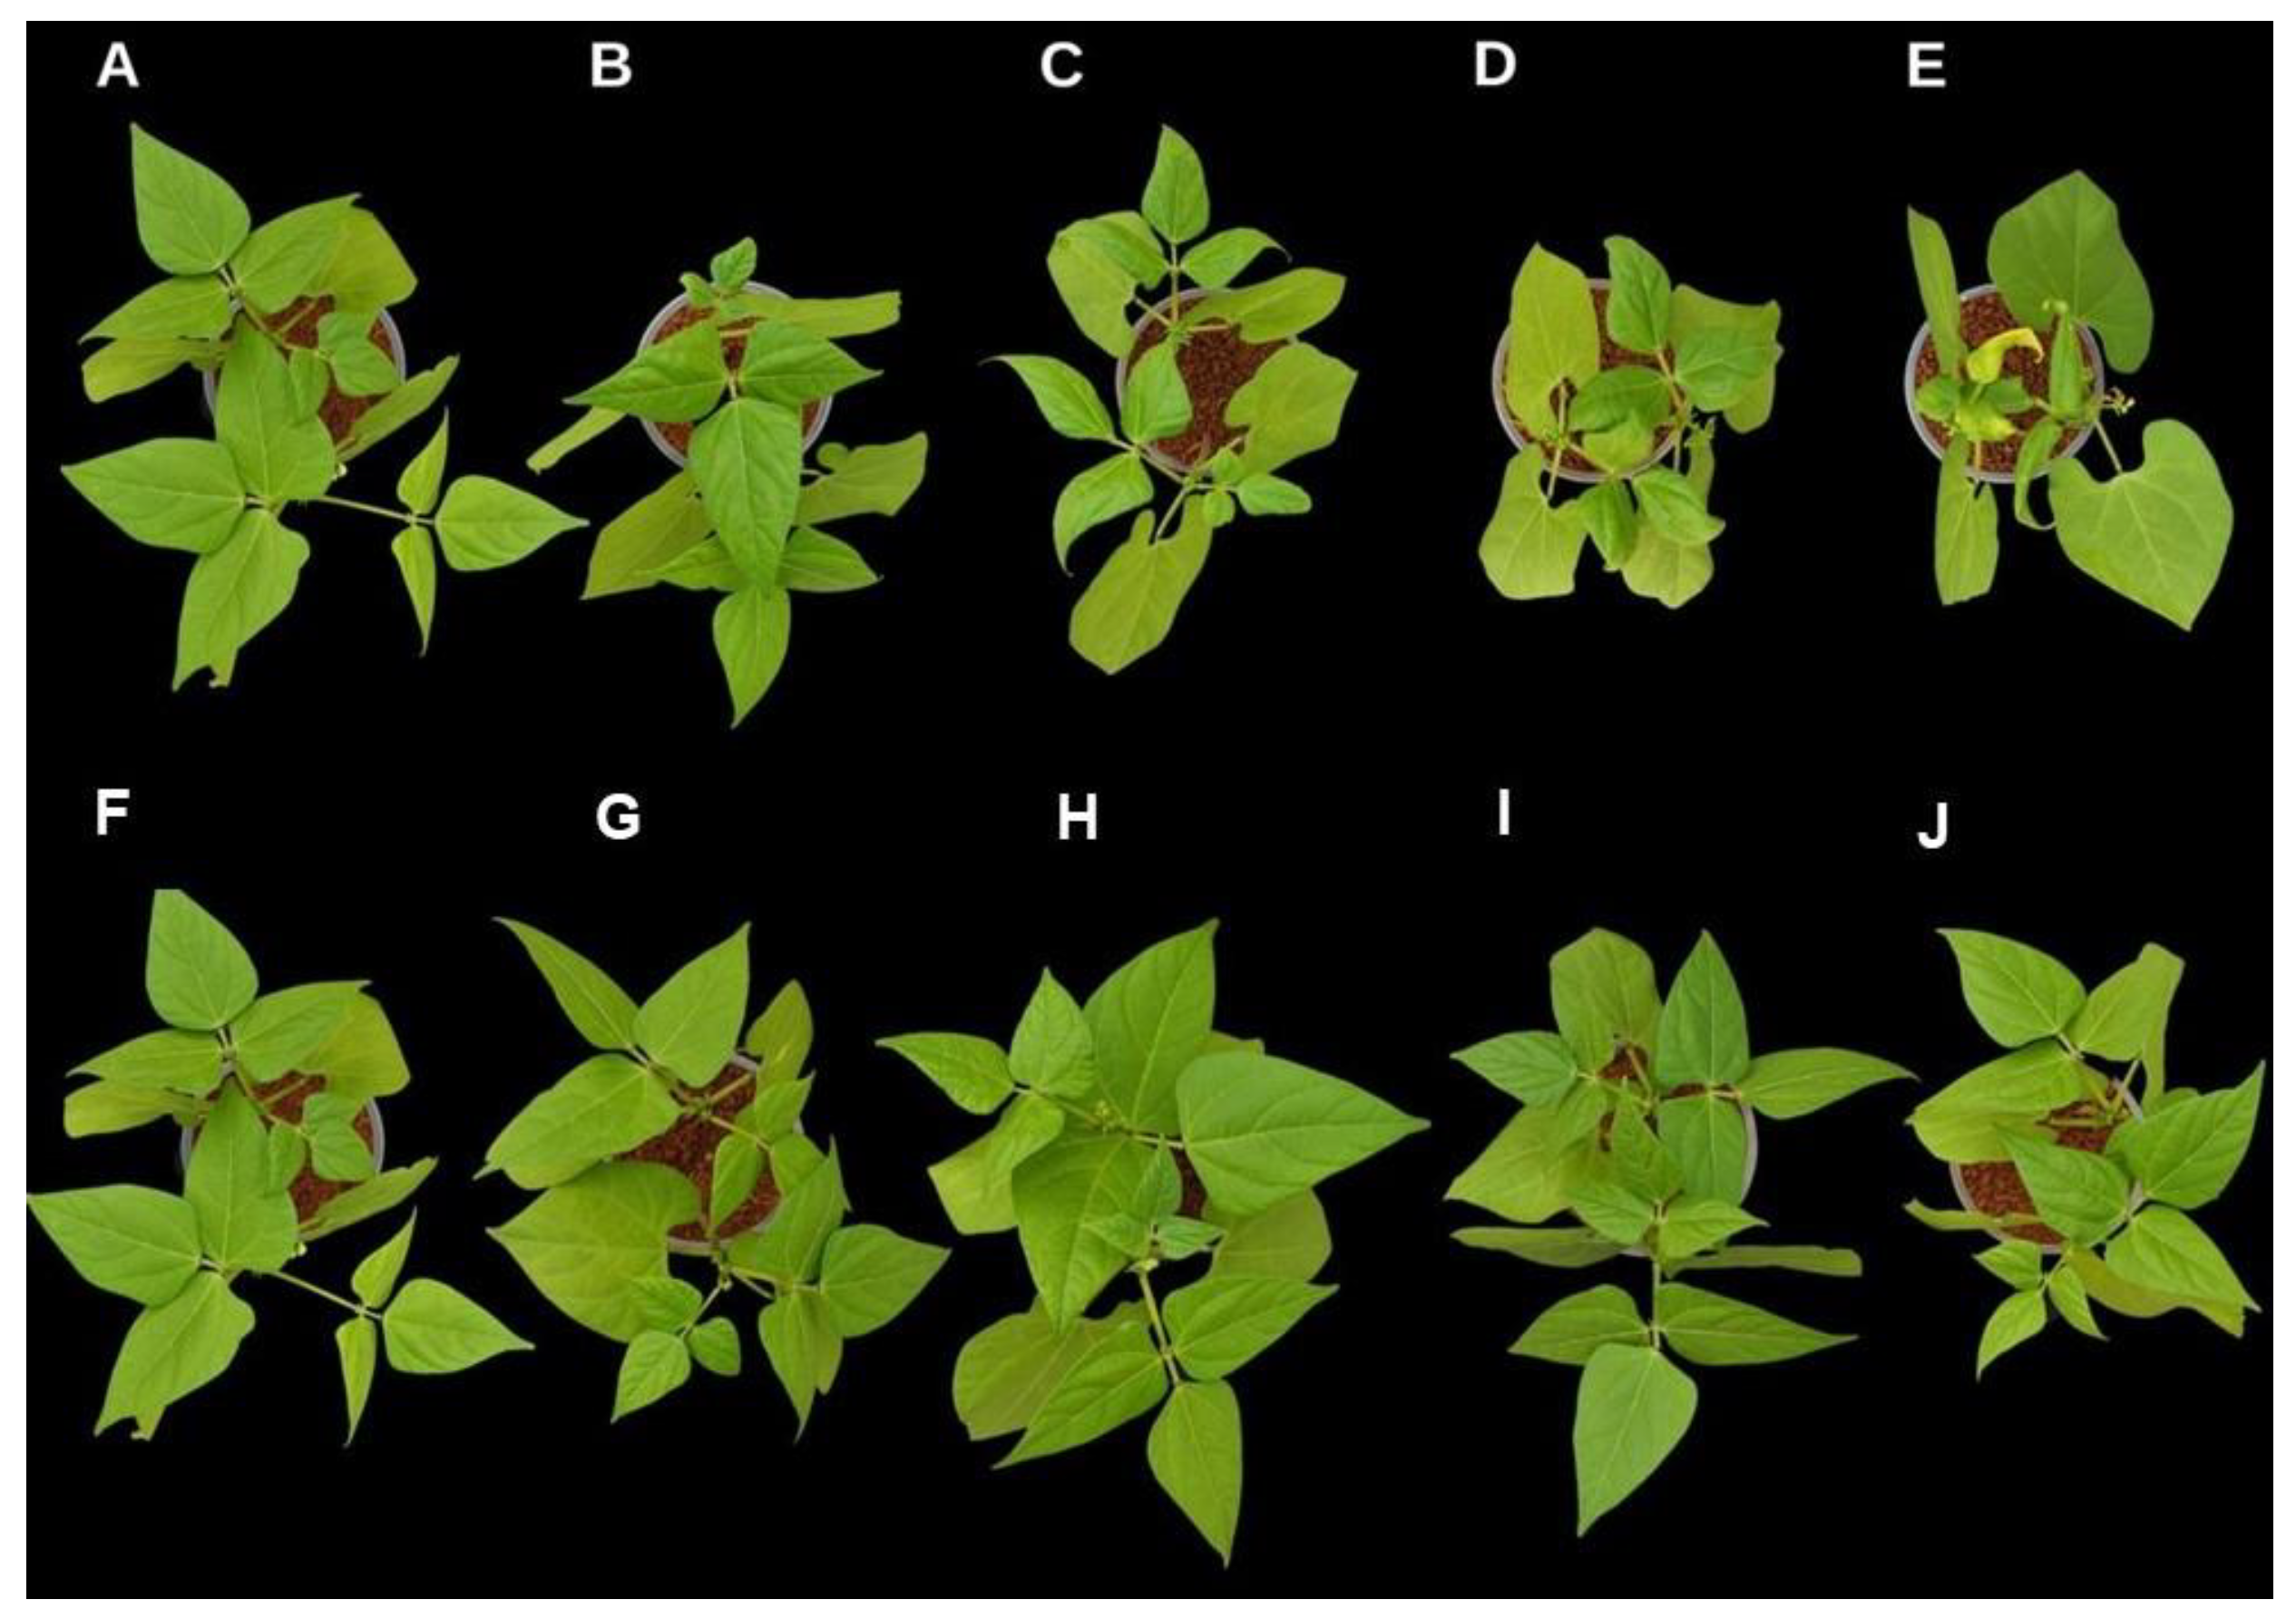
In the assessment involving sensitive plant species, the bean was selected as the indicator species due to its heightened sensitivity to dicamba [56]. The solutions were prepared in accordance with the treatments outlined in Table 1 and administered to the indicator plants, with the results monitored 21 days after application (DAA). The influence of different initial concentrations of dicamba was also evaluated, and the results shown in Figure 11. As shown in Figure 11B–E, dicamba exhibited major signs of intoxication with increasing applied concentrations. This intoxication becomes more pronounced when compared to the dry matter of the aerial part (DMAS) of the plants (Table 3), revealing a decrease in mass of 32% in response to the control.
On the contrary, Figure 11G–J depicts the visual intoxication at equivalent initial concentrations of dicamba, but these solutions underwent a degradation process via Fenton, employing Hy-Fe. The degradation of dicamba proved effective, as the plants exhibited no apparent symptoms of intoxication. Additionally, the dry matter of the aerial part of the plants was compared using the Tukey test. Notably, the identical letters indicate that the averages are equal. Consequently, solutions treated by the Fenton process are comparable to the control (water).
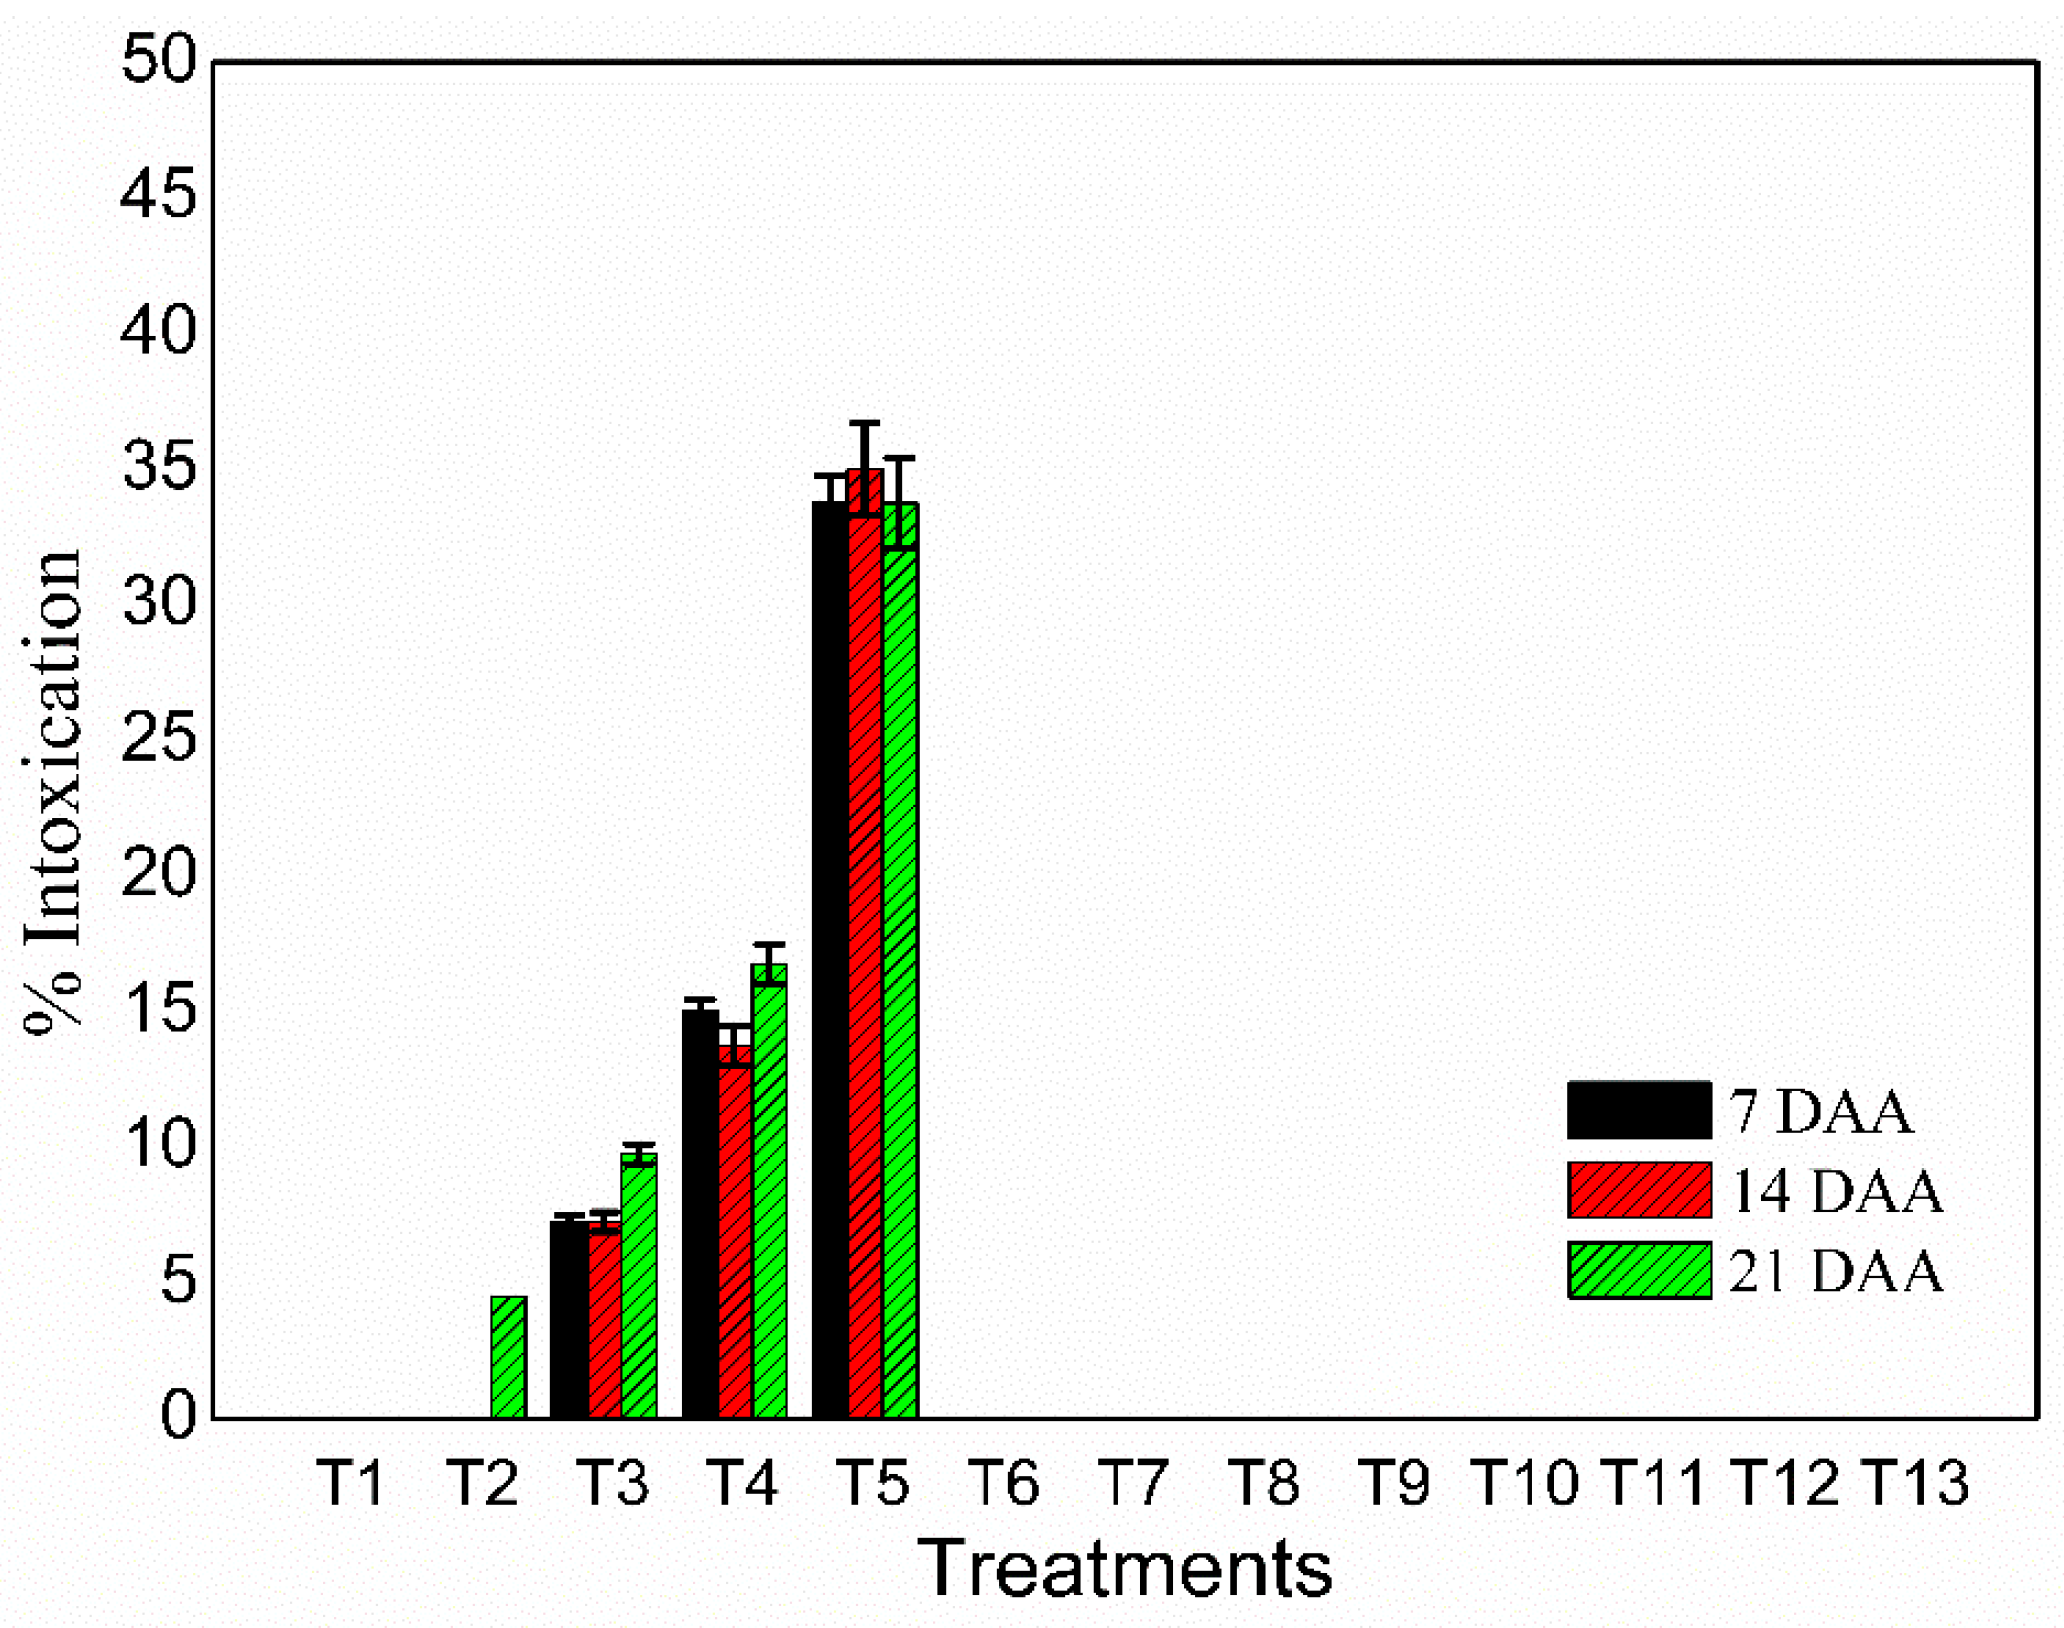
The results for the assessment of the Hy-Fe dose, the impact of system agitation, and the washing of the personal protective equipment (PPE) are depicted in Figures S9–S11 (Supplementary Material), respectively. Plant intoxication scores were assigned to each treatment at 21 days after application (DAA), and the outcomes are shown in Figure 12. It can be observed that there was no significant difference between the control experiment (T1) and the degraded solutions (T6–T13), supporting the notion that the dicamba degradation was effective in this Fenton-like degradation process using Hy-Fe.

4. Conclusions

Based on the findings of this study, it can be concluded that the Hy-Fe composite demonstrates significant potential for application in heterogeneous Fenton-like processes aimed at dicamba herbicide degradation in aqueous environments, providing a straightforward and effective solution. Its applications extend to the treatment of effluents from spray tanks and Personal Protective Equipment. Notably, the Hy-Fe composite, synthesized through hydrothermal methods, outperforms its pyrolysis-produced counterpart in terms of performance. The one-pot synthesis approach adds to its appeal, streamlining the production process. Moreover, in the biological assays conducted, plants treated with dicamba solutions subjected to Hy-Fe in the Fenton-like reaction did not exhibit visible signs of intoxication. This result suggests that integrating the Hy-Fe composite into dicamba residue degradation within spray tanks could be a practical, cost-efficient, and environmentally friendly alternative. In conclusion, the Hy-Fe composite proves to be an efficient and sustainable solution for dicamba degradation, positioning it as a suitable candidate for practical applications in agriculture. Further research and real-world implementation of this composite hold promise for developing effective and environmentally conscious strategies to address dicamba contamination and other related herbicides.

Supplementary Materials

The following supporting information can be downloaded at: https://www.mdpi.com/article/10.3390/pr11113244/s1, Figure S1. pHPZC for Hy-Fe produced via hydrothermal synthesis (HTC); Figure S2. (A) N2 adsorption–desorption isotherms and (B) Pore distribution for Hy-Fe produced via hydrothermal synthesis; Figure S3. EDS analysis for Hy-Fe produced via hydrothermal synthesis (HTC); Figure S4. Chemical element mapping by EDS for Hy-Fe produced via hydrothermal synthesis (HTC); Figure S5. Chromatogram of standard dicamba (50.00 mg L−1); Figure S6. Evaluation of Hy-Fe dose on dicamba degradation; Figure S7. Quantification of dicamba concentration found in the different Personal Protective Equipment (PPE) washes; Figure S8. Comparison of the chromatogram of a 50.00 mg L−1 commercial dicamba solution, and the same solution after the degradation process for 5 h; Figure S9. Apparent intoxication at 21 DAA (A) control solution (water), (B) commercial dicamba 50.00 mg L−1, (C) commercial dicamba 50.00 mg L−1 degraded with Hy-Fe 1.00 g L−1, (D) commercial dicamba 50.00 mg L−1 degraded with Hy-Fe 6.00 g L−1 e (E) commercial dicamba 50.00 mg L−1 degraded with Hy-Fe 10.00 g L−1; Figure S10. Apparent intoxication at 21 DAA (A) control solution (water), (B) commercial dicamba 50.00 mg L−1, (C) commercial dicamba 50.00 mg L−1 degraded with constant agitation, (D) commercial dicamba 50.00 mg L−1 degraded with periodic agitation and (E) commercial dicamba 50.00 mg L−1 degraded without agitation; Figure S11. Apparent intoxication at 21 DAA (A) control solution (water), (B) commercial dicamba 5.00 mg L−1, (C) commercial dicamba 5.00 mg L−1 degraded. Table S1. Chemical composition of the inorganic portion of Hy-Fe by FRX; Table S2. Room temperature hyperfine parameters of Hy-Fe.

Author Contributions

Conceptualization, T.G., K.C.M., K.F.M., A.P.d.C.T. and R.P.L.M.; methodology, T.G., E.M.G.d.S., A.C.M.d.A. and R.P.L.M.; software, T.G.; validation, T.G., M.M.d.C., K.C.M., K.F.M., A.A.d.S., A.P.d.C.T. and R.P.L.M.; formal analysis, T.G. and R.P.L.M.; investigation, T.G. and R.P.L.M.; resources, T.G. and R.P.L.M.; data curation, T.G. and R.P.L.M.; writing—original draft preparation, T.G., K.C.M., K.F.M., A.P.d.C.T. and R.P.L.M.; methodology, T.G., E.M.G.d.S., A.C.M.d.A. and R.P.L.M.; writing—review and editing, T.G., M.M.d.C., K.F.M., A.A.d.S., A.P.d.C.T. and R.P.L.M.; supervision, M.M.d.C., K.F.M., A.A.d.S., A.P.d.C.T. and R.P.L.M.; project administration, R.P.L.M.; funding acquisition, T.G., M.M.d.C., K.F.M., A.A.d.S., A.P.d.C.T. and R.P.L.M. All authors have read and agreed to the published version of the manuscript.

Funding

This research was funded by Coordination for the Improvement of Higher Education Personnel—Brazil (CAPES), National Council for Scientific and Technological Development (CNPq, Process: 405828/2022-5), Foundation for Research Support of the State of Minas Gerais (FAPEMIG, APQ-01275-18 and RED-00144-22), and INCT Midas.

Data Availability Statement

Data are contained within the article and supplementary materials.

Acknowledgments

The authors are thankful for the Laboratory of Nanomaterials and Environmental Chemistry (LANAQUA-UFV), The Microscopy Center at the Federal University of Minas Gerais (CM-UFMG), Laboratory of Cellulose and Paper (LCP-UFV), and Bayer S&A.

Conflicts of Interest

The authors declare no conflict of interest.

References

  1. IPEA. Agrotóxicos No Brasil: Padrões de Uso, Política Da Regulação e Prevenção Da Captura Regulatória; IPEA: Brasília, Brazil, 2019; Volume 76.
  2. Procópio, S.O.; Pires, F.R.; Menezes, C.C.E.; Barroso, A.L.L.; Moraes, R.V.; Silva, M.V.V.; Queiroz, R.G.; Carmo, M.L. Efeitos de Dessecantes No Controle de Plantas Daninhas Na Cultura Da Soja. Planta Daninha 2006, 24, 193–197. [Google Scholar] [CrossRef]
  3. Krzyszowska, A.J.; Allen, R.D.; Vance, G.F. Assessment of the Fate of Two Herbicides in a Wyoming Rangeland Soil: Column Studies. J. Environ. Qual. 1994, 23, 1051–1058. [Google Scholar] [CrossRef]
  4. Andrade, S.R.B.; Silva, A.A.; Lima, C.F.; D’Antonino, L.; Queiroz, M.E.L.R.; França, A.C.; Felipe, R.S.; Victoria Filho, R. Ametryn Leaching on Red-Yellow Latosol and Red-Yellow Ultisol with Different PH Values. Planta Daninha 2010, 28, 655–663. [Google Scholar] [CrossRef]
  5. Grover, R. Mobility of Dicamba, Picloram and 2,4-D in Soil Columns. Weed Sci. 1977, 25, 159–162. Available online: https://www.cambridge.org/core/journals/weed-science/article/abs/mobility-of-dicamba-picloram-and-24d-in-soil-columns/A4314DE4E62F91F57F45C0D1CE0DE2DC (accessed on 14 November 2023). [CrossRef]
  6. Underwood, M.G.; Soltani, N.; Hooker, D.C.; Robinson, D.E.; Vink, J.P.; Swanton, C.J.; Sikkema, P.H. The Addition of Dicamba to POST Applications of Quizalofop-p-Ethyl or Clethodim Antagonizes Volunteer Glyphosate-Resistant Corn Control in Dicamba-Resistant Soybean. Weed Technol. 2016, 30, 639–647. [Google Scholar] [CrossRef]
  7. Beyki, T.; Asadollahzadeh, M.J. Selective Removal of Dicamba from Aqueous Samples Using Molecularly Imprinted Polymer Nanospheres. J. Water Environ. Nanotechnol. 2016, 1, 19–25. [Google Scholar] [CrossRef]
  8. Furtado, R.D.; Hoff, R.B. Removal of Imazethapyr and Imazapic from the Effluent of Aero-Agricultural Operations: Efficiency of a Treatment System Using Ozone. Water. Air. Soil Pollut. 2017, 228, 438. [Google Scholar] [CrossRef]
  9. Bahieldin, A.; Dyer, W.E.; Qu, R. Concentration Effects of Dicamba on Shoot Regeneration in Wheat. Plant Breed. 2000, 119, 437–439. [Google Scholar] [CrossRef]
  10. Alavanja, M.C.R.; Dosemeci, M.; Samanic, C.; Lubin, J.; Lynch, C.F.; Knott, C.; Barker, J.; Hoppin, J.A.; Sandler, D.P.; Coble, J.; et al. Pesticides and Lung Cancer Risk in the Agricultural Health Study Cohort. Am. J. Epidemiol. 2004, 160, 876–885. [Google Scholar] [CrossRef] [PubMed]
  11. Vidal, R.A.; Fleck, N.C. Análise Do Risco Da Ocorrência de Biotipos de Plantas Daninhas Resistentes Aos Herbicidas. Planta Daninha 1997, 15, 152–161. [Google Scholar] [CrossRef]
  12. Campos, S.X.d.; Vieira, E.M. Estudo Da Degradação Do Herbicida Ácido 2,4-Diclorofenoxiacético (2,4-D) Por Meio Da Radiação Gama Do Cobalto-60 Em Solução Aquosa Contendo Ácido Húmico. Quim. Nova 2002, 25, 529–532. [Google Scholar] [CrossRef]
  13. Qiang, Z.; Liu, C.; Dong, B.; Zhang, Y. Degradation Mechanism of Alachlor during Direct Ozonation and O3/H2O2 Advanced Oxidation Process. Chemosphere 2010, 78, 517–526. [Google Scholar] [CrossRef] [PubMed]
  14. Wantala, K.; Khemthong, P.; Wittayakun, J.; Grisdanurak, N. Visible Light-Irradiated Degradation of Alachlor on Fe-TiO2 with Assistance of H2O2. Korean J. Chem. Eng. 2011, 28, 2178–2183. [Google Scholar] [CrossRef]
  15. Yang, Y.; Ghatge, S.; Ko, Y.; Yoon, Y.; Ahn, J.-H.; Kim, J.J.; Hur, H.-G. Non-Specific Degradation of Chloroacetanilide Herbicides by Glucose Oxidase Supported Bio-Fenton Reaction. Chemosphere 2021, 292, 133417. [Google Scholar] [CrossRef]
  16. Xin, Y.; Liu, H.; Han, L.; Zhou, Y. Comparative Study of Photocatalytic and Photoelectrocatalytic Properties of Alachlor Using Different Morphology TiO 2/Ti Photoelectrodes. J. Hazard. Mater. 2011, 192, 1812–1818. [Google Scholar] [CrossRef]
  17. Deng, X.; Yang, Y.; Mei, Y.; Li, J.; Guo, C.; Yao, T.; Guo, Y.; Xin, B.; Wu, J. Construction of Fe3O4@FeS2@C@MoS2 Z-Scheme Heterojunction with Sandwich-like Structure: Enhanced Catalytic Performance in Photo-Fenton Reaction and Mechanism Insight. J. Alloys Compd. 2021, 901, 163437. [Google Scholar] [CrossRef]
  18. Rossi, A.F.; Martins, R.C.; Quinta-Ferreira, R.M. Reuse of Homogeneous Fenton’s Sludge from Detergent Industry as Fenton’s Catalyst. J. Adv. Oxid. Technol. 2013, 16, 298–305. [Google Scholar] [CrossRef]
  19. Dulova, N.; Trapido, M.; Dulov, A. Catalytic Degradation of Picric Acid by Heterogeneous Fenton-Based Processes. Environ. Technol. 2011, 32, 439–446. [Google Scholar] [CrossRef]
  20. Qian, K.; Kumar, A.; Zhang, H.; Bellmer, D.; Huhnke, R. Recent Advances in Utilization of Biochar. Renew. Sustain. Energy Rev. 2015, 42, 1055–1064. [Google Scholar] [CrossRef]
  21. Neyens, E.; Baeyens, J. A Review of Classic Fenton’s Peroxidation as an Advanced Oxidation Technique. J. Hazard. Mater. 2003, 98, 33–50. [Google Scholar] [CrossRef]
  22. Camps, B.M.; Tomlinson, T.; Initiative, I.B. The Use of Biochar in Composting Compost and Biochar: In Competition for Feedstocks? Biochar Benefits to the Composting Processes; MDPI: Basel, Switzerland, 2015. [Google Scholar]
  23. Cayuela, M.L.; Roig, A.; Jindo, K.; Mondini, C.; Bolan, N. Bioresource Technology Role of Biochar as an Additive in Organic Waste Composting. Bioresour. Technol. 2018, 247, 1155–1164. [Google Scholar] [CrossRef]
  24. Lee, D.; Cheng, Y.; Wong, R.; Wang, X. Bioresource Technology Adsorption Removal of Natural Organic Matters in Waters Using Biochar. Bioresour. Technol. 2018, 260, 413–416. [Google Scholar] [CrossRef]
  25. Cha, J.S.; Park, S.H.; Jung, S.C.; Ryu, C.; Jeon, J.K.; Shin, M.C.; Park, Y.K. Production and Utilization of Biochar: A Review. J. Ind. Eng. Chem. 2016, 40, 1–15. [Google Scholar] [CrossRef]
  26. Ajmal, Z.; Muhmood, A.; Usman, M.; Kizito, S.; Lu, J.; Dong, R.; Wu, S. Phosphate Removal from Aqueous Solution Using Iron Oxides: Adsorption, Desorption and Regeneration Characteristics. J. Colloid Interface Sci. 2018, 528, 145–155. [Google Scholar] [CrossRef] [PubMed]
  27. Mofradnia, S.R.; Ashouri, R.; Tavakoli, Z.; Shahmoradi, F.; Rashedi, H.; Yazdian, F. Effect of Zero-Valent Iron/Starch Nanoparticle on Nitrate Removal Using MD Simulation. Int. J. Biol. Macromol. 2019, 121, 727–733. [Google Scholar] [CrossRef] [PubMed]
  28. Fu, F.; Dionysiou, D.D.; Liu, H. The Use of Zero-Valent Iron for Groundwater Remediation and Wastewater Treatment: A Review. J. Hazard. Mater. 2014, 267, 194–205. [Google Scholar] [CrossRef] [PubMed]
  29. Sun, Y.; Yu, I.K.M.; Tsang, D.C.W.; Cao, X.; Lin, D.; Wang, L.; Graham, N.J.D.; Alessi, D.S.; Komárek, M.; Sik, Y.; et al. Multifunctional Iron-Biochar Composites for the Removal of Potentially Toxic Elements, Inherent Cations, and Hetero-Chloride from Hydraulic Fracturing Wastewater. Environ. Int. 2019, 124, 521–532. [Google Scholar] [CrossRef] [PubMed]
  30. Wang, L.; Zhang, J.; Wang, A. Removal of Methylene Blue from Aqueous Solution Using Chitosan-g-Poly(Acrylic Acid)/Montmorillonite Superadsorbent Nanocomposite. Colloids Surf. A Physicochem. Eng. Asp. 2008, 322, 47–53. [Google Scholar] [CrossRef]
  31. Guimarães, T.; Andrade Luciano, V.; Stefani Ventura Silva, M.; Paula de Carvalho Teixeira, A.; Moreira da Costa, M.; Pereira Lopes, R. Biochar-Iron Composites: An Efficient Material for Dyes Removal. Environ. Nanotechnol. Monit. Manag. 2022, 17, 100645. [Google Scholar] [CrossRef]
  32. Guimarães, T.; De Oliveira, A.F.; Lopes, R.P.; De Carvalho Teixeira, A.P. Biochars Obtained from Arabica Coffee Husks by a Pyrolysis Process: Characterization and Application in Fe(Ii) Removal in Aqueous Systems. New J. Chem. 2020, 44, 3310–3322. [Google Scholar] [CrossRef]
  33. Guimarães, T.; de Aguiar, A.; da Silva, E.; Mielke, K.; da Costa, M.; da Silva, A.; Teixeira, A.; Lopes, R. Dicamba Degradation by Fenton-Like Process Using Iron/Biochar Composites. J. Braz. Chem. Soc. 2023, 00, 1–9. [Google Scholar] [CrossRef]
  34. Guimarães, T.; Paquini, L.D.; Lyrio Ferraz, B.R.; Roberto Profeti, L.P.; Profeti, D. Efficient Removal of Cu(II) and Cr(III) Contaminants from Aqueous Solutions Using Marble Waste Powder. J. Environ. Chem. Eng. 2020, 8, 103972. [Google Scholar] [CrossRef]
  35. Veiga, P.A.d.S.; Schultz, J.; Matos, T.T.d.S.; Fornari, M.R.; Costa, T.G.; Meurer, L.; Mangrich, A.S. Production of High-Performance Biochar Using a Simple and Low-Cost Method: Optimization of Pyrolysis Parameters and Evaluation for Water Treatment. J. Anal. Appl. Pyrolysis 2020, 148, 104823. [Google Scholar] [CrossRef]
  36. Ibrahim, A.F.M.; Dandamudi, K.P.R.; Deng, S.; Lin, Y.S. Pyrolysis of Hydrothermal Liquefaction Algal Biochar for Hydrogen Production in a Membrane Reactor. Fuel 2020, 265, 116935. [Google Scholar] [CrossRef]
  37. Li, M.; Liu, H.; Chen, T.; Dong, C.; Sun, Y. Synthesis of Magnetic Biochar Composites for Enhanced Uranium(VI) Adsorption. Sci. Total Environ. 2019, 651, 1020–1028. [Google Scholar] [CrossRef]
  38. Wei, Y.; Shen, C.; Xie, J.; Bu, Q. Study on Reaction Mechanism of Superior Bamboo Biochar Catalyst Production by Molten Alkali Carbonates Pyrolysis and Its Application for Cellulose Hydrolysis. Sci. Total Environ. 2020, 712, 136435. [Google Scholar] [CrossRef]
  39. Ghani, W.A.W.A.K.; Mohd, A.; da Silva, G.; Bachmann, R.T.; Taufiq-Yap, Y.H.; Rashid, U.; Al-Muhtaseb, A.H. Biochar Production from Waste Rubber-Wood-Sawdust and Its Potential Use in C Sequestration: Chemical and Physical Characterization. Ind. Crops Prod. 2013, 44, 18–24. [Google Scholar] [CrossRef]
  40. Tang, Y.; Alam, M.S.; Konhauser, K.O.; Alessi, D.S.; Xu, S.; Tian, W.J.; Liu, Y. Influence of Pyrolysis Temperature on Production of Digested Sludge Biochar and Its Application for Ammonium Removal from Municipal Wastewater. J. Clean. Prod. 2019, 209, 927–936. [Google Scholar] [CrossRef]
  41. Pereira Lopes, R.; Astruc, D. Biochar as a Support for Nanocatalysts and Other Reagents: Recent Advances and Applications; Elsevier B.V.: Amsterdam, The Netherlands, 2021; Volume 426, ISBN 4843550159. [Google Scholar]
  42. Álvarez, M.L.; Gascó, G.; Palacios, T.; Paz-Ferreiro, J.; Méndez, A. Fe Oxides-Biochar Composites Produced by Hydrothermal Carbonization and Pyrolysis of Biomass Waste. J. Anal. Appl. Pyrolysis 2020, 151, 104893. [Google Scholar] [CrossRef]
  43. Zhou, Y.; Liu, G.; Liu, J.; Xiao, Y.; Wang, T.; Xue, Y. Magnetic Biochar Prepared by Electromagnetic Induction Pyrolysis of Cellulose: Biochar Characterization, Mechanism of Magnetization and Adsorption Removal of Chromium (VI) from Aqueous Solution. Bioresour. Technol. 2021, 337, 125429. [Google Scholar] [CrossRef]
  44. Chu, J.H.; Kang, J.K.; Park, S.J.; Lee, C.G. Application of Magnetic Biochar Derived from Food Waste in Heterogeneous Sono-Fenton-like Process for Removal of Organic Dyes from Aqueous Solution. J. Water Process Eng. 2020, 37, 101455. [Google Scholar] [CrossRef]
  45. Debalina, B.; Reddy, R.B.; Vinu, R. Production of Carbon Nanostructures in Biochar, Bio-Oil and Gases from Bagasse via Microwave Assisted Pyrolysis Using Fe and Co as Susceptors. J. Anal. Appl. Pyrolysis 2017, 124, 310–318. [Google Scholar] [CrossRef]
  46. Gasparov, L.V.; Tanner, D.B.; Romero, D.B.; Berger, H.; Margaritondo, G.; Forró, L. Infrared and Raman Studies of the Verwey Transition in Magnetite. Phys. Rev. B-Condens. Matter Mater. Phys. 2000, 62, 7939–7944. [Google Scholar] [CrossRef]
  47. Ma, Y.; Bao, H.; Hu, X.; Wang, R.; Dong, W. Productions of Phenolic Rich Bio-Oil Using Waste Chilli Stem Biomass by Catalytic Pyrolysis: Evaluation of Reaction Parameters on Products Distributions. J. Energy Inst. 2021, 97, 233–239. [Google Scholar] [CrossRef]
  48. Jiang, S.F.; Xi, K.F.; Yang, J.; Jiang, H. Biochar-Supported Magnetic Noble Metallic Nanoparticles for the Fast Recovery of Excessive Reductant during Pollutant Reduction. Chemosphere 2019, 227, 63–71. [Google Scholar] [CrossRef]
  49. Renata, P. Magnetized Biochar as a Gold Nanocatalyst Support for p-Nitrophenol Reduction. A. Short Report. J. Braz. Chem. Soc. 2021, 32, 1680–1686. [Google Scholar]
  50. Curi, N.; Da Motta, P.E.F.; Fabris, J.D.; De Oliveira, L.C.A. Espectroscopia Mössbauer Na Caracterização de Compostos Ferrosos Em Solos e Sua Relação Com Retenção de Fósforo. Quim. Nova 2008, 31, 1467–1471. [Google Scholar] [CrossRef]
  51. Shan, A.; Idrees, A.; Zaman, W.Q.; Abbas, Z.; Ali, M.; Rehman, M.S.U.; Hussain, S.; Danish, M.; Gu, X.; Lyu, S. Synthesis of NZVI-Ni@BC Composite as a Stable Catalyst to Activate Persulfate: Trichloroethylene Degradation and Insight Mechanism. J. Environ. Chem. Eng. 2021, 9, 104808. [Google Scholar] [CrossRef]
  52. Li, F.; Zimmerman, A.R.; Hu, X.; Yu, Z.; Huang, J.; Gao, B. One-Pot Synthesis and Characterization of Engineered Hydrochar by Hydrothermal Carbonization of Biomass with ZnCl2. Chemosphere 2020, 254, 126866. [Google Scholar] [CrossRef]
  53. Sangami, S.; Manu, B. Synthesis of Green Iron Nanoparticles Using Laterite and Their Application as a Fenton-like Catalyst for the Degradation of Herbicide Ametryn in Water. Environ. Technol. Innov. 2017, 8, 150–163. [Google Scholar] [CrossRef]
  54. Mechakra, H.; Sehili, T.; Kribeche, M.A.; Ayachi, A.A.; Rossignol, S.; George, C. Use of Natural Iron Oxide as Heterogeneous Catalyst in Photo-Fenton-like Oxidation of Chlorophenylurea Herbicide in Aqueous Solution: Reaction Monitoring and Degradation Pathways. J. Photochem. Photobiol. A Chem. 2016, 317, 140–150. [Google Scholar] [CrossRef]
  55. Ruipérez, F.; Mujika, J.I.; Ugalde, J.M.; Exley, C.; Lopez, X. Pro-Oxidant Activity of Aluminum: Promoting the Fenton Reaction by Reducing Fe(III) to Fe(II). J. Inorg. Biochem. 2012, 117, 118–123. [Google Scholar] [CrossRef] [PubMed]
  56. Orrico, A.C.A.; Orrico Junior, M.A.P.; De Lucas Junior, J.; Fernandes, R.A.M.; Sunada, S.; Rodrigues, J.P. Revista Agrarian. Rev. Agrar. 2011, 4, 222–227. [Google Scholar]
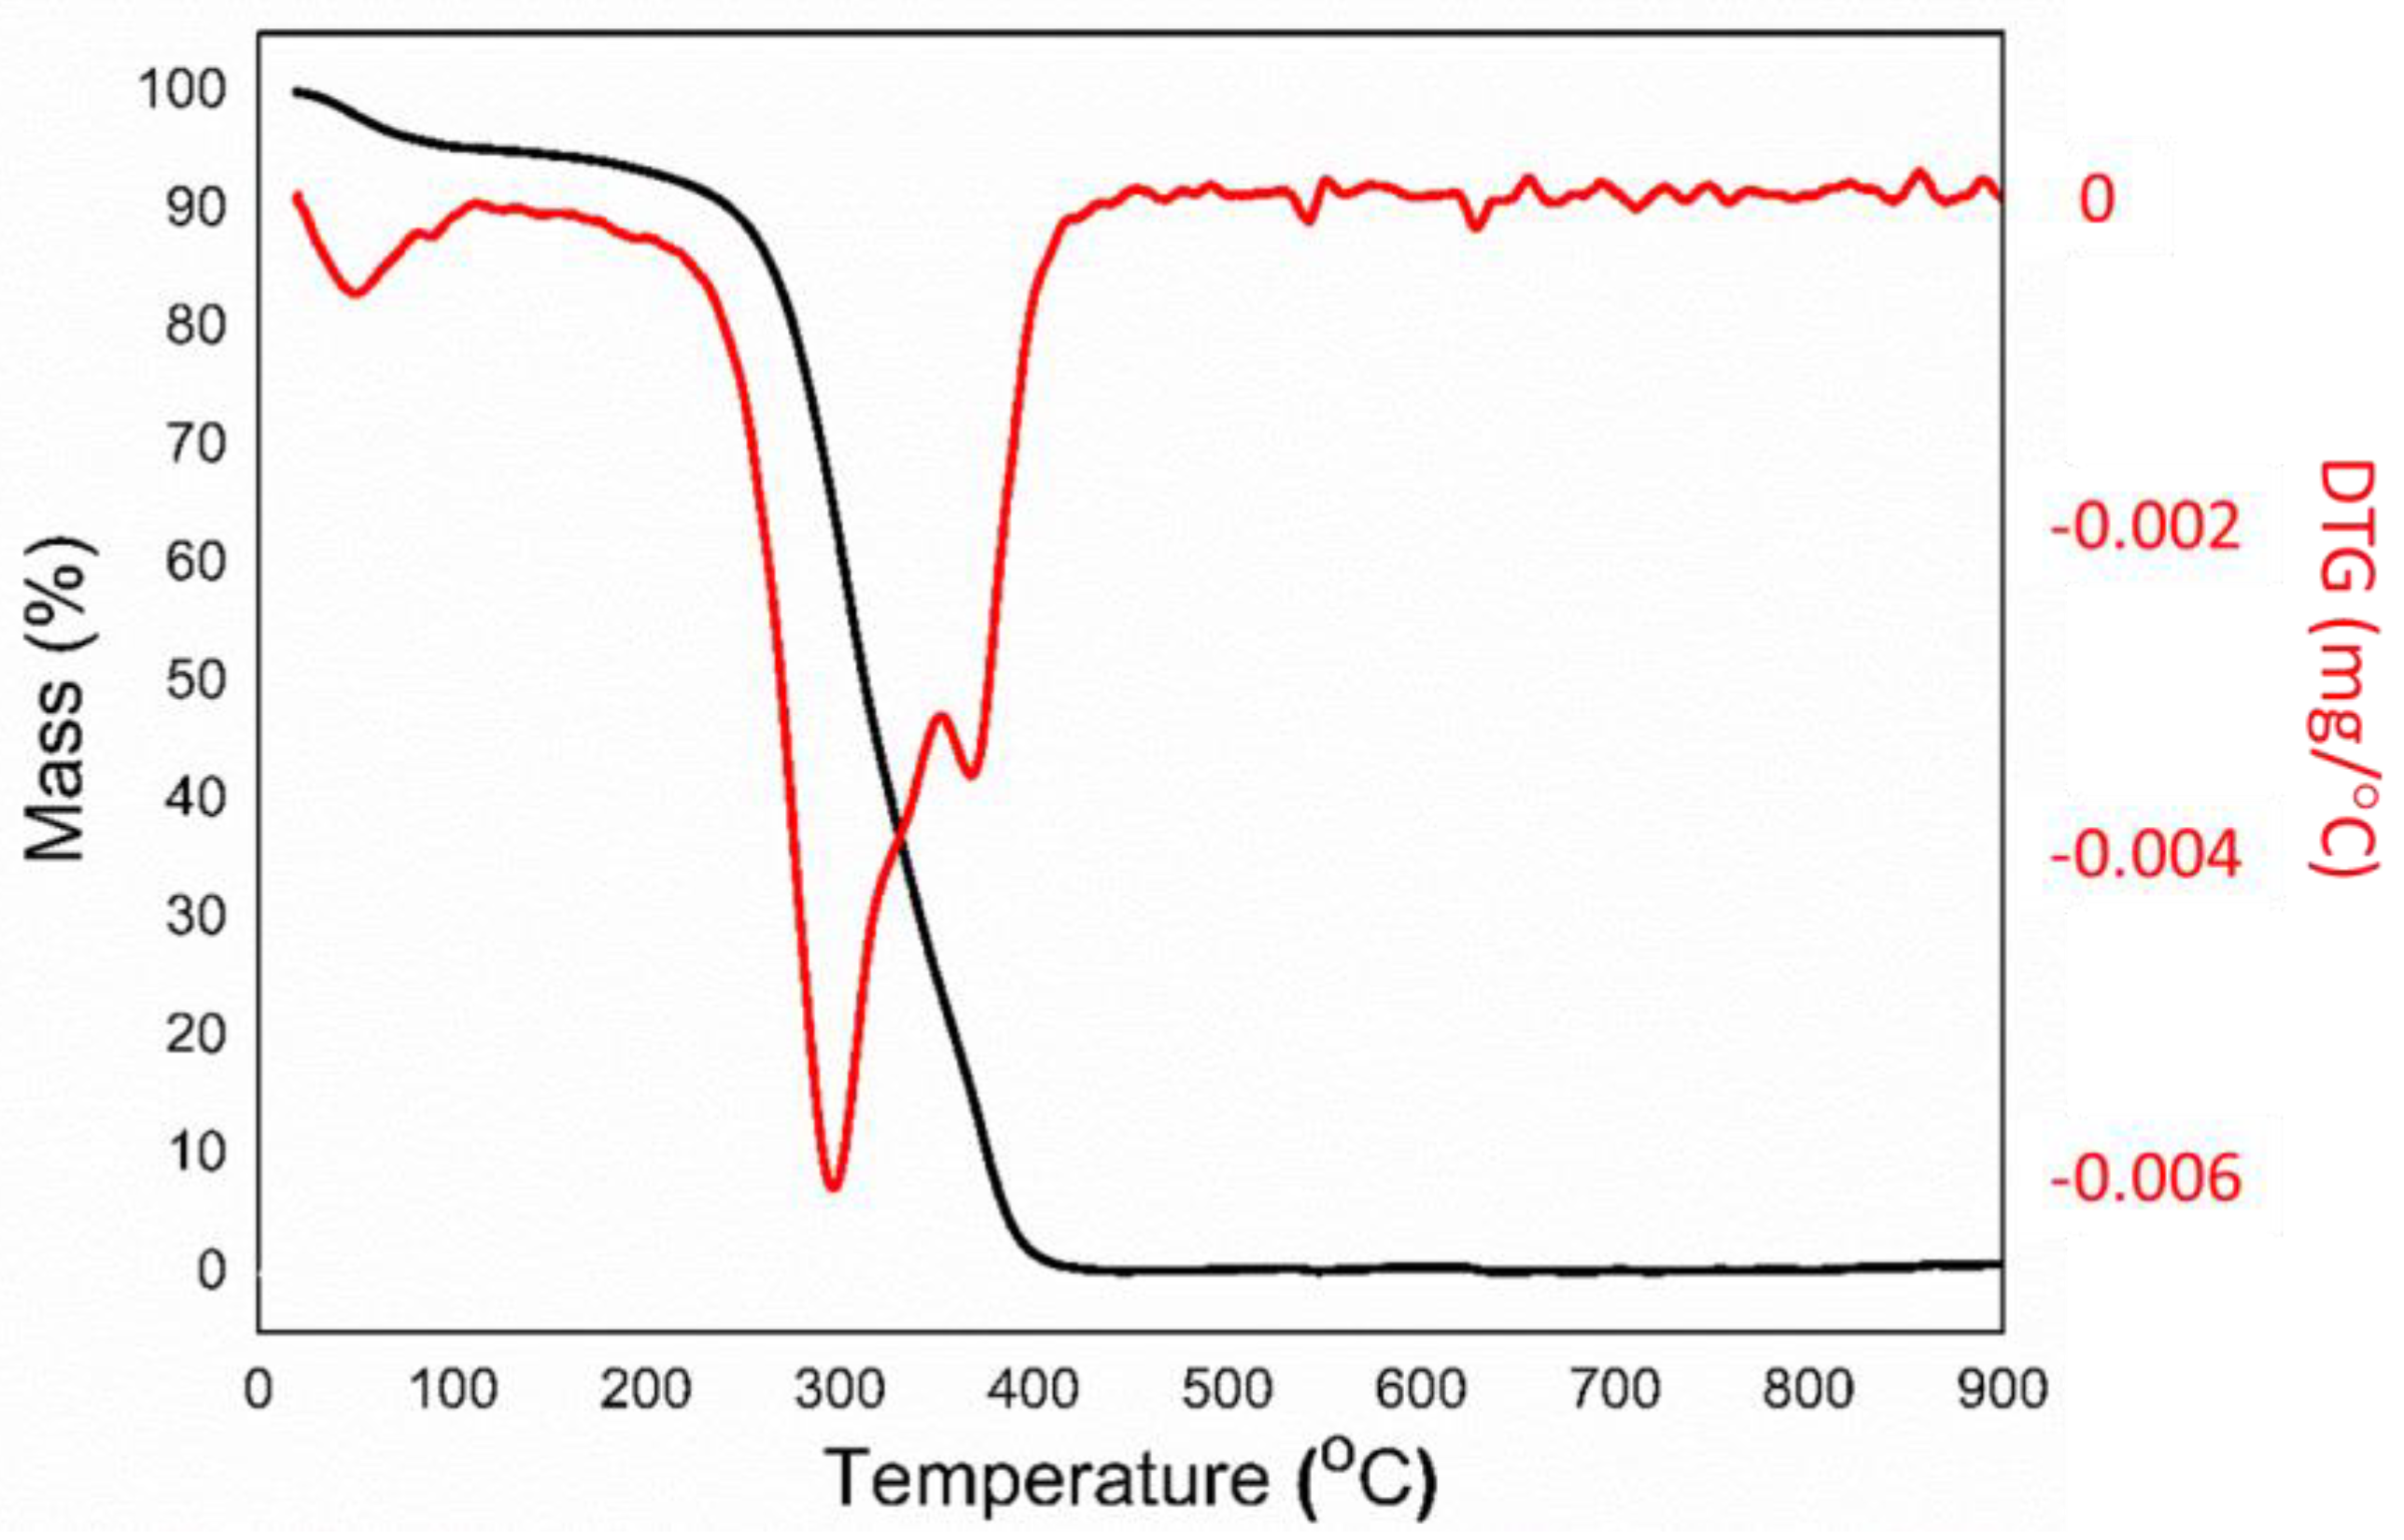
Figure 1. TGA and DTG curves of Hy-Fe produced via hydrothermal synthesis (HTC).
Processes 11 03244 g001
Figure 2. FTIR spectra of Hy-Fe produced via hydrothermal synthesis (HTC).
Processes 11 03244 g002
Figure 3. X-ray diffractograms of Hy-Fe produced via hydrothermal synthesis (HTC).
Processes 11 03244 g003
Figure 4. Raman spectra of Hy-Fe produced via hydrothermal synthesis (HTC).
Processes 11 03244 g004
Figure 5. (A) Scanning Electron Microscopy (SEM) and (B) Transmission Electron Microscopy (MET) image obtained for Hy-Fe produced via hydrothermal synthesis (HTC).
Processes 11 03244 g005
Figure 6. Mössbauer spectra at room temperature (~298 K) of the Hy-Fe material produced via hydrothermal synthesis (HTC). (The black line refers to the 57Co standard).
Processes 11 03244 g006
Figure 7. Comparison of dicamba degradation by biochar produced by pyrolysis (Py-Fe) and hydrochar (Hy-Fe) produced by hydrothermal synthesis (HTC). Experimental conditions: 100.00 mL dicamba solution 50.00 mg L−1; 0.20 g of material; 1.00 mL of H2O2 1.00 mmol L−1, 1.00 mL of aluminum sulfate solution (Al2(SO4)3) to 1.00 mol L−1; 25 °C; constant agitation.
Processes 11 03244 g007
Figure 8. Evaluation of the initial concentration of dicamba in the degradation process. Experimental conditions: 100.00 mL of dicamba solution; 0.20 g of hydrochar; 1.00 mL of H2O2 1.00 mmol L−1, 1.00 mL of aluminum sulfate solution (Al2(SO4)3) at 1 mol L−1; 25 °C; constant agitation.
Processes 11 03244 g008
Figure 9. Evaluation of the variation in the agitation of the system during the degradation process. Experimental conditions: 100.00 mL of dicamba solution 50.00 mg L−1; 0.20 g of Hy-Fe; 1.00 mL of H2O2 1.00 mmol L−1, 1.00 mL of aluminum sulfate solution (Al2(SO4)3) of 1.00 mol L−1; 25 °C.
Processes 11 03244 g009
Figure 10. Evaluation of the reuse of Hy-Fe in different degradation cycles. Experimental conditions: 100.00 mL of dicamba solution (50.00 mg L−1); 0.20 g of Hy-Fe; 1.00 mL of H2O2 1.00 mmol L−1, 1.00 mL of aluminum sulfate solution (Al2(SO4)3) of 1.00 mol L−1; 25 °C.
Processes 11 03244 g010
Figure 11. Apparent intoxication at 21 DAA (A) control solution (water), (B) commercial dicamba 1.00 mg L−1, (C) commercial dicamba 5.00 mg L−1, (D) commercial dicamba 10.00 mg L−1, (E) commercial dicamba 50.00 mg L−1, (F) water, (G) commercial dicamba 1.00 mg L−1 degraded, (H) commercial dicamba 5.00 mg L−1 degraded, (I) commercial dicamba 10.00 mg L−1 degraded, and (J) commercial dicamba 50.00 mg L−1 degraded.
Processes 11 03244 g011
Figure 12. Intoxication scores for the 7, 14 e 21 DAA.
Processes 11 03244 g012
Table 1. Treatments performed for biological application.
TreatmentsApplication
T1H2O
T2[dicamba]0 1.00 mg L−1
T3[dicamba]0 5.00 mg L−1
T4[dicamba]0 10.00 mg L−1
T5[dicamba]0 50.00 mg L−1
T6Solution of [dicamba]0 1.00 mg L−1 degraded* using 0.20 g Hy-Fe
T7Solution of [dicamba]0 5.00 mg L−1 degraded* using 0.20 g Hy-Fe
T8Solution of [dicamba]0 10.00 mg L−1 degraded* using 0.20 g Hy-Fe
T9Solution of [dicamba]0 50.00 mg L−1 degraded* using 0.20 g Hy-Fe
T10Solution of [dicamba]0 50.00 mg L−1 degraded* using 0.20 g Hy-Fe, subjected to periodic stirring
T11Solution of [dicamba]0 50.00 mg L−1 degraded* using 0.20 g Hy-Fe, for system at rest
T12Solution of [dicamba]0 50.00 mg L−1 degraded* using 0.60 g Hy-Fe
T13Solution of [dicamba]0 50.00 mg L−1 degraded* using 1.00 g Hy-Fe
* Reactional conditions: 500.00 mL dicamba solution; 1.00 mL H2O2 1.00 mmol L−1; 1.00 mL aluminum sulfate solution (Al2(SO4)3) 1.00 mol−1; 25 °C.
Table 2. Elementary analysis of Hy-Fe produced via hydrothermal synthesis *.
SampleElementary Analysis, %
CHNS
Hy-Fe52.30 ± 0.305.20 ± 0.091.49 ± 0.050.24 ± 0.01
* To produce Hy-Fe, 5.00 g of coffee husk were added in an autoclave, together with iron solution, and heated at 200 °C for 4 h, with a heating ramp of 10 °C min−1.
Table 3. Comparative of dry matter of the aerial part of the plants the different treatments, at 21 days after application.
TreatmentDescriptionDMAS ****
T1H2O2.62a
T2[dicamba]0 1.00 mg L−12.47a
T3[dicamba]0 5.00 mg L−12.23b
T4[dicamba]0 10.00 mg L−12.08c
T5[dicamba]0 50.00 mg L−11.79d
T6Solution of [dicamba]0 1.00 mg L−1 degraded** using 0.20 g Hy-Fe2.53a
T7Solution of [dicamba]0 5.00 mg L−1 degraded** using 0.20 g Hy-Fe2.53a
T8Solution of [dicamba]0 10.00 mg L−1 degraded** using 0.20 g Hy-Fe2.59a
T9Solution of [dicamba]0 50.00 mg L−1 degraded** using 0.20 g Hy-Fe2.59a
T10Solution of [dicamba]0 50.00 mg L−1 degraded** using 0.20 g Hy-Fe, periodic stirring2.52a
T11Solution of [dicamba]0 50.00 mg L−1 degraded** using 0.20 g Hy-Fe, for system at rest2.61a
T12Solution of [dicamba]0 50.00 mg L−1 degraded** using 0.60 g Hy-Fe2.56a
T13Solution of [dicamba]0 50.00 mg L−1 degraded** using 1.00 g Hy-Fe2.50a
* DMAS: Dry matter of the aerial part of the plants. ** Reactional conditions: 500.00 mL dicamba solution; 1.00 mL H2O2 1.00 mmol L−1; 1.00 mL aluminum sulfate solution (Al2(SO4)3) 1.00 mol−1; 25 °C. *** Tukey test (lowercase letters are the comparison of means).
Disclaimer/Publisher’s Note: The statements, opinions and data contained in all publications are solely those of the individual author(s) and contributor(s) and not of MDPI and/or the editor(s). MDPI and/or the editor(s) disclaim responsibility for any injury to people or property resulting from any ideas, methods, instructions or products referred to in the content.