Article

Flow Potential Analysis-Based Gas Channeling Control for Enhanced Artificial Gas Cap Drive in Fractured-Vuggy Reservoirs

1
School of Petroleum Engineering, Yangtze University, Wuhan 430100, China
2
Hubei Key Laboratory of Oil and Gas Drilling and Production Engineering, Yangtze University, Wuhan 430100, China
3
School of Petroleum Engineering, National Engineering Research Center for Oil & Gas Drilling and Completion Technology, Yangtze University, Wuhan 430100, China
*
Authors to whom correspondence should be addressed.
Processes 2023, 11(12), 3301; https://doi.org/10.3390/pr11123301
Submission received: 28 October 2023 / Revised: 21 November 2023 / Accepted: 24 November 2023 / Published: 26 November 2023
(This article belongs to the Topic Enhanced Oil Recovery Technologies, 2nd Volume)

Abstract

:
Fractured-vuggy reservoirs are known for containing substantial amounts of oil in high positions of reservoir, even after natural energy development and water injection development. However, due to their poor physical properties and fracture distribution, gas channeling becomes a common occurrence when injecting large amounts of gas, which hinders the formation of an effective gas cap, resulting in reduced oil displacement efficiency. This phenomenon results in a lengthy period of effective gas cap formation and reduces the oil displacement efficiency of an artificial gas cap. In this paper, according to the actual geological characteristics, logging data, and production data, the mechanism model and the numerical model of Oilfield A are established. The variation law of flow potential difference before and after gas injection channeling is studied by simulation, and the control method of artificial gas cap gas channeling in fractured-vuggy reservoir is put forward. The results show that the production gas–oil ratio method is the most convenient and practical in the oil field, and the flow potential difference can effectively predict the occurrence of gas channeling. It likely occurs when the ratio of flow potential difference between injection and production wells is less than 0.972. Gas channeling can be controlled effectively by altering the energy of position and pressure, as well as body measures including injection–production well pattern adjustment, injection–production parameter optimization. This technology provides a new approach for controlling gas channeling through gas cap drive in fractured-vuggy reservoirs. After the implementation of this technology, the effect is obvious, and can effectively improve the efficiency of gas top oil displacement and save costs. This gas channeling control technology is of great significance for the development of fractured-vuggy reservoirs.

1. Introduction

Carbonate reservoirs account for 47.5% [1] of the remaining global oil and gas reserves. Fractured-vuggy reservoirs account for more than 30% of carbonate reservoirs [2]. In western China, carbonate fractured-vuggy reservoirs are also one of the most important sites for oil and gas extraction, with promising prospects. A fractured-vuggy reservoir is controlled jointly by paleogeomorphology, structure, and karstification; the matrix storage and permeability conditions are poor, and the reservoir types are diverse, consisting primarily of karst fractured-vuggy assemblages of various types and scales, with complex and highly discrete distribution. Their heterogeneity is extremely strong [3,4,5,6].
Fractured-vuggy reservoirs typically have fractured-vuggy units as the development and management objective, and the basic well pattern is based on fractured-vuggy units [7,8] according to the principle of “cave-by-cave well distribution and cave-by-cave development”. A fractured-vuggy unit can be an isolated cave (Figure 1) or composed of a fractured and vuggy group (Figure 2).
The fractured-vuggy units comprised of single-fractured-vuggy bodies are often separated from other fractured-vuggy bodies and are not connected; however, in the fractured-vuggy units comprised of fractured-vuggy groups, numerous karst caves are interconnected by complex fracture networks. With a unified pressure system and oil–water relationship, this reservoir can be considered independent, constituting its own oil-water system [9,10].
Fractured-vuggy reservoirs are typically exploited initially with natural energy, and artificial water injection and gas injection after high water cuts are adopted after natural energy depletion [11,12]. In the process of exploitation, fracturing is usually used to improve the connectivity between injection and production wells [13]. However, issues such as water injection failure and low gas drive efficiency gradually emerge in the middle and late stages of development. There is a great deal of unused “attic oil” [14].
In order to improve the production degree of remaining oil and further improve oil and gas recovery, many oilfields carried out a series of studies on artificial gas top drive in the field, such as nitrogen injection for oil replacement, nitrogen-assisted gravity flooding, gas cap flooding, and so on [15,16,17,18,19]. Artificial gas top drive is mainly used to inject a large amount of gas into the formation from the top to form a secondary gas cap to effectively drive the remaining oil in the high position [20]. The main driving forces are gravity differentiation and gas expansion energy.
It can be seen in Figure 3a that crude oil and water flow upwards before gas injection. After gas injection (Figure 3b), the difference in gas and liquid density causes the gas to push the crude oil downward, and the gas cap replaces the residual oil at a high position [21]. As shown in Figure 4a, after the formation of the gas cap, it will continue to expand under the formation conditions, which can increase the elastic expansion energy of the formation and push the oil–gas interface downward to change the flow direction of crude oil. As can be seen in Figure 4b, the gas cap can also replace the remaining oil in the higher position to the lower position of the perforated layer [22,23]. When the oil displacement mode changes from natural depletion development or bottom water injection to gas cap flooding, the crude oil in formation moves downwards, and the oil–water interface decreases accordingly, which is beneficial to production-well improvement [24]. Compared to other top gas injection flooding, the expansion of the gas cap can significantly alter the flow direction of crude oil fluid. In addition, domestic and international experimental research on N2 injection into fractured-vuggy reservoirs demonstrates that N2 has low surface tension and high diffusivity. N2 dissolved in crude oil can reduce interfacial tension and crude oil viscosity, improve formation crude oil-flow performance, and increase oil-displacement efficiency [25,26]. Therefore, artificial gas top drive can also utilize pressure differences and a high gas diffusion ability to activate weak channels, utilize remaining oil from non dominant channels between wells, and extensively displace any remaining oil in small pores.
The research findings indicate that artificial gas top flooding can significantly improve the status of fractured-vuggy reservoirs with high water cuts and difficult-to-use “attic oil” between wells. Due to the poor reservoir conditions; complex fracture distribution; and large gravity and viscosity differences between oil, gas, and water, injected gas is susceptible to escape [12,27,28], affecting the remaining oil’s production effect. It also results in a rise in the cost of gas injection for artificial gas top drives. In order to improve oil recovery in fractured-vuggy reservoirs, the ability to properly discriminate gas channeling and adopt prompt actions for regulation and control has become the crucial link in artificial gas cap flooding.
After the development stages of natural energy development, artificial water flooding, and artificial gas flooding, the remaining oil in Oilfield A is concentrated in the high position of the residual mound and interwell in the well area in the middle of the block, rendering water and gas flooding ineffective. Therefore, the human gas top drive technology experiment was carried out in the field. However, a more serious gas channeling phenomenon was found in the process of implementing gas top drive [29].
Currently, there is no approved standard for determining gas channeling in fractured-vuggy reservoirs, which is often determined by the study object’s properties and the changing law of recovery degree. Using a combination of the production gas–oil ratio method, the gas channeling coefficient method, the dissolved gas method, and the three-stage approach, the features of gas channeling are determined [30]. The gas channeling coefficient method requires constant calculation of the gas holdup and transverse axis area of production wells, which is impractical in the field; the dissolved gas method is primarily used for miscible flooding; and the three-stage method is inappropriate for oilfields with complex formation conditions. Therefore, the gas channeling discrimination method is the suitable production gas–oil ratio method for the fractured-vuggy reservoir’s artificial gas top drive in Oilfield A. The method uses production gas–oil ratio to analyze gas channeling using the variation characteristics of the production gas–oil ratio. Under the immiscible state, the output gas–oil ratio rises slowly before gas channeling and abruptly after gas channeling, and the recovery rate slows. Compared to the field production data of a single well following N2 injection in Oilfield A, the production gas-to-oil ratio grows gradually before gas channeling and abruptly after gas channeling, whereas the daily oil production of a single well decreases. Statistics demonstrate that gas channeling occurs when the gas–oil ratio after gas injection is greater than three times the starting value; therefore, this value can be used as a criterion for gas channeling in oil field A.
In order to address the issue in which gas channeling is prone to occur in fractured-vuggy reservoirs, a simple, cost-effective method for controlling gas channeling is urgently required. The fluid potential energy, also known as the flow potential, is the determining factor that determines the fluid flow direction within a formation. The fluid in the formation always flows from the high potential area to the low potential area in the direction where potential energy declines the fastest [31]. In the process of reservoir development, the water cone, water channeling, and gas channeling are all the result of an imbalance of fluid flow potential in the reservoir; therefore, the relationship between oil, gas, and water can be modified, and gas channeling can be alleviated by adjusting the flow potential. Combined with changes in the characteristics of flow potential during gas channeling, this paper studies the regulation and control of artificial gas top drives in fractured-vuggy reservoirs.

2. Methods

Based on the composition of flow potential in a fractured-vuggy reservoir, the formula for the difference in flow potential between injection and production wells is deduced. The mechanism model of fractured-vuggy single injection–production well group was established, the change in flow potential during gas channeling was obtained by simulation and calculation, and the change law of flow potential before and after gas channeling was analyzed, combined with the principle of flow potential and the actual situation in the field. Therefore, a flow potential control technology suitable for artificial gas cap gas channeling control in fractured-vuggy reservoirs is formed.

2.1. Theory

Flow potential refers to the total mechanical energy of a unit mass of fluid in reservoir development. It is composed of potential energy, pressure energy, kinetic energy, and interfacial energy and is influenced by gravity, buoyancy, pressure, inertia force, viscosity force, and capillary pressure. According to the definition of England volume potential [32], the potential energy per unit volume of fluid can be expressed as:
Φ = ρ g z + ρ 0 P d P ρ ( P ) + 1 2 ρ ν 2 + 2 σ cos θ r
In the formula, Φ is the flow potential. Z is the distance of the measuring point from the datum, positive up, negative down. P is the pressure of the measuring point.
The flow potential of a fractured-vuggy reservoir is mainly composed of potential energy, pressure energy, and kinetic energy [33]. When the height of the oil column is small, and the crude oil compression coefficient is small, the density of crude oil and formation water in the reservoir does not vary much with pressure; that is, pressure ρ(p) = p, so the pressure energy is equal to the pressure p. Therefore, the flow potential in fractured-vuggy reservoirs can be characterized as follows:
Φ = Z 0 Z ρ g d z + P 0 P d P + 1 2 ρ ν 2
The flow potential difference between any An and B points in the reservoir is as follows:
Φ = Φ A Φ B = ρ g z A z B + P A P B + 1 2 ρ ( v A 2 v B 2 )
The fractured-vuggy reservoir type is mainly composed of large-scale karst caves and high-angle fractures, and the fluid is dominated by pipe flow. Even if the infiltration velocity is as high as 300 m/d, its kinetic energy is only in the order of 1 × 10⁻⁴ MPa. Therefore, in the fractured-vuggy reservoir, the effect of the change in kinetic energy on the flow potential is minimal, and the flow potential is primarily influenced by the change in energy of position and energy of pressure [34].
If only the influence of energy of position and energy of pressure on the flow potential are considered, then the flow potential difference between any A and B points in the reservoir should be:
Φ = Φ A Φ B = ρ g z A z B + P A P B
The well group in the model is used to simulate an artificial gas cap to drive oil. W1 is a gas injection well, and W2 and W3 are production wells. At this time, the flow potential difference between Well W1 and Well W2 is as follows:
Φ 12 = ρ G g z 1 ρ O g z 2 + P 1 P 2
The flow potential difference between Well W1 and Well W3 is as follows:
Φ 13 = ρ G g z 1 ρ O g z 3 + P 1 P 3
The flow potential difference between Well W1 and Well W3 is as follows:
Φ 12 Φ 13 = ρ O g ( z 3 z 2 ) + P 3 P 2
The ratio of flow potential difference between the injection well W1 and production well W2 and W3 is as follows:
Φ 12 Φ 13 = ρ G g z 1 ρ O g z 2 + P 1 P 2 ρ G g z 1 ρ O g z 3 + P 1 P 3
In Equations (5)–(8), Φ 12 is the fluid potential difference between Well W1 and Well W2, while Φ 13 is the flow potential difference between Well W1 and Well W3. Z 1 ,   Z 2 ,   Z 3 are the distances of wells W1, W2, and W3 relative to the base plane are positive upward, negative downward. P is the measuring point pressure.

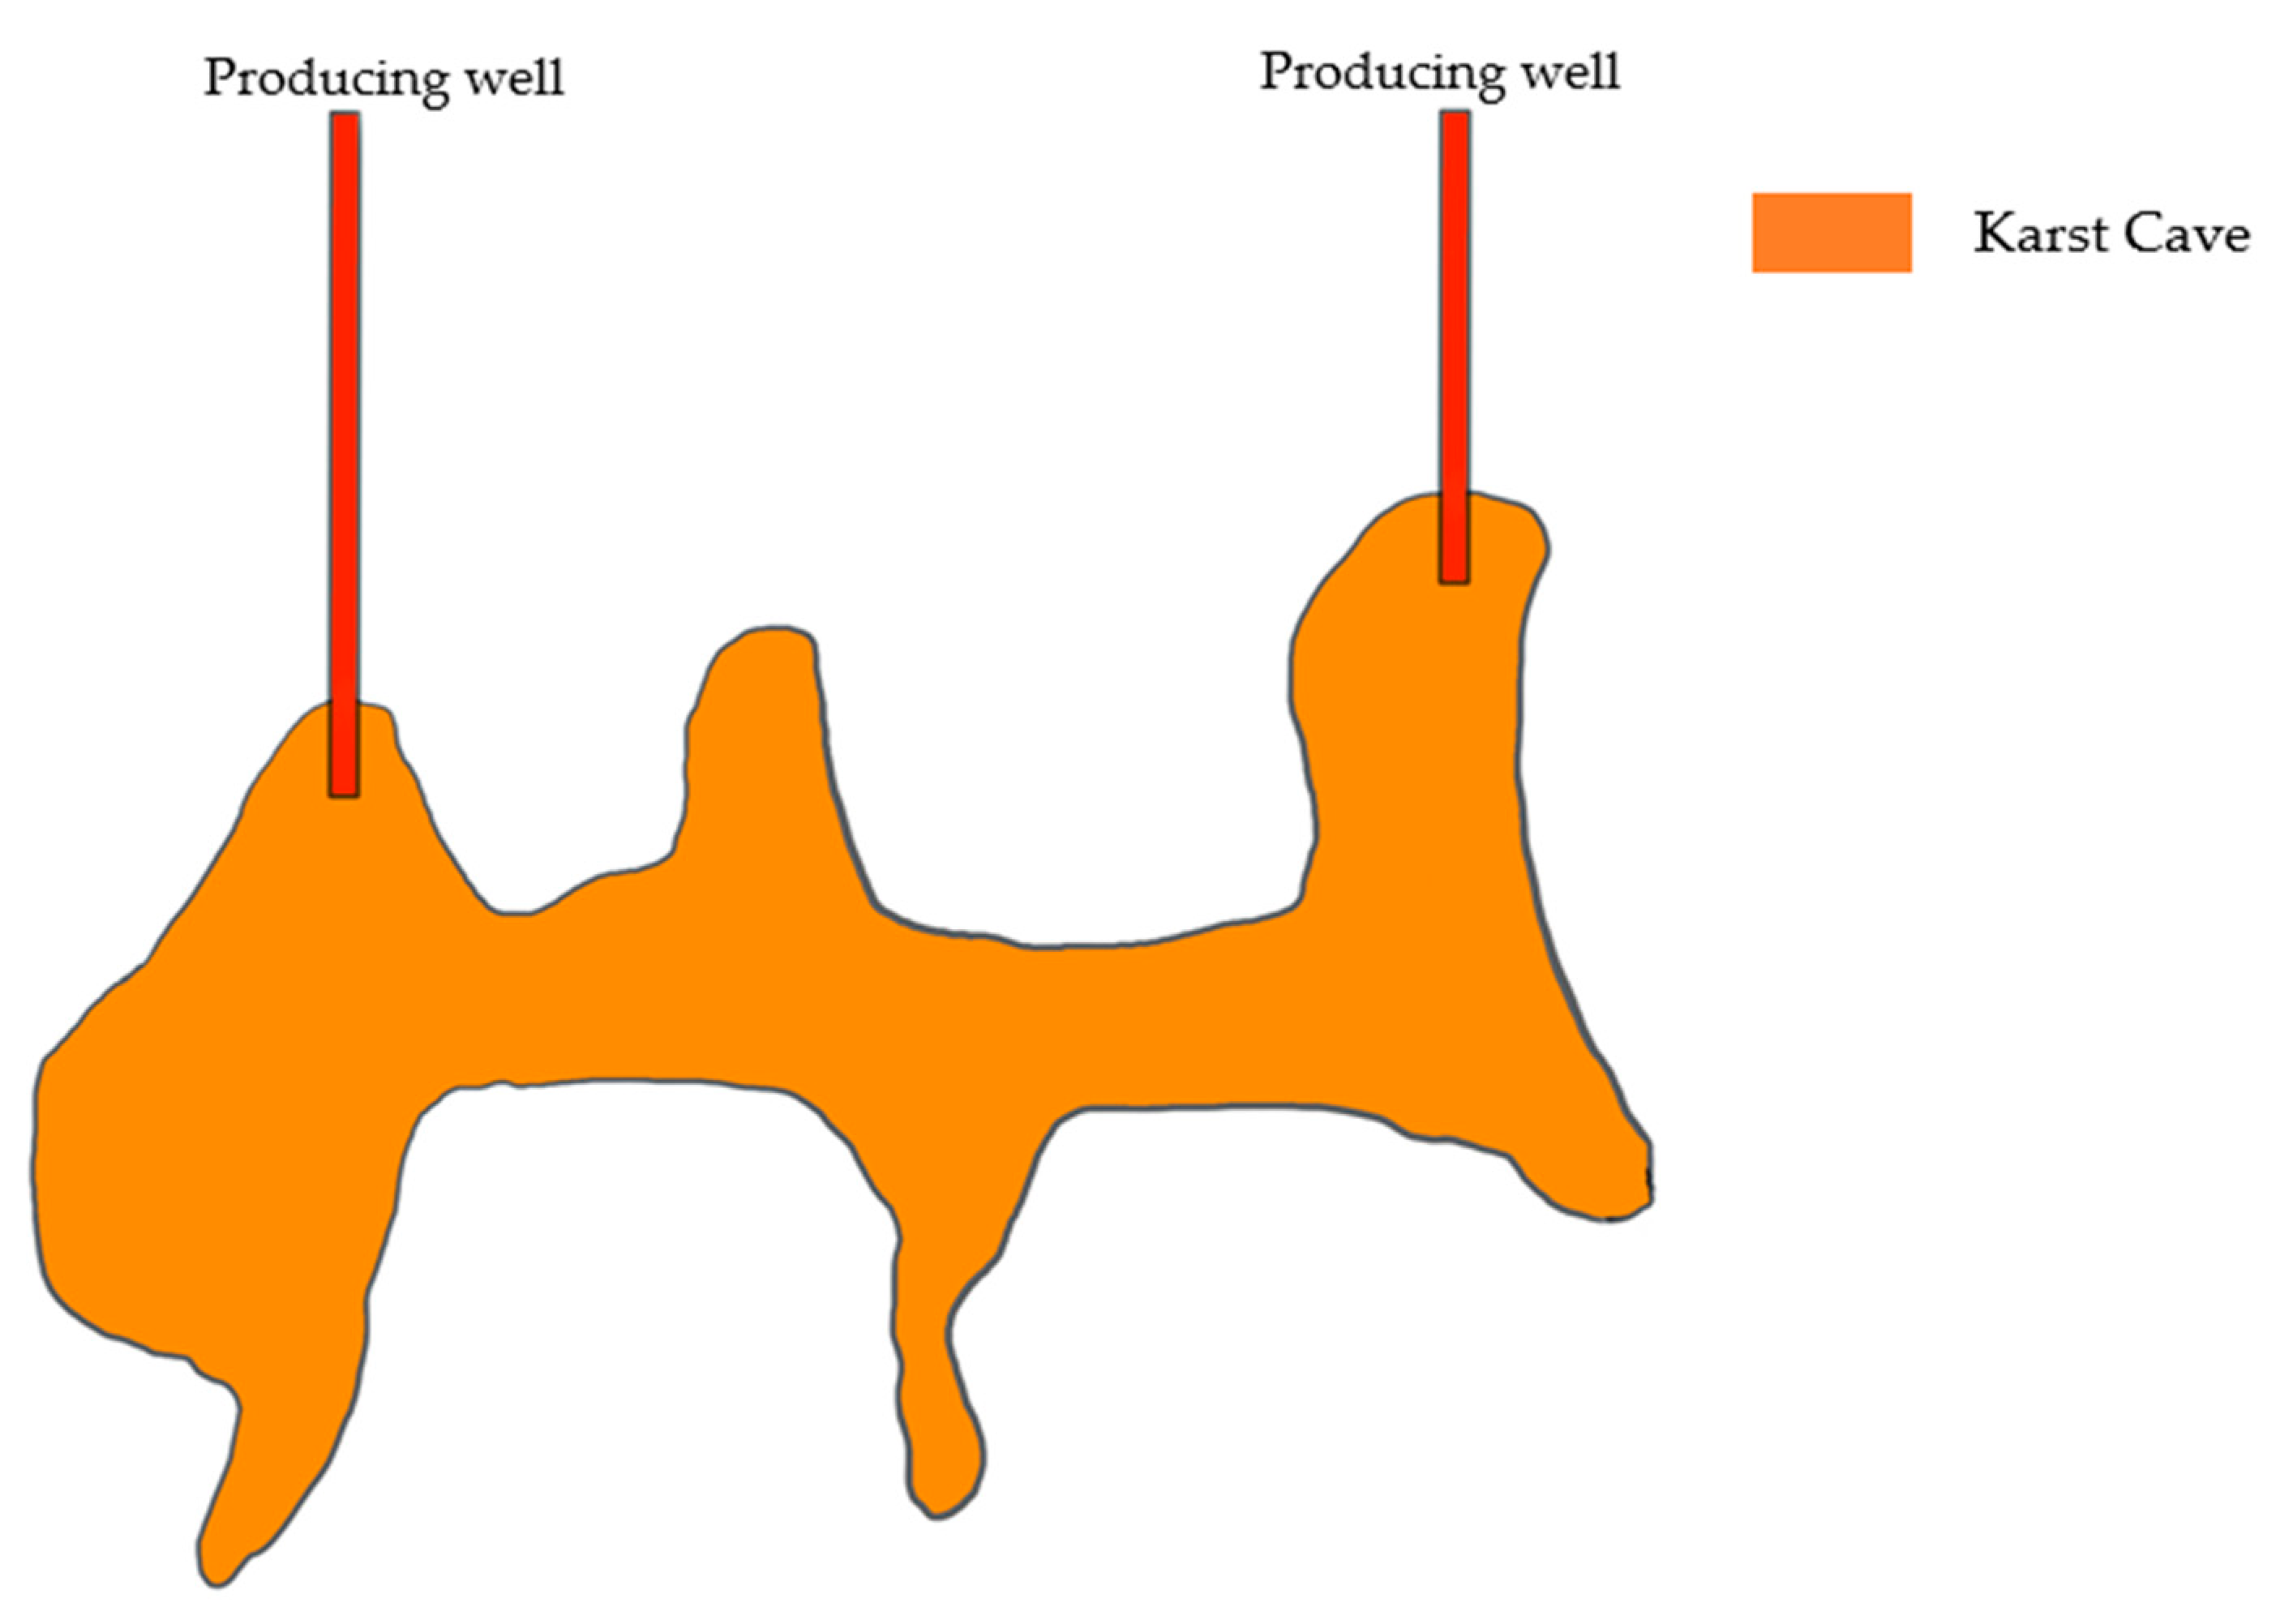
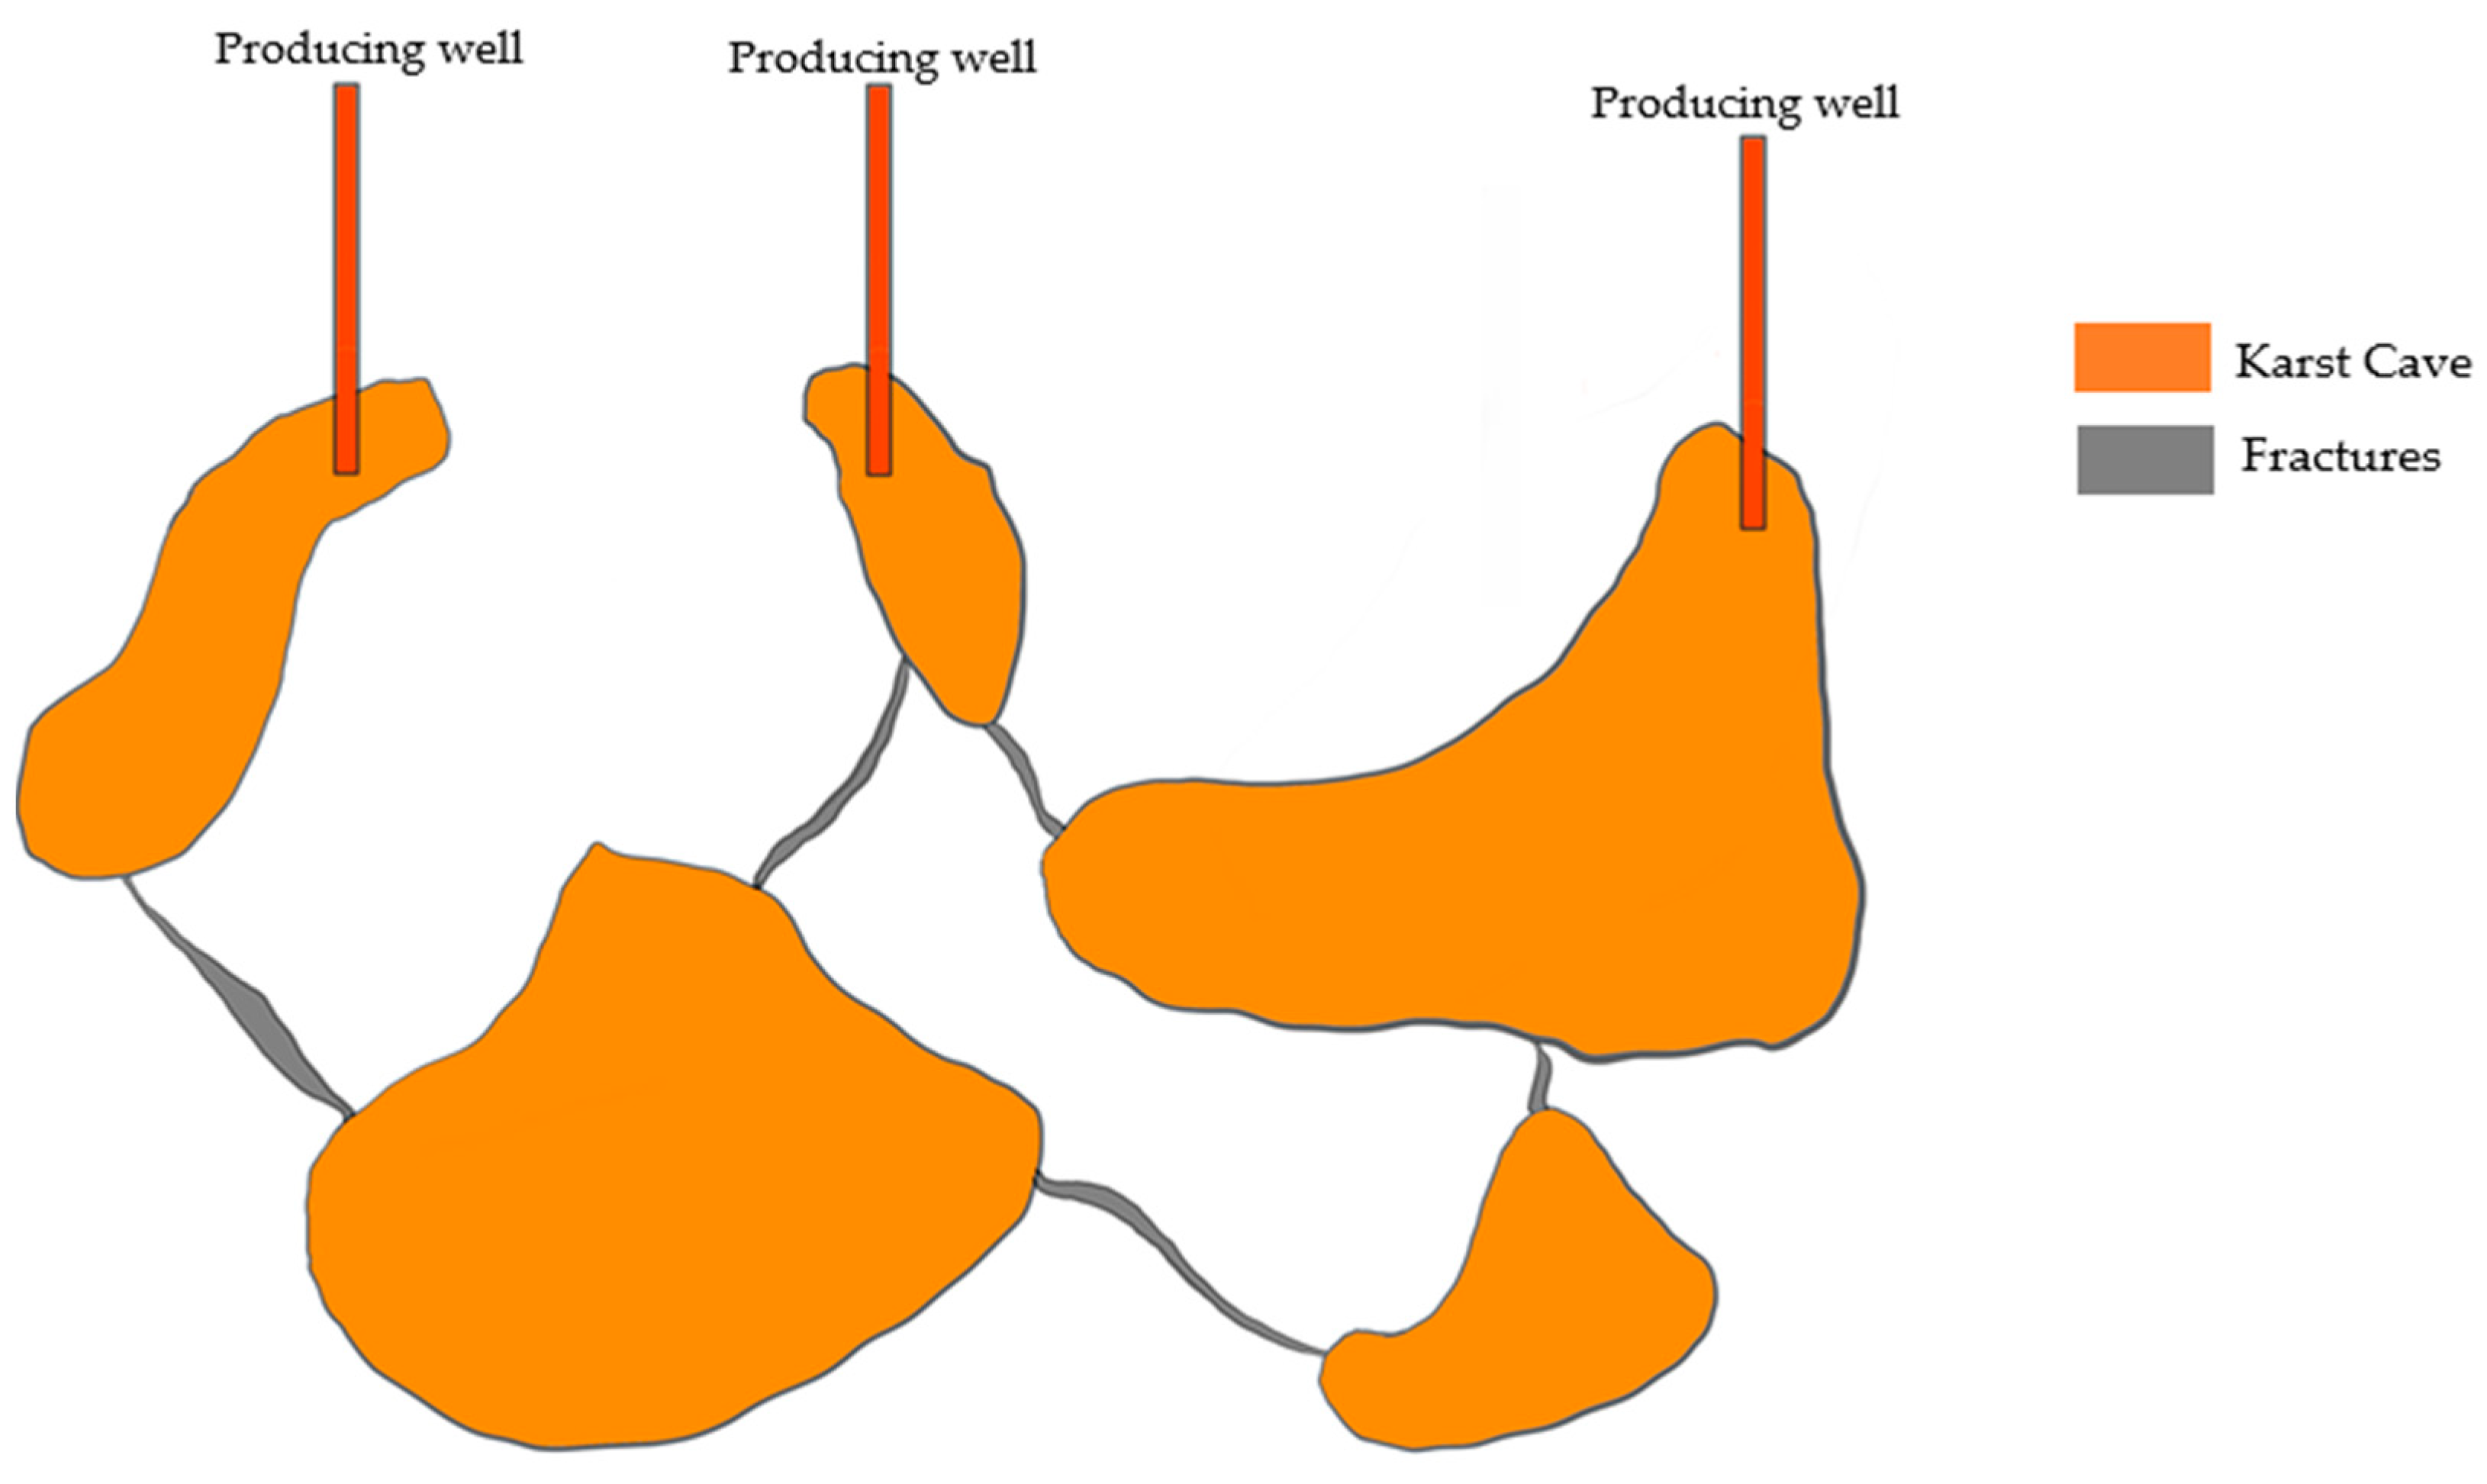
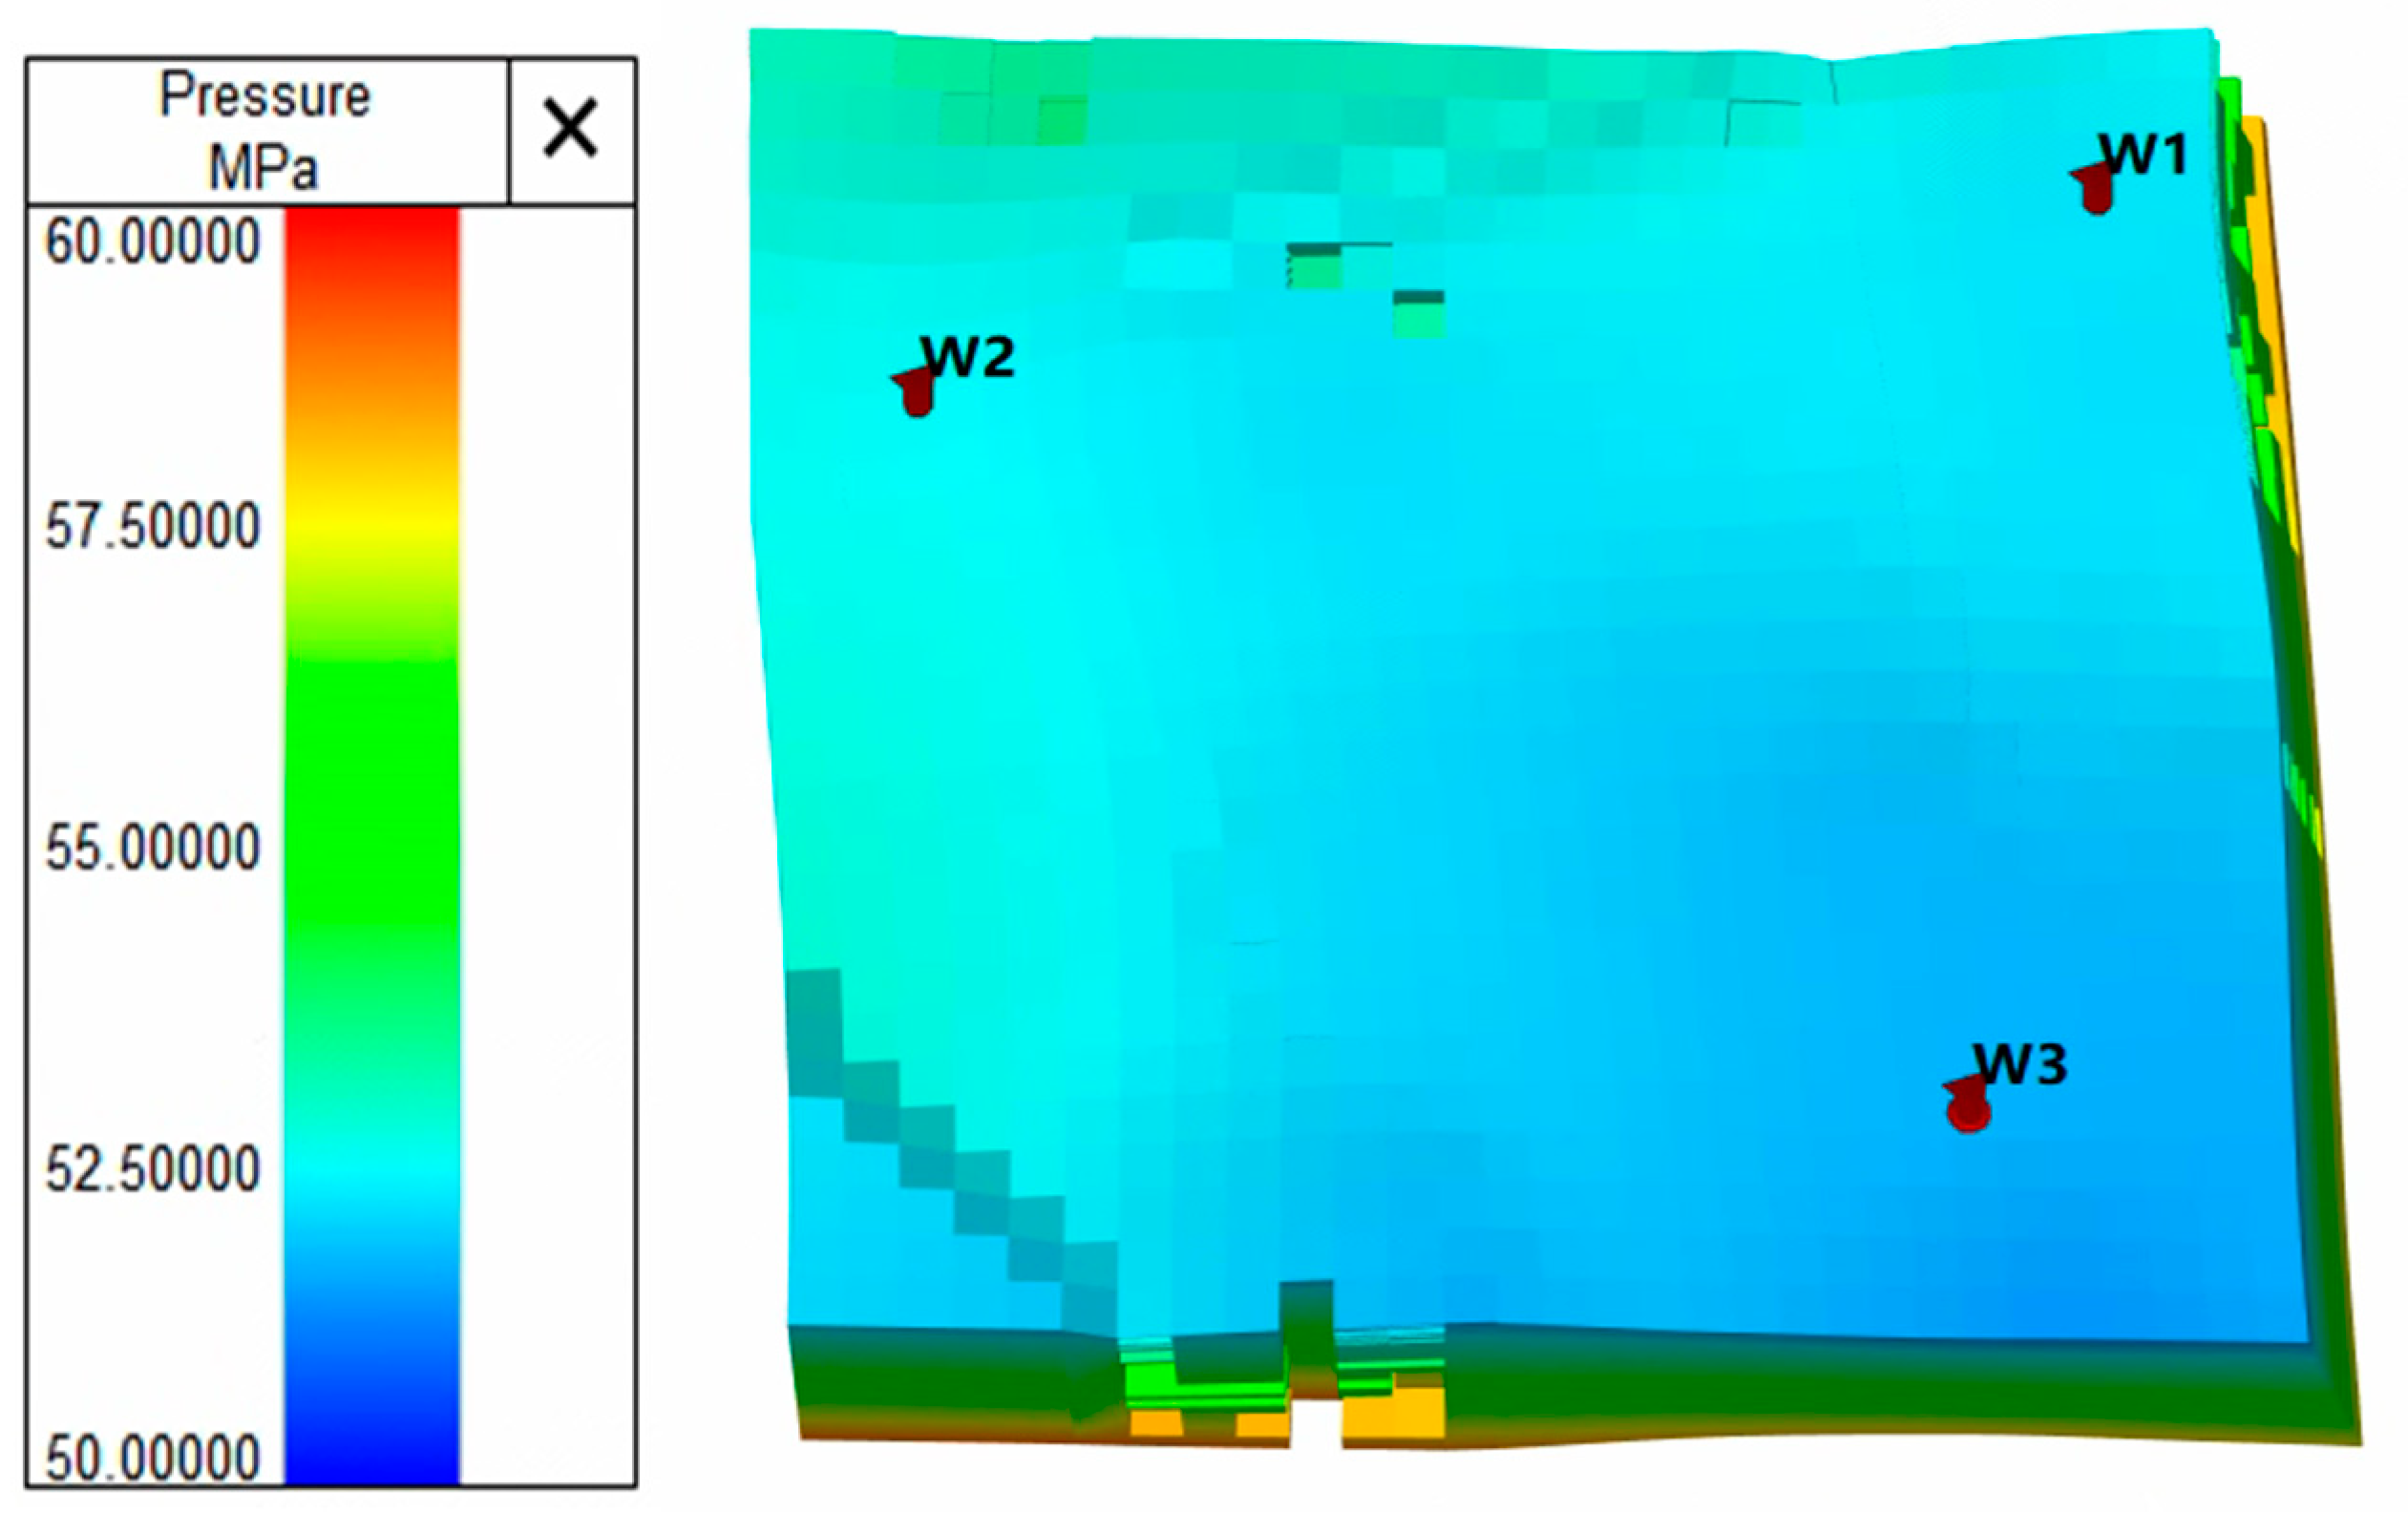
2.2. Establishment of Mechanism Model

According to the characteristics of fractured-vuggy reservoir in Oilfield A, a mechanism model was established. The single grid step was 30 m × 30 m × 3 m, the depth of the reservoir was 4600 m, and the formation pressure was 56 MPa (Figure 5). The model contained two smaller caves and one larger cave. The filling degree was unfilled, in which the grid number of the small cave was 3 × 3 × 20, the size was 90 m × 90 m × 60 m; the grid number of the large cave was 5 × 6 × 23, and the size was 150 m × 180 m × 69 m. A crack channel existed between the two small caves and the large caves (Figure 6). The initial porosity of the karst cave was 0.2, matrix porosity was 0.01, fracture permeability is 1000 mD, and matrix permeability is 0.01 mD (Figure 7). There were three wells W1, W2, and W3 in the model, with W1 drilling encountering larger karst caves and W2 and W3 drilling encountering two smaller karst caves, respectively.

2.3. Simulation of Gas Channeling Flow Potential in Fractured-Vuggy Reservoir

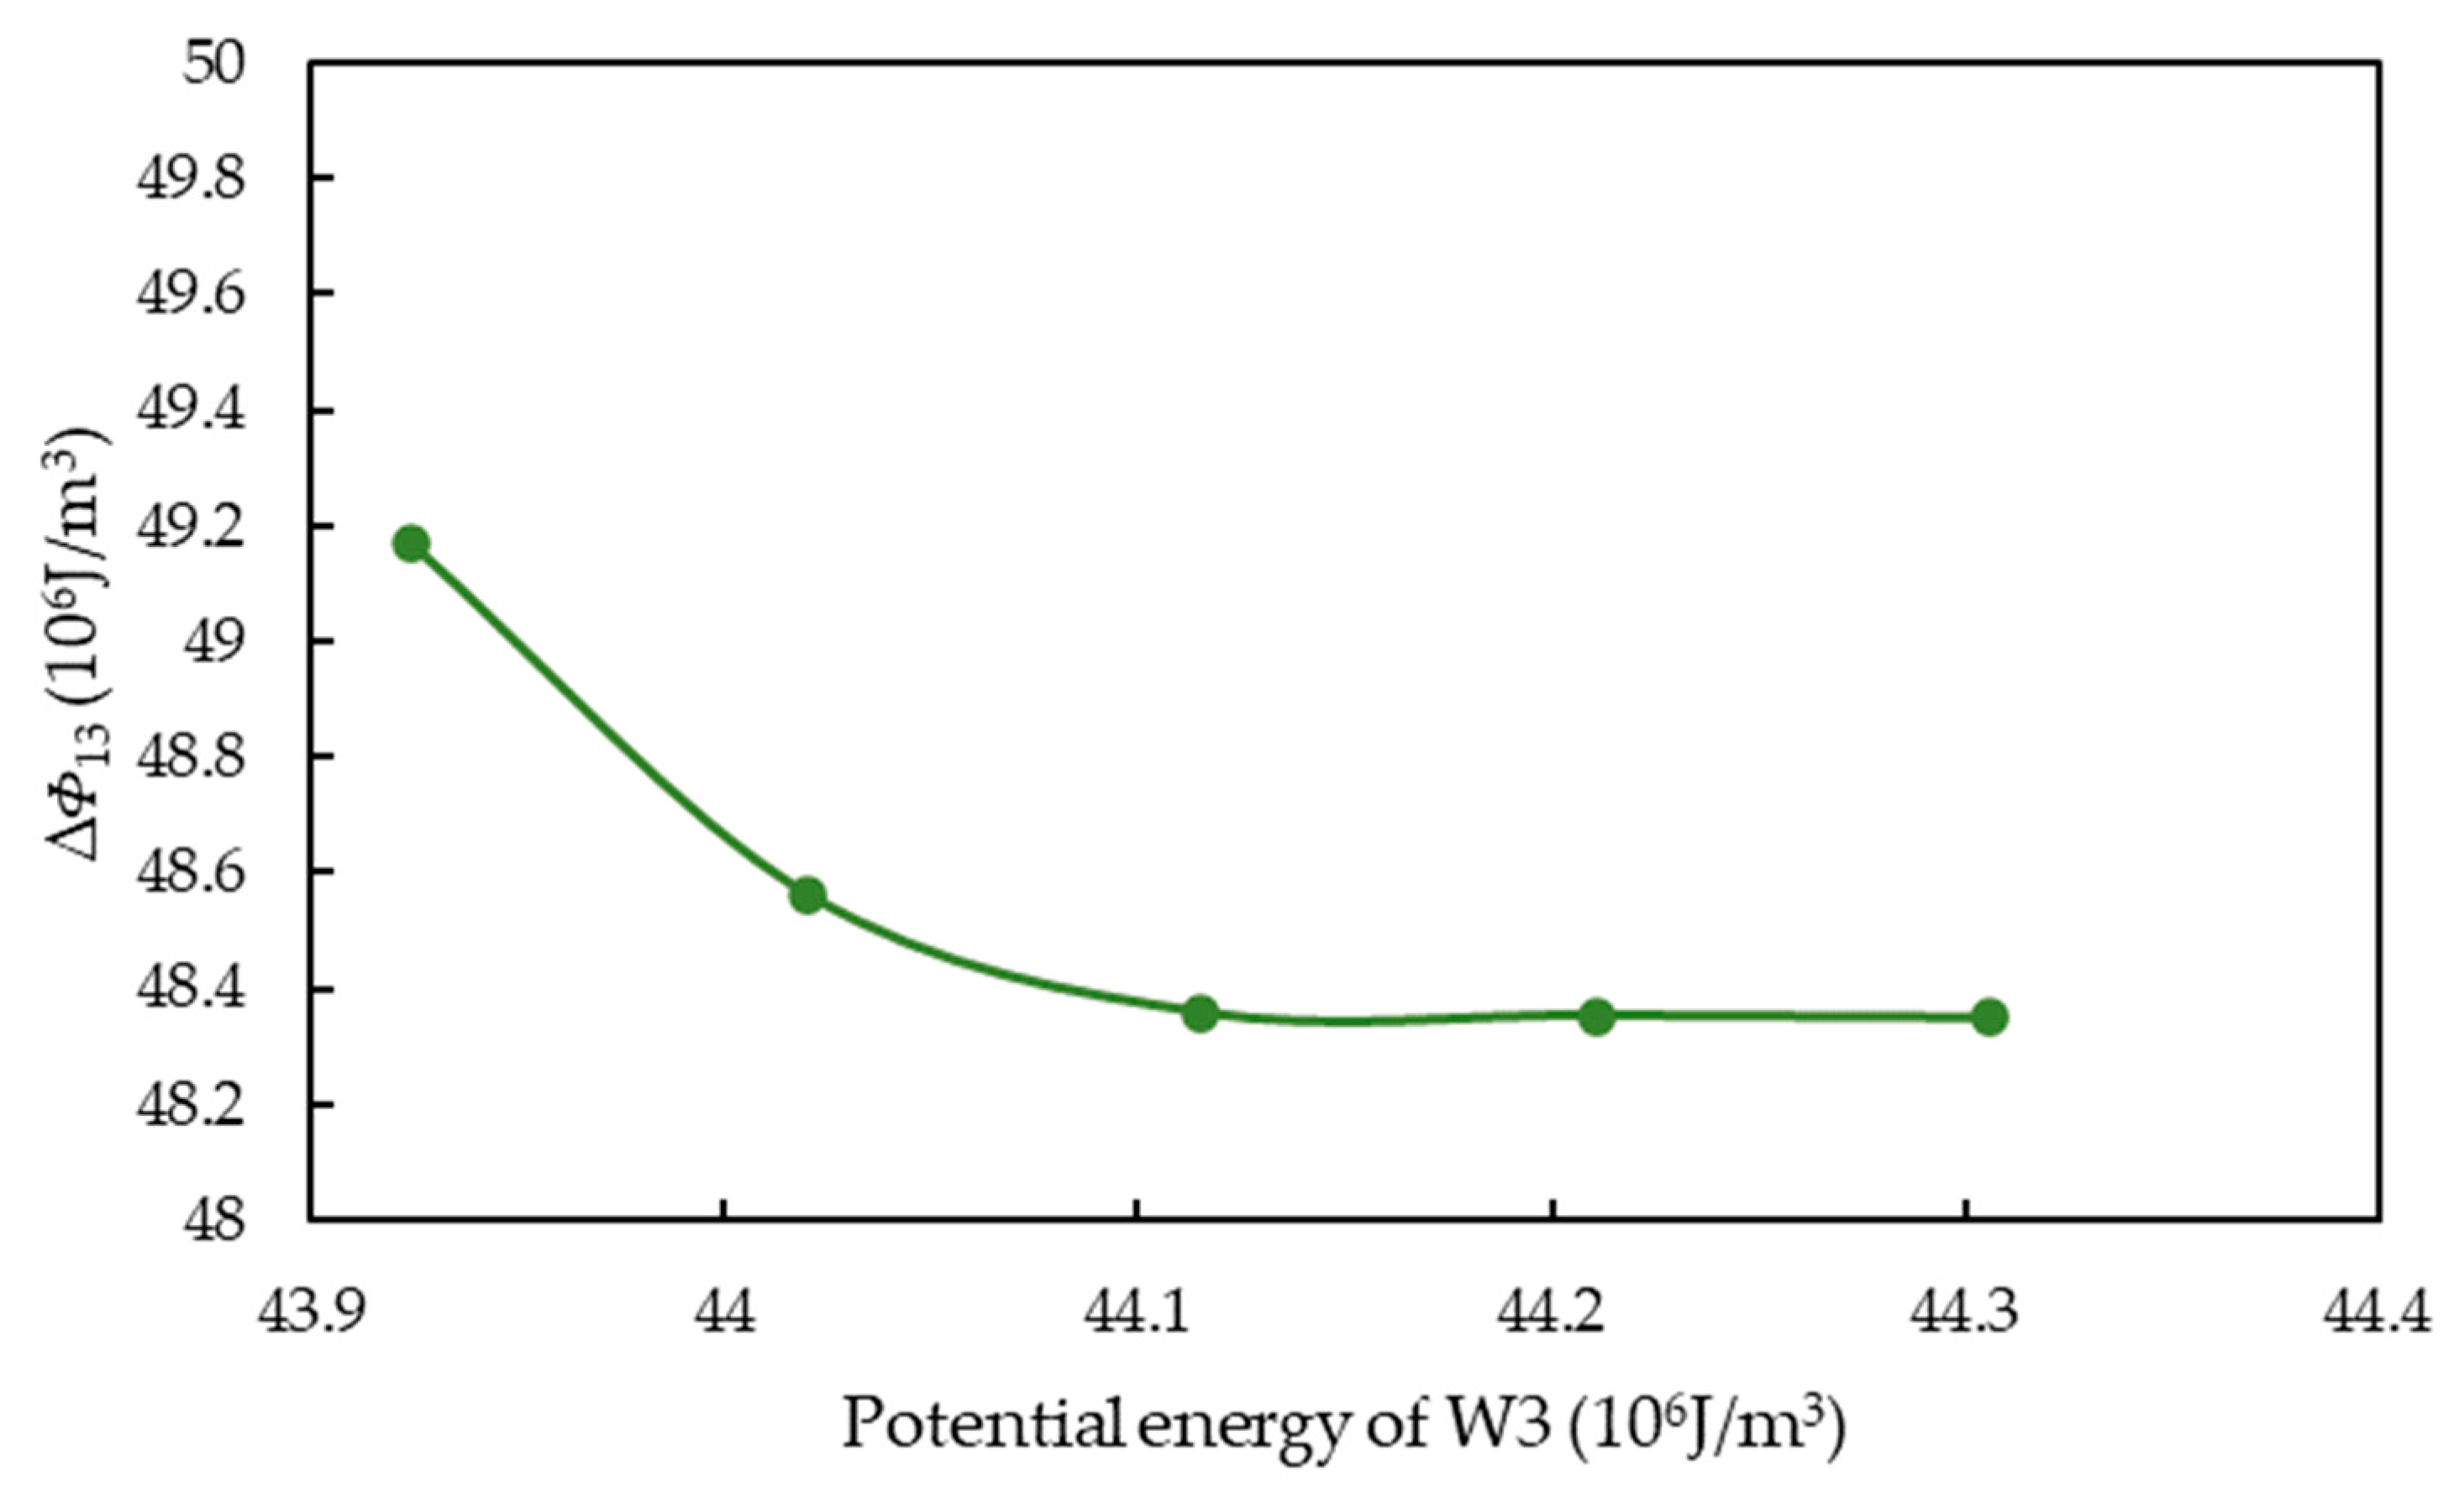
2.3.1. Variation Law of Flow Potential Difference under Different Energy of Position and Energy of Pressure

The distance between W3 and datum were −4587.6 m, −4597.6 m, −4607.6 m, −4617.6 m and −4627.6 m, respectively, to simulate the change in flow potential difference between Well W1 and Well W3 under different potential energy. W3 daily fluid production was set as as 20 m3/d, 40 m3/d, 60 m3/d, 80 m3/d, and 100 m3/d to simulate the change in flow potential difference between Well W1 and Well W3 under different pressure energies. Changes in energy of position and energy of pressure were used to investigate the effect of various factors on the change law of flow potential.

2.3.2. Simulation of Gas Channeling under Different Flow Potential Difference Ratios between Injection and Production Wells

The flow potential and flow potential differences were changed by changing the energy of position and energy of pressure to explore the gas channeling situation of Well W3 under different flow potential differences. The gas channeling of Well W3 under different ratios of flow potential difference between injection and production wells was observed.

2.4. Numerical Simulation of Gas Channeling Control in Oilfield A

A numerical model was established according to the actual geological characteristics, logging data and production data. The single grid step was 20 m × 20 m × 2 m, the depth of the reservoir was 4600 m, and the formation pressure was 56 MPa. The porosity of the cave with poor filling degree was about 0.2–0.3, while that of the cave with higher filling degree was 0.1–0.15 (Figure 8).
Simulating the gas channeling during the implementation of gas cap drive in Oilfield A, we used tNavigator to explore the direction of gas flow in the ground. We calculated the flow potential between injection and production wells by changing the flow potential to regulate gas channeling, and so the effect of flow potential regulation technology on gas top drive gas channeling control in fractured-vuggy reservoirs was obtained.

3. Simulation Results

3.1. Law of Gas Channeling Flow Potential in the Fractured-Vuggy Reservoir

3.1.1. Variation Law of Flow Potential Difference under Different Potential Energy

It can be seen from Figure 9 and Figure 10 that the potential energy positively correlates with the distance between Well W3 and the datum. The greater the distance between Well W3 and the datum, the greater the potential energy. The flow potential difference between Well W1 and Well W3 Φ 13 decreased with the increase in Well W3 site energy and tended to be stable when Well W3 site energy was higher than 44.12 × 10⁶ J/m3.
When Z3 was closer to Z1, the height difference between injection and production wells was smaller, and the flow potential difference was smaller. When the distance from Well W3 to the datum changed, the bottom hole pressure of W3 also changed, the pressure energy increased with the increase in the distance from Well W3 to the datum, and the value of pressure energy difference P 1 P 3 ” between Well W1 and Well W3 decreased, thus affecting the change in flow potential difference. It can be seen that the adjustment of potential energy can alter the flow potential difference, but the change in potential energy convection potential difference is limited by the pressure change.

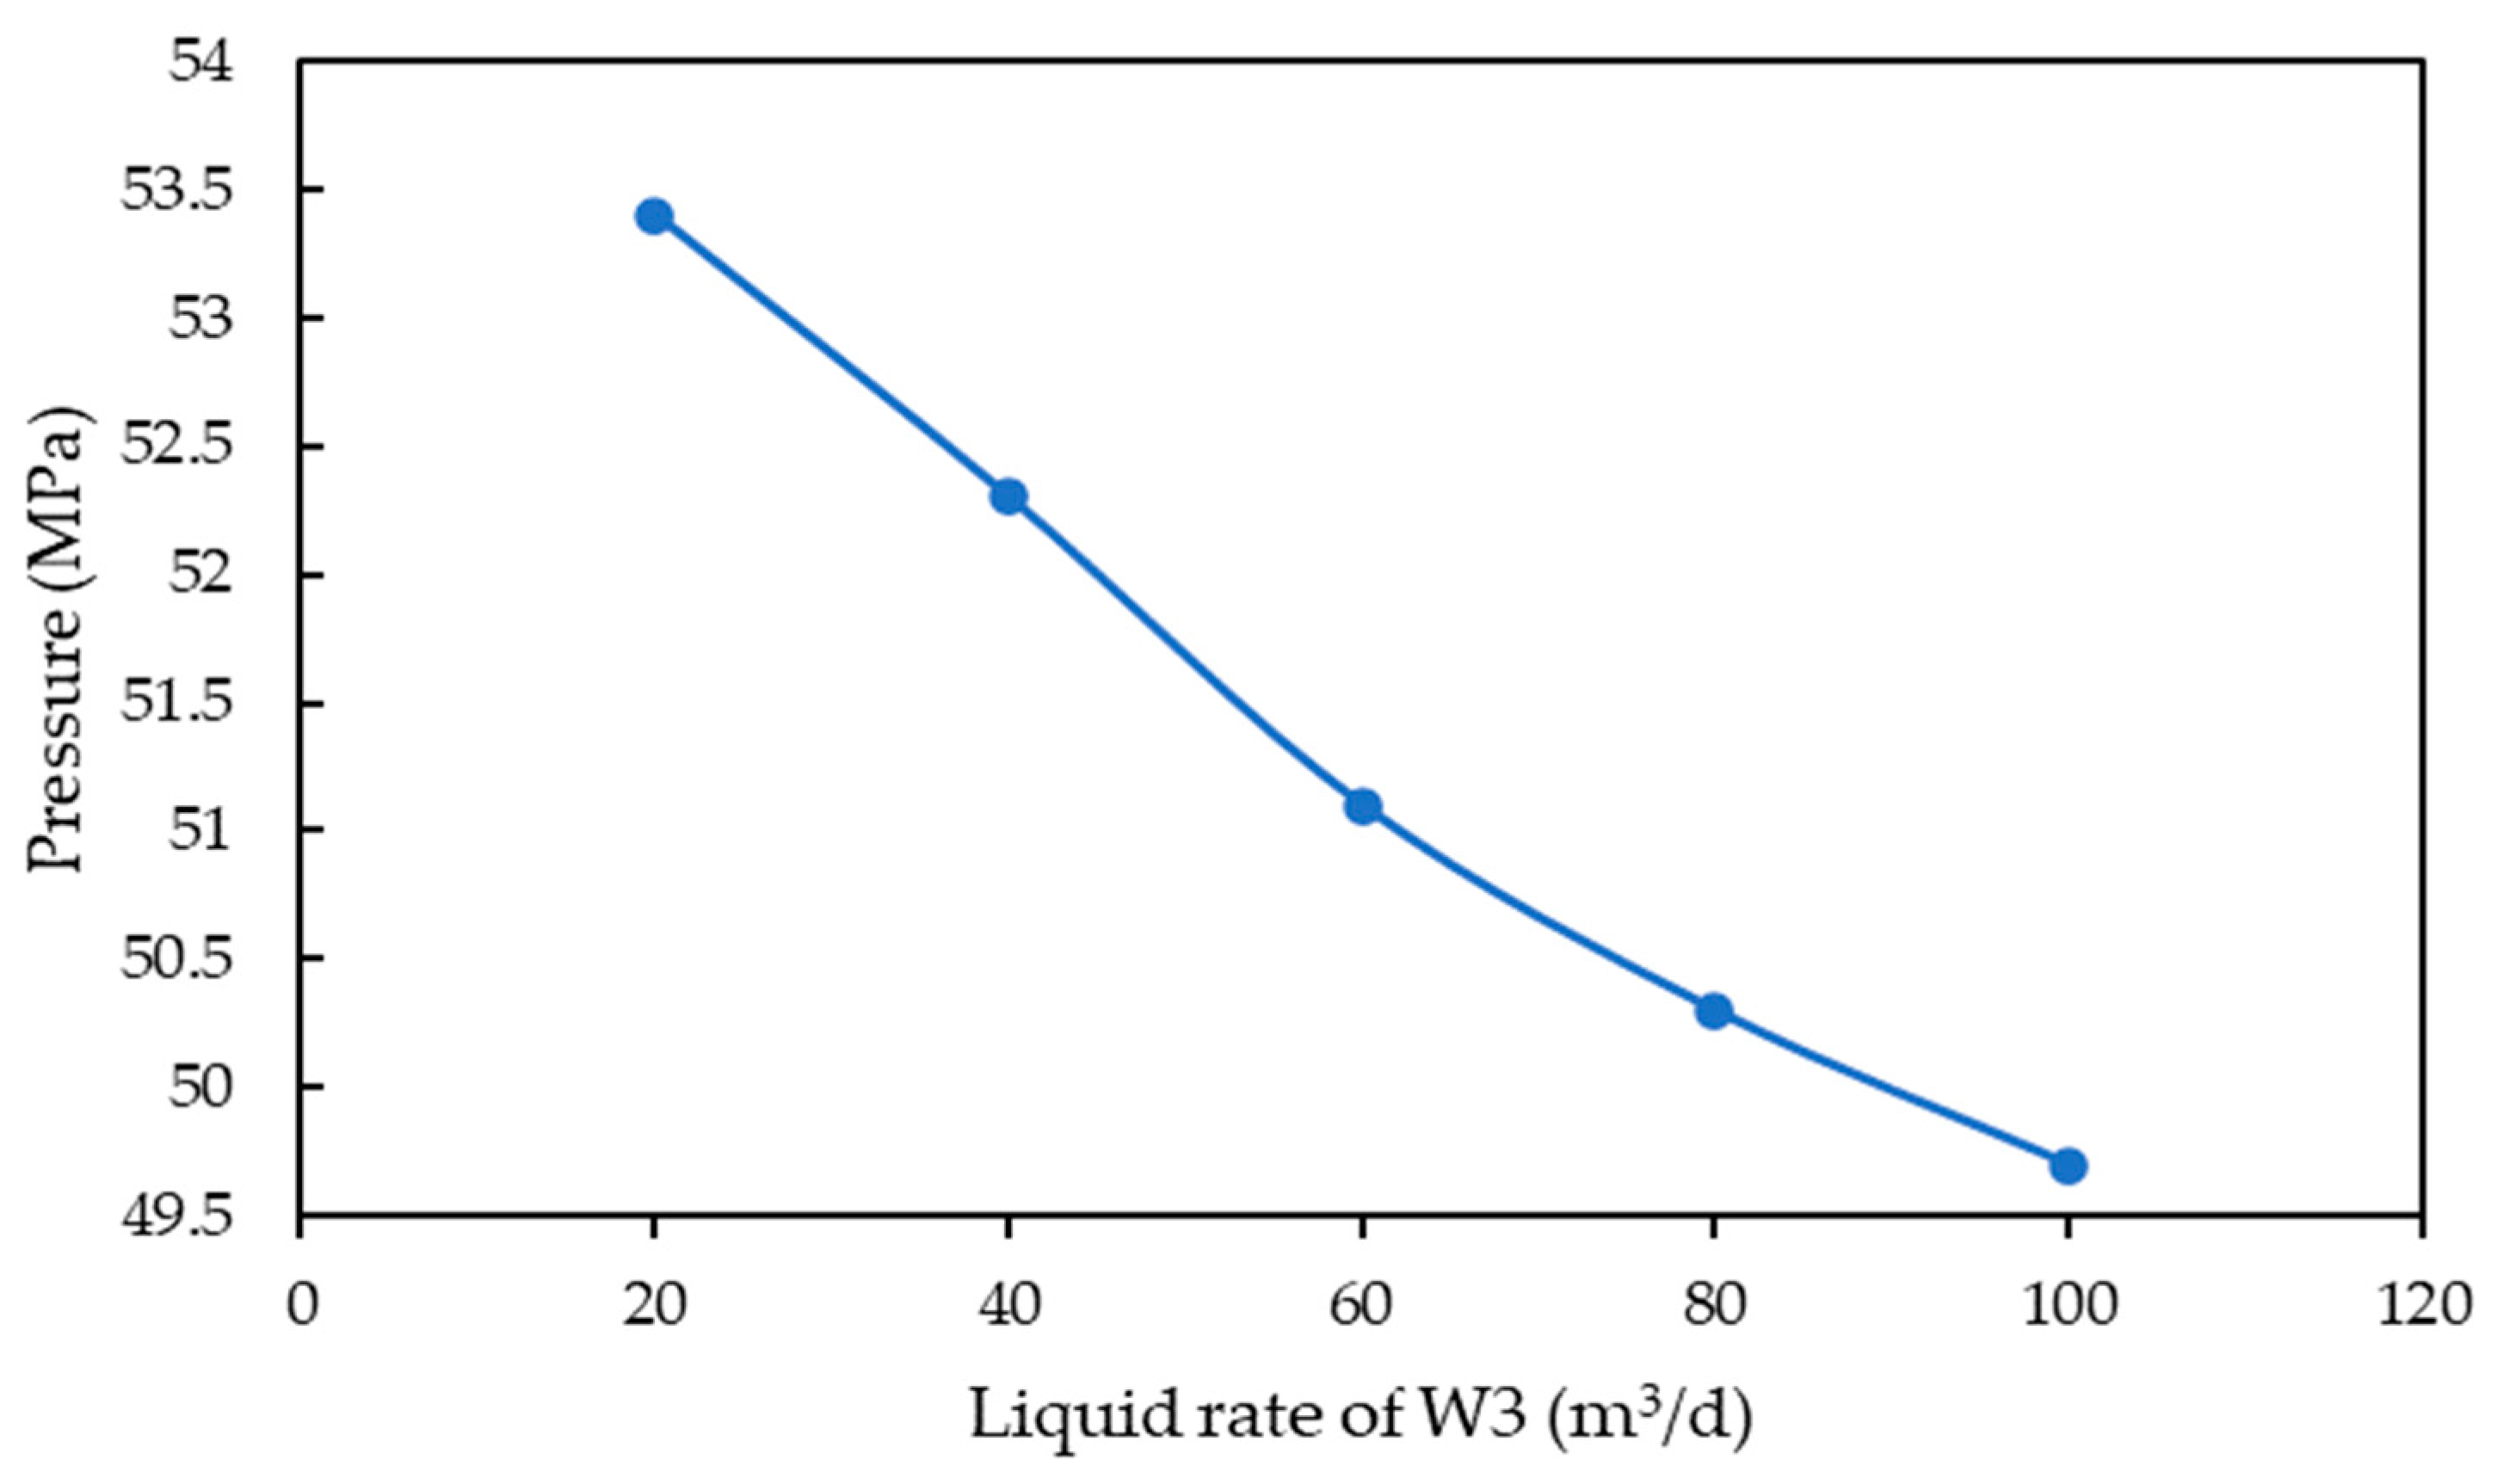
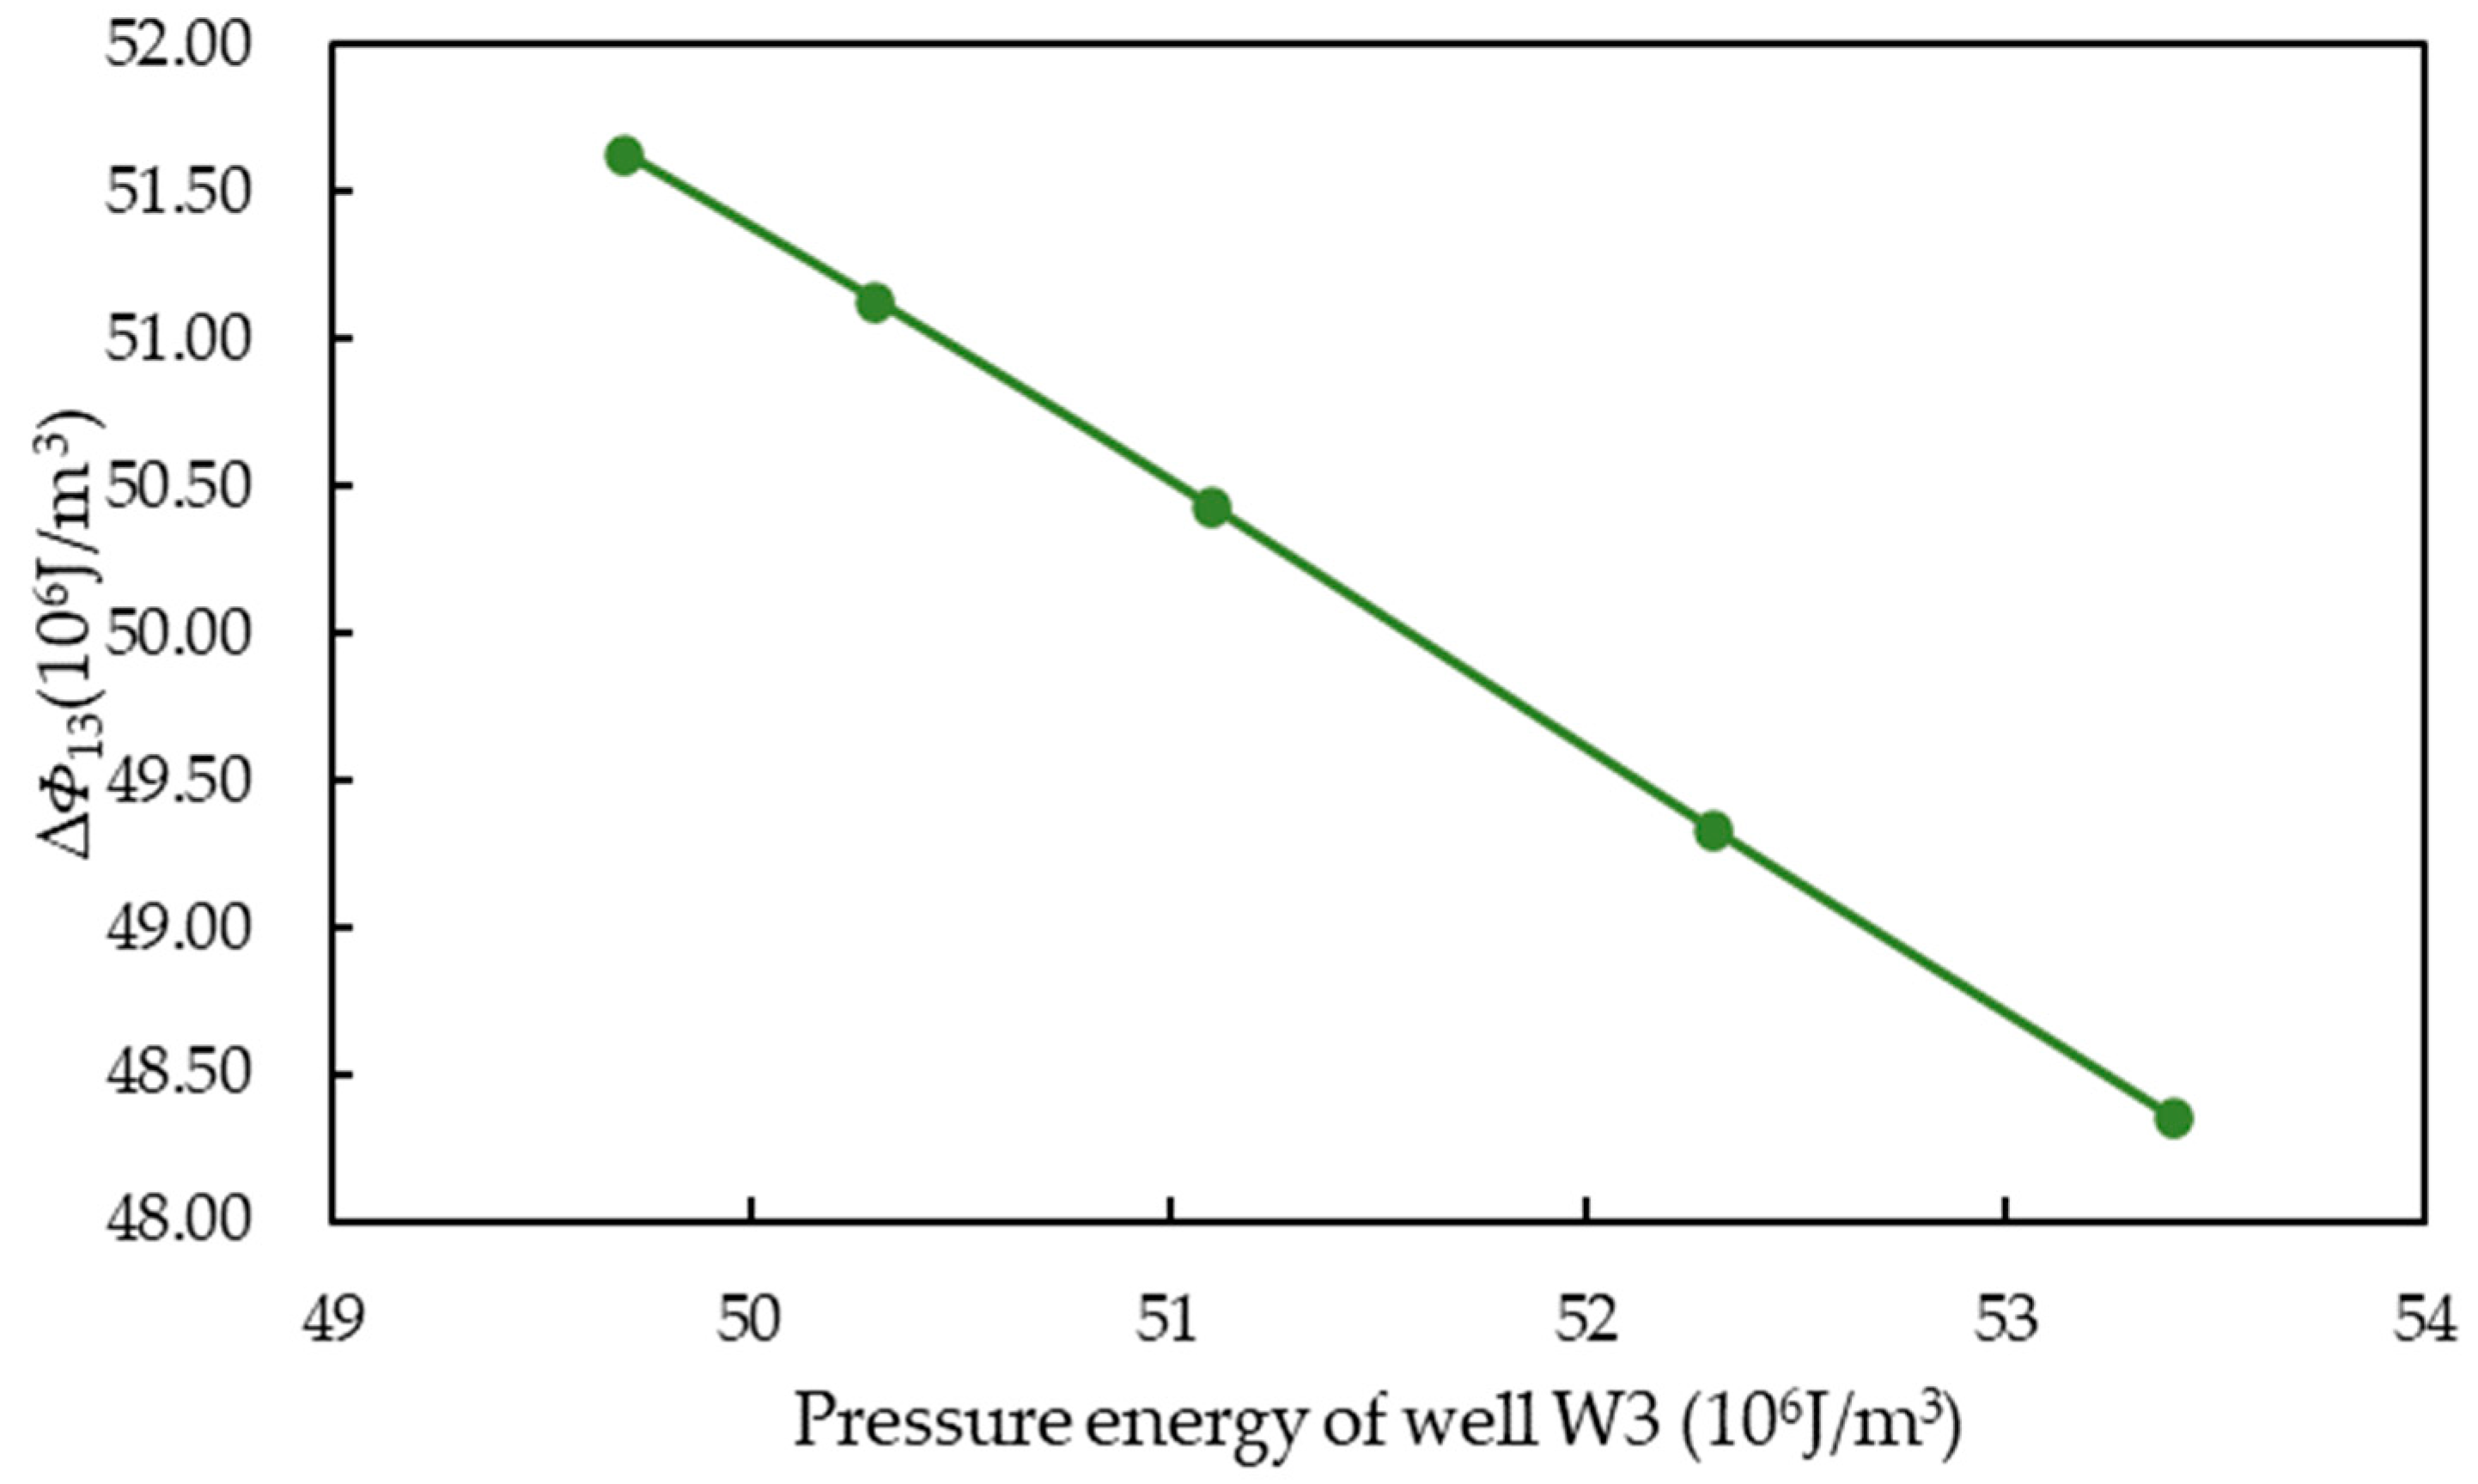
3.1.2. Variation Law of Flow Potential Difference under Different Pressure Energy

As shown in Figure 11 and Figure 12, there was a negative correlation between the pressure energy of Well W3 and the daily liquid production of Well W3. The daily liquid production of Well W3 was inversely proportional to the pressure energy. The flow potential difference between Well W1 and Well W3 decreased with the decrease in pressure energy of Well W3.
When P3 was closer to P1, the pressure energy difference between injection and production wells was smaller and the flow potential difference was smaller, which demonstrates that the change in pressure energy had a clear influence on the flow potential difference and was not constrained by other factors.

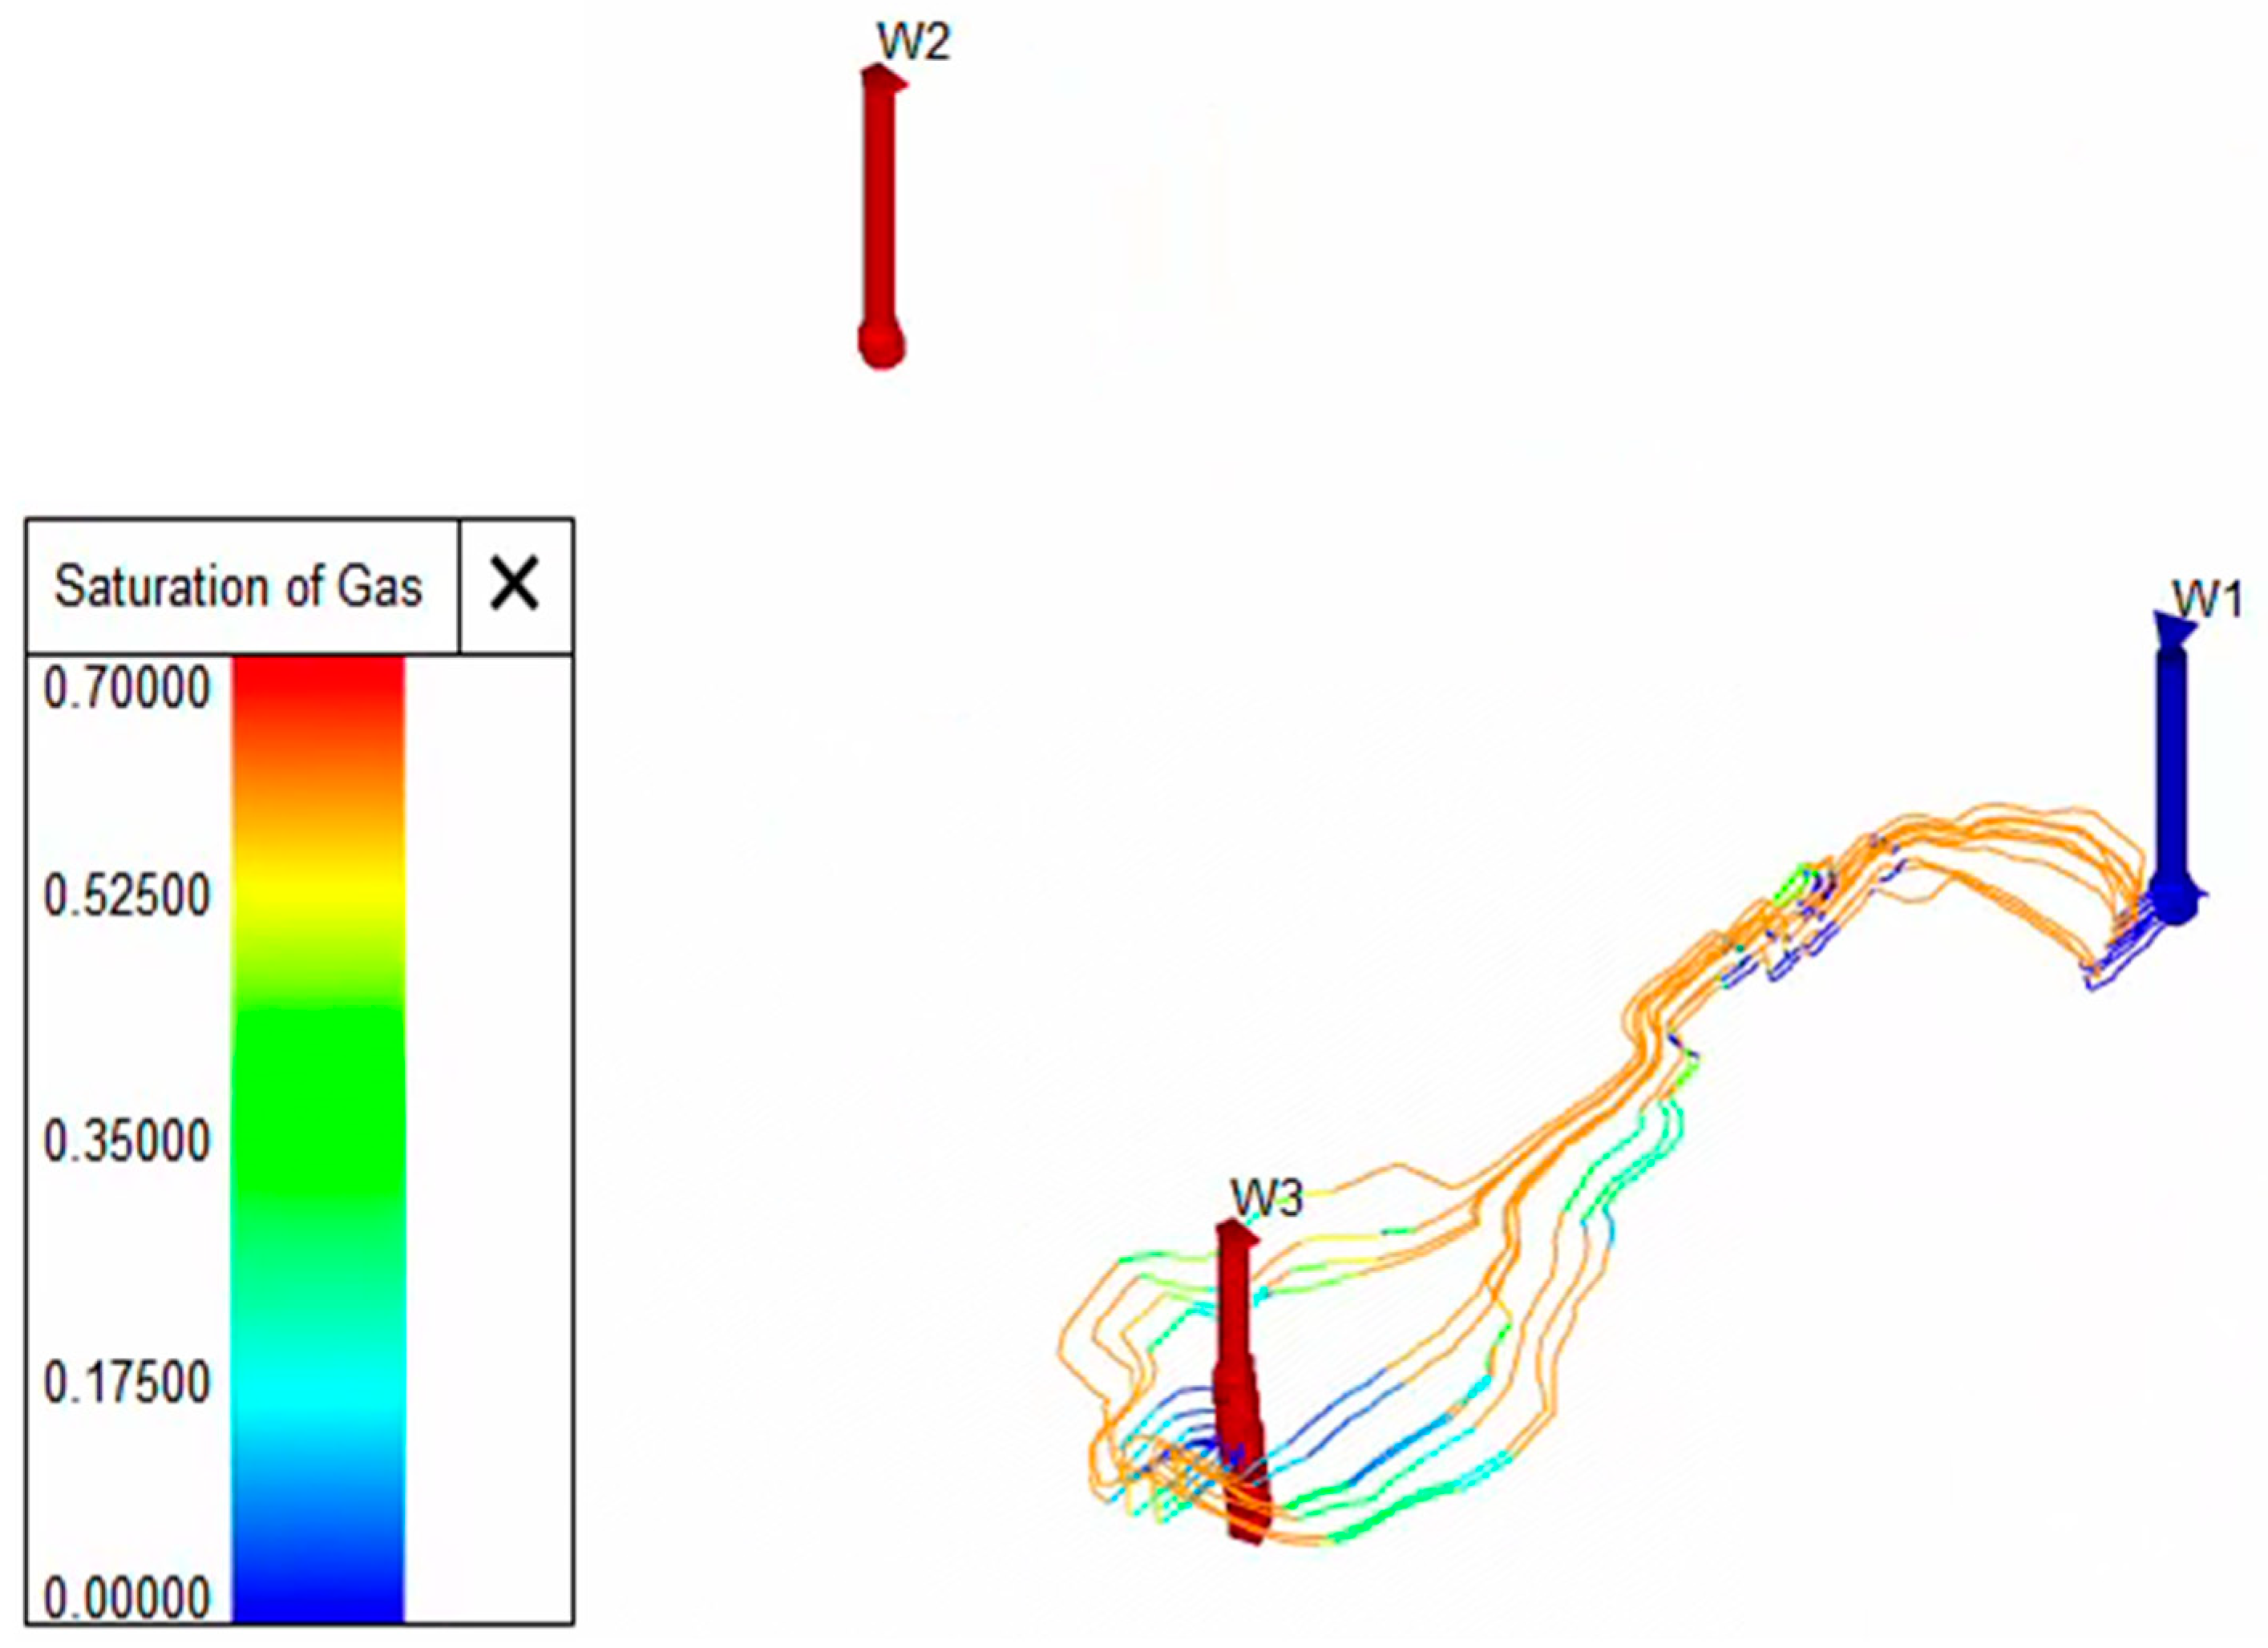
3.1.3. Gas Channeling under Different Flow Potential Difference Ratios

Comparing the gas-oil ratio in April 2024 under different flow potential difference ratios between injection and production wells as the criterion for judging gas channeling, the gas–oil ratio was more than thrice the initial value. The simulation results show that when Φ 12 / Φ 13 < 0.972 the ratio of gas to oil of Well W3 increases in April 2024, which is much more than three times the initial value (Table 1), but when Φ 12 / Φ 13 = 0.972 , there is no obvious change in the gas–oil ratio of Well W3, and there is no gas channeling (Figure 13).
Although there is some connectivity between Well W1 and the two adjacent wells, the fluid always flows in a direction in which the flow potential lowers rapidly during the gas cap drive operation. When the difference in flow potential between injection wells and different production wells ( Φ 12 Φ 13 ) < 0 and Φ 12 / Φ 13 < 0.972 , the gas will preferentially flow in the direction of large flow potential difference, that is, the flow channel between Well W1 and Well W3 (Figure 14).

3.2. Simulation Results of Gas Channeling Control in Oilfield A

As illustrated in Figure 15, when the Well G1 is positioned in the high section of gas injection, more gas flows to the closest Well T4, but only a tiny portion flows to the Well T1, and excessive gas accumulates around the Well T4, and is produced through the perforated section. As a result, the gas–oil ratio of the Well T4 quickly increases to three times its starting value, causing gas channeling.
Based on the data in Table 2, the flow potential difference Φ 1 between G1-T1 is 44.67 × 10⁶ J/m3. The flow potential difference between G1 and T4 is 45.93 × 10⁶ J/m3, Φ 1 / Φ 2 = 0.964 , which is less than 0.972, resulting in gas channeling to Well T4.
In order to prevent gas from continuously flowing towards Well T4 on a large scale and to increase the degree of gas wave propagation towards Well T1, combined with the principle of flow potential difference control, potential energy and pressure energy were adjusted. Lowering the production interval of Well T1, closing the production interval in the high water content area at the bottom of Well T4 and the production interval that produces gas channeling in high areas, increasing the daily liquid production of Well T1, and reducing the daily liquid production of Well T4, thereby increases the fluid potential difference between G1–T1 wells, reduces the fluid potential difference between G1–T4 wells, and enables gas-balanced displacement.
It can be seen from Table 3 that the flow potential difference between wells G1 and T1 after adjustment is greater than that between wells G1 and T2, and the ratio of fluid potential difference between injection and production wells is 0.988, which is more than 0.972 and 0.024 higher than the original growth rate.
As can be seen from Figure 16, the production gas–oil ratio after adjustment is evidently smaller than that before adjustment. The flow potential regulation has a good effect on the gas channeling regulation of artificial gas cap drive in fractured-vuggy reservoirs.

4. Discussion

4.1. Control Countermeasures of Gas Channeling Potential in Fractured-Vuggy Reservoir

It can be inferred that gas channeling can occur easily when ( Φ 12 Φ 13 ) < 0 and Φ 12 / Φ 13 < 0.97 , o r ( Φ 13 Φ 12 ) > 0 , or ( Φ 13 Φ 12 ) > 0 and Φ 13 / Φ 12 < 0.972 . To prevent the occurrence of gas channeling and minimize the negative impacts of gas channeling, the ratio of flow potential difference between injection wells and production wells must be maintained above 0.972.
In conjunction with the composition and formula of flow potential difference in the fractured-vuggy reservoir, energy of position and pressure are the most influential elements of flow potential difference. Based on the findings of numerical simulation, it can be concluded that varying pressure energy and varying potential energy can effectively modify the flow potential difference. The control technology of gas channeling potential in the fractured-vuggy reservoir is, therefore, primarily separated into potential energy regulation and pressure energy regulation.

4.1.1. Position Energy Regulation

If the pressure energies of several wells close to the injection well are comparable or if the liquid extraction capacity is constrained, the flow potential difference between injection and production wells can be modified by adjusting the potential energy. The specific operations include changing the injection–production layer, injection–production relationship, and injection–production well pattern adjustment.
Changing the injection–production layer is the most natural and straightforward technique to altering the potential energy when the perforation layer is thick. Due to the inconvenient nature of adjusting the injection section of gas injection wells while driving gas channeling by artificial gas cap, the potential energy must be adjusted by changing the production section of production wells.
If the injection–production height difference between injection and production wells is small and the production section of the production well is not thick, it is possible to temporarily close the gas well or release well, convert the gas production well into a gas injection well, or convert the gas injection well into a gas production well once gas channeling has occurred in the production well. The gas flow potential in the formation can be changed by changing the injection–production relationship and injection–production well pattern. A reasonable flow potential difference should be maintained, improving the spread range of the artificial gas top drive.

4.1.2. Pressure Energy Regulation

The fluid potential of the fractured-vuggy reservoir is primarily composed of potential energy and pressure energy, so the bottom hole pressure energy can be adjusted by changing the production pressure difference in order to control the flow potential difference between injection and production wells, balance the flow potential, change the direction of oil and gas flow around the well, and ultimately achieve the goal of reducing gas channeling. The specific operations include controlling the daily liquid production of production wells and reducing the daily gas injection volume of injection wells.
When the liquid production rate is excessively fast, the production pressure difference of the production well increases, as does the flow potential difference between injection wells and various production wells. The gas will flow in the direction of the largest flow potential difference, and the gas that has accumulated around the well may continue to decline the oil–gas interface to the perforated layer, resulting in increased gas production and gas channeling in the production well. This phenomenon would push crude oil away from the bottom hole, making crude oil recovery difficult and resulting in a poor effect of gas cap flooding. Consequently, balancing the flow potential and mitigating gas channeling can be achieved through the management of liquid production velocity. After reaching the periphery of the well, an appropriate amount of gas can form an effective gas cap through gravity differentiation, and dissolution and expansion can improve the flow capacity of crude oil, thus increasing crude oil production.
After the artificial gas cap has been formed, it is necessary to reduce the gas injection speed in order to reduce the displacement gas pointing and tongue entering phenomenon, to maintain a reasonable gas-oil pressure difference, and to prevent the gas from breaking through prematurely in order to mitigate the gas injection effect.

5. Conclusions

Faced with the continuous development of fractured-vuggy reservoirs, artificial gas top drive technology has become the research object of many oil fields, and research on gas channeling control is gradually deepening. There will be huge research space for applying flow potential regulation to control gas channeling technology. This study innovatively studies the application of flow potential regulation technology in the control of artificial gas cap drive gas channeling in fractured-vuggy reservoirs.
Artificial gas cap flooding can effectively improve crude oil fluidity, reduce interfacial tension, and increase oil displacement efficiency; reduce gasoline interface and oil-water interface through gravity differentiation and improve oil production below oil–water interface; activate weak flow channels between wells to drive the remaining oil in small pores in a large area; as well as use the expansion of gas cap to change the flow direction of crude oil. Due to the significant heterogeneity and complex fracture distribution in fractured-vuggy reservoirs, the key to improving oil recovery by artificial gas top drive in fractured-vuggy reservoirs is the discrimination and control of gas channeling.
Fluid always travels in the direction toward where the flow potential falls rapidly, and gas channeling is less likely the closer the ratio of the flow potential difference between the injection well and separate output wells tends towards 1. In the process of gas channeling control of an artificial gas cap drive in a fractured-vuggy reservoir, the ratio of potential difference between injection and production wells must be maintained at or above 0.972.
The flow potential energy of the fractured-vuggy carbonate reservoir is mainly controlled by energy of position and energy of pressure. When implementing flow potential control technology, the difference in flow potential between injection and production wells can be modified by adjusting the potential energy or pressure energy. The specific operations of changing potential energy include changing the injection–production layer, injection–production relationship, and injection–production well pattern; changing pressure energy includes fluid control, injection reduction.

Author Contributions

Conceptualization, R.H. and X.X.; methodology, R.H.; software, G.Y.; validation, R.H., X.X. and J.Y.; formal analysis, J.Y.; investigation, H.L.; resources, G.Y.; data curation, H.L.; writing—original draft preparation, J.Y.; writing—review and editing, R.H.; visualization, J.Y.; supervision, R.H.; project administration, X.X.; funding acquisition, R.H. All authors have read and agreed to the published version of the manuscript.

Funding

This research was funded by two National Natural Science Foundations of China, grant number 51804038 and 52104020.

Data Availability Statement

The data presented in this study are available on request from the corresponding author.

Conflicts of Interest

The authors declare no conflict of interest.

Nomenclature

ΦFlow potential (J/m3)
Φ 12 Fluid potential difference between Well W1 and Well W2 (J/m3)
Φ 13 Fluid potential difference between Well W1 and Well W3 (J/m3)
σInterfacial tension (N/m)
θWetting angle (°)
rcapillary radius (m)
gAcceleration of gravity (9.8 m/s2)
νVelocity of flow (m/s)
ρFluid density (kg/m3)
zDistance of the measuring point from the datum (m)
z1Distances of Well W1 from the datum (m)
z2Distances of Well W2 from the datum (m)
z3Distances of Well W3 from the datum (m)
PPressure of the measuring point (Pa)
P1Measuring point pressure of W1 (Pa)
P2Measuring point pressure of W2 (Pa)
P3Measuring point pressure of W3 (Pa)
W1Gas injection well named W1 in mechanism model
W2Production well named W2 in mechanism model
W3Production well named W3 in mechanism model
G1Gas injection well named G1 in Oilfield A
T1Production well named T1 in Oilfield A
T4Production well named T2 in Oilfield A

References

  1. Tong, X.; Zhang, G.; Wang, Z.; Wen, Z.; Tian, Z.; Wang, H.; Ma, F.; Wu, Y. Distribution and potential of global oil and gas resources. Pet. Explor. Dev. 2018, 45, 727–736. [Google Scholar] [CrossRef]
  2. Cheng, X. Study on Gas Injection Displacement Mechanism and Optimization of Injection-Production Parameters in Fractured-Vuggy Reservoir Unit. Ph.D. Thesis, Southwest Petroleum University, Chengdu, China, 2017. [Google Scholar] [CrossRef]
  3. Jin, Y.; Zhang, H.; Liu, Y.; Ji, Y. Discussion on development characteristics and typical karst model of strata-bound karst reservoir in Tahe oilfield. Earth Sci. Front. 2023, 30, 1–18. [Google Scholar] [CrossRef]
  4. Hu, W.; Li, X.; Yang, M.; Lu, X.; Liu, X.; Liu, H. Well pattern optimization of carbonate fractured-vuggy reservoir in Tahe oilfield. Xinjiang petroleum geology. Xinjiang Pet. Geol. 2023, 44, 429–434. [Google Scholar] [CrossRef]
  5. Li, Y.; Wang, Q.; Li, B.; Liu, Z. Dynamic Characterization of Different Reservoir Types for a Fractured-Caved Carbonate Reservoir. In Proceedings of the SPE Kingdom of Saudi Arabia Annual Technical Symposium and Exhibition, Dammam, Saudi Arabia, 24–27 April 2017. [Google Scholar] [CrossRef]
  6. Qin, G.; Bi, L.; Popov, P.; Efendiev, Y.; Espedal, M.S. An Efficient Upscaling Process Based on a Unified Fine-scale Multi-Physics Model for Flow Simulation in Naturally Fracture Carbonate Karst Reservoirs. In Proceedings of the International Oil and Gas Conference and Exhibition in China, Beijing, China, 8–10 June 2010. [Google Scholar] [CrossRef]
  7. Alblooshi, Y.A.; Wojtanowicz, A.K. Dynamic Water Control in Naturally Fractured Bottom Water-Drive Reservoirs via Downhole Water Sink Well Deployment: First Experimental Study. In Proceedings of the SEG/AAPG/EAGE/SPE Research and Development Petroleum Conference and Exhibition, Abu Dhabi, United Arab Emirates, 9–10 May 2018. [Google Scholar] [CrossRef]
  8. Lu, X.; Rong, Y.; Li, X.; Wu, F. Construction of injection-production well pattern in carbonate fractured-vuggy reservoir and its development significance—Taking Tahe oil field as an example. Pet. Nat. Gas Geol. 2017, 38, 658–664. [Google Scholar] [CrossRef]
  9. Dou, Z. Development Technology of Carbonate Slope-Cave Reservoir in Tahe Oilfield; Petroleum Industry Press: Beijing, China, 2012; pp. 61–68. [Google Scholar]
  10. Meng, Z.; Sun, S.Z. Integrated connectivity analysis for complex carbonate reservoir. In Proceedings of the 2018 SEG International Exposition and Annual Meeting, Anaheim, CA, USA, 14–19 October 2018. [Google Scholar] [CrossRef]
  11. Davletbaev, A.; Baikov, V.; Doe, T.; Emchenko, O.; Zainulin, A.; Igoshin, A.; Fedorov, A. Fracture-Based Strategies for Carbonate Reservoir Development. In Proceedings of the SPE Russian Oil and Gas Conference and Exhibition, Moscow, Russia, 26–28 October 2010. [Google Scholar] [CrossRef]
  12. Zhao, C.; Song, Z.; Yao, Y.; Li, Y.; Liu, Q.; Qi, M.; Hou, J.; Xu, L.; Han, B.; Song, L. Effect of Water-Alternating-Gas Injection on Gas and Water Production Control in Carbonate Reservoirs. In Proceedings of the Carbon Management Technology Conference, Houston, TX, USA, 15–18 July 2019. [Google Scholar] [CrossRef]
  13. Li, Q.; Wang, F.; Wang, Y.; Forson, K.; Cao, L.; Zhang, C.; Zhou, C.; Zhao, B.; Chen, J. Experimental investigation on the high-pressure sand suspension and adsorption capacity of guar gum fracturing fluid in low-permeability shale reservoirs: Factor analysis and mechanism disclosure. Environ. Sci. Pollut. Res. 2022, 29, 53050–53062. [Google Scholar] [CrossRef] [PubMed]
  14. Su, W.; Hou, J.; Zhao, F.; Xi, Y.; Zhao, T.; Ding, B. Feasibility and Influencing Factors of Oil Tolerant Nitrogen Foam on EOR Effect in the Fractured-Vuggy Carbonate Reservoir. In Proceedings of the Abu Dhabi International Petroleum Exhibition & Conference, Abu Dhabi, United Arab Emirates, 13–16 November 2017. [Google Scholar] [CrossRef]
  15. Li, Y.; Wang, D.; Liu, Z.; Ma, X. Development Strategy Optimization of Gas Injection Huff and Puff for Fractured-Caved Carbonate Reservoirs. In Proceedings of the SPE Kingdom of Saudi Arabia Annual Technical Symposium and Exhibition, Dammam, Saudi Arabia, 25–28 April 2016. [Google Scholar] [CrossRef]
  16. Zhang, H.; Ju, B.; Liu, Z.; Song, C.; Zhu, G. Feasibility analysis of nitrogen-assisted gravity flooding in fractured-vuggy reservoir. Fault Block Oil Gas Field 2022, 29, 399–403. [Google Scholar]
  17. Li, M. Experimental Study on the Mechanism of Nitrogen-Assisted Gravity Flooding in Fractured-Vuggy Reservoir. Master’s Thesis, China University of Petroleum, Beijing, China, 2022. [Google Scholar] [CrossRef]
  18. Qu, M.; Hou, J.; Zhao, F.; Song, Z.; Ma, S.; Wang, Q.; Li, M.; Yang, M. 3-D Visual Experiments on Fluid Flow Behavior of Water Flooding and Gas Flooding in Fractured-Vuggy Carbonate Reservoir. In Proceedings of the SPE Annual Technical Conference and Exhibition, San Antonio, TX, USA, 9–11 October 2017. [Google Scholar] [CrossRef]
  19. Liu, Z.; Hou, J.; Li, J.; Cheng, Q. Study of Residual Oil in Tahe 4th Block Karstic/Fractured Heavy Oil Reservoir. In Proceedings of the North Africa Technical Conference and Exhibition, Cairo, Egypt, 20–22 February 2012. [Google Scholar] [CrossRef]
  20. Zhang, S. Study on remaining oil type and production mode of fractured-vuggy reservoir. J. Guangdong Inst. Pet. Chem. Eng. 2023, 33, 13–16+21. [Google Scholar] [CrossRef]
  21. Zhao, L. Study on Technical Countermeasures of Artificial Gas Top Drive in Fault Block Reservoir. Master’s Thesis, China University of Petroleum, Beijing, China, 2021. [Google Scholar] [CrossRef]
  22. Kirby, J.E.; Stamm, H.E.; Schnitz, L.B. Calculation of the Depletion History and Future Performance of a Gas-Cap-Drive Reservoir. Trans. AIME 1957, 210, 218–226. [Google Scholar] [CrossRef]
  23. Daltaban, T.S.; Noyola, A.; Trejo, G.; Toledo, R. An Investigation into the Technical Feasibility of Gas Injection into Fractured CHUC Reservoir in the Gulf of Mexico. In Proceedings of the SPE International Petroleum Conference and Exhibition in Mexico, Villahermosa, Mexico, 10–12 February 2002. [Google Scholar] [CrossRef]
  24. Wang, Z.; Hou, J.; Yang, Y.; Zhu, G. Experimental study on the effect of water saturation of filling medium in fractured-vuggy reservoir on the dissolution and diffusion of CO2 and N2. Spec. Oil Gas Reserv. 2022, 29, 91–98. [Google Scholar] [CrossRef]
  25. Ma, B.; Bai, W.; Xiao, M.; Hu, J. Field test of nitrogen artificial gas cap oil displacement in the small-scale sandstone reservoir with high porosity, high permeability and strong edge water—By taking Chun 22 well block of Chunguang oilfield as an example. Pet. Geol. Eng. 2020, 34, 69–73. [Google Scholar] [CrossRef]
  26. Tan, T.; Guo, C.; Chen, Y.; Dou, L.; Hui, J. Study and practice on enhanced oil recovery mechanism of N2 flooding in fractured-vuggy reservoir with high temperature and high pressure. Oil Gas Reserv. Eval. Dev. 2020, 10, 60–64. [Google Scholar]
  27. Soliz, J.; Enab, K.; Lopez, I.; Elmasry, Y. Experimental Investigation of Gas Injection Performance with Different Fluid Types. In Proceedings of the SPE/AAPG/SEG Unconventional Resources Technology Conference, Houston, TX, USA, 20–22 June 2022. [Google Scholar] [CrossRef]
  28. Hou, J.; Zhang, L.; Li, H.; Li, W.; Yuan, D.; Yuan, Y.; Zheng, Z.; Luo, M. Influencing factors on EOR nitrogen flooding in fractured-vuggy carbonate reservoir. Oil Gas Geol. Oil Recovery 2015, 22, 64–68. [Google Scholar] [CrossRef]
  29. Li, Q.; Han, Y.; Liu, X.; Ansari, U.; Cheng, Y.; Yan, C. Hydrate as a by-product in CO2 leakage during the long-term sub-seabed sequestration and its role in preventing further leakage. Environ. Sci. Pollut. Res. 2022, 29, 77737–77754. [Google Scholar] [CrossRef] [PubMed]
  30. Cui, C.; Yan, D.; Yao, T.; Wang, J.; Zhang, C.; Wu, Z. Prediction method of migration law and gas channeling time of CO2 flooding front: A case study of G89-1 Block in Shengli Oilfield. Pet. Reserv. Eval. Dev. 2022, 12, 741–747. [Google Scholar] [CrossRef]
  31. Peng, H.; Chen, Z.; Tian, J.; Liu, D.; Xin, Z. Discrimination method and control countermeasure of circulating gas injection gas channeling in Dalaoba. West-China Explor. Eng. 2016, 28, 93–95. [Google Scholar] [CrossRef]
  32. England, W.A.; Mackenzie, A.S.; Mann, D.M.; Quigley, T.M. The movement and entrapment of petroleum fluids in the subsurface. J. Geol. Soc. 1987, 144, 327–347. [Google Scholar] [CrossRef]
  33. Ren, W. Application of flow potential control in water control and oil stabilization of fractured-vuggy carbonate reservoirs. Lithol. Reserv. 2019, 31, 127–134. [Google Scholar] [CrossRef]
  34. Du, C.H.; Qiu, H.; Chen, X.F.; Tian, L.; Yue, P.; Li, L.; Yao, J.B.; Wei, B. Application of flow potential analysis technique based on numerical simulation in the development of fractured-vuggy reservoir. Pet. Reserv. Eval. Dev. 2020, 10, 83–89. [Google Scholar] [CrossRef]
Figure 1. Isolated karst cave.
Processes 11 03301 g001
Figure 2. Fractured and vuggy group.
Processes 11 03301 g002
Figure 3. Schematic diagram of gravity differentiation: (a) direction of crude oil flow before gas injection; (b) direction of crude oil and gas flow after gas injection.
Processes 11 03301 g003
Figure 4. Schematic diagram of gas cap expansion for oil displacement: (a) fluid distribution and flow direction before gas cap expansion; (b) fluid distribution after gas cap expansion.
Processes 11 03301 g004
Figure 5. Initial pressure field diagram of the model.
Processes 11 03301 g005
Figure 6. Schematic diagram of fractured-vuggy structure of mechanism model.
Processes 11 03301 g006
Figure 7. Permeability field diagram in the X direction of the model.
Processes 11 03301 g007
Figure 8. Porosity of the model.
Processes 11 03301 g008
Figure 9. Potential energy variation curves at different distances.
Processes 11 03301 g009
Figure 10. Variation curve of Φ 13 under different Well W3 location energy.
Processes 11 03301 g010
Figure 11. Pressure variation curve under different daily liquid production.
Processes 11 03301 g011
Figure 12. Variation curve of flow potential difference under different pressure energy.
Processes 11 03301 g012
Figure 13. Change in gas–oil ratio in Well W3 under different flow potential difference ratios.
Processes 11 03301 g013
Figure 14. Gas channeling flow chart of W3.
Processes 11 03301 g014
Figure 15. Saturation three-phase diagram of the well group.
Processes 11 03301 g015
Figure 16. Gas–oil ratio comparison of Well T4 before and after adjustment.
Processes 11 03301 g016
Table 1. Gas–oil ratio of Well W3 under different flow potential difference ratios.
Φ 12 Φ 13 Φ 13
(106 J/m3)
Φ 13
(106 J/m3)
Initial Gas-Oil
Ratio
W3 Gas-Oil Ratio in April 2024
0.972 Φ 12 46.9835.1234.62
Φ 13 48.35
0.952 Φ 12 46.98257.47
Φ 13 49.33
0.932 Φ 12 46.98261.70
Φ 13 50.43
0.919 Φ 12 46.98499.33
Φ 13 51.13
0.910 Φ 12 46.98690.03
Φ 13 51.63
Table 2. Calculation of flow potential difference of the G1 well group.
Well NameZ
(m)
P
(MPa)
ρ O
(kg/m3)
ρ G
(kg/m3)
Φ 1
(106 J/m3)
Φ 2
(106 J/m3)
Φ 1 Φ 2
(106 J/m3)
Φ 1 Φ 2
G1−4557.554.99771.2544.2745.93<00.964
T1−4535.554.0
T4−4614.453.1
Table 3. Calculation of the flow potential difference after adjusting the current potential in the G1 well group.
Well NameZ
(m)
P
(MPa)
ρ O
(kg/m3)
ρ G
(kg/m3)
Φ 1
(106 J/m3)
Φ 2
(106 J/m3)
Φ 1 Φ 2
(106 J/m3)
Φ 1 Φ 2
G1−4557.554.69771.2545.80845.257>00.988
T1−4612.652.9
T4−4586.453.2
Disclaimer/Publisher’s Note: The statements, opinions and data contained in all publications are solely those of the individual author(s) and contributor(s) and not of MDPI and/or the editor(s). MDPI and/or the editor(s) disclaim responsibility for any injury to people or property resulting from any ideas, methods, instructions or products referred to in the content.

