Article

The Impact of Agrivoltaic Systems on Tomato Crop: A Case Study in Southern Italy

Mediterranean Agronomic Institute of Bari (CIHEAM Bari), Via Ceglie 9, 70010 Valenzano, Italy
*
Author to whom correspondence should be addressed.
Processes 2023, 11(12), 3370; https://doi.org/10.3390/pr11123370
Submission received: 24 October 2023 / Revised: 28 November 2023 / Accepted: 30 November 2023 / Published: 4 December 2023
(This article belongs to the Special Issue Solar Energy for Sustainable Agriculture)

Abstract

:
Agrivoltaics, a system combining the production of agricultural crops and solar energy on the same land area, offers a potential solution to land use competition between different sectors. However, concerns have been raised regarding the impact of shade on plant growth under Agrivoltaic Systems (AVSs). Numerous studies have explored the effects of AVSs shading on agricultural crops. However, most of these studies focused on shade-tolerant crops, leaving a gap in the understanding of how these systems affect shade-intolerant crops. To this end, this study was conducted in Bari, southern Italy, using two types of AVSs: conventional (Con) and semi-transparent (ST) panels. The objective was to assess the impacts of the different levels of shading on the tomato yield and fruit quality. Tomato cultivation occurred between May and August under various conditions: Con panels, ST panels, and Open Field. The results revealed that soil temperature decreased under both AVSs compared to in the open field conditions. However, the significant reduction in photosynthetically active radiation (PAR), up to 43% in ST and 67% in Con, led to yield reductions ranging between 28% and 58% in ST and Con, respectively. Nonetheless, AVSs demonstrated their potential to reduce irrigation water demand by over 15% in ST and more than 20% in Con. Interestingly, the AVSs reduced fruit size but improved certain fruit quality attributes, such as titratable acidity, which is closely correlated with fruit flavour. These findings highlight the challenges of cultivating shade-intolerant crops under AVSs in a Mediterranean climate, while temperate, dry conditions may offer more favourable prospects for agricultural production.

1. Introduction

The adoption of renewable energy sources has led to the proliferation of solar photovoltaic (PV) farms worldwide. However, PV energy is considered as the least land-efficient energy source, while it is also highly competitive in terms of food production, since PV farms are often developed on agricultural land [1]. The integration of crop production and solar PV energy in the same land area is currently being discussed as a novel approach called Agrivoltaics (AV) [2]. This approach contributes to the valorisation of ecosystem resources by promoting sustainable land utilisation and renewable energy production. Also, Agrivoltaic Systems (AVSs) have the potential to mitigate climate change by reducing greenhouse gas (GHG) emissions related to agriculture, such as those from pumping and irrigation, which mainly depend on fossil fuels. This aligns with the European Union’s goal to reach net-zero GHG emissions by 2050 [3]. On the other hand, AVSs provide a complementary solution for critical land use between food and energy production to address the increasing global demand in the context of the water–food–energy nexus approach.
The concept of AV was first proposed by Goetzberger and Zastrow [4], who demonstrated that there is enough radiation beneath elevated PV panels to allow for crop production in the same area. This concept has since been developed, and numerous studies have been conducted to improve this system. It has been shown that AVSs can generate additional revenue for farmers by selecting a suitable crop based on shade tolerance [2]. Furthermore, AVSs could increase land productivity by about 70%, which could reach up to 90% [5]. Despite the potential benefits of AVSs in addressing competition over land utilisation between crop and energy production, there are still major concerns that the shade and microclimate conditions under AVSs may hinder crop productivity and quality [6]. The microclimatic conditions beneath these systems, including factors such as air temperature, solar radiation, humidity, wind speed, soil temperature, and moisture, can directly influence crop development. Solar radiation, in particular, is considered to be the most affected component [7]. In addition, it has been observed that soil temperature decreases under AVSs when compared to open field conditions due to the influence of irregular shading patterns [8]. This change in soil temperature and moisture is related to the fact that installing PV panels can result in unequal water distribution underneath them [9]. Furthermore, the soil–water balance can change in general, as Marrou et al. [10] demonstrated. Evapotranspiration (ET) is reduced under AVSs due to a reduction in both evaporation and transpiration as a result of less solar radiation. This could improve Water Productivity (WP) and help to reduce water losses in dry climates. In the same context, Barron-Gafford et al. [11] reported that the soil and maximum air temperatures were lower in shaded conditions than in full sun exposure.
In addition to the effect of microclimate heterogeneity, the effect of shading on crop productivity is a major concern when assessing the sustainability of AVSs in agricultural systems. The effect of shading on productivity depends on how plants adjust their mechanisms to withstand low light conditions. So far, most crops studied in agricultural photovoltaics are lettuce, pepper, tomato, and cucumber [12]. A study based on real field trials in Montpellier, France, found that ground-mounted PV systems with 25% and 50% shade in spring and summer did not affect lettuce yield. They concluded that shading did not significantly affect yield because lettuce can adapt to varying degrees of shading [8]. Also, in the same context, Trypanagnostopoulos et al. [13] conducted an experiment in southwestern Greece, where lettuce was grown under a PV greenhouse with 20% coverage. The results showed that the AVS did not significantly impact the crop productivity, but the energy production efficiently met the electricity and heat needs. For pepper, up to 20% shade under PV panels has been reported to have no significant effect on pepper plant growth, yield, or quality. Furthermore, it was assumed that the yield could be increased by up to 22% using semi-transparent PV modules [14], while Cossu et al. [15] showed that a high yield loss occurred above 50% AVS coverage. Under field conditions, tomato plants increased their fruit production under the shade of these AVSs. The results also showed that the shading of PV modules provided many additional co-benefits, including reduced soil water evaporative losses, which contribute to a higher WP in food production and minimise heat stress of PV modules [16]. Under the AVS greenhouse, Cossu et al. [17] pointed out adverse effects and decreased fruit yield.
Shading affects not only the yield (quantity), but also the quality of plants. Li et al. [18] studied the accumulation of high-molecular-weight glutenin subunits (HMW-GS) and glutenin macropolymers (GMP) in two different wheat varieties and found that the glutenin content and wet gluten content decreased, while the sedimentation values increased. In contrast, the opposite result was obtained under high shading conditions. Plant secondary metabolites such as carotenoids, ascorbic acid, and phenols have been studied in tomato crops, showing that their concentrations increase with light intensity [12]. However, there has been no agreement in the literature on the real impact of shading on the quality of tomato crop. For instance, El-Gizawy et al. [19] showed that, as light intensity increased, the proportion of titratable acid increased, but ascorbic acid and total soluble solids decreased. On the other hand, Nangare et al. [20] did not encounter any significant changes in the concentrations of the acids mentioned above. These results could be explained by heterogeneity in climatic conditions and experimental settings.
As most of these studies evaluated the effects of AVSs on shade-tolerant crops, mainly in PV greenhouses, the effectiveness of these systems for shade-intolerant crops and in the open field has not been widely investigated. Therefore, further investigation is required in this regard, as the understanding of how these crops respond to the altered climatic conditions introduced by AVSs remains limited. Accordingly, the objective of this study is to assess the impacts of two different AVSs (one includes conventional or opaque solar panels, denoted Con; and the other includes semi-transparent panels, denoted ST) on tomato growth and yield production, irrigation water saving, and irrigation management, as well as renewable energy production, in the context of Water–Energy–Food–Environment (WEFE) nexus.

2. Materials and Methods

2.1. Site Description

The AVSs are located in southern Italy at the CIHEAM-Bari experimental field in the Puglia region (41°03′13.5″ N, 16°52′37.1″ E). The area has a Mediterranean climate, classified as a warm temperate climate with dry and hot summers and rainy winters. The annual average temperature is 17 °C, the annual precipitation is around 575 mm, and the relative humidity is about 69.7%. The field is 68 m above sea level, characterised by a silty clay soil, equipped with a drip irrigation system, and covers an area of 480 m2 (24 m × 20 m). The irrigation system includes drippers with a nominal flow rate of 4 lh−1. The AVSs consist of two arrays (Con and ST), as shown in Figure 1, encompassing 24 panels each. Table 1 describes the characteristics of the solar panels for both systems. The shading of the arrays was monitored from 6 am to 8 pm on a sunny, cloudless day. Accordingly, the selected shading rates used in this study were 50% and 80% for each AVS.

2.2. Setup of the Experimental Field

To assess the impact of two different AVSs on crop growth and productivity, the Discovery F1 variety of tomato (Lycopersicon esculentum) was cultivated over four months from early May to the end of August 2023. The tomato was selected as a shade-intolerant crop and is one of the most important cash crops worldwide, particularly in the Mediterranean region. The tomatoes were planted on 8 May in 21 rows; each row was 24 m long. The spacing between each row was 1 m, while the spacing between the tomato plants in each row was 0.7 m. Considering the shading patterns of the AVSs, the field was divided into five treatments. The first plot, covered by the AVS with the traditional/conventional solar arrays (Con), consisted of two treatments, i.e., Con50% and Con80%. The second plot, covered by the AVS with the semi-transparent solar arrays (ST), also consisted of two treatments, i.e., ST50% and ST80%. The designation of “50%”, for both Con and ST, implies that this particular area experiences shading for 50% of the daytime, while “80%”, for both Con and ST, signifies that the corresponding area is shaded for 80% of the daytime. The rest of the field that was not covered was considered as a reference treatment (Open).

2.3. Field Measurements and Monitoring

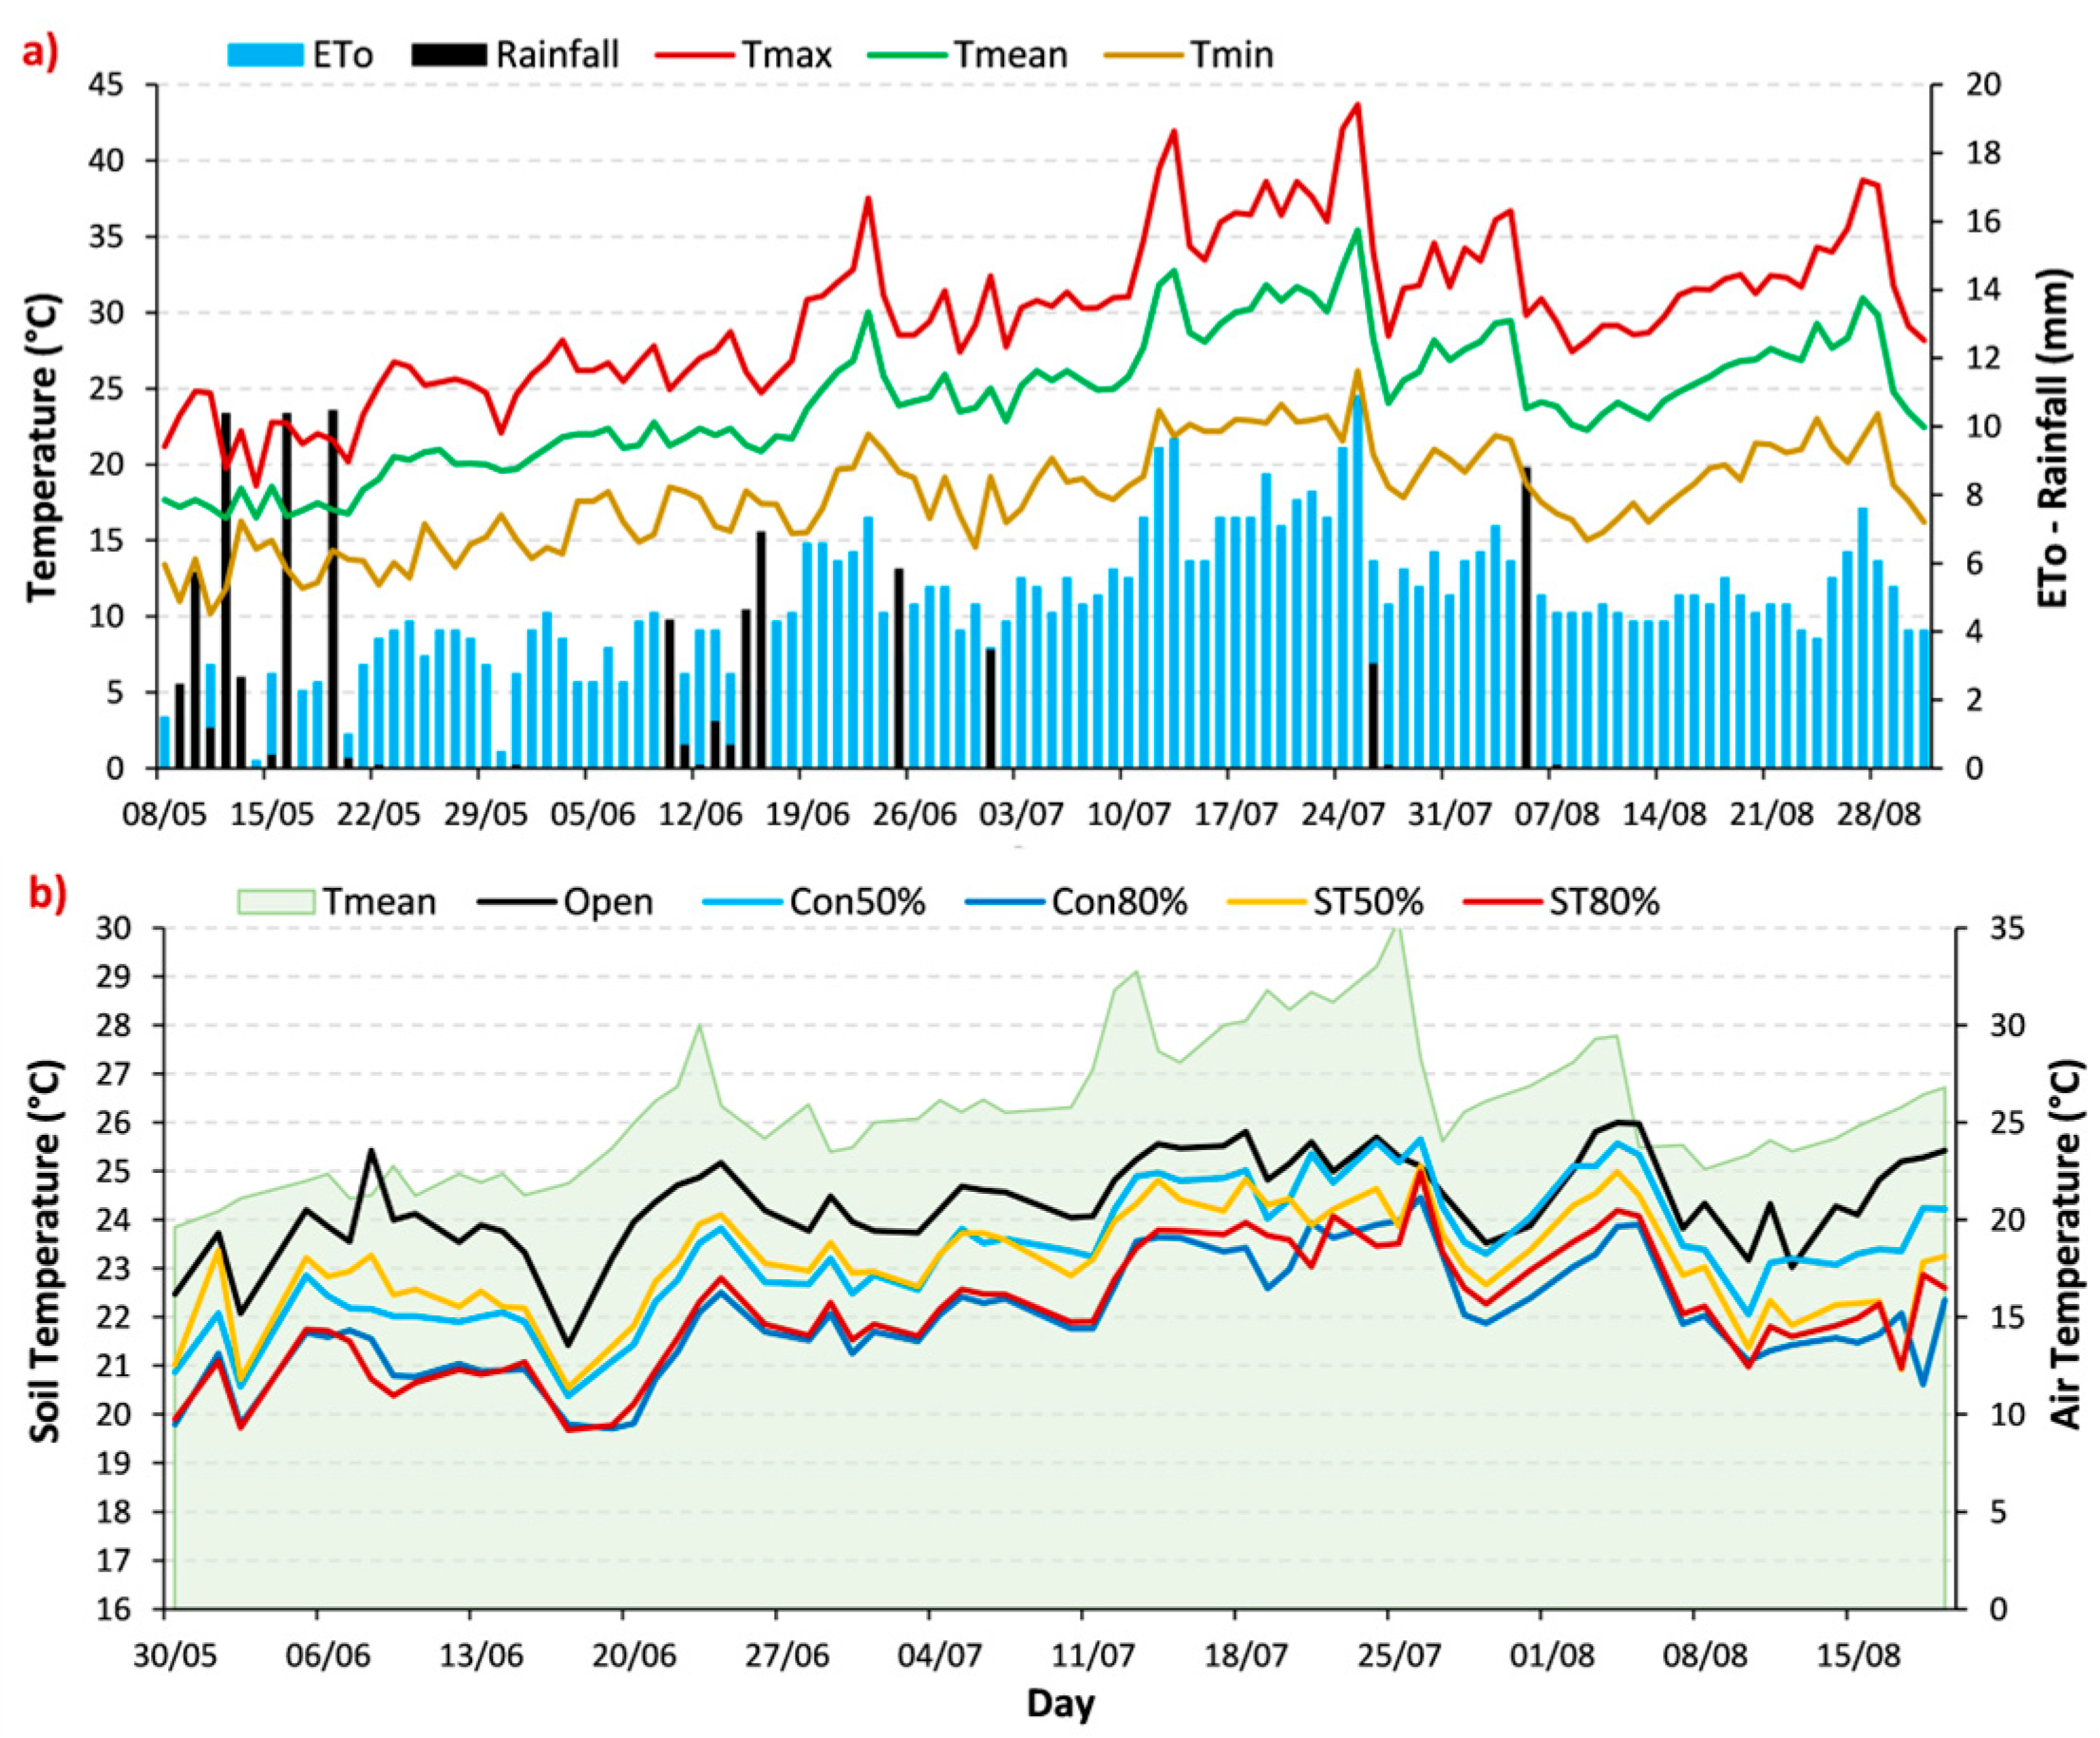
2.3.1. Weather Data and Soil Temperature

Real time weather data, including air temperature, solar radiation, relative humidity, wind speed, and precipitation, were collected from a nearby weather station (about 100 m from the experimental field). In addition, a thermometer (XS instrument) was used to measure the daily soil temperatures in 23 locations in the experimental field, covering the five previously mentioned treatments.
The reference evapotranspiration ( E T 0 ) was calculated based on the Penman–Monteith equation [21]:
E T 0 = 0.408 R n G + γ 900 T + 273 U 2 ( e s e a ) + γ ( 1 + 0.34 U 2 )
where:
  • E T 0 : reference evapotranspiration (mm d−1)
  • R n : net radiation (MJ m−2 d−1)
  • G : soil heat flux density (MJ m−2 d−1)
  • T : average air temperature at 2 m height (°C)
  • U 2 : wind speed at 2 m height (m s−1)
  • e s e a : saturation vapour pressure deficit (Kpa)
  • : slope of the curve of saturated vapour pressure (kPa °C−1)
  • γ : Psychrometric constant (kPa °C−1)

2.3.2. Irrigation Water Management

This study used the soil water contents measurement via TDR (Time Domain Reflectometry) for irrigation scheduling to account for variations in the water depletion in the root zone. This technique is based on measuring the velocity of the propagation of a high-frequency signal in the soil.
TDR100 (Campbell Scientific, Inc., Logan, UT, USA) was used for all measurements to determine the soil volumetric water content. It was selected due of its accuracy, compact design, and low cost. This TDR offers a rapid measurement time of 2 s for water content (pulse generator output: 250 mV into 50 Ω; output impedance: 50 Ω ± 1%), enabling the collection of a substantial number of measurements daily. Additionally, it facilitates non-destructive, long-term, in situ soil measurements. The TDR100 was paired with a TDR probe consisting of a transmission line (RG58, 50 Ω characteristic impedance, 200 cm long, with 0.2 Ω connector impedance) and three rods, 15 cm long, a 3 cm internal distance, and 0.3 cm diameter.
The TDR probes were placed at 15, 25, and 50 cm depths, close to the roots in six locations (two sites for each plot). An additional 15 TDR probes with only a depth of 15 cm were dispersed throughout all treatments to account for the impact of AVSs on the water evaporation from the soil surface. The soil water conditions were evaluated throughout the root zone each morning and afternoon for more accurate irrigation scheduling. The soil water content was maintained between Field Capacity (FC) and a predetermined water depletion threshold during this experiment. Considering the soil type, the FC and Permanent Wilting Point (PWP) values were considered as 33% and 13%, respectively. The allowable soil water depletion was assessed as 30% of the Total Available Water (TAW) in the early stages (up to the flowering) and as 40% in the later stages [21,22]. Therefore, the irrigation was scheduled before the soil water content reached the Readily Available Water (RAW) level, and the refill was performed up to the FC. In drip irrigation, the soil volume in the root zone is only partly wetted and should not exceed 40% [22].
T A W = 1000 θ F C θ P W P   Z r
R A W = p   T A W
where:
  • T A W : the total available soil water in the root zone (mm)
  • R A W : the readily available soil water in the root zone (mm)
  • θ F C : the water content at FC (m3 m−3)
  • θ P W P : the water content at PWP (m3 m−3)
  •   Z r : the rooting depth (m)
  • p : the average fraction of TAW that can be depleted from the root zone before water stress occurs.

2.3.3. Water Productivity

In agriculture, Water Productivity ( W P ) is defined as the ratio between the actual crop yield ( Y a ) and the amount of irrigation water used ( I R w ), expressed in kg/m3 [23].
W P = Y a I R w
where:
  • Y a : the average crop yield of tomato per a specified area (kg)
  • I R w : the average irrigation water used for the same area (m3)

2.4. Physiological and Biometric Measurements

Measuring the instantaneous transpiration and net assimilation of plant cover under natural conditions is of great interest, especially when studying the behaviour of plant cover in response to various environmental conditions. The most common method for measuring plant photosynthesis is based on gas exchange, which is a non-destructive method that provides direct and instantaneous measurements.
An LI-COR LI-6400 Portable Photosynthesis System (LI-COR Inc., Lincoln, NE, USA) was used to determine the net photosynthesis rate and its components, stomatal conductance, leaf temperature, and transpiration rate.
The LI-6400 is an open system where measurements of photosynthesis and transpiration are based on the differences in the carbon dioxide (CO2) and water in the air stream that is flowing through the leaf cuvette. It uses an infrared gas analysis (IRGA) to measure the rate of CO2 uptake and water vapor exchange in leaves. The LI-6400XT consists of two main devices, an analyser console, in which the gas analysis is conducted and conserved in a datalogger, and the sensor head, which has a leaf chamber that controls all microclimate factors (temperature, relative humidity, CO2 partial pressure, and irradiance) [24].
The physiological parameters were measured using the LI-6400 on selected leaves exposed to the sun and free from any signs of diseases or yellowing, on the following dates: June 8th, June 22nd, June 30th, July 7th, July 13th, and July 28th. Measurements were taken at approximately 12 pm to capture the optimal conditions for plant response to the atmosphere, from six plants selected randomly for each treatment.
The LI-COR instantaneous measurement is utilized to represent the measurement context during a specific period of the day, precisely at midday under clear skies. The LI-COR canopy gas exchange system assesses the impact of weather conditions on the instantaneous productivity of a plant. Essentially, measuring phenological parameters at midday is chosen because the system provides a CO2 flux measurement that closely aligns with environmental conditions. This ensures minimal interference with the canopy’s surroundings, and stable weather conditions, particularly a cloudless sky, are typically selected for this purpose.
Moreover, at the end of the crop cycle (August 23rd), six tomato plants from each treatment were randomly collected and separated into shoots (stem and leaves) and roots. The number of leaves for each plant was recorded. Also, the stem diameter using the vernier caliper stem and root lengths were measured with a flexible ruler to the nearest 0.5 mm. Dry shoot and root weights were taken for each plant by placing them in a drying oven at 70 °C for 48 h.

2.5. Yield, Biomass, and Fruit Quality

The tomato yield was harvested during four harvest campaigns, i.e., July 26th, August 1st, August 9th, and August 23rd. Before each harvest, five plants per treatment were randomly chosen, in addition to two sub-treatments in which the plants were cultivated without any cover but irrigated with the same amount of water given to the plants grown under ST (Open ST) and Con (Open Con). During each harvest, the total number of fruits, as well as the number and weight of the ripened ones, per plant, were calculated. Furthermore, the diameters of the fruits were measured using a vernier caliper. The fruits were harvested at full maturity corresponding to the red stage (more than 80% red colour) and sorted by eliminating green, cracked, or with symptoms of blossom-end rot, sun scald, or damaged by tomato fruit-worm.
Immediately after harvest, fifteen homogeneous fruits were randomly selected from each treatment (five tomatoes per replicate) for a quality analysis. Colour was determined according to D’Aquino et al. [25], using a colourimeter (Minolta CR 400 Chroma Meter, Osaka, Japan). The CIE L* (lightness, 0 = black, 100 = white), a* (redness–greenness), and b* (blueness–yellowness) values were recorded through two measurements made on both sides of the equatorial zone per each fruit. A specific Colour Index (Equation (5)) was selected as the most appropriate indicator of tomato ripening, as reported by several authors [26,27].
C o l o u r   I n d e x = 2000   a * L * a 2 + b 2
The fruit firmness was determined using a digital penetrometer (TR Scientific Instruments, Forli, Italy), equipped with an 8 mm plunger tip, at the fruit’s equator (two readings on both sides were taken for each fruit). The results are expressed in newtons (N).
All chemical analyses were performed for each treatment in triplicate from juices at 25 °C. The juices were obtained from five samples of about 200 g per replicate and this was achieved by homogenizing with a domestic homogenizer fruit. Analyses were carried out on the supernatant of the juice centrifuged at 13,000× g for 10 min. The pH was determined using a pH meter (Crison Basic 20, Modena, Italy); the total soluble solids (TSS) were analysed using a pocket refractometer (Atago, Tokyo, Japan) and expressed as °Brix; and the titratable acidity (TA) was evaluated according to AOAC method 942.15 by titrating 5 mL of a tomato juice sample with 0.1 M sodium hydroxide to an endpoint of pH 8.1, which was expressed as a percentage of citric acid [28]. The maturity index was given as the ratio of SSC:TA.
Finally, for the determination of water (WC) and dry matter (DM) contents, five tomatoes per treatment, cut into slices, were dried in a ventilated oven at 55 °C until they reached a constant weight (about 48 h). The WC and DM were calculated using Equations (6) and (7), respectively, and expressed in percentage [29].
W C = 100 × F r e s h   w e i g h t D r y   w e i g h t F r e s h   w e i g h t
D M = 100 × D r y   w e i g h t F r e s h   w e i g h t

2.6. Statistical Analysis

All data were subjected to an analysis of variance (one-way ANOVA) using Minitab 19 (Minitab Inc., State College, PA, USA). The Tukey test accomplished means’ separation at a p ≤ 0.05 significance level.

3. Results and Discussion

3.1. Weather and Soil Data

The weather data were collected from the CIHEAM Bari weather station from May 8th to August 28th, 2023. This particular year was characterized by an exceptionally hot summer. Throughout the four-month experiment, the accumulated precipitation amounted to around 85 mm, and air temperatures ranged from 15 °C to 25 °C during the initial stages. However, temperatures peaked in July to reach 43 °C, coinciding with significantly elevated evapotranspiration rates, reaching 10 mm per day (Figure 2a). The elevated air temperature directly impacted the average daily soil temperature, as illustrated in Figure 2b, which shows a significant difference between the soil temperatures in the open field and under the AVSs. Under the AVSs with 50% shading, the soil temperature was approximately 1.3 °C lower on average than that in the open field. Furthermore, when the shade levels increased to 80%, the soil remained even cooler than in the open field, with a reduction of 2.3 °C. It is worth noting that the shading degree significantly influenced the soil temperature, while no significant differences were found between ST and Con. These findings support the notion that the soil under AVSs heats up slower than in open conditions, supporting earlier research findings [6,30]. Marrou et al. [31] similarly observed substantial reductions in soil temperature under AVSs, ranging from −0.5 °C in irrigated lettuce to −2.3 °C in wheat compared to open conditions. This cooling effect could be particularly advantageous, especially during the summer months.
The recorded data from the LI-COR measurements at the leaf level provided insights into the incoming solar radiation and Photosynthetically Active Radiation (PAR). The latter refers to the part of electromagnetic radiation (usually measured in the spectral range from 400 to 700 nanometres) that plants can use as a source of energy for photosynthesis. It was observed that, for all measurements (Figure 3a), the incoming solar radiation decreased significantly under the AVSs, particularly under the Con panels and ST80%. Looking at the statistical analysis for all six measurements (Table A1 and Figure A1a), it is clearly shown that there was a significant difference between the Open and AVS conditions. Interestingly, there was also a significant difference between ST50% and the other treatments under the AVSs. There was a remarkable decrease of 55% in solar radiation in ST50% and of up to 86.5% for the other treatments (under AVSs) compared to the Open.
This decrease in solar radiation had a direct impact on the PAR, with similar remarks indicated in Figure 3b, Table A1, and Figure A1b, where the reduction was approximately 52% under ST50% and even more substantial, up to around 94%, in the other treatments. These findings align with prior research that has investigated light reduction and noted variations ranging from 12% to 85% based on the density and layout of the AVS installation [31,32,33]. In a similar context, Weselek, Bauerle, Hartung, Zikeli, Lewandowski, and Högy [6] investigated the impact of AVSs on microclimate, and revealed that the daily mean PAR underneath these systems experienced a 30% reduction over two consecutive years.

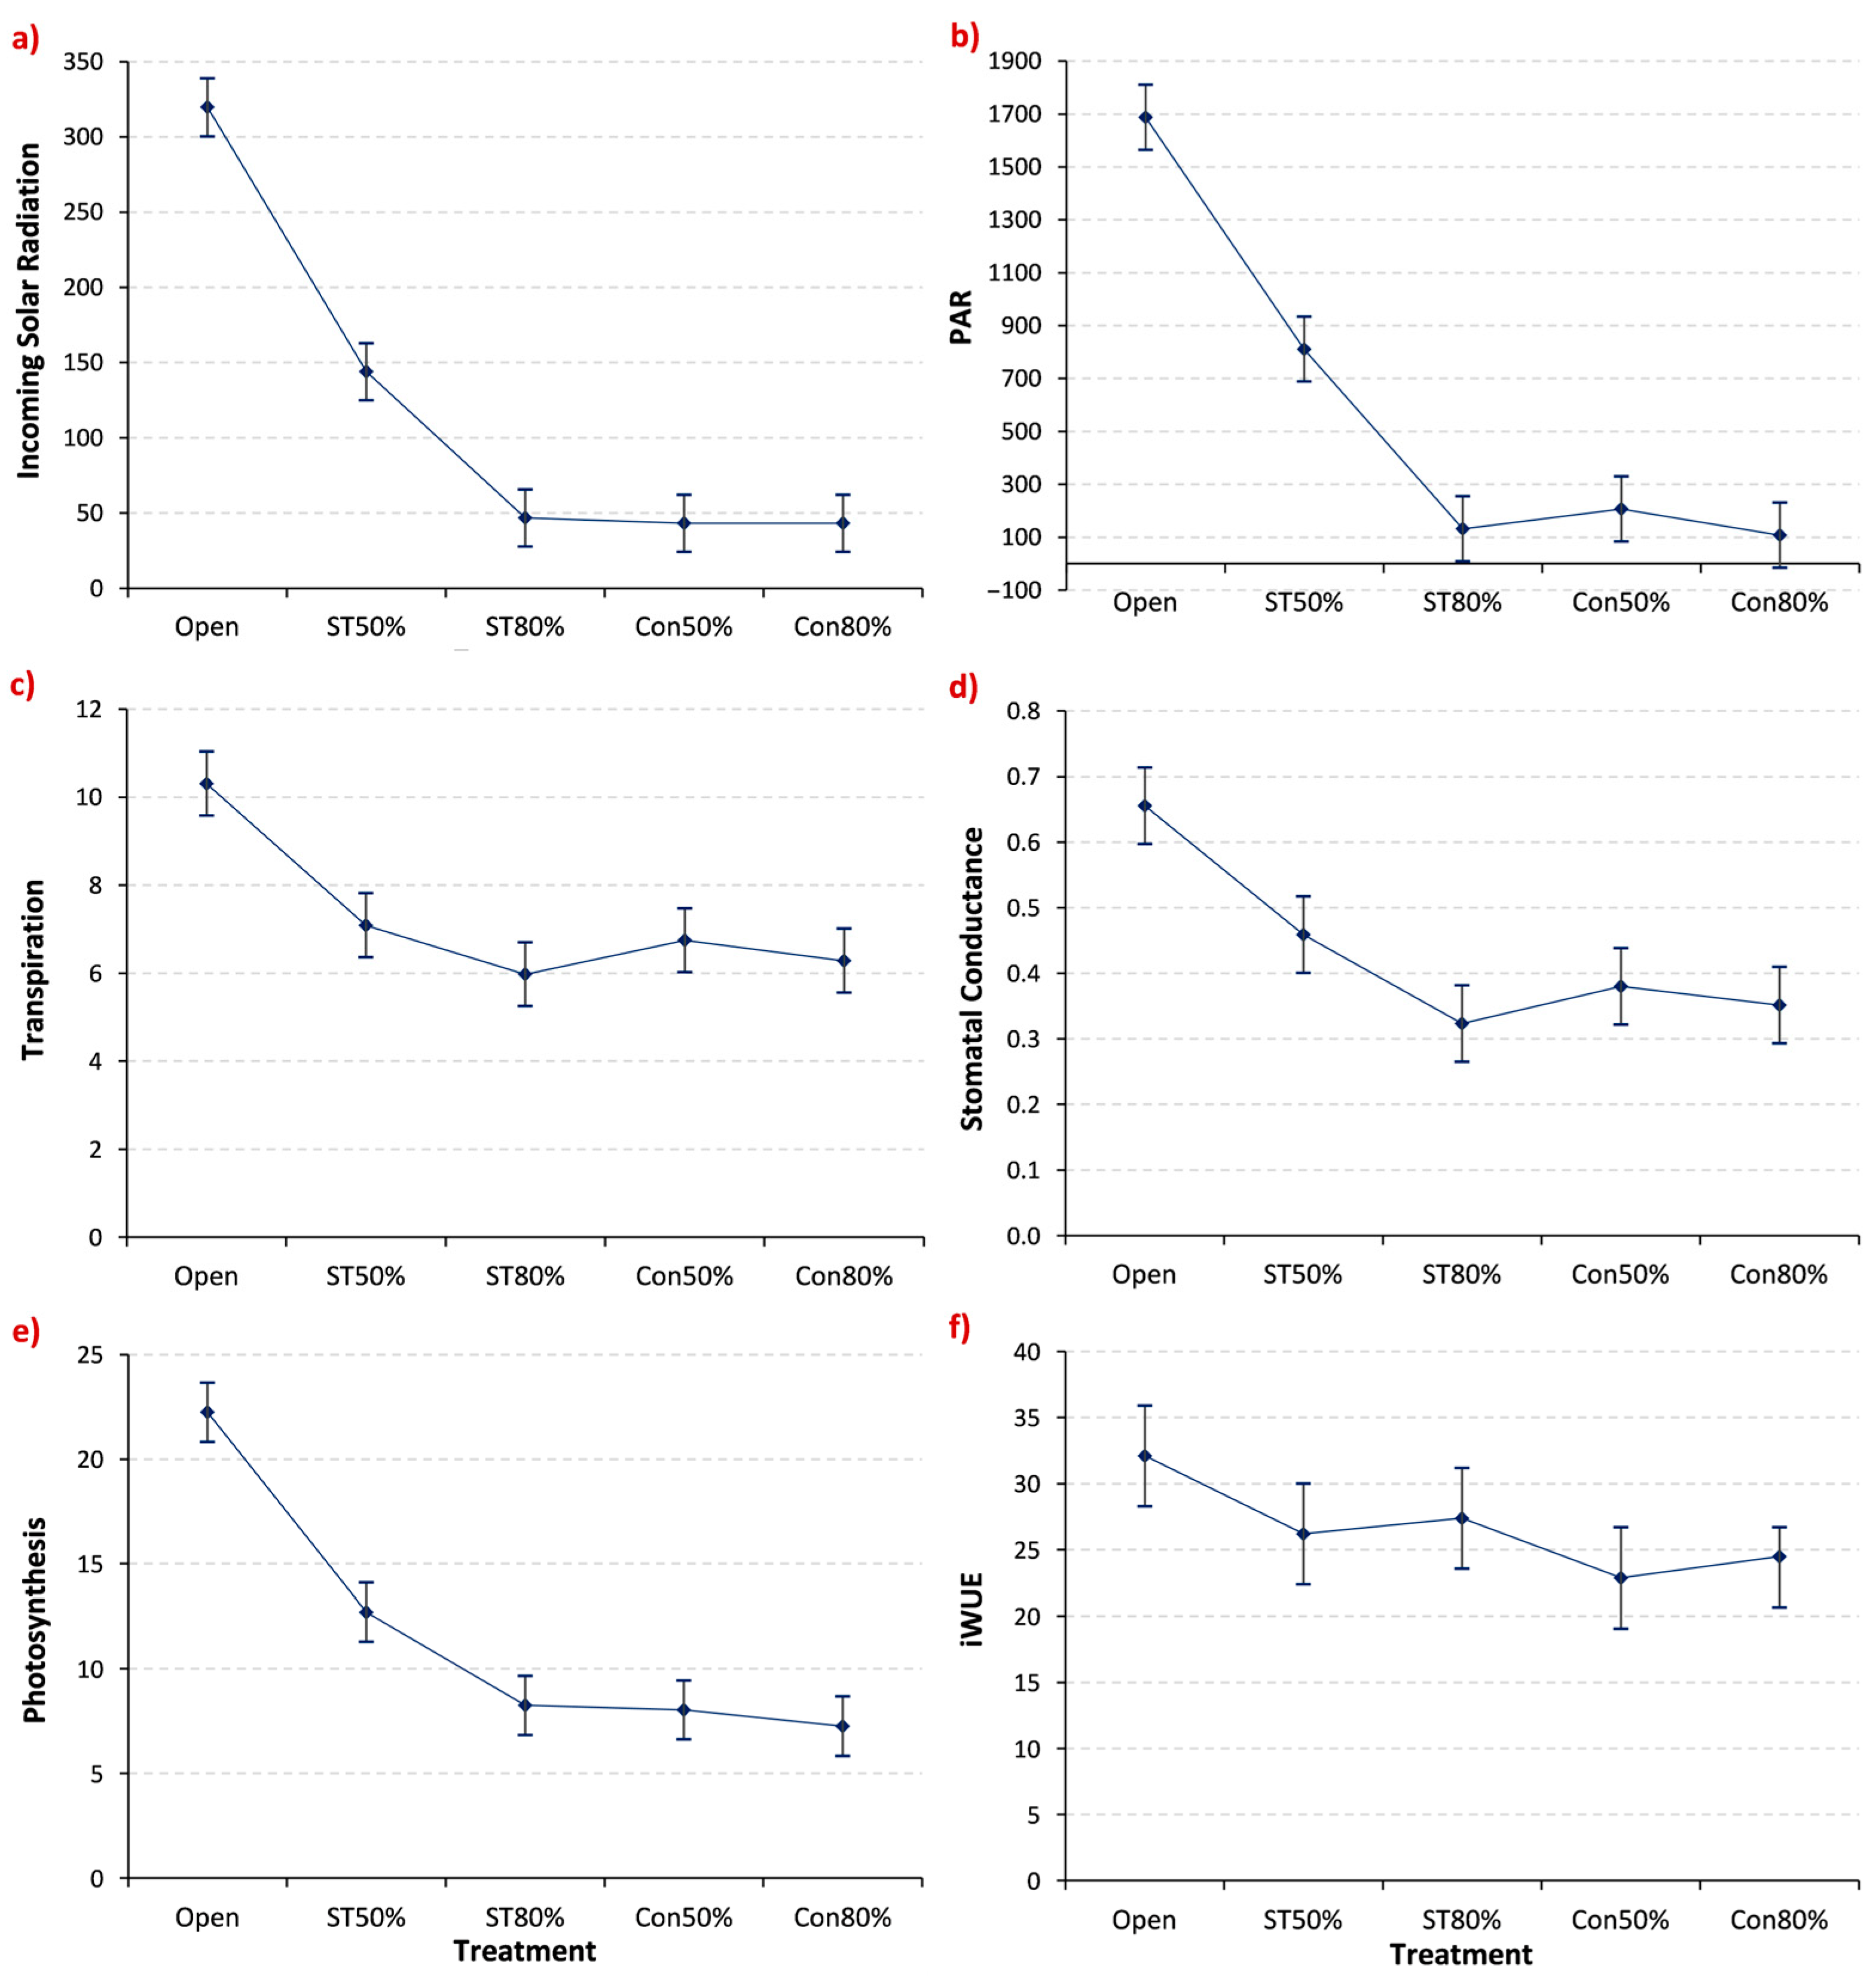
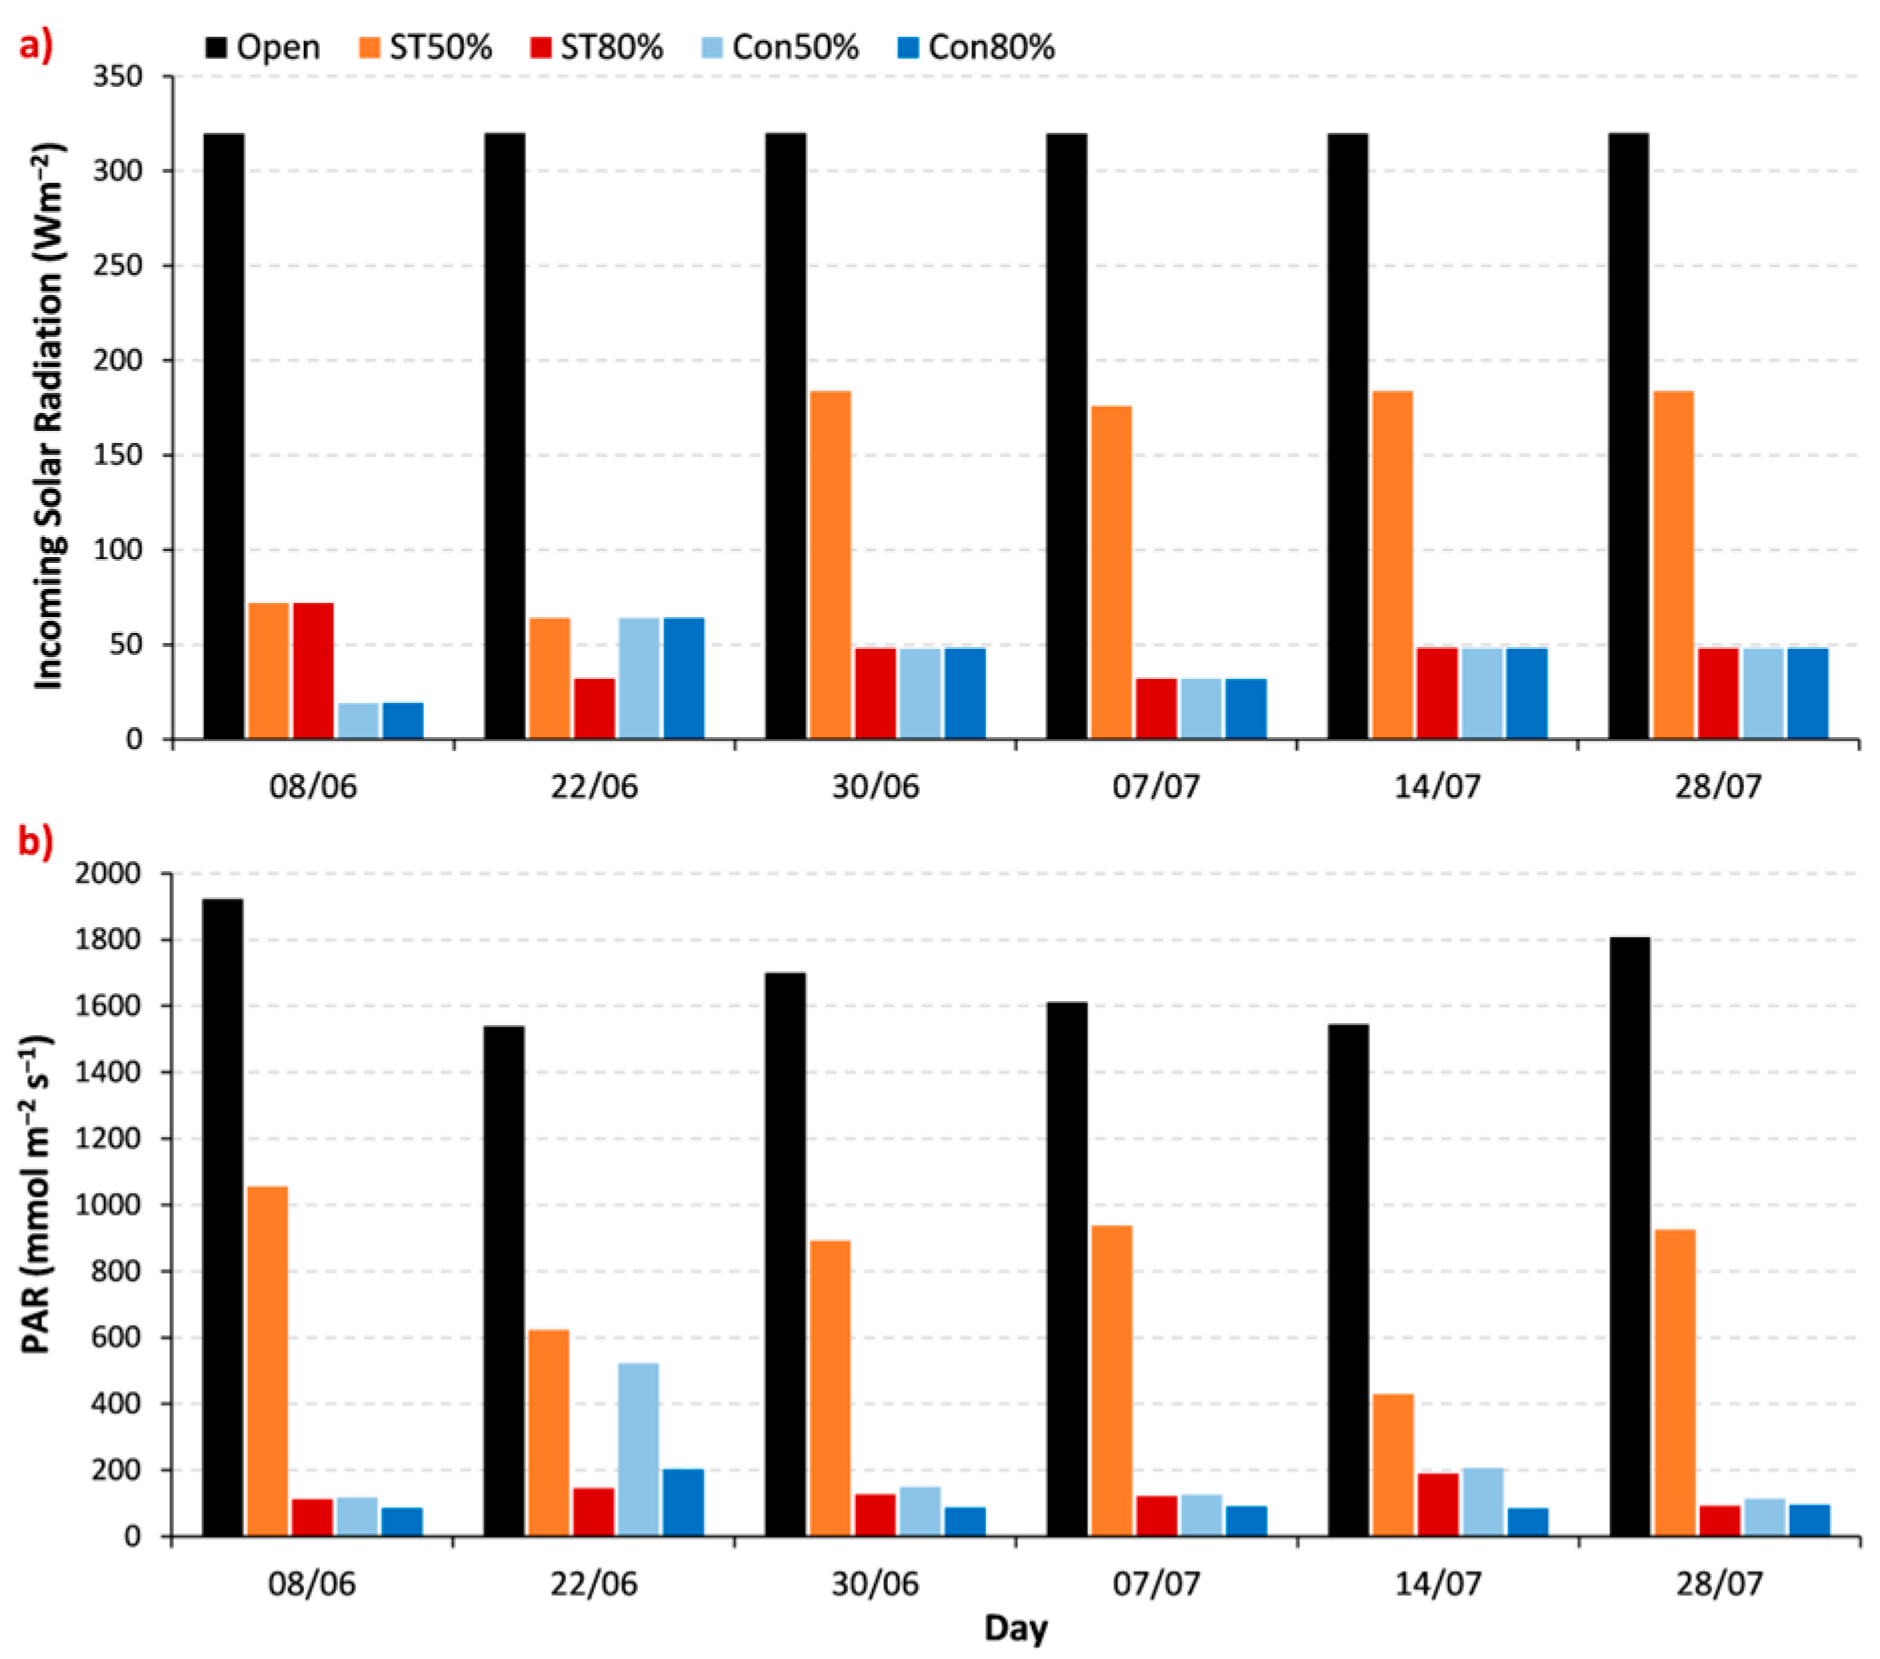
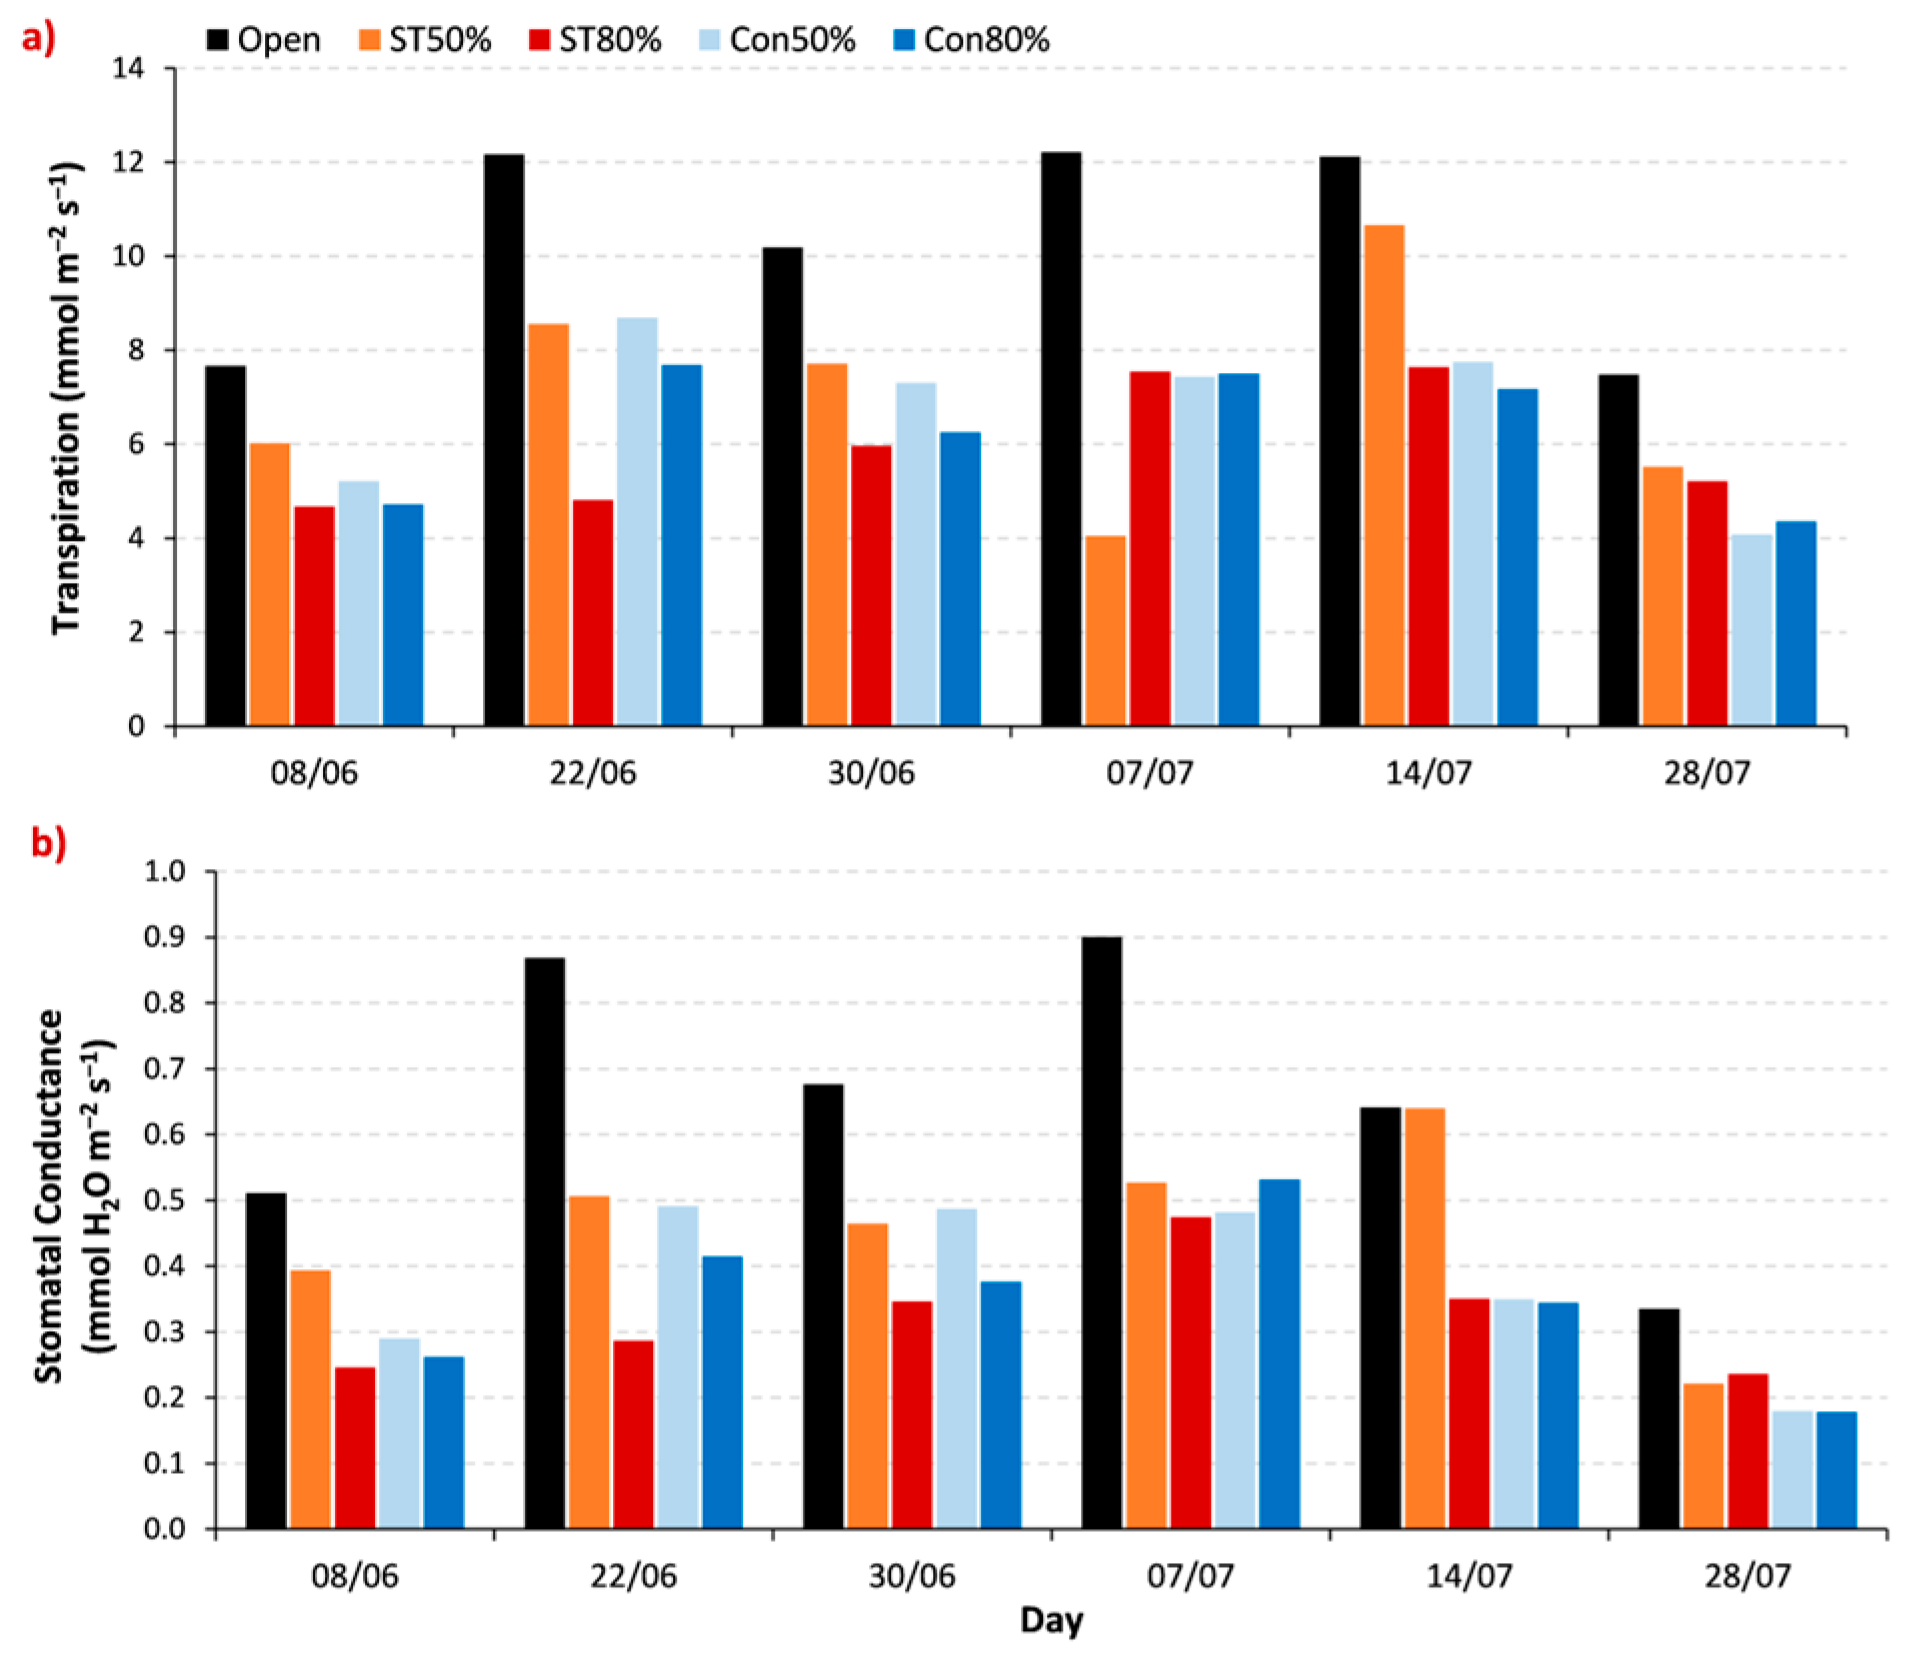
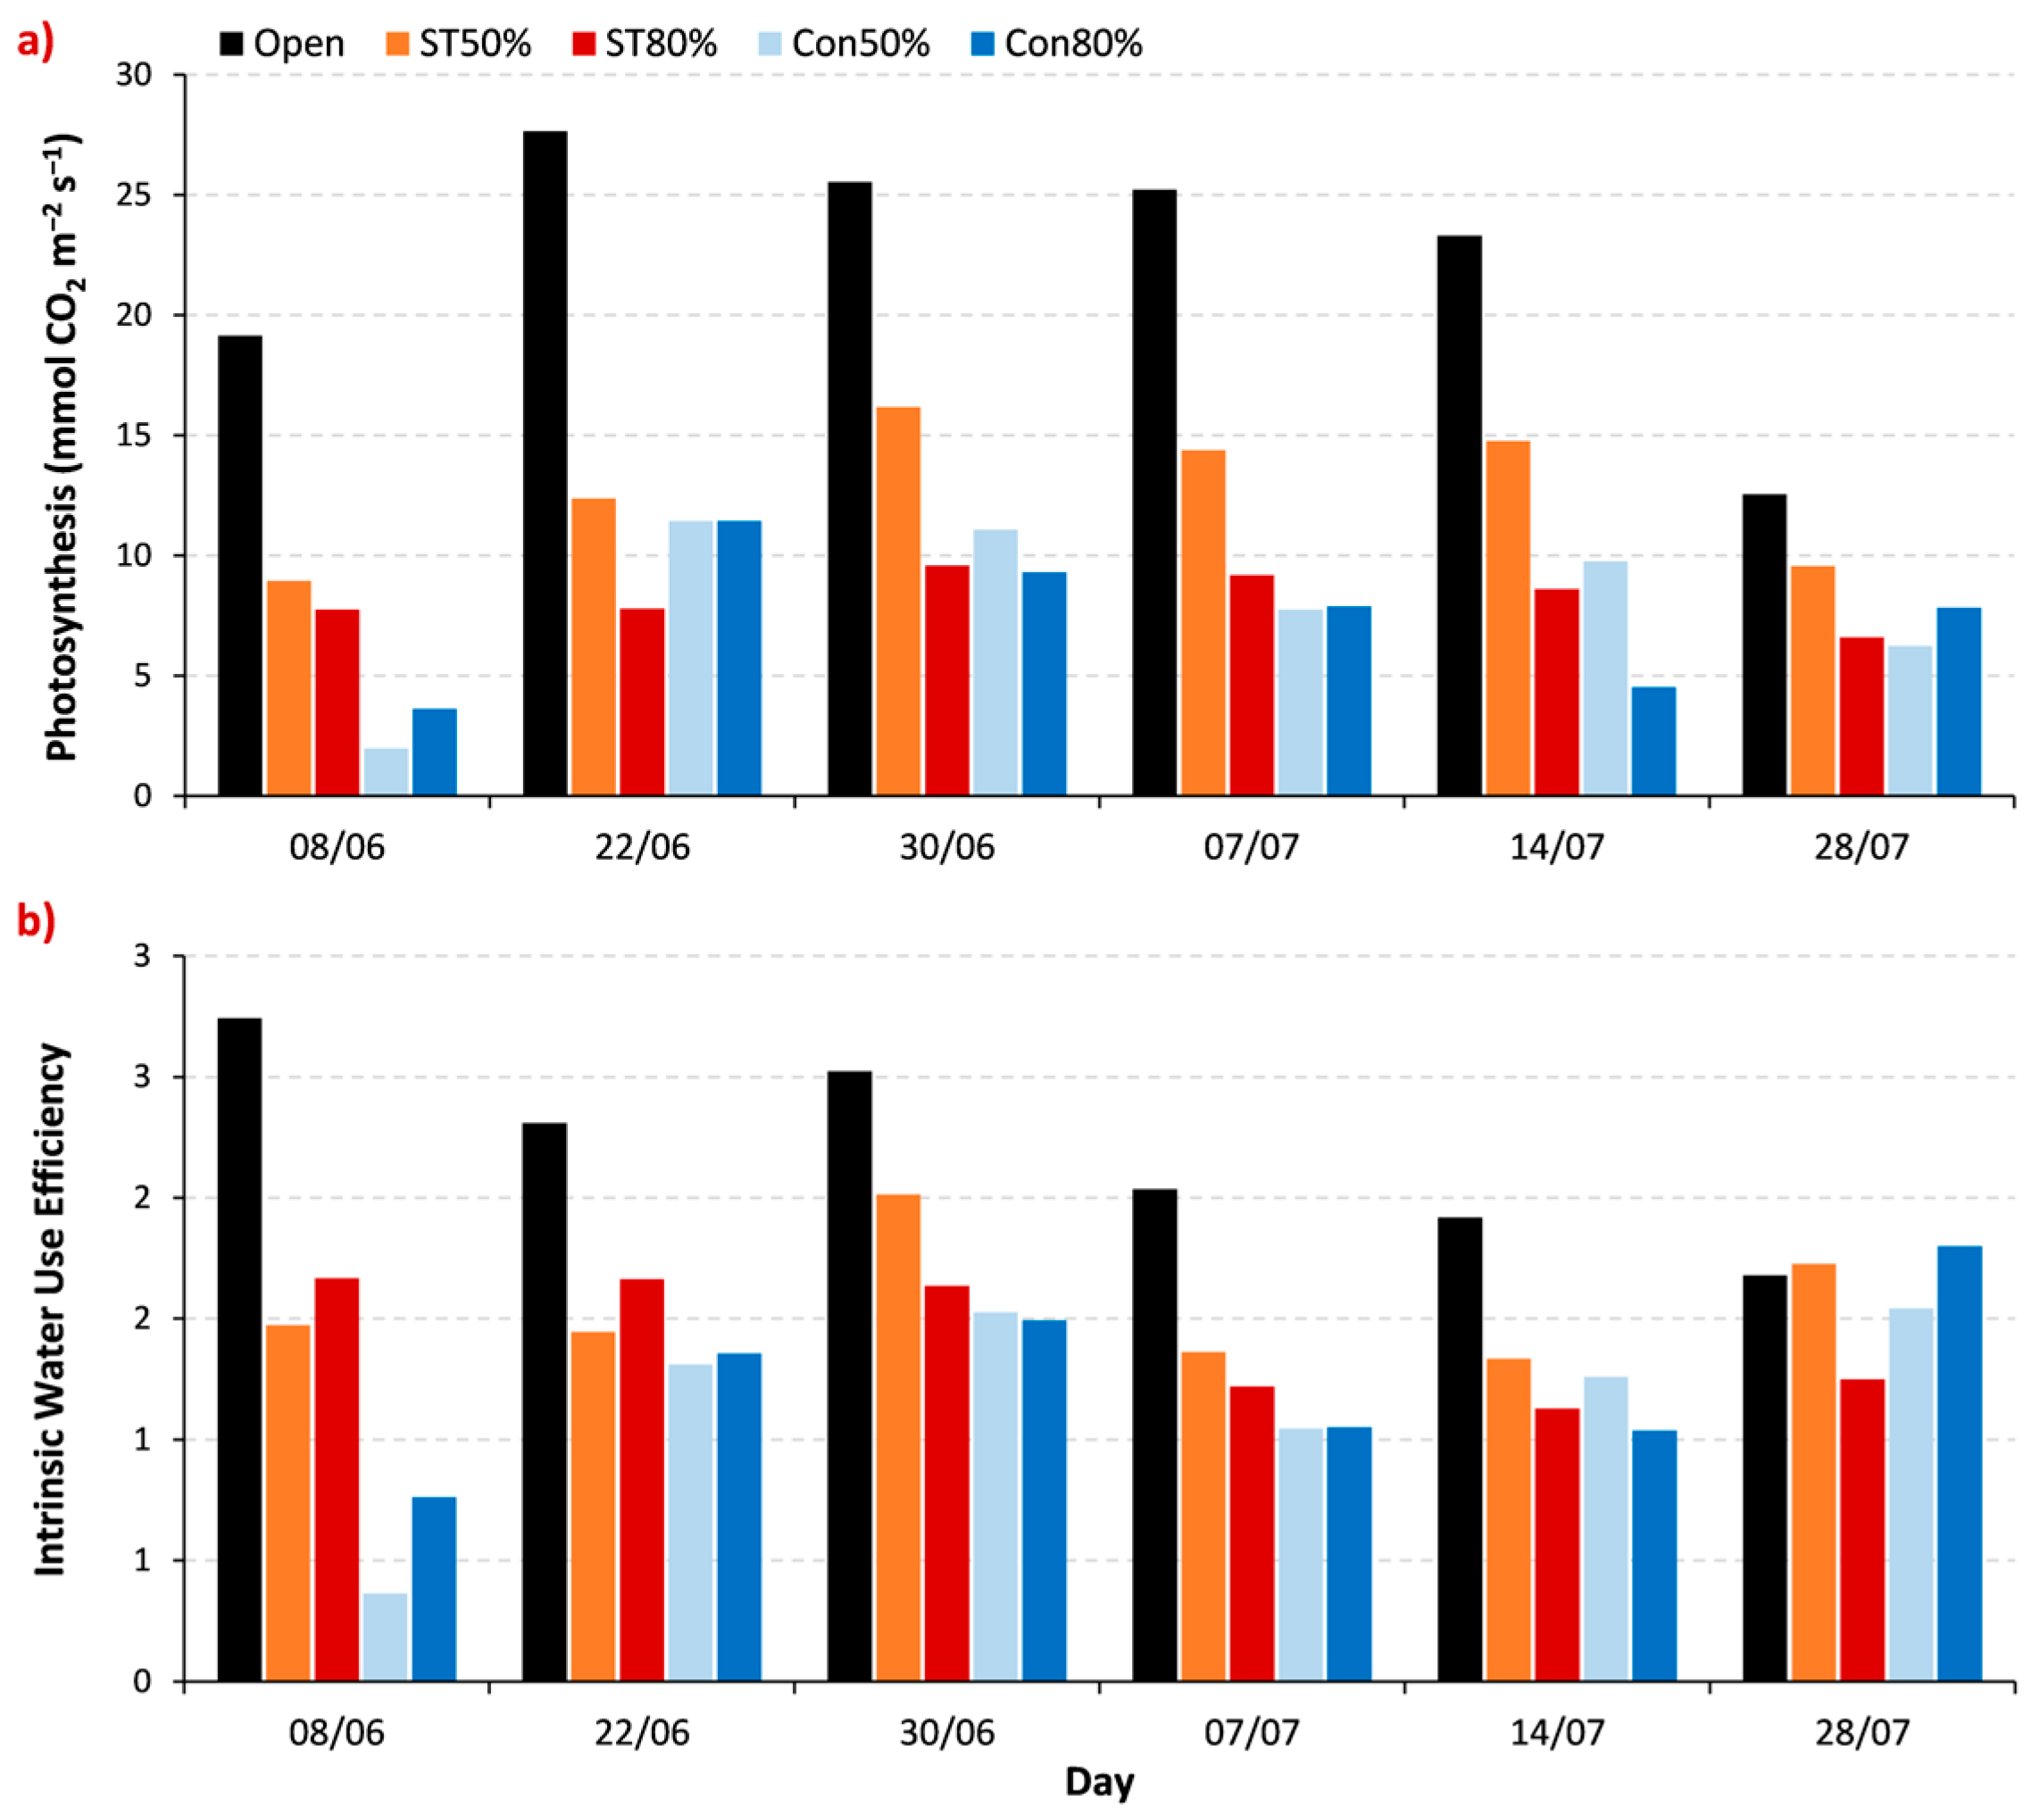
3.2. Physiological Parameter

Under reduced light conditions, the transpiration and stomatal conductance exhibited significant reductions compared to in open conditions. The extent of this reduction varied depending on the shading degree, as illustrated in (Figure 4a,b). Considering the statistical analysis for all measurements (Table A1 and Figure A1c), there was a significant difference in the transpiration rates between the Open treatment and all the other treatments underneath AVSs, with a reduction ranging between 31 and 42% compared to the Open. However, there was no significant difference between the treatments under the Con and ST panels.
Similar trends were observed in terms of the stomatal conductance, with reductions ranging from 30% to around 51% (Table A1 and Figure A1d). Unusually, there was a significant difference between ST50% and ST80%. These reductions in both parameters can be attributed to the reduced light intensity under AVSs, which is directly linked to the transpiration rate and stomatal conductance.
Given the strong correlation between photosynthesis and PAR, it is important to note that photosynthesis was significantly reduced under the AVSs when compared to the open conditions, except for the measurement carried out at the end of July, i.e., the last stages of the growing period (Figure 5a). When looking at the statistical analysis, it is clearly indicated that there was a significant difference between the Open treatment and the ST50% on one hand, and between the Open, ST50%, and rest of the treatments (ST80%, Con50% and Con80%) on the other hand, as shown in Table A1 and Figure A1e. This is indicated by a reduction in the photosynthesis rate, ranging from 43% (ST50%) to 67% (Con80%), compared to the Open.
The levels of the photosynthesis rate and the transpiration rate also impacted the intrinsic Water Use Efficiency (iWUE), which is defined as the ratio of photosynthesis (carbon assimilation) to transpiration [34]. In other words, it quantifies how much CO2 a plant can assimilate through photosynthesis for a given amount of water it loses through transpiration. Therefore, iWUE measures how effectively a plant utilizes water to perform photosynthesis and grow, i.e., higher iWUE values indicate that a plant can produce more biomass or yield for a given amount of water consumed.
Figure 5b shows that this ratio was higher in the Open treatment compared in to the AVSs, indicating more efficient water use. However, at the end of the cycle, the measurement showed a reduction in the iWUE in Open due to the fact that, underneath the AVSs, the shade extended the growing cycle of the plants. When looking at the statistical analysis results (Table A1 and Figure A1f), it is indicated that there was a significant difference between the Open treatment and the ST, with a reduction in iWUE ranging from 29 to 35%. Additionally, there was a significant difference between the Open treatment and the Con, with a reduction in iWUE ranging from 43 to 47%. It is worth mentioning that there was also a significant difference between the ST and the Con treatments. This indicates that the type of solar panels (opaque and semi-transparent) considerably impacts iWUE.

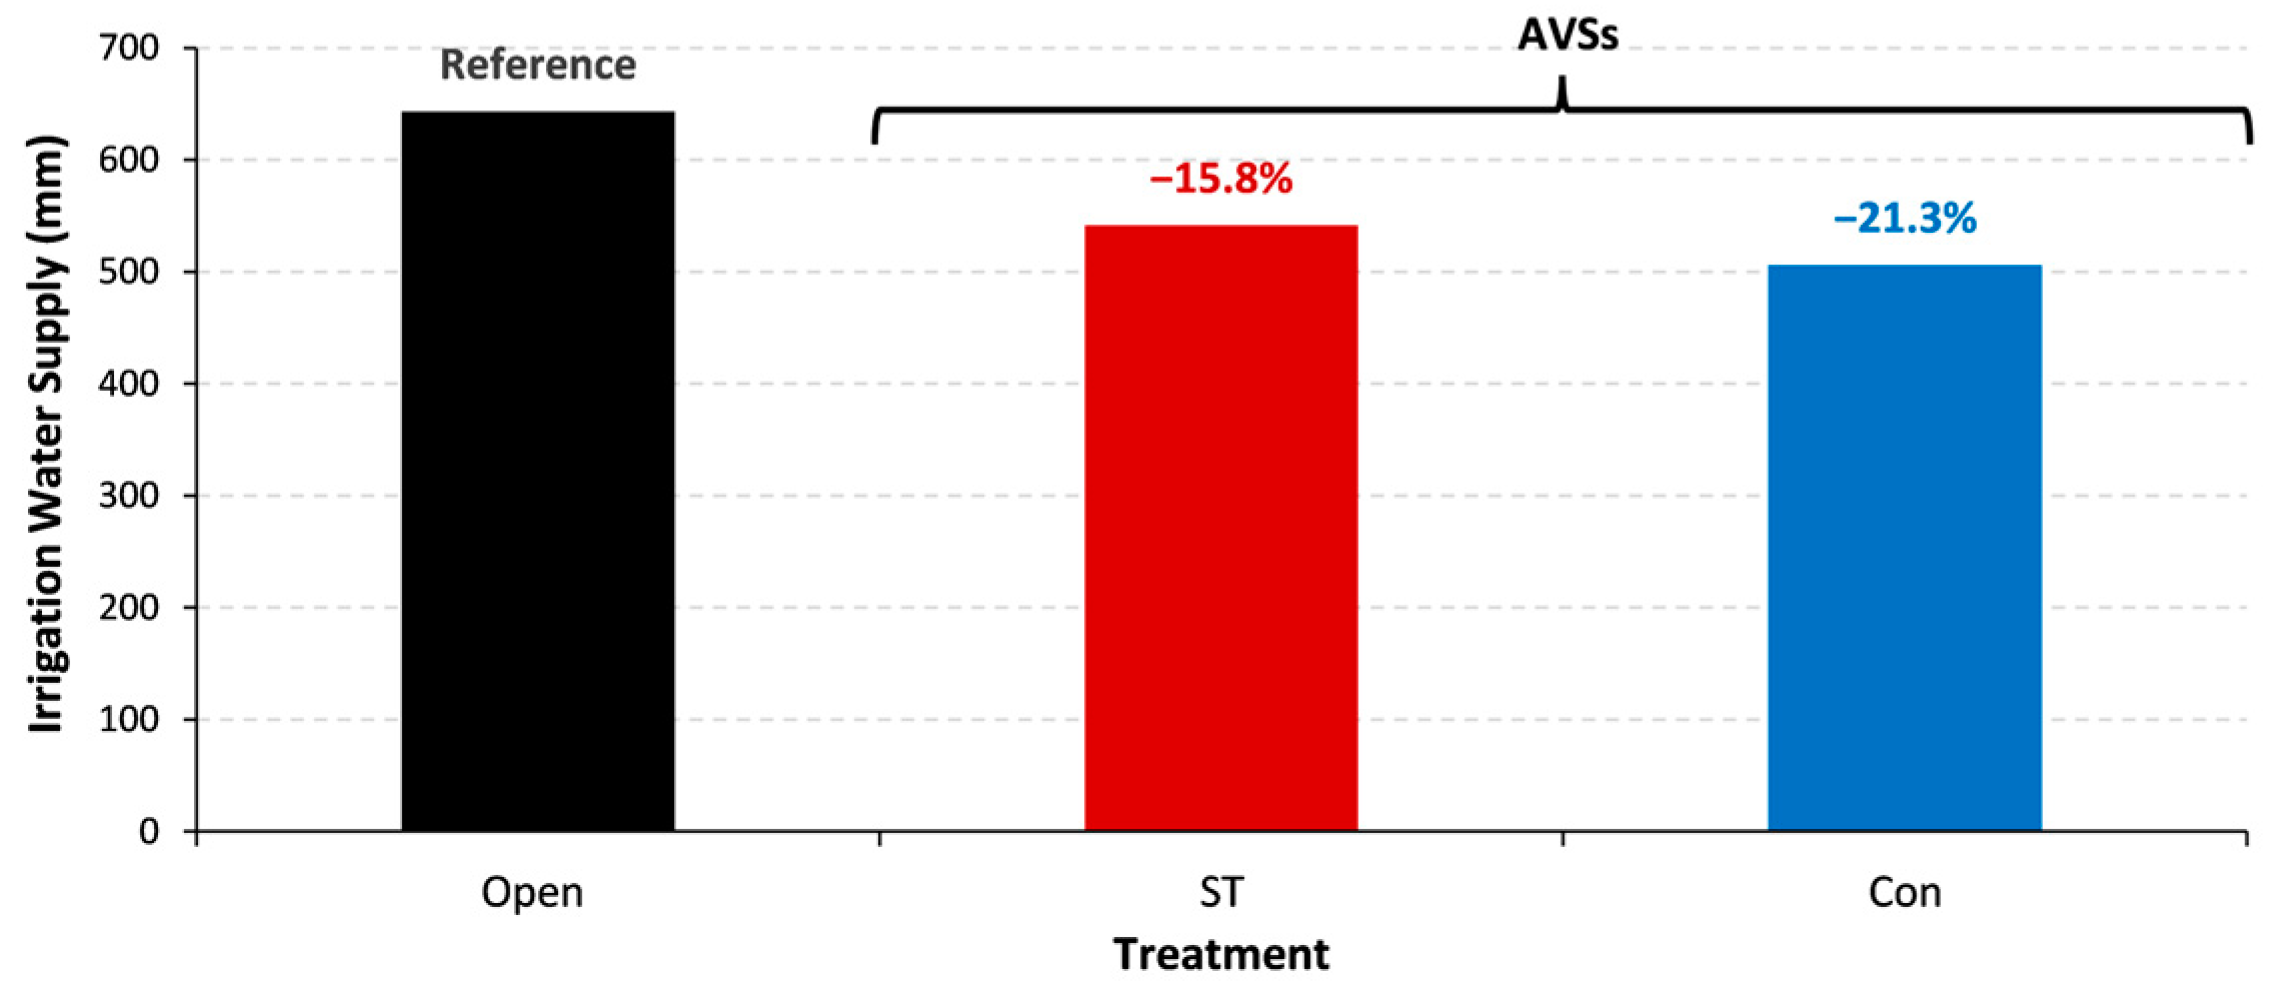
3.3. Irrigation Water Supply

The irrigation schedule was arranged in a way that maintained the soil water content within the range of the FC and a predetermined allowable depletion threshold (30% of the soil’s available moisture in the early stages and 40% in the later stages). This resulted in an almost daily irrigation frequency (refill soil to FC).
The measurement of the amount of irrigation water confirmed that shading affected the plants’ physiological parameters and influenced the amount of irrigation water supplied to the crops under the AVSs. Despite providing the crop with the amount of water equal to its water requirement, the irrigation water demand under the AVSs was less than that in the open field, as illustrated in Figure 6, with a reduction of around 16% in ST, and it was even lower under Con, reaching over 21%. This was due to reduced transpiration and evaporation rates under the AVSs. These results support the findings of Barron-Gafford, Pavao-Zuckerman, Minor, Sutter, Barnett-Moreno, Blackett, Thompson, Dimond, Gerlak, Nabhan, and Macknick [16], who assessed irrigation water savings in terms of relative soil moisture levels. They concluded that AVSs significantly impacted soil moisture savings, especially when irrigating every 2 days, as the soil moisture remained 15% greater than that in open field conditions.

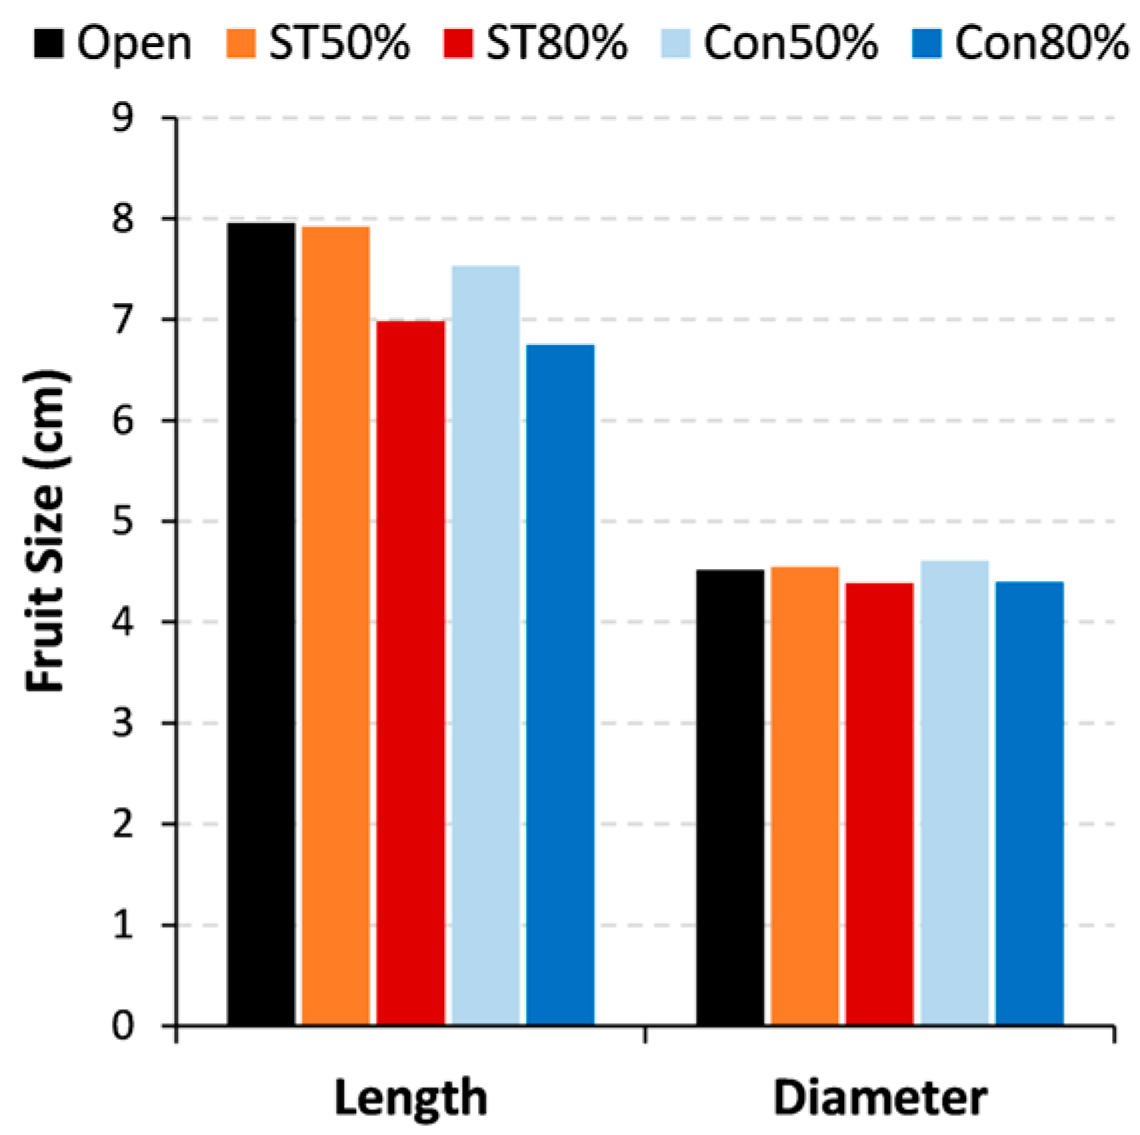
3.4. Effect of Shade on Plant Morphology

The analysis of the impact of the AVSs on the tomato crop morphology (Figure 7) showed that the shoot length of the tomato plants remained consistent across the different shading conditions, i.e., no significant differences were observed between Open, ST, and Con. The average shoot length ranged from 73 cm in Con to 85 cm in ST. Aroca-Delgado et al. [35] found similar results, with no significant difference in plant length between the different shading levels.
However, regarding the stem diameter, significant differences were found between the Open treatment and different shading levels. As the shading percentage increased (ST80% and Con80%), the stem diameter tended to decrease, with no significant differences observed between the two AVSs (ST and Con). This reduction in stem diameter can be attributed to the previously discussed decrease in photosynthesis due to shading.
A similar trend was evident in terms of the shoot dry matter. Significant reductions were observed in the shoot dry matter between the open field conditions and AVSs’ shaded conditions. Moreover, there were even significant differences between the two AVSs, with the ST system exhibiting higher dry matter percentages than the Con system. This difference can be attributed to the reduced transpiration rate, which can impact nutrient uptake.
The length of the tomato plant roots remained unaffected by the presence of AVS shading. No significant differences were observed among the treatments, and the average root length values varied from 36 cm in the Con to 49 cm in the open field conditions. This trend was consistent when considering the dry matter content of the roots, where no significant differences were detected among the treatments.
In summary, while both the plant length and root length exhibited no significant variations, notable differences were observed in the stem diameter and shoot dry matter across the different shading conditions. These differences underscore the impact of the reduced photosynthesis and transpiration caused by AVSs’ shading on these particular plant attributes.

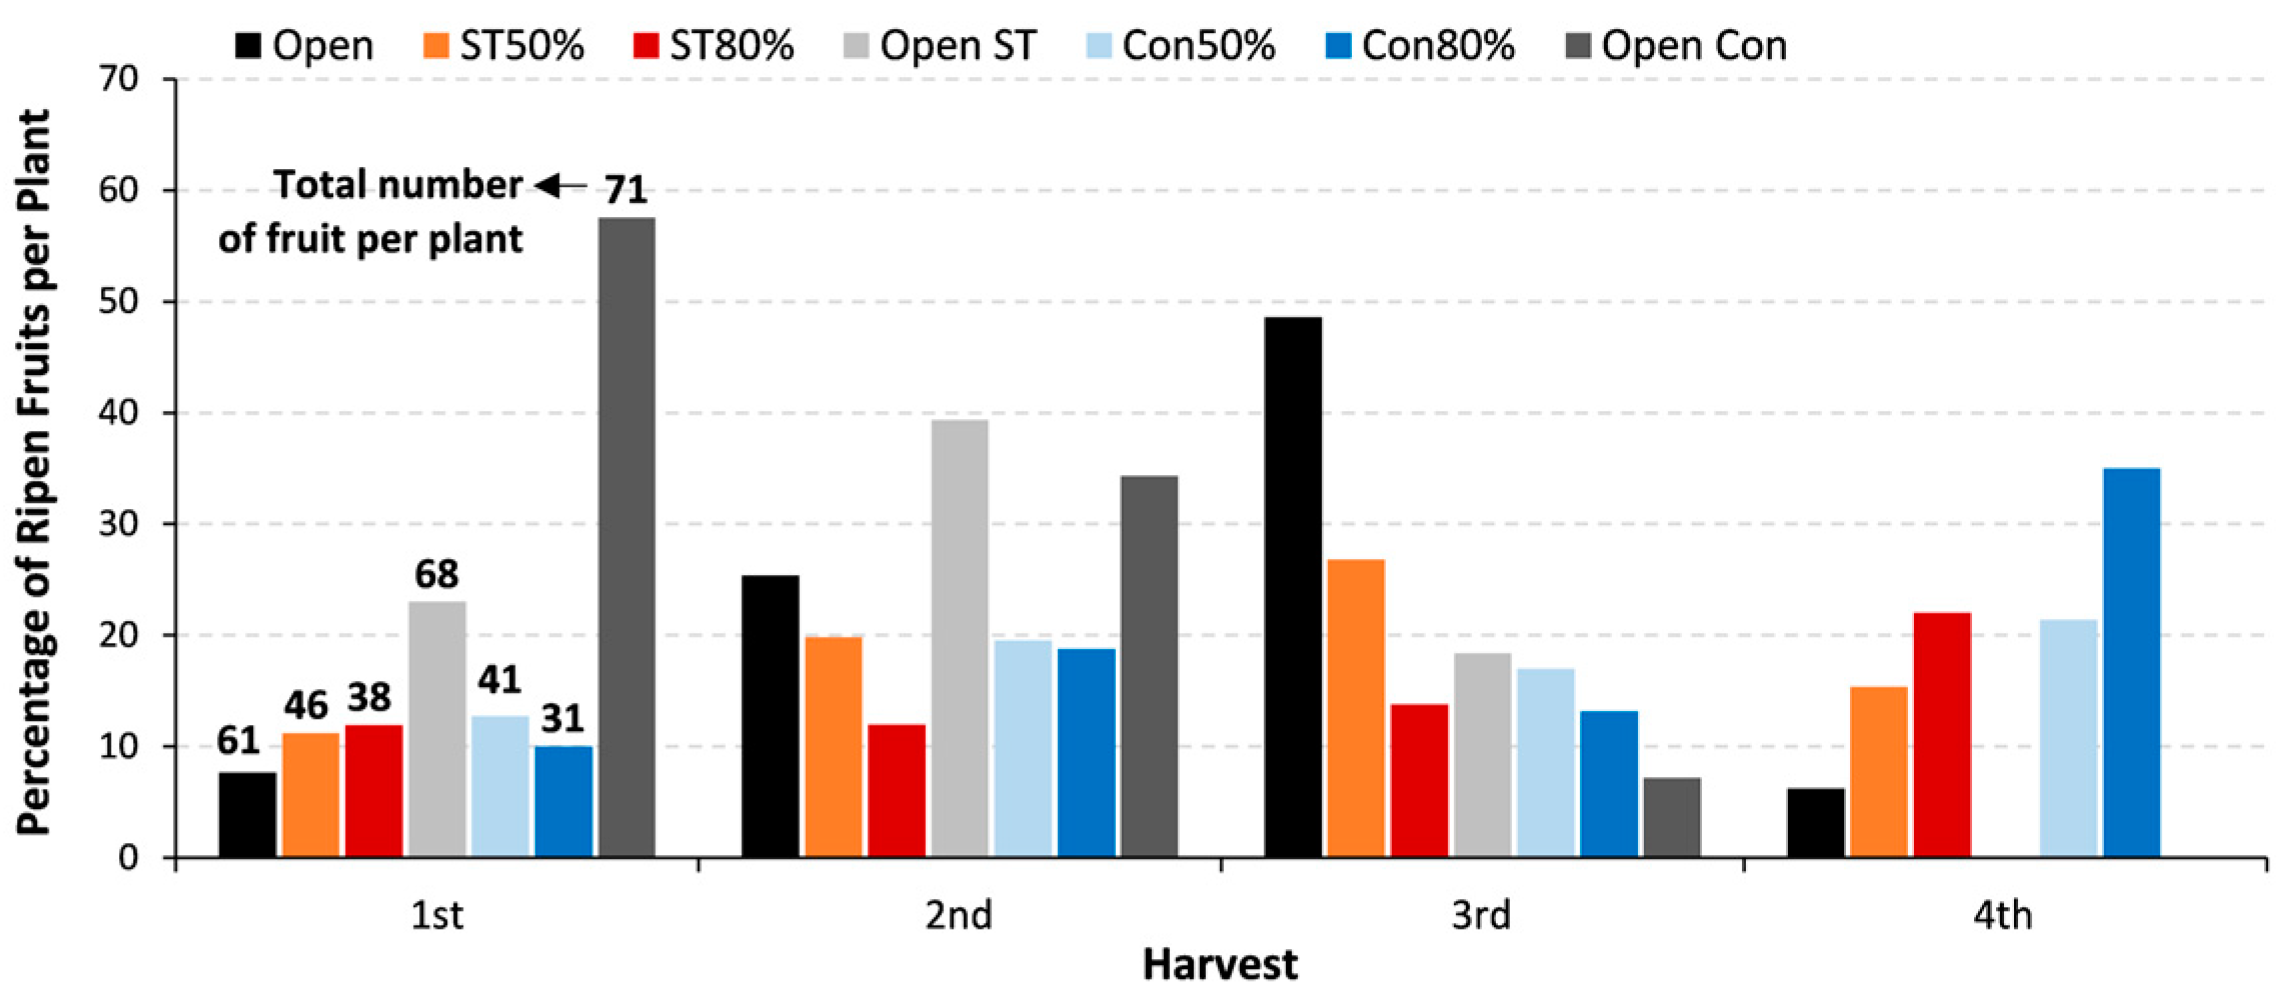
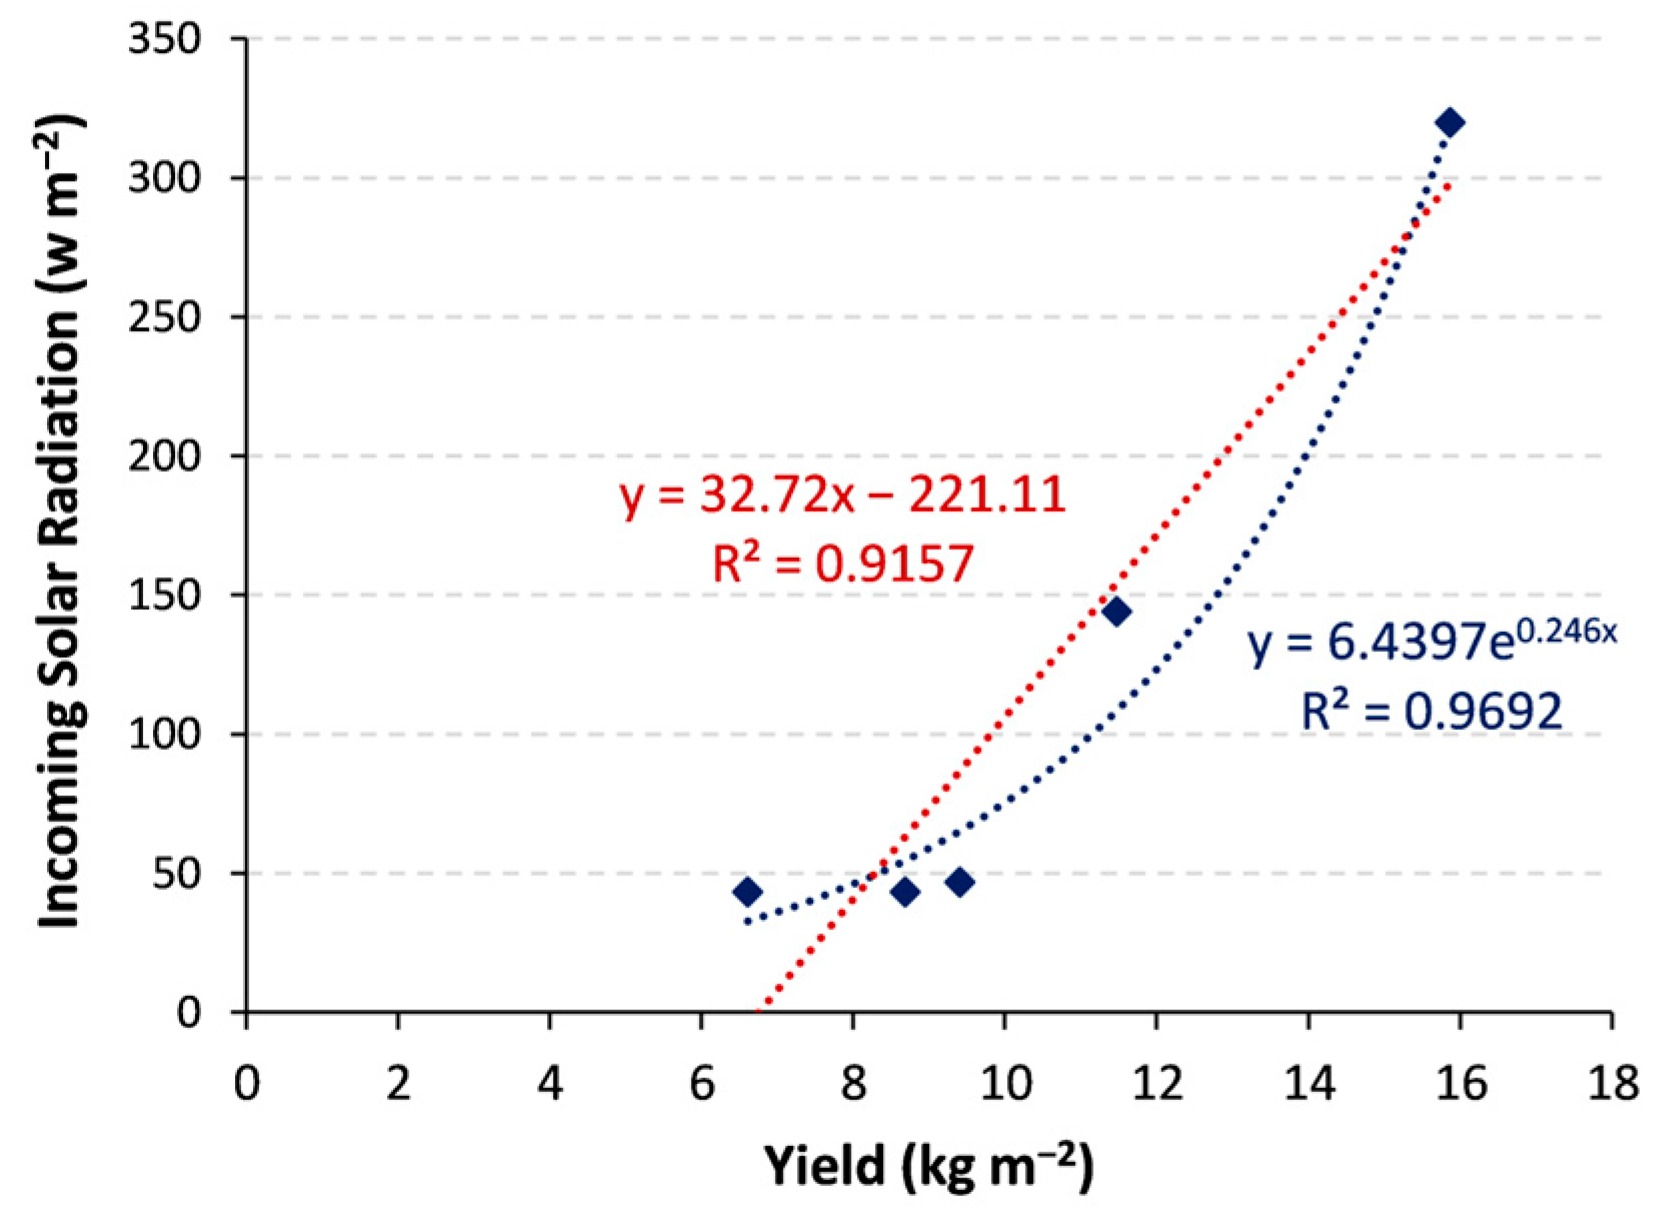
3.5. Effect of AVS on Tomato Crop Yield

For the analysis of the tomato fruit ripening and the harvested yield, an additional two treatments were analysed, namely, (i) Open ST, i.e., plants were located in open field but irrigated with the same quantities of water as the plants under ST AVS (same drip lateral); and (ii) Open Con, i.e., plants were located in open field but irrigated with the same quantities of water as the plants under Con AVS. The number of fruits from randomly selected plants was counted as the total available number of fruits in each selected plant and the number of ripened fruits during each of the four harvests. This analysis aims to evaluate if the AVSs’ impacted fruit development and ripening.
Figure 8 depicts the average percentages of the fruit ripening per plant per treatment during the four harvests. It also shows the average total number of fruits per plant per treatment.
The total number of fruits was affected by both shading and water stress. The latter had an impactful influence, indicated by the highest average total number of fruits in Open Con (71 fruits), followed by Open ST (68 fruits), which was due to deficit irrigation in both treatments with 21.3% and 15.8%, respectively (see Figure 6), less than the irrigation water demand in the open field conditions. Thus, water stress in the initial stages led to the development of many small-sized fruits in the two treatments.
The treatment in Open, which was not under water stress, had a total number of 61 fruits, followed by ST (underneath ST AVS, with no water stress) with a number ranging between 38 (ST80%) and 46 (ST50%). Lower numbers were in the Con treatments (underneath Con AVS, with no water stress), with a number ranging between 31 (Con80%) and 41 (Con50%). Therefore, shading negatively impacted the number and the size of developed tomato fruits.
When considering fruit ripening (see Figure 8), shading and water stress affected the percentage of ripened fruits during the four harvests. Water stress in Open Con and Open ST accelerated the fruit ripening with values equal to around 58 and 23%, respectively, of ripened fruits during the first harvest. The two treatments also had the highest percentages of ripened fruits during the second harvest. However, by the fourth harvest, the tomato plants had wilted, and no fruits were harvested.
For the shading impact, the ripening of fruits in Open started with the lowest percentage (lower than both AVSs) in the first harvest, but increased significantly (higher than both AVSs) in the second and third harvests, reaching around 25 and 49%, respectively. This value dropped to around 6% by the fourth harvest, during which, the plants started to wilt. For the treatments underneath AVSs, the percentage of ripened fruits started to increase during the second and third harvests, with a slower pace, compared to the first harvest. It is worth mentioning that, during these two harvests, the ST treatments had, on average a higher ripening percentage than the Con treatment. However, during the fourth harvest, the extra-shaded plants had a higher percentage of ripened fruits, ranging from 21 to 35% in Con50% and Con80%, respectively, and from 15 to 22% in ST50% and ST80%, respectively.
It can be concluded that water stress accelerated the development and ripening of small-sized fruits until the second harvest. All fruits wilted permanently before the fourth harvest. Contrarily, the shading levels (under AVSs) delayed the development and ripening of the fruits which peaked at the fourth harvest, during which, the plants in the open field started to wilt. This delay corresponds to the results obtained by Elamri, Cheviron, Mange, Dejean, Liron, and Belaud [9], who also observed a slight delay in lettuce development under an AVS. Similar results were also found in the cultivation of blueberries and blackberries under shading, where the shade extended the harvest period [36].
In this study, shading also impacted the fruit size (Figure 9), with fruits from the Open treatment being longer than those from the other treatments. The average values ranged between 6.7 cm in Con80% and 7.9 cm in Open. However, no significant differences were observed in terms of the equatorial diameter. The reduction in tomato size under shade is consistent with findings from previous studies, which have indicated that the extent of size reduction varies depending on the PV installation and available light [35,37,38].
Considering the yield, Figure 10 illustrates the harvested yield during the four harvest campaigns. It shows that the shading induced by the two AVSs resulted in a substantial reduction in yield compared to in open field conditions. The total yield reductions were approximately 27.7% and 40.7% in the ST AVS, i.e., ST50% and ST80%, respectively. This reduction was more evident under the Con AVS, with reductions of 45.3% and 58.3% under Con 50% and Con80%, respectively.
A surprising result is that, for the Open treatments under water stress, particularly Open Con, the total yield reduction (38.5%) was less than that of the shaded treatments with no water stress, particularly ST80%, Con50%, and Con80%. This leads to the conclusion that, in this study, shading had a more impactful influence on tomato yield than that of water stress.
Looking at the yield during the four harvests (see Figure 10), it was observed that the yield in Open was higher than those of the other treatments underneath the AVSs for the three first harvest campaigns. However, for the last harvest, the yield in Open dropped significantly due to the plants’ senescence, i.e., the natural aging process that occurs in plants as they approach the end of their life cycle. The same was observed for the Open Con treatments (−21.3% of irrigation water compared to the Open), where the yield was higher than in the treatments under AVSs (no water stress) for the first two harvests. The yields in both open treatments under water stress (Open ST and Open Con) started declining during the third harvest. Before the fourth harvest, the plants under these two treatments wilted permanently due to water stress. On the contrary, all treatments under the AVSs still provided a considerable yield in the fourth harvest compared to Open, due to the extended growing cycle induced by shading.
The abovementioned results can be attributed to the fact that tomato is known to be a shade-intolerant crop [7] and requires a significant amount of solar radiation compared to other crops. To better understand this relation, regression analyses were carried out for the tomato yield as a function of the average incoming solar radiation at the leaf level. As shown in Figure 11, the regression type with the highest R2 (R2 = 0.9692) value was selected to describe this relationship. Therefore, it can be concluded that the tomato yield increased exponentially with an increase in the incoming solar radiation. This indicates that any decrease in solar radiation negatively influenced the yield.
The reduction in the yield under AVSs in this study aligns with similar studies such as Aroca-Delgado, Pérez-Alonso, Callejón-Ferre, and Díaz-Pérez [35], who investigated the effect of AVSs on tomatoes in a greenhouse setting and concluded that, to avoid yield reduction, the shading should not exceed 9.8%. Similarly, Nangare, Singh, Meena, Bhushan, and Bhatnagar [20], who assessed the impact of shade on tomato yield in a semi-arid region, found that 35% shade led to improvements in tomato quality and yield. However, exceeding 50–75% shade levels had adverse effects and resulted in significant yield reductions.

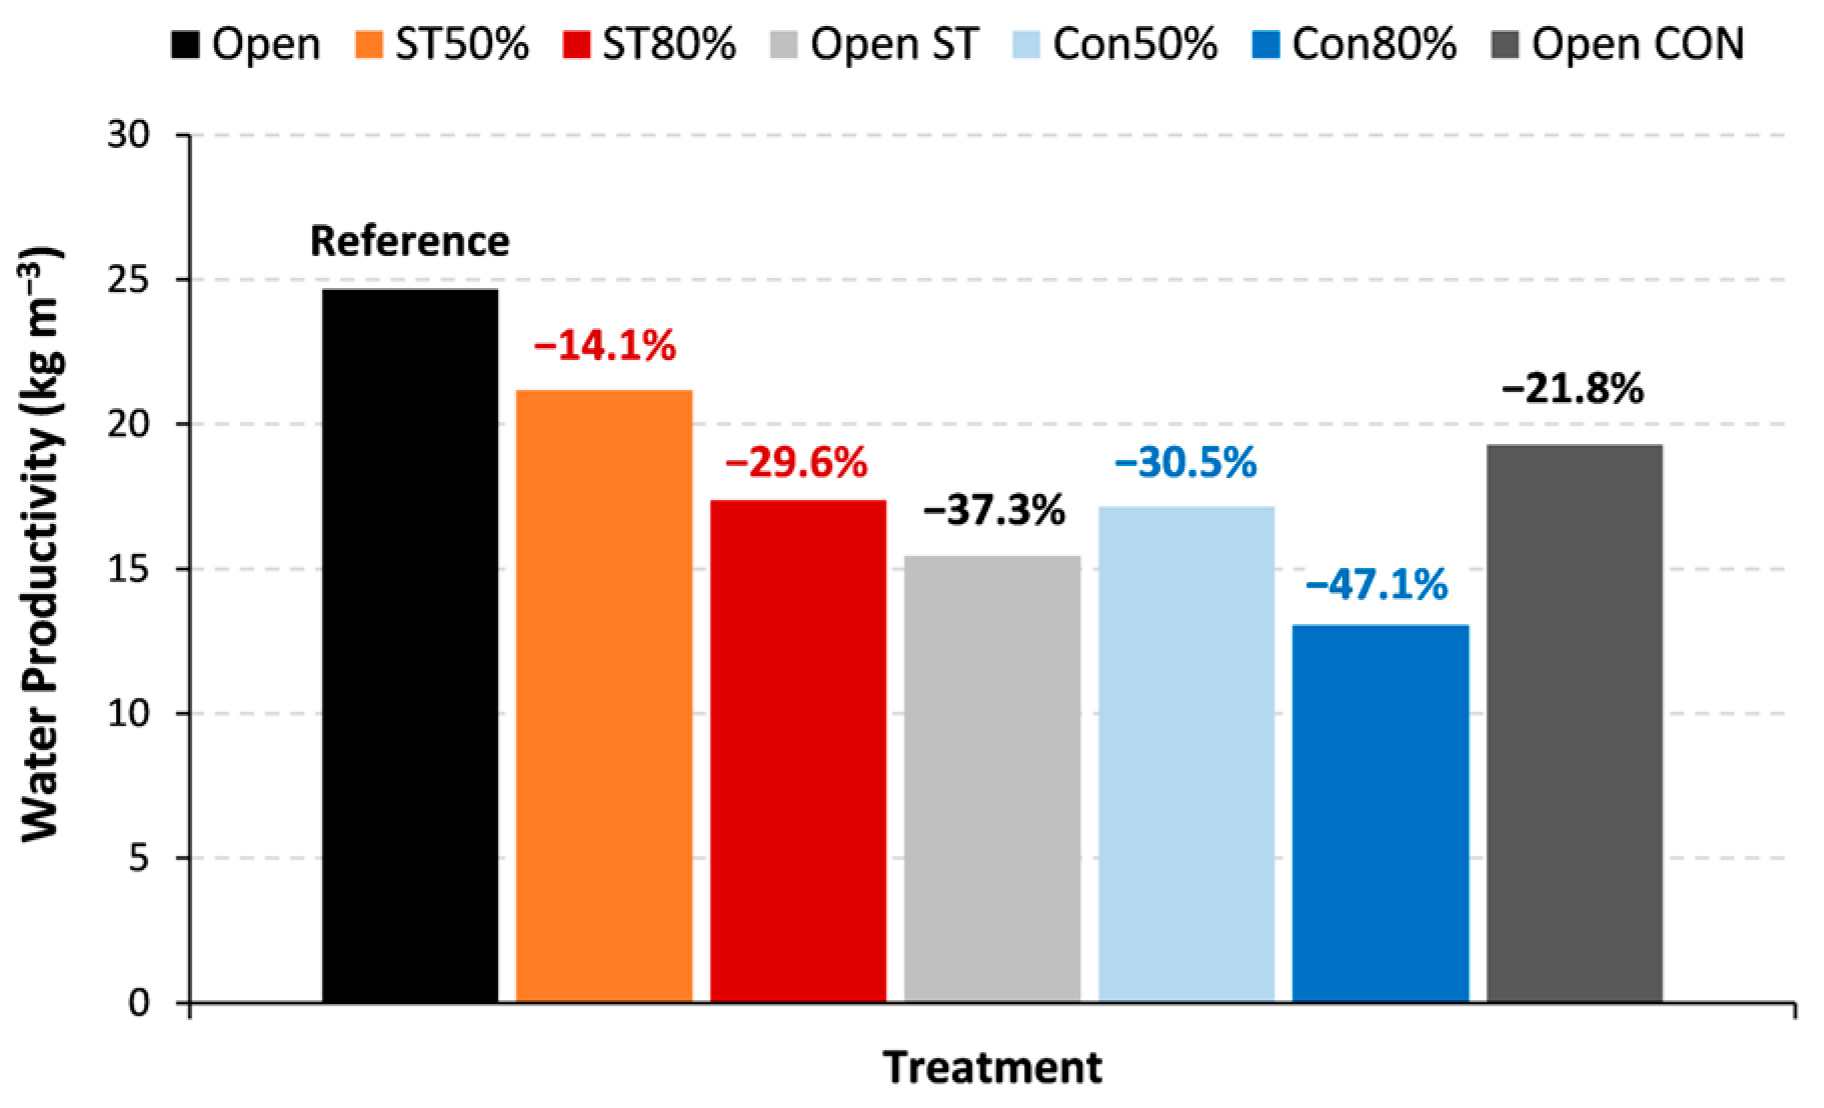
3.6. Water Productivity

The assessment of WP reveals that the Open treatment exhibited the highest values of 24.66 kg/m3. This high value could be attributed to the irrigation scheduling controlled by soil moisture sensors. The result aligns with the observations of Miller et al. [39], who reported a WP of 25.15 kg/m3 for tomatoes under a similar irrigation method.
Figure 12 shows that, as the shading levels increased, the WP started to decline. This reduction ranged between 14.1% in ST50% and 47.1% in Con80%. The type of AVS clearly impacted the WP, as the yield under the ST panels was higher than that of the Con panels. In addition, the WP in Open Con (under water stress) was higher than that of all the treatments underneath the AVSs (no water stress).
This results aligns with the findings of Jiang et al. [40], who investigated the impact of AVSs on kiwifruits in southwest China. They noted that excessive shade over 19% coverage led to a significant reduction in WP. On the contrary, Al-agele et al. [41] indicated the potential to improve AVSs, even for shade-intolerant crops. Elamri, Cheviron, Mange, Dejean, Liron, and Belaud [9] also reported a slight increase in the WP of lettuce under AVSs. All these findings underscore the conclusion that the WP under AVSs responds dynamically to shading levels, irrigation scheduling, and the specific crop under consideration.

3.7. Effect of AVS on Tomato Quality Attributes

The extent of the AVSs’ shading partially impacted the overall quality of the tomato crops. Higher shade levels resulted in a notable decrease in fruit dry matter content, particularly in ST80% and Con80%, with reductions of 21 and 18%, respectively, compared to Open (around 7%), as shown in Table 2. This difference can be attributed to the lower photosynthesis rate under high shade compared to open conditions. However, the DM increased significantly in the fruits under Con50% compared to the Open field. A similar finding was reported by Abdel-Mawgoud et al. [42] in tomatoes with 30% shade; the total dry matter decreased, but improved the commercial quality of the fruit.
Conversely, when considering water content, the results indicate a higher water content in the fruits under the AVSs compared to those grown in Open. The increase was inversely correlated with the transpiration rate under the AVSs. This phenomenon may be linked to the fruit water maintenance under AVSs. However, the DM content was significantly improved in the fruits under water stress (Open Con) by 24% compared to the fruits in the Open field; this finding was also observed in cherry tomatoes under deficit irrigation of 50% [43].
The tomato colour index (COL) showed no evident response to different shading degrees compared to the Open field. This finding supports the prior research of Aroca-Delgado, Pérez-Alonso, Callejón-Ferre, and Díaz-Pérez [35], which reported no significant impact of PV modules on tomato fruit colour. On the other hand, our findings contrast with Ureña-Sánchez [37], who reported adverse effects on fruit size and colour when employing 9.8% shading of a PV system on tomatoes.
Moreover, the data presented in Table 2 demonstrate that the different AVSs significantly impacted the titratable acidity (TA) and pH of the tomato crops. The highest considerable increases in TA were observed in the ST80% and Con80% treatments, reaching values equal to 0.42 and 0.40% citric acid, respectively, compared to Open (0.31% citric acid), followed by Con50% (0.35% citric acid). The improvement in TA in terms of citric acid is consistent with findings from previous studies [19]. This elevation in acidity can potentially increase the fruit’s flavour profile, a highly regarded quality attribute appreciated by consumers [44]. The values of the fruit pH decreased significantly under high shading (ST80%, Con50%, and Con80%), with values equal to 4.13 compared to Open (4.32). On the contrary, water stress (Open Con) significantly increased the fruit pH (4.41). This contrasts with previous studies’ findings [20,35], which concluded that PV panels do not exert a significant impact on fruit quality regarding pH levels.
Regarding TSS, all the AVS treatments showed no significant differences compared to Open, i.e., shade had no impact on the TSS. The only significant difference in TSS was in Open Con, which showed the most significant increases in sugar content compared to Open, with values equal to 5.67 and 5.20 °Brix, respectively, compared to Open (4.93 °Brix). This increase in TSS can be attributed to factors such as water stress [43] and direct sun exposure, which collectively enhanced fruit quality relative to the other treatments. Furthermore, tomatoes with higher TSS levels tend to have increased sweetness and flavour, which significantly benefits the industrial tomato sector by improving processing efficiency [45]. Furthermore, the TSS:TA ratio is often considered to be the maturity index, which indicates high-quality tomatoes with values higher than 12 [46]. This ratio decreased significantly in the fruits under the AVSs compared to those grown in the Open field. However, the ratio was higher than 12, demonstrating the high quality of the harvested tomatoes. Only fruits under high-shade Con80% showed a value of 11.90, compromising the tomato taste. At the same time, the irrigation deficit considerably increased the ratio in the fruits under Open Con (19.26). This ratio indicates the taste of the fruit, being more representative than an individual quantification of soluble solids and titratable acidity [47]. The larger this ratio, the sweeter the fruit is characterized. In relation to this study, it is possible to affirm that, except for the tomatoes in Con80%, the remaining fruits had a pleasant taste, considering that the higher the ratio, the greater the balance between sweet and acid, making the fruit more attractive for consumption [48].
In addition, a statistical analysis revealed uniform tomato firmness across most treatments compared to Open, i.e., shade had no impact on fruit firmness. The only difference was in Open Con, which exhibited the highest firmness with a value of 47.66 and demonstrated significant differences compared to all other treatments. This increase in firmness is a crucial attribute, as it affects fruit storage. This improvement was probably linked to the water stress in Open Con relative to Open, as reported by Romero and Rose [49]. An increase in firmness under water deficit may be associated with a decrease in internal turgor, which could lead to a lower pressure on the cell walls and then to a higher epidermal elasticity [50].

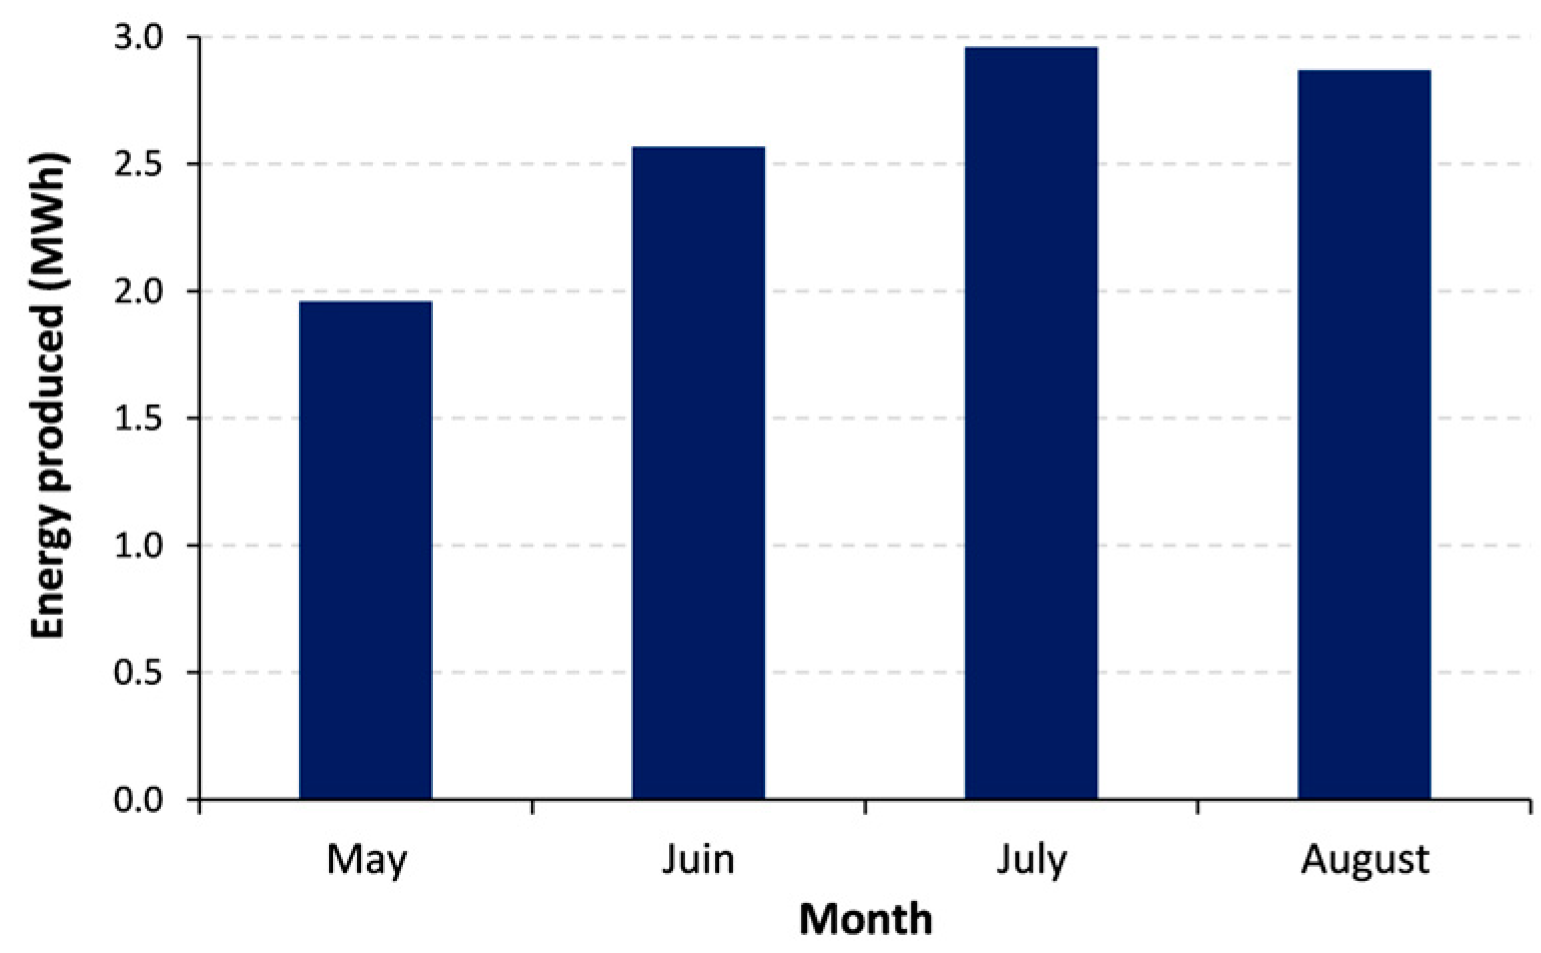
3.8. Electricity Generation during the Experiment

During the experiment, the AVSs generated significant amounts of electricity. Even though both AVSs covered an area of about 100 m2 from the cultivated field, they produced over 10 MWh of electricity throughout the four-month experiment, as depicted in Figure 13. This substantial energy output represents an attractive compromise for farmers, balancing between crop yield loss from a limited area of their farms and energy generation. By doing so, farmers can potentially reduce their electricity expenses or even generate additional income from selling electricity back to the grid.

4. Conclusions

The objective of this study was to investigate the impacts of two different AVSs, i.e., ST and Con, on tomato crop yield and quality, as well as their potential impact on irrigation water demand in open field conditions within the Mediterranean region.
The results revealed that the PAR absorbed by the tomato plants was higher in the open field compared to that under the AVSs, regardless of whether it was under 50% or 80% shade. This led to a significant difference in terms of the iWUE between Open and all treatments underneath both AVSs. The impact of AVSs on the physiological parameters resulted in a significant decrease in the tomato yield, particularly when subjected to 80% shade with reductions of up to 58%. In a comparative analysis between the two AVSs, the ST AVS performed relatively better than the Con AVS, with a yield reduction of approximately 28% under 50% shade, compared to Open. Interestingly, the yield from the open field treatments under water stress (particularly Open Con) was higher than that from the treatments under the AVSs, indicating that shade negatively impacted the yield more than water stress. Nevertheless, it is noteworthy that the AVSs exhibited significant potential to reduce irrigation water demand, with reductions exceeding 15% in ST and 20% in Con, compared to Open. Consequently, the WP was also negatively impacted under the AVSs, with reductions ranging from 14% in ST50% to 47% in Con80%. The type of AVSs also affected the WP, as the yield under the ST panels was higher than that under the Con panels. Furthermore, an analysis of the different harvest campaigns revealed that the AVSs extended the tomato growing season compared to Open.
While both plant and root length exhibited no significant variations, notable differences were observed in the stem diameter and shoot dry matter across the different shading conditions. These differences underscore the impacts of the reduced photosynthesis and transpiration caused by AVSs. When considering the tomato fruit quality, the shade negatively impacted the fruit size, dry matter content, pH, and TSS:TA ratio (with statistically significant differences). However, the shade had no significant impact on the sugar content (TSS), fruit colour, and firmness.
During the experiment, the AVSs generated a significant amount of electricity. Even though both AVSs covered a relatively small area from the cultivated field, they produced over 10 MWh of electricity for the four-month experiment. This substantial energy output represents an attractive compromise for farmers, balancing between potential crop yield loss from a limited area of their farms and energy generation. By doing so, farmers can potentially reduce their electricity expenses or even generate additional income from selling electricity back to the grid.
All the findings from this study and the other studies available in the literature underline the conclusion that, overall, the impact of AVSs on crops is a complex interaction of multiple factors, such as shading levels, microclimate, crop type, and irrigation management. These systems have the potential to provide benefits in terms of crop and energy production. However, the success of these systems greatly depends on considering and optimizing all the mentioned factors.

Author Contributions

Conceptualization, A.F.; methodology, A.F., S.M., G.D. and N.A.; formal analysis, S.M., A.F., G.D. and N.A.; investigation, S.M.; resources, G.D. and N.A.; data curation, S.M. and A.F.; writing—original draft preparation, S.M. and A.F.; writing—review and editing, A.F., G.D. and N.A.; visualization, A.F.; supervision, A.F. and G.D.; funding acquisition, A.F. All authors have read and agreed to the published version of the manuscript.

Funding

This research and the APC were funded by the German Agency for International Cooperation “Deutsche Gesellschaft für Internationale Zusammenarbeit (GIZ) GmbH”, grant number 81262136.

Data Availability Statement

Data are contained withing the article.

Conflicts of Interest

The authors declare no conflict of interest.

Abbreviations

AVAgrivoltaic
AVSAgrivoltaic System
COLColour index
ConConventional
DMDry Matter
ETEvapotranspiration
FCField Capacity
GHGGreenhouse Gas
iWUEintrinsic Water Use Efficiency
PARPhotosynthetically Active Radiation
PVPhotovoltaic
PWPPermanent Welting Point
RAWReadily Available Water
STSemi-transparant
TATitratable Acidity
TAWTotal Available Water
TSSTotal Soluble Solids
WCWater Content
WPWater Productivity
WUEWater Use Efficiency

Appendix A

Table A1. Statistical analyses for the physiological parameters.
Treatments Solar
Radiation
PARTranspiration RateStomatal
Conductance
PhotosynthesisiWUE
Open 319.88 a1687.60 a10.31 a0.66 a22.24 a2.20 a
ST50%143.90 b811.00 b7.09 b0.46 b12.70 b1.56 b
ST80%46.73 c131.64 c5.97 b0.32 c8.25 c1.43 bc
Con50%43.16 c206.10 c6.75 b0.38 bc8.04 c1.17 c
Con80%43.17 c108.00 c6.28 b0.35 bc7.26 c1.25 c
The data represent average values of 6 sampling (n = 36). Means followed by different letters in the same column differed significantly (p < 0.05) using Tuckey’s test.
Figure A1. Interval plots of treatment vs. (a) incoming solar radiation, (b) PAR, (c) transpiration, (d) stomatal conductance, (e) photosynthesis, and (f) iWUE.
Processes 11 03370 g0a1

References

  1. Roxani, A.; Zisos, A.; Sakki, G.-K.; Efstratiadis, A. Multidimensional Role of Agrovoltaics in Era of EU Green Deal: Current Status and Analysis of Water-Energy-Food-Land Dependencies. Land 2023, 12, 1069. [Google Scholar] [CrossRef]
  2. Dinesh, H.; Pearce, J.M. The potential of agrivoltaic systems. Renew. Sustain. Energy Rev. 2016, 54, 299–308. [Google Scholar] [CrossRef]
  3. European Commission. A Clean Planet for All: A European Strategic Long-Term Vision for a Prosperous, Modern, Competitive and Climate Neutral Economy; COM(2018) 773 final; European Commission: Brussels, Belgium, 2018. [Google Scholar]
  4. Goetzberger, A.; Zastrow, A. On the Coexistence of Solar-Energy Conversion and Plant Cultivation. Int. J. Sol. Energy 2007, 1, 55–69. [Google Scholar] [CrossRef]
  5. Trommsdorff, M.; Kang, J.; Reise, C.; Schindele, S.; Bopp, G.; Ehmann, A.; Weselek, A.; Högy, P.; Obergfell, T. Combining food and energy production: Design of an agrivoltaic system applied in arable and vegetable farming in Germany. Renew. Sustain. Energy Rev. 2021, 140, 110694. [Google Scholar] [CrossRef]
  6. Weselek, A.; Bauerle, A.; Hartung, J.; Zikeli, S.; Lewandowski, I.; Högy, P. Agrivoltaic system impacts on microclimate and yield of different crops within an organic crop rotation in a temperate climate. Agron. Sustain. Dev. 2021, 41, 59. [Google Scholar] [CrossRef]
  7. Mamun, M.A.A.; Dargusch, P.; Wadley, D.; Zulkarnain, N.A.; Aziz, A.A. A review of research on agrivoltaic systems. Renew. Sustain. Energy Rev. 2022, 161, 112351. [Google Scholar] [CrossRef]
  8. Marrou, H.; Wery, J.; Dufour, L.; Dupraz, C. Productivity and radiation use efficiency of lettuces grown in the partial shade of photovoltaic panels. Eur. J. Agron. 2013, 44, 54–66. [Google Scholar] [CrossRef]
  9. Elamri, Y.; Cheviron, B.; Mange, A.; Dejean, C.; Liron, F.; Belaud, G. Rain concentration and sheltering effect of solar panels on cultivated plots. Hydrol. Earth Syst. Sci. 2018, 22, 1285–1298. [Google Scholar] [CrossRef]
  10. Marrou, H.; Dufour, L.; Wery, J. How does a shelter of solar panels influence water flows in a soil–crop system? Eur. J. Agron. 2013, 50, 38–51. [Google Scholar] [CrossRef]
  11. Barron-Gafford, G.A.; Minor, R.L.; Allen, N.A.; Cronin, A.D.; Brooks, A.E.; Pavao-Zuckerman, M.A. The Photovoltaic Heat Island Effect: Larger solar power plants increase local temperatures. Sci. Rep. 2016, 6, 35070. [Google Scholar] [CrossRef]
  12. Weselek, A.; Ehmann, A.; Zikeli, S.; Lewandowski, I.; Schindele, S.; Högy, P. Agrophotovoltaic systems: Applications, challenges, and opportunities. A review. Agron. Sustain. Dev. 2019, 39, 35. [Google Scholar] [CrossRef]
  13. Trypanagnostopoulos, G.; Kavga, A.; Souliotis, Μ.; Tripanagnostopoulos, Y. Greenhouse performance results for roof installed photovoltaics. Renew. Energy 2017, 111, 724–731. [Google Scholar] [CrossRef]
  14. Zisis, C.; Pechlivani, E.M.; Tsimikli, S.; Mekeridis, E.; Laskarakis, A.; Logothetidis, S. Organic Photovoltaics on Greenhouse Rooftops: Effects on Plant Growth. Mater. Today Proc. 2019, 19, 65–72. [Google Scholar] [CrossRef]
  15. Cossu, M.; Yano, A.; Solinas, S.; Deligios, P.A.; Tiloca, M.T.; Cossu, A.; Ledda, L. Agricultural sustainability estimation of the European photovoltaic greenhouses. Eur. J. Agron. 2020, 118, 126074. [Google Scholar] [CrossRef]
  16. Barron-Gafford, G.A.; Pavao-Zuckerman, M.A.; Minor, R.L.; Sutter, L.F.; Barnett-Moreno, I.; Blackett, D.T.; Thompson, M.; Dimond, K.; Gerlak, A.K.; Nabhan, G.P.; et al. Agrivoltaics provide mutual benefits across the food–energy–water nexus in drylands. Nat. Sustain. 2019, 2, 848–855. [Google Scholar] [CrossRef]
  17. Cossu, M.; Murgia, L.; Ledda, L.; Deligios, P.A.; Sirigu, A.; Chessa, F.; Pazzona, A. Solar radiation distribution inside a greenhouse with south-oriented photovoltaic roofs and effects on crop productivity. Appl. Energy 2014, 133, 89–100. [Google Scholar] [CrossRef]
  18. Li, X.; Cai, J.; Li, H.; Bo, Y.; Liu, F.; Jiang, D.; Dai, T.; Cao, W. Effect of Shading from Jointing to Maturity on High Molecular Weight Glutenin Subunit Accumulation and Glutenin Macropolymer Concentration in Grain of Winter Wheat. J. Agron. Crop Sci. 2012, 198, 68–79. [Google Scholar] [CrossRef]
  19. El-Gizawy, A.M.; Abdallah, M.M.F.; Gomaa, H.M.; Mohamed, S.S. Effect of different shading levels on tomato plants. 2. Yield and fruit quality. Acta Hortic. 1993, 323, 349–354. [Google Scholar] [CrossRef]
  20. Nangare, D.D.; Singh, J.; Meena, V.S.; Bhushan, B.; Bhatnagar, P.R. Effect of green shade nets on yield and quality of tomato (Lycopersicon esculentum Mill) in semi-arid region of Punjab. Asian J. Adv. Basic. Appl. Sci. 2015, 1, 1–8. [Google Scholar]
  21. Allen, R.G.; Pereira, L.S.; Raes, D.; Smith, M. Crop Evapotranspiration—Guidelines for Computing Crop Water Requirements—FAO Irrigation and Drainage Paper 56; Food and Agriculture Organization (FAO): Rome, Italy, 1998; pp. 1–15. [Google Scholar]
  22. Phocaides, A. Handbook on Pressurized Irrigation Techniques, 2nd ed.; FAO: Rome, Italy, 2007. [Google Scholar]
  23. Pereira, L.S.; Cordery, I.; Iacovides, I. Improved indicators of water use performance and productivity for sustainable water conservation and saving. Agric. Water Manag. 2012, 108, 39–51. [Google Scholar] [CrossRef]
  24. LI-COR. LI-6400/XT Portable Photosynthesis System. Available online: https://www.licor.com/env/support/LI-6400/topics/system-description.html (accessed on 21 September 2023).
  25. D’Aquino, S.; Mistriotis, A.; Briassoulis, D.; Di Lorenzo, M.L.; Malinconico, M.; Palma, A. Influence of modified atmosphere packaging on postharvest quality of cherry tomatoes held at 20 °C. Postharvest Biol. Technol. 2016, 115, 103–112. [Google Scholar] [CrossRef]
  26. López Camelo, A.F.; Gómez, P.A. Comparison of color indexes for tomato ripening. Hortic. Bras. 2004, 22, 534–537. [Google Scholar] [CrossRef]
  27. Pathare, P.B.; Opara, U.L.; Al-Said, F.A.-J. Colour Measurement and Analysis in Fresh and Processed Foods: A Review. Food Bioprocess. Technol. 2013, 6, 36–60. [Google Scholar] [CrossRef]
  28. AOAC 942.15-1965; AOAC Official Method 942.15: Acidity (Titratable) of Fruit Products. AOAC: Rockville, MD, USA, 1965.
  29. Admane, N.; Cavallo, G.; Hadjila, C.; Cavalluzzi, M.M.; Rotondo, N.P.; Salerno, A.; Cannillo, J.; Difonzo, G.; Caponio, F.; Ippolito, A.; et al. Biostimulant Formulations and Moringa oleifera Extracts to Improve Yield, Quality, and Storability of Hydroponic Lettuce. Molecules 2023, 28, 373. [Google Scholar] [CrossRef] [PubMed]
  30. Pang, K.; Van Sambeek, J.W.; Navarrete-Tindall, N.E.; Lin, C.-H.; Jose, S.; Garrett, H.E. Responses of legumes and grasses to non-, moderate, and dense shade in Missouri, USA. I. Forage yield and its species-level plasticity. Agrofor. Syst. 2017, 93, 11–24. [Google Scholar] [CrossRef]
  31. Marrou, H.; Guilioni, L.; Dufour, L.; Dupraz, C.; Wery, J. Microclimate under agrivoltaic systems: Is crop growth rate affected in the partial shade of solar panels? Agric. For. Meteorol. 2013, 177, 117–132. [Google Scholar] [CrossRef]
  32. Dupraz, C.; Marrou, H.; Talbot, G.; Dufour, L.; Nogier, A.; Ferard, Y. Combining solar photovoltaic panels and food crops for optimising land use: Towards new agrivoltaic schemes. Renew. Energy 2011, 36, 2725–2732. [Google Scholar] [CrossRef]
  33. Amaducci, S.; Yin, X.; Colauzzi, M. Agrivoltaic systems to optimise land use for electric energy production. Appl. Energy 2018, 220, 545–561. [Google Scholar] [CrossRef]
  34. Sun, Q.; Wang, Y.; Chen, G.; Yang, H.; Du, T. Water use efficiency was improved at leaf and yield levels of tomato plants by continuous irrigation using semipermeable membrane. Agric. Water Manag. 2018, 203, 430–437. [Google Scholar] [CrossRef]
  35. Aroca-Delgado, R.; Pérez-Alonso, J.; Callejón-Ferre, Á.-J.; Díaz-Pérez, M. Morphology, yield and quality of greenhouse tomato cultivation with flexible photovoltaic rooftop panels (Almería-Spain). Sci. Hortic. 2019, 257, 108768. [Google Scholar] [CrossRef]
  36. Lobos, G.A.; Retamales, J.B.; Hancock, J.F.; Flore, J.A.; Romero-Bravo, S.; del Pozo, A. Productivity and fruit quality of Vaccinium corymbosum cv. Elliott under photo-selective shading nets. Sci. Hortic. 2013, 153, 143–149. [Google Scholar] [CrossRef]
  37. Ureña-Sánchez, R.; Callejon-Ferre, Á.J.; Pérez-Alonso, J.; Carreño-Ortega, Á. Greenhouse tomato production with electricity generation by roof-mounted flexible solar panels. Sci. Agric. 2012, 69, 233–239. [Google Scholar] [CrossRef]
  38. Benard, C.; Bernillon, S.; Biais, B.; Osorio, S.; Maucourt, M.; Ballias, P.; Deborde, C.; Colombie, S.; Cabasson, C.; Jacob, D.; et al. Metabolomic profiling in tomato reveals diel compositional changes in fruit affected by source-sink relationships. J. Exp. Bot. 2015, 66, 3391–3404. [Google Scholar] [CrossRef] [PubMed]
  39. Miller, L.; Vellidis, G.; Mohawesh, O.; Coolong, T. Comparing a Smartphone Irrigation Scheduling Application with Water Balance and Soil Moisture-based Irrigation Methods: Part I—Plasticulture-grown Tomato. HortTechnology 2018, 28, 354–361. [Google Scholar] [CrossRef]
  40. Jiang, S.; Tang, D.; Zhao, L.; Liang, C.; Cui, N.; Gong, D.; Wang, Y.; Feng, Y.; Hu, X.; Peng, Y. Effects of different photovoltaic shading levels on kiwifruit growth, yield and water productivity under “agrivoltaic” system in Southwest China. Agric. Water Manag. 2022, 269, 107675. [Google Scholar] [CrossRef]
  41. Al-agele, H.A.; Proctor, K.; Murthy, G.; Higgins, C. A Case Study of Tomato (Solanum lycopersicon var. Legend) Production and Water Productivity in Agrivoltaic Systems. Sustainability 2021, 13, 2850. [Google Scholar] [CrossRef]
  42. Abdel-Mawgoud, A.M.R.; El-Abd, S.O.; Singer, S.M.; Abou-Hadid, A.F.; Hsiao, T.C. Effect of shade on the growth and yield of tomato plants. Acta Hortic. 1996, 434, 313–320. [Google Scholar] [CrossRef]
  43. Cantore, V.; Lechkar, O.; Karabulut, E.; Sellami, M.H.; Albrizio, R.; Boari, F.; Stellacci, A.M.; Todorovic, M. Combined effect of deficit irrigation and strobilurin application on yield, fruit quality and water use efficiency of “cherry” tomato (Solanum lycopersicum L.). Agric. Water Manag. 2016, 167, 53–61. [Google Scholar] [CrossRef]
  44. Malundo, T.M.M.; Shewfelt, R.L.; Scott, J.W. Flavor quality of fresh tomato (Lycopersicon esculentum Mill.) as affected by sugar and acid levels. Postharvest Biol. Technol. 1995, 6, 103–110. [Google Scholar] [CrossRef]
  45. Johnstone, P.R.; Hartz, T.K.; LeStrange, M.; Nunez, J.J.; Miyao, E.M. Managing fruit soluble solids with late-season deficit irrigation in drip-irrigated processing tomato production. HortScience 2005, 40, 1857–1861. [Google Scholar] [CrossRef]
  46. Kader, A.A.; Morris, L.L.; Stevens, M.A.; Albright-Holton, M. Composition and Flavor Quality of Fresh Market Tomatoes as Influenced by Some Postharvest Handling Procedures. J. Am. Soc. Hortic. Sci. 1978, 103, 6–13. [Google Scholar] [CrossRef]
  47. Kader, A.A. Flavor quality of fruits and vegetables. J. Sci. Food Agric. 2008, 88, 1863–1868. [Google Scholar] [CrossRef]
  48. Mendes, K.F.; Mendes, K.F.; Guedes, S.F.; Silva, L.C.A.S.; Arthur, V. Evaluation of physicochemical characteristics in cherry tomatoes irradiated with 60Co gamma-rays on post-harvest conservation. Radiat. Phys. Chem. 2020, 177, 109139. [Google Scholar] [CrossRef]
  49. Romero, P.; Rose, J.K.C. A relationship between tomato fruit softening, cuticle properties and water availability. Food Chem. 2019, 295, 300–310. [Google Scholar] [CrossRef] [PubMed]
  50. Guichard, S.; Bertin, N.; Leonardi, C.; Gary, C. Tomato fruit quality in relation to water and carbon fluxes. Agronomie 2001, 21, 385–392. [Google Scholar] [CrossRef]
Figure 1. AVS experimental field at CIHEAM Bari ((left) conventional solar panel; (middle) semi-transparent panel; and (right) shade effect of the AVSs).
Processes 11 03370 g001
Figure 2. (a) Recorded air temperature, ET0, and rainfall during the experiment; and (b) variation in soil temperature in the open field and under AVSs.
Processes 11 03370 g002
Figure 3. Instantaneous (a) incoming solar radiation; and (b) photosynthetic active radiation (PAR) in open field and under AVSs.
Processes 11 03370 g003
Figure 4. Instantaneous (a) transpiration rate; and (b) stomatal conductance in open field and under AVSs.
Processes 11 03370 g004
Figure 5. Instantaneous (a) photosynthesis rate; and (b) intrinsic Water Use Efficiency (iWUE) in open field and under AVSs.
Processes 11 03370 g005
Figure 6. Irrigation water supply during the growing period of tomato crop, in open field and under AVSs.
Processes 11 03370 g006
Figure 7. Tomato crop morphology in open field and under AVSs.
Processes 11 03370 g007
Figure 8. Average percentage of ripened tomato fruits in open field and under AVSs.
Processes 11 03370 g008
Figure 9. Fruit size in open field and under AVSs.
Processes 11 03370 g009
Figure 10. Harvested tomato yield in open field and under AVSs.
Processes 11 03370 g010
Figure 11. Regression analyses for tomato yield as a function of average incoming solar radiation.
Processes 11 03370 g011
Figure 12. Water productivity in open field and under AVSs.
Processes 11 03370 g012
Figure 13. Electricity produced by the AVSs.
Processes 11 03370 g013
Table 1. Technical characteristics of the AVSs.
DescriptionViessmann Vitovolt 300 M390 WGViessmann Vitovolt 300 M300 RA
Panel FrameConventionalSemi-transparent
Cell TypeMonocrystallineMonocrystalline
Nominal Power Output (PMPP)390 Wp310 Wp
Maximum Power Voltage (VMPP)40.8 V32.9 V
Maximum Power Current (IMPP)9.56 A9.52 A
Open Circuit Voltage (Voc)49.3 V40.3 V
Short Circuit Current (Isc)10.03 A10.12 A
Module Efficiency 20.8%18.8%
Table 2. Quality attributes of tomato.
Treatments DM %WC %COLFirmness (N)pHTA (% Citric Acid)TSS (°Brix)TSS:TA
Ratio
Shade effect
Open 6.67 ± 0.44 ab93.33 ± 0.44 ab37.26 ± 3.75 a34.54 ± 9.13 a4.32 ± 0.03 a0.31 ± 0.01 c4.93 ± 0.15 a15.85 ± 0.67 a
ST50%6.13 ± 0.10 abc93.87 ± 0.10 abc38.97 ± 2.90 a37.84 ± 12.43 a4.29 ± 0.03 a0.35 ± 0.01 bc4.87 ± 0.15 a14.09 ± 0.40 b
ST80%5.21 ± 0.25 c94.79 ± 0.25 a37.07 ± 3.96 a33.58 ± 14.57 a4.15 ± 0.03 b0.42 ± 0.01 a5.10 ± 0.20 a12.08 ± 0.43 c
Con50%7.16 ± 0.96 a92.84 ± 0.96 c35.89 ± 4.50 a34.18 ± 10.09 a4.13 ± 0.01 b0.35 ± 0.01 b4.93 ± 0.15 a13.95 ± 0.78 b
Con80%5.40 ± 0.48 bc94.60 ± 0.48 ab36.25 ± 6.60 a35.40 ± 16.36 a4.13 ± 0.02 b0.40 ± 0.02 a4.77 ± 0.15 a11.90 ± 0.52 c
Deficit irrigation effect
Open6.67 ± 0.44 b93.33 ± 0.44 a37.26 ± 3.75 b34.54 ± 9.13 b4.32 ± 0.03 b0.31 ± 0.01 a4.93 ± 0.15 b15.85 ± 0.67 b
Open ST6.49 ± 0.62 b93.51 ± 0.62 a40.16 ± 3.65 a32.30 ± 11.55 b4.37 ± 0.02 ab0.32 ± 0.02 a5.20 ± 0.36 ab16.03 ± 0.48 b
Open Con8.28 ± 0.52 a91.72 ± 0.52 b34.94 ± 3.98 b47.66 ± 13.48 a4.41 ± 0.03 a0.29 ± 0.01 a5.67 ± 0.15 a19.26 ± 0.62 a
The data represent average values of 5 sampling (n = 30), except for pH, TSS, and TA (n = 3). Means followed by different letters in the same column differed significantly (p < 0.05) using Tuckey’s test.
Disclaimer/Publisher’s Note: The statements, opinions and data contained in all publications are solely those of the individual author(s) and contributor(s) and not of MDPI and/or the editor(s). MDPI and/or the editor(s) disclaim responsibility for any injury to people or property resulting from any ideas, methods, instructions or products referred to in the content.

