Article

Plasma Agricultural Nitrogen Fixation Using Clean Energies: New Attempt of Promoting PV Absorption in Rural Areas

1
College of Information and Electrical Engineering, Shenyang Agricultural University, Shenyang 110866, China
2
Inner Mongolia Huarui Electric Power Technology Development Co., Ltd., Tongliao 029300, China
*
Author to whom correspondence should be addressed.
Processes 2023, 11(7), 2030; https://doi.org/10.3390/pr11072030
Submission received: 13 June 2023 / Revised: 30 June 2023 / Accepted: 5 July 2023 / Published: 7 July 2023
(This article belongs to the Special Issue Solar Energy for Sustainable Agriculture)

Abstract

:
In recent years, a large number of countries have connected and distributed photovoltaics in remote rural areas, aiming to promote the use of clean energy in rural areas. The solar energy that is not used in time needs to be discarded, resulting in a large amount of wasted energy. Rural areas are closely related to agricultural production, and solar energy can be used for agricultural nitrogen fixation to supplement the nitrogen needed by crops and effectively use the upcoming waste of solar energy. A photovoltaic-driven plasma reactor for nitrogen fixation in agriculture was designed in this study. The air inlet and outlet holes are arranged above and below the reactor to facilitate air entry and directly interact with the gliding arc generated at the bottom of the electrode to achieve atmospheric nitrogen fixation in agriculture. The characteristics of gliding arc development in the process of nitrogen fixation in agriculture were studied experimentally. There are two discharge modes of the gliding arc discharge: one is steady arc gliding mode (A-G Mode), and the other is breakdown gliding mode (B-G Mode). By collecting discharge signals, different discharge modes of gliding arc discharge were analyzed, and the effect of the air flow rate on the discharge period and discharge mode ratio distribution is discussed. The effects of the air flow rate on the yield, specific energy input, and energy consumption in plasma agriculture were studied. The experimental results show that with an increase in the air flow rate, the B-G mode takes up a larger proportion and the gliding arc discharge period is shortened. However, the higher the proportion of the B-G mode, the more unfavorable the production of nitrogen oxides. Although the nitrogen oxides generated by the system are not particularly excellent compared with the Haber-Bosch ammonia process (H-B process), the access to distributed photovoltaic roofs in rural and remote areas can effectively use available resources like water, air, and solar, and avoid energy waste in areas where wind and solar are abandoned.

1. Introduction

The development of renewable energy is the main way to solve the power supply problem in rural towns and remote areas because most remote areas have clean energy such as solar energy, wind energy, water power, etc. The utilization of renewable energy provides a feasible plan for the electrification of energy-scarce rural areas [1]. Governments around the world, especially in some developing countries, have been promoting the use of renewable energy technologies to meet basic energy needs in rural areas [2]. Photovoltaic (PV), for example, is a renewable power technology most suitable for development in remote rural areas with geographical limitations and technology that does not support the expansion of the grid. Shahsavari A. et al. [3] analyzed the development potential of solar energy globally and discussed the environmental impact of various forms of renewable energy versus fossil fuels. They concluded that solar power is the most economical solution, suitable for micro-grid or off-grid electrification in remote rural areas and remote communities. In addition, it also applies to the expansion of the power grid in the case of a centralized power supply of renewable resources.
Rural areas are closely related to agricultural production, and many regions and power plants have coupled agriculture and solar energy together [4]. The best result is the current development of the photovoltaic agriculture model in China, which has been an important development direction since 2012, in order to solve the problem of overcapacity in China’s photovoltaic industry [5]. Therefore, photovoltaics have a wide range of applications in China’s rural areas, with more models that are relatively mature. However, with the advancement in the construction of new power systems with new energy as the main body, more and more distributed photovoltaics are connected to rural power grids. The large-scale development of distributed photovoltaic power generation in rural areas will certainly bring challenges and far-reaching impacts to the traditional rural power grid, and one of the main challenges is the insufficient absorption capacity of rural power grids. Farmers in various countries and regions mostly live on local characteristic crops, and the growth of crops cannot be separated from the role of nitrogen. Nitrogen (N) is a key element of life on Earth, which is the most basic nutrient to ensure food production and security, and plays an important role in the REDOX reaction of microbial energy metabolism [6,7]. It is generally a limiting nutrient in marine and terrestrial environments and is found in small amounts in parts of the biosphere [8].
Nitrogen fixation transforms the free nitrogen in the air into ionic nitrogen that can be directly absorbed and utilized by plants through a series of reactions [9]. Microorganisms and lightning in nature can produce nitrate and nitrogen. However, with the development of society, biological nitrogen fixation in nature and lightning nitrogen fixation cannot meet the global human demand for nitrogen and ammonia [10]. It was not until the 20th century that humans discovered a large-scale ammonia synthesis process, known as the Haber-Bosch ammonia process (H-B process), which was a huge breakthrough that increased food production by nearly 400%, and the global economy grew by nearly 400% [11]. Although the Haber-Bosch process is the most important method of nitrogen fixation, it is associated with major environmental concerns because it is very energy intensive and requires non-renewable feedstock for nitrogen fixation [12].
The annual energy consumption of industrial nitrogen fixation is immense, and according to statistics, the energy consumption of industrial nitrogen fixation accounts for about 1–2% of the global total energy consumption [13]. In recent years, plasma technology has attracted the attention of many researchers. The green and low-consumption characteristics of plasma technology play an important role in the field of agricultural generation. It has been widely used for seed germination treatment [14], vegetable and fruit food preservation [15], aquaculture pollution control [16], agricultural atmospheric nitrogen fixation [17], and other aspects. Reports on agricultural nitrogen fixation have also confirmed that plasma nitrogen fixation has the characteristics of the rapid treatment and is green and carbon-free. In addition, many types of discharge methods, such as gliding arc discharge, nanosecond pulse discharge, microwave discharge, and radio frequency discharge, have been shown to help plasma atmosphere nitrogen fixation [18]. Compared with other plasma discharge forms, gliding arc discharge has a higher conversion efficiency, and it is easy to produce active substances under normal temperature and pressure conditions [19].
In this study, an experimental platform for plasma agricultural nitrogen fixation based on a photovoltaic drive was designed. The air inlet and outlet holes were arranged above and below the reactor to facilitate air entry and directly interact with the gliding arc generated at the bottom of the electrode. The developmental characteristics of the gliding arc of plasma during agricultural nitrogen fixation were studied experimentally. Different discharge modes in the gliding arc discharge were analyzed by collecting the discharge signals and discharge images. The influence of the air flow rate at the inlet on the distribution of the gliding arc discharge period and discharge mode is discussed. The effects of air flow on the nitrogen oxide yield, energy density, and energy consumption of plasma agricultural nitrogen fixation were studied.

2. Materials and Methods

2.1. Experimental Setup and Methods

A gliding arc plasma device made in the laboratory is shown in Figure 1. The gliding arc plasma device is composed of a blade-shaped electrode, an electrode fixed-end base, and a reaction outer shell. The bottom of the fixed-end seat can be adjusted by adjusting the bolts to facilitate changes in the spacing and angle of the knife electrode. The reaction outer shell is made of a PMMA cylinder with a diameter of 200 mm and a height of 270 mm. In addition, pipe ports with an inner diameter of 5 mm and an outer diameter of 7 mm are set up at the top center of the shell to be used for the air intake and outlet of the air pump (HLVP6-NB12, Shanghai, China).
The electrodes are made of stainless steel blade-shaped electrodes and are placed in opposition. Applying a high enough voltage to the electrodes creates a strong electric field between the electrodes, prompting the plasma to react with the nitrogen in the atmosphere. The blade-shaped electrode is 170 mm, the base of the knife is 25 mm, and the handle is 30 mm. The distance between the electrodes is 3 mm, the angle between the two electrodes is 15°, the radius of electrode curvature is R350, and R350 is used to denote an electrode with a curvature radius of 350 mm.
The photovoltaic-driven gliding arc discharge plasma test platform used in the experiment is shown in Figure 2a. The experimental equipment mainly includes the following: photovoltaic module (200 W, Hunan Advanced Technology, Changsha, China), photovoltaic inverter, battery, high voltage AC power supply (CTP-2000K, Nanjing Suman, Nanjing, China), air pump, digital oscilloscope (DS1052D, Beijing RIGOL, Beijing, China), and gliding arc plasma device (self-made in the laboratory). The reactor was powered using a high-voltage pulse power supply (CTP-2000K). The plasma voltage and current were measured using a high-voltage probe (Tektronix PP510), and the same probe was used to measure the voltage of resistance. The output voltage measurement interface of the power supply is attenuated by 1000:1, and the relevant amplitude parameters of the output power supply read on the oscilloscope should be multiplied by 1000 to obtain the real voltage. A physical diagram of the device is shown in Figure 2b.
The system selected for the experiment uses the photovoltaic effect to convert solar energy into electricity, but the plasma power supply uses a high-voltage AC current of 220 V, so we need to add an inverter process to convert the direct current generated by the photovoltaic cell into AC. The direct current received through the solar photovoltaic module is connected to the photovoltaic controller, which connects the inverter to the battery. A valve-controlled lead-acid storage battery with a capacity of 100 Ah is set for the power supply under insufficient light and emergency conditions at night. The plasma discharge process is powered by the photovoltaic drive high-voltage AC power supply, and the output frequency adjustment range is about 5~20 KHz by increasing the voltage of the voltage regulator to improve the discharge intensity of the gliding arc plasma. If the rural roof photovoltaic power generation has surplus photovoltaic power, it can also be connected to the low-power DC load.
After the blade electrode is energized, the high-voltage electrode and the low-voltage electrode will produce an arc, and the high energy of the arc will quickly convert nitrogen into nitrogen oxide. The converted nitrogen oxide will be collected through the airbag, and it will enter the absorption device for liquid phase storage under the action of the air pump.

2.2. Performance Assessment

The performance of photovoltaic-driven gliding arc plasma nitrogen fixation was evaluated based on the concentration of nitrogen oxides (ppm), specific energy input, and energy consumption. Among them, the concentration of nitrogen oxides was detected by pumping a composite gas detector (LB-MS4X), and the concentration of the main products of nitrogen fixation processes NO and NO2. Here, the nitrogen oxide concentration, specific energy input, and energy consumption are expressed by the following formula:
C NO X = 2.05 C NO X mg m 3
where C NO X is the mass concentration of nitrogen oxides (ppm).
The specific energy input (SEI) was calculated using Formula (2) and was defined in [20]:
SEI = 60 × Total   Power ( w ) Air   Flow   Rate ( L / min ) J / L
where the air flow can be adjusted by the air pump for flow (L/min).
Total power was calculated using Formula (3):
P = 1 n × Δ t Σ i = 1 i = n U i × I i × Δ t
where voltage (Ui) and current (Ii) are in the same phase, and the voltage and current at both ends of the electrode during gliding arc discharge are selected. Δt is the sampling interval; n is the number of samples.
Energy consumption (EC) was calculated using Formula (4) and was defined in [20,21]:
EC NO X = SEI C NO X = SEI × V m C NO X   ppm J / mol
where Vm is 24.465 L/mol, which is the molar volume of air under normal temperature and pressure (101 kPa, 298 K).
The average value of all data in this experiment was obtained via repeated experiments, and each group repeated the experiment period 3 times to avoid unnecessary errors caused by fluctuations of electrical signals during the experiment, which would affect the performance analysis and electrical signal diagnosis of the subsequent photovoltaic-driven gliding arc plasma nitrogen fixation.

3. Results

3.1. Electrical Characteristics of Gliding Arc Plasma Nitrogen Fixation

3.1.1. Electrical Characteristics

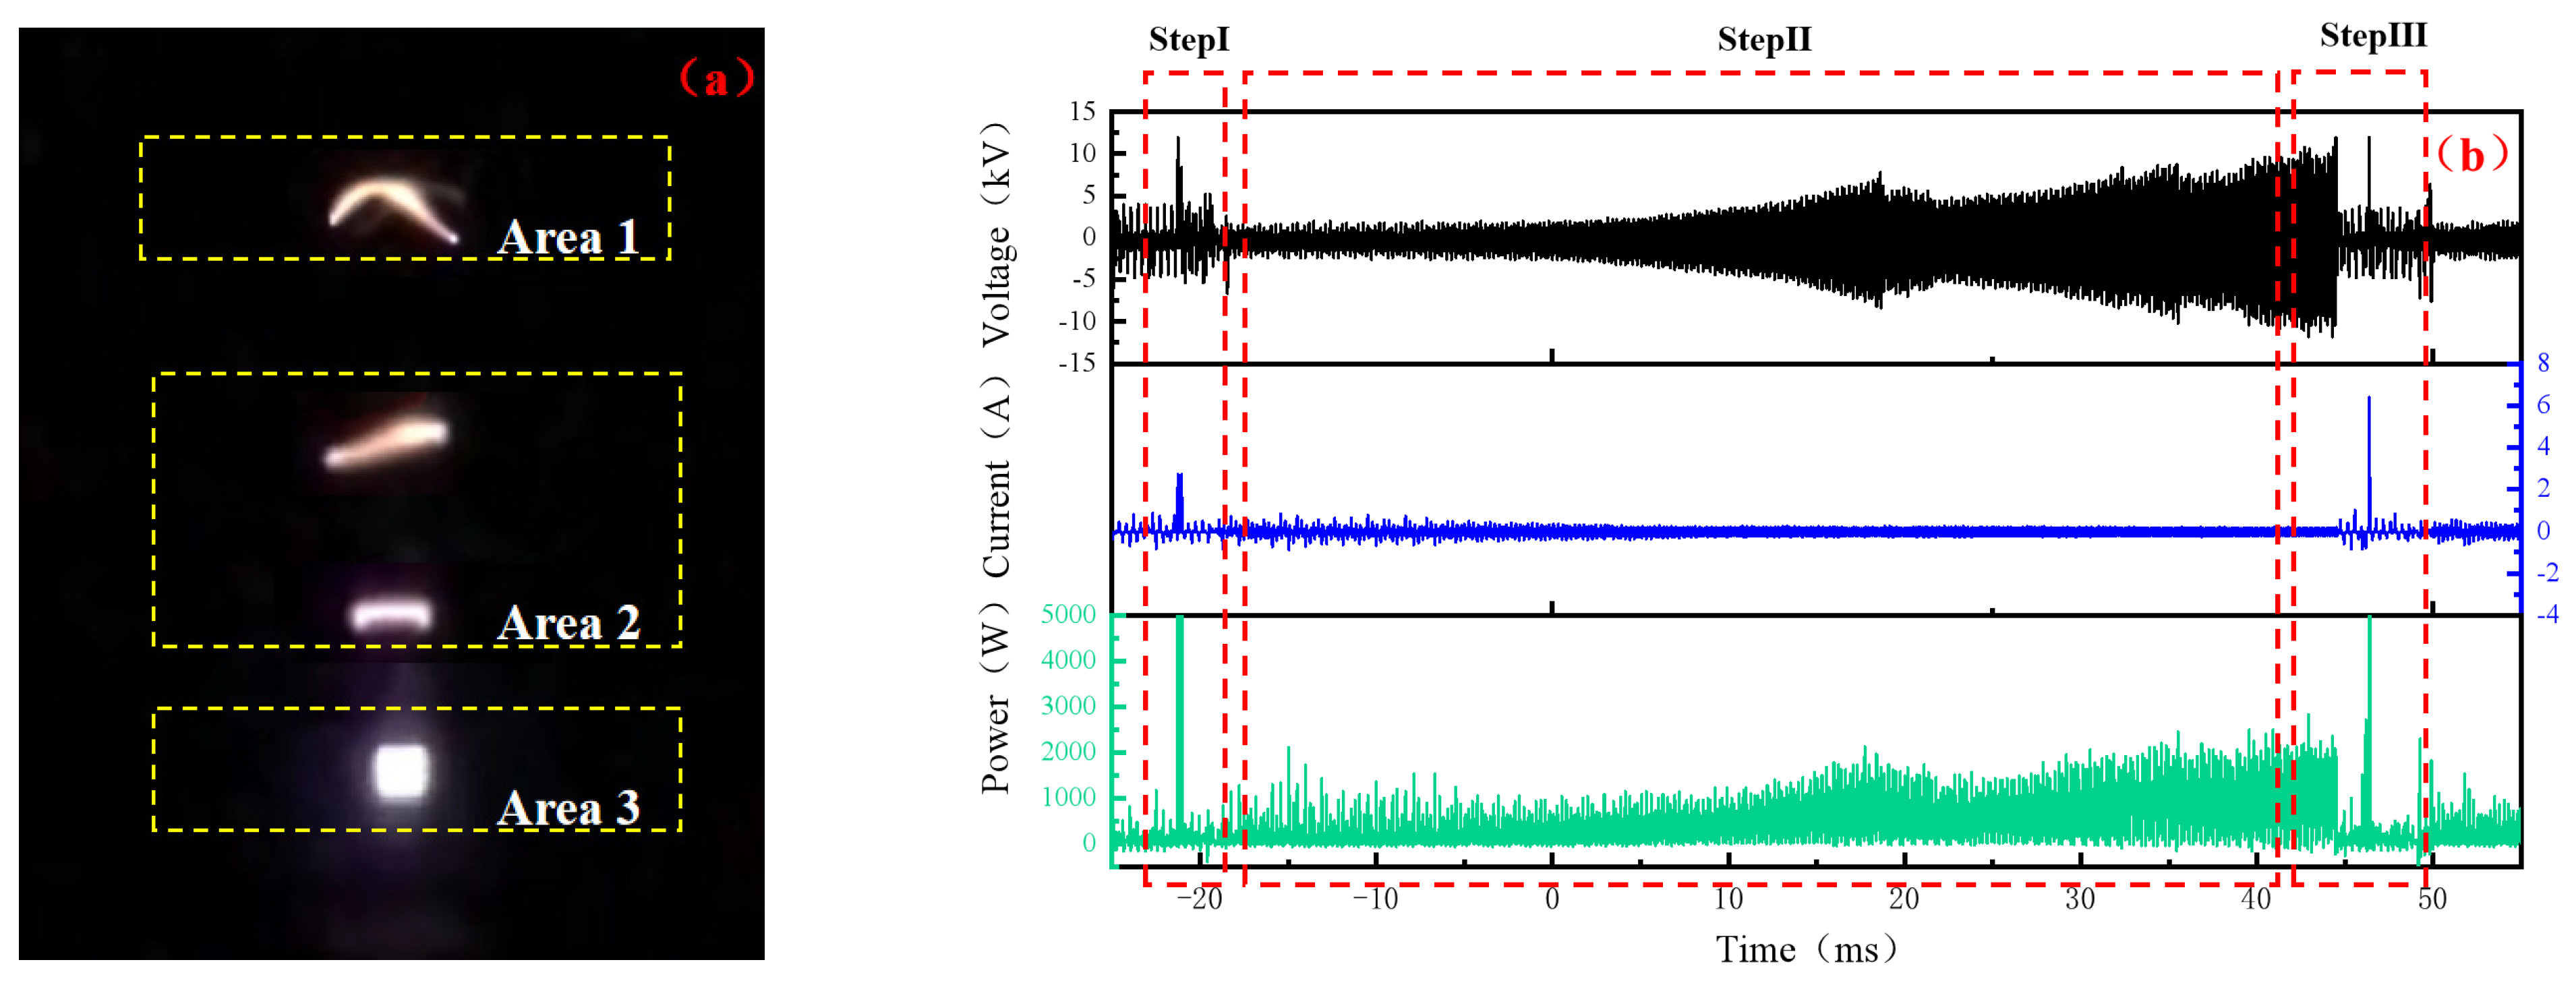
In order to refine the trajectory and waveform signals of the gliding arc under atmospheric discharge, the gliding arc characteristics and waveform signals in any one period are discussed as follows. Figure 3b is the waveform signal of any discharge period (from t = −0.025 s to t = 0.055 s). When the high-frequency AC power supply sends out AC signals, the atmospheric breakdown phenomenon occurs when the discharge voltage gradually increases to about 13 kV. According to the experimental waveform in Figure 3b, the time difference between the two intervals is about 65 ms. At the same time, the current also generates a current amplitude of 6.8 amps because the air between the two electrodes is broken down, and the resistance of the electrode gap becomes small, which makes the circuit flow through a large current and causes the redistribution of the potential in the circuit.
This typical electrical signal feature mainly occurs after the blade electrode is energized. From the arc development stage, when the gliding arc forms a bright channel and moves to the upper end of the electrode for a short distance, the stage repeatedly breaks down in area 3, as shown in Figure 3a, and the arc breakdown occurs in the gap at the bottom of the electrodes. This stage also corresponds to step Ⅰ shown in Figure 3b, which is the firing stage of the gliding arc. The gliding arc plasma nitrogen fixation process also requires the help of the air flow field to push the arc gliding along the electrode and streamline direction, which is most of the area contained in the electrode length. The arc extends and elongates in area 2 shown in Figure 3a. From the arc developmental stage, the color of the gliding arc also changes from bright channel color to flame color. This stage corresponds to step Ⅱ of Figure 3b, which is the developmental stage of the gliding arc. When the plasma power supply is insufficient, the gliding arc is extinguished at the bottom of the blade electrodes. This stage is extinguished in area 1 shown in Figure 3a, and a bright channel is regenerated in area 3 shown in Figure 3a for a periodic cycle. This stage corresponds to step Ⅲ shown in Figure 3b, which is the arc extinguishing stage of the gliding arc. Similarly, when the AC signal is no longer supplied to the blade electrode, the gliding arc is eliminated. The arc also remains extinguished, and the waveform in the experiment is similar to that in [22].

3.1.2. Discharge Mode

Recent studies have roughly divided the gliding arc plasma discharge process into two categories on gliding arc discharge modes [23,24]. One is the steady arc gliding mode (A-G Mode). With the increase in arc height, arc resistance also increases, resulting in a gradual increase in arc voltage. In the end, the power supply energy is not enough to maintain stable arc combustion, and the arc is extinguished. Another mode is the breakdown gliding mode (B-G Mode). This mode of arc combustion is not stable, and there are many high voltage points, which is due to the instability of air gap breakdown and repeated arc breakdown, thereby causing extinction. These modes in the experiment are similar to that in [23,25].
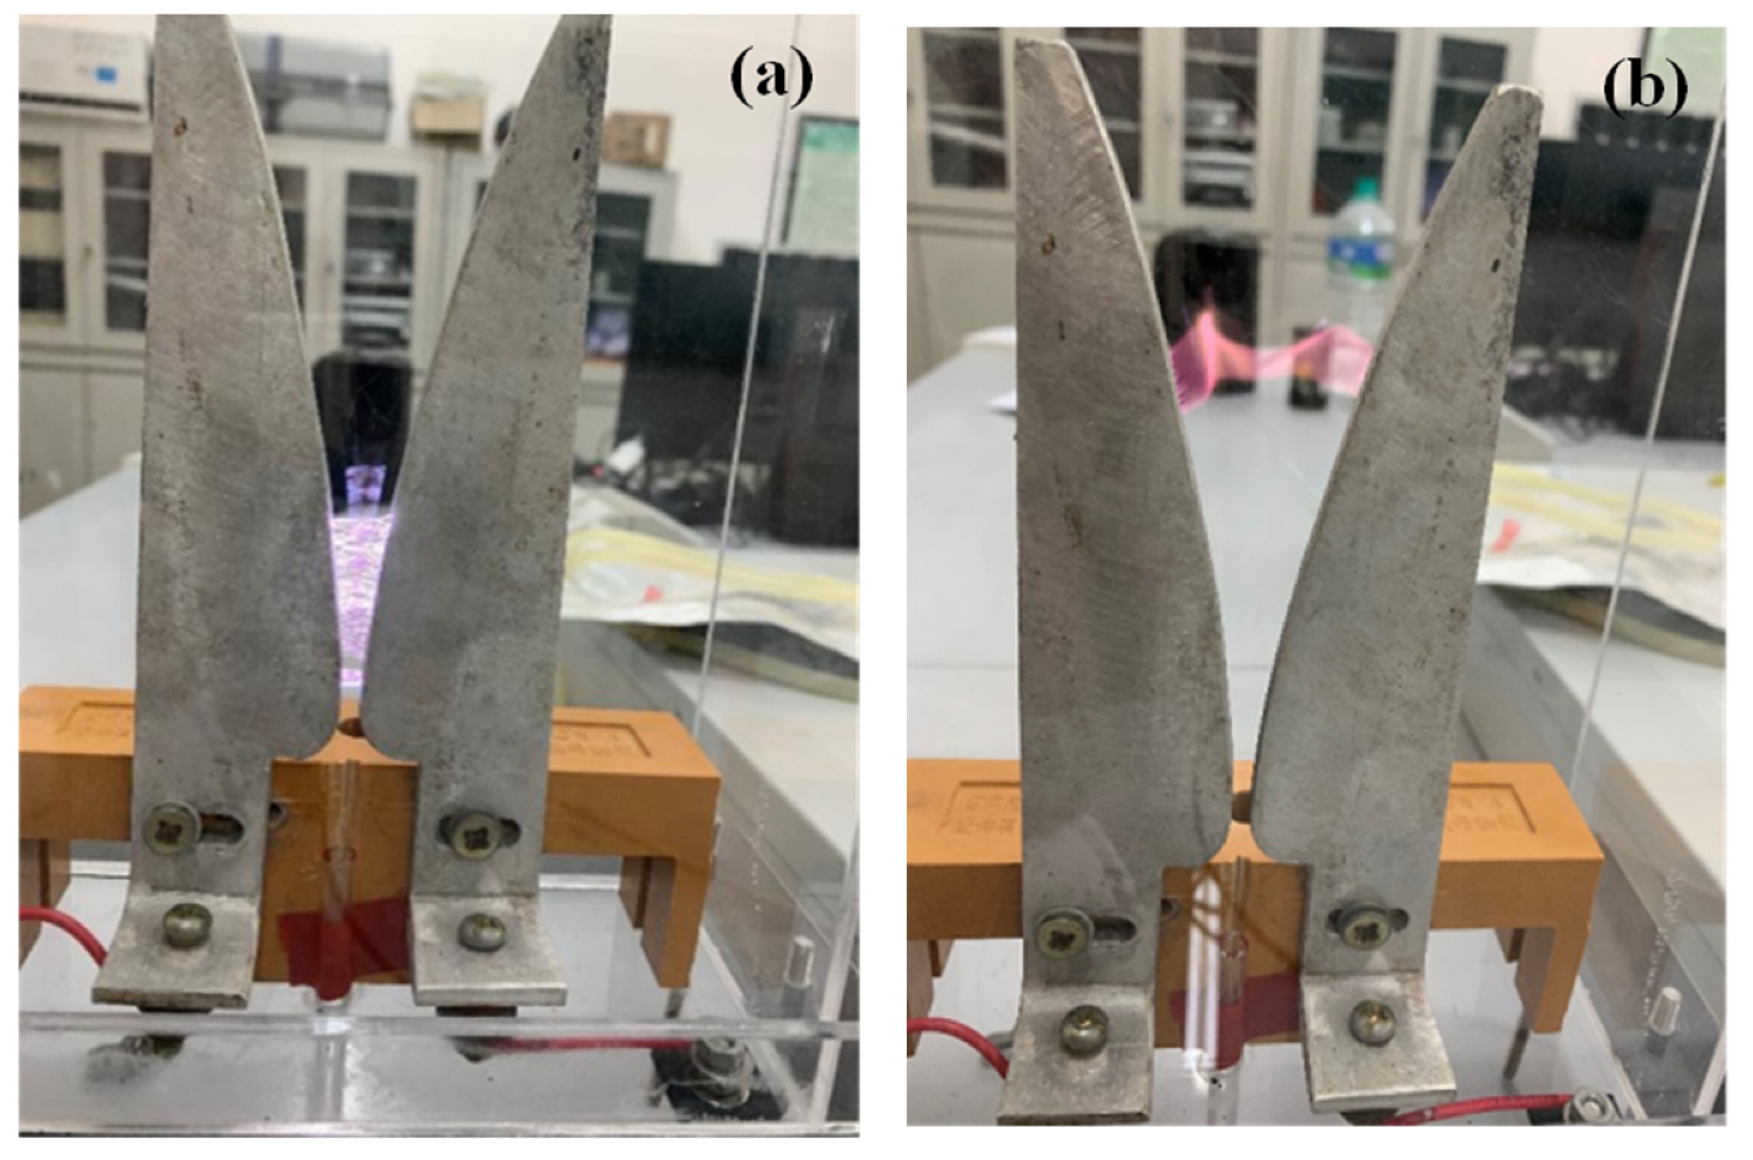
There are also obvious differences in the arc development between the two modes. The B-G mode arc is mostly blue and purple, and it can be clearly seen that there are multiple breakdowns in the air gap at the same time, as shown in Figure 4a. In this mode, the electrode breakdown is carried out at a small electrode spacing, the operating range is small, and the arc rising height is low. The A-G mode arc is mostly red, the combustion is stable, and only one arc electrode slides on it, as shown in Figure 4b. The motion range of this mode on the electrode is larger than that of the B-G mode, the arc is extinguished at a higher point in the electrode, and the period is relatively long.

3.2. The Influence of Discharge Characteristics on Nitrogen Fixation by Gliding Arc Plasma

3.2.1. Influence on Discharge Parameters

Many studies have confirmed that air flow rates have a great influence on gliding arc plasma [26,27]. In this experiment, the current, voltage, and power waveforms are measured at different flow rates. The input voltage of the high-frequency AC power supply is controlled by a voltage regulator to 85 V. Figure 5 shows the electrical signal waveform of gliding arc atmospheric nitrogen fixation with different air flow rates (the time base unit is 100 ms/div). Under different air flow rates, the voltage signal of the gliding arc increases to the peak point of the arc voltage and then plummets, and the peak instantaneous arc voltage is maintained between 12 kV and 13.2 kV. The voltage signal plummeting is accompanied by several amps of peak current, which is the main manifestation of the gliding arc short-circuit events. The frequency of short-circuit events is closely related to the intake air flow rate. When the air flow rate of the gliding arc reactor is 0.8 L/min, the frequency of short-circuit events of the gliding arc only exists twice, and the peak current reaches 3.5 A and 6.3 A, respectively. As the air flow rate of the reactor increases according to the gradient grade, the frequency of short-circuit events also increases. It can also be observed from the change in the peak current on the ampere scale.
When the air flow rate of the reactor is 1.6 L/min and 2.4 L/min, 1.7 short-circuit events occur on average during the discharge period of the gliding arc. This phenomenon becomes more and more significant with an increase in the inlet air flow of the reactor. As shown in Figure 5e, when the inlet air flow rate of the reactor is 4 L/min, the frequency of the gliding arc short-circuit events is relatively dense, and the peak current signals of many groups exceed 1 A or 2 A [28]. However, the current is stable in the A-G discharge mode and does not exceed the amplitude change of 0.5 A. Moreover, the area of the gliding arc discharge area is significantly reduced to 42.8–63 ms. As the inlet flow rate increases, the flow field in the reactor is dense, and the high-energy electrons generated by gliding arc discharge cause energy loss under the action of convection cooling. High-energy electrons cannot obtain energy under the electric field to maintain the development of the arc, which further enhances the dissipation of the gliding arc energy, resulting in the rapid extinction of the arc and a new arc period at the extremely narrow gap of the electrode. The A-G mode more intuitively observes the generation of the flame channel, whereas the B-G mode more intuitively observes the bright spark channel. When the flow rate is low under the air flow rate, the A-G discharge mode accounts for a large proportion. The phenomenon of the flame channel is more than that of the bright spark channel. With the increase in the air flow rate, the B-G mode is introduced too frequently, and the discharge frequency of the bright spark channel keeps increasing, which further indicates that convection cooling also has a certain influence on the sliding arc discharge cycle. When the air flow rate of the reaction chamber outlet is higher, short-circuit events and ignition occur more frequently [29]. Under low flow conditions, most of the sliding arcs are stable at the top of the electrode, while under high flow conditions, most of them slide upward along the electrode several times, and the result in the experiment is similar to that in [30].

3.2.2. Influence on Discharge Period

Although the peak voltage plummets under the action of strong convection, this phenomenon does not mean the disappearance of the gliding arc plasma, but a new arc is generated between the electrode where the original arc is extinguished, and the disappearance of the AC signal only means the end of the atmospheric nitrogen fixation process of the gliding arc plasma. Due to the periodicity, continuity, and repeatability of the atmospheric nitrogen fixation process, the periodic discharge process of the gliding arc is maintained. The development state of the gliding arc is reviewed in Section 3.1. The ignition stage of the gliding arc is characterized by a bright discharge channel generated between the extremely narrow electrode gaps. The ignition stage develops along its path and is extinguished at the top of the electrode under the action of the flow field.
Table 1 shows the number of discharge cycles for nitrogen fixation in a gliding arc atmosphere with different air flow rates. When the air flow rate is 0.8 L/min and 1.6 L/min, the number of gliding arc discharge cycles is small, and 2.5 and 3.5 cycles are generated, respectively, at the 100 ms/div time base. When the air flow rate is 0.8 L/min, there are 12 breakdown discharges in 500 ms, and the average cycle time of one discharge is 48.5 ms. When the air flow rate is 1.6 L/min, compared with the low flow rate state, there are 21 breakdown discharges in 500 ms. In the same way, the number of discharge cycles increases, and the time of each discharge is shortened in the same period of time, so the average time of one discharge cycle in 500 ms is 33.9 ms. This phenomenon is more obvious when the air flow rate increases. When the air flow rate is 2.4 L/min, there are 37 discharges in 500 ms, and the average discharge cycle time is 18.7 ms. When the air flow rate is 3.2 L/min and 4.0 L/min, 44 and 64 breakdown discharges occur in 500 ms, respectively, and the average cycle time of one discharge also decreases from 48.5 ms to 13.2 ms and 10.1 ms at a low flow rate, with a large decrease in positive proportion. Therefore, as the air flow rate increases, the number of sliding arc discharge cycles increases. Similarly, the time limit of each discharge cycle is inversely proportional to the air flow rate, and the shorter the time limit of the gliding arc staying on the blade electrode, the easier it is to generate a new discharge cycle.
Figure 6 shows the influence of different air flow rates on the atmospheric nitrogen fixation cycle time. In Figure 6, in order to further verify the influence of the air flow rate on the sliding arc discharge cycle, we continuously collected the discharge cycle time in the process of 50 discharges, and the statistical frequency can be interpreted as the number of discharge cycles defined as 50. For the 50 statistical frequencies, the average discharge cycle time was calculated every fifth time. When the air flow rate was 0.8 L/min, the maximum discharge cycle time was as high as 100 ms in the first five statistical times, and as low as 14 ms in the 15–20 statistical times. We then calculated the discharge period at 0.8 L/min for 50 discharges, and the average discharge period reached 44.09 ms. When the air flow rate was increased to 1.6 L/min, there was no longer a long discharge period of more than 60 ms; the highest discharge cycle time was 52 ms, the lowest discharge cycle time was 18 ms, and the average discharge cycle was 30.82 ms, which was 69% shorter than that of 0.8 L/min. When the air flow rate was increased to 2.4 L/min, the highest discharge cycle time was 22 ms, the lowest discharge cycle time was 13 ms, and the average discharge cycle was 17.02 ms. There was no long-period discharge exceeding 22 ms at this stage. When the air flow rate increased again, the average discharge period was shortened again at 3.2 L/min and 4.0 L/min, which were 12.00 ms and 9.18 ms, respectively. The maximum discharge cycle time was 17 ms, and the minimum discharge cycle time was 4~5 mm.
Table 2 shows the results of the average discharge period of the sliding arcs for different air flows at 50 statistical frequencies. As can be seen from Table 2, when the plasma reactor intake flow is 0.8 L/min and 1.6 L/min, the sliding arc discharge cycle time is generally longer, and the average discharge cycle can reach 44.1 ms and 30.8 ms, respectively. The main reason is that at a very low flow rate, when the arc develops to the tip of the electrode, there is a “hanging arc” phenomenon, and the arc continues to discharge between the blade electrodes, which increases the gliding arc period at very low air flow. The phenomenon is more obvious when the air flow is 0.8 L/min, and even up to 100 ms of hanging arc time. When the air flow rate of the reactor inlet rises to 4 L/min, the discharge period is significantly shortened; the average discharge period is reduced from 44.1 ms to 9.18 ms at 0.8 L/min, and the shortest discharge period is shortened to 4 ms. Therefore, with a gradual increase in the flow rate, the reduction in the “hanging arc” time at the tip of the electrode can significantly shorten the gliding arc discharge period and accelerate the dissipation of the gliding arc energy by enhancing the convection so that it quickly generates a new arc at the throat of the blade electrode to enter the next cycle.

3.2.3. Influence on Discharge Mode

In the experiment, the input voltage of the high-frequency AC power supply was controlled by a voltage regulator to 85 V. In Figure 7, the electrical signal waveform of gliding arc atmospheric nitrogen fixation with different air flow rates and its influence on the discharge mode ratio is marked with the distribution ratio of the B-G discharge mode of the bright discharge channel and the A-G discharge mode developed by the arc flame. Figure 7a shows the voltage and current signals generated when the air flow rate is 0.8 L/min and the input voltage is 85 V. It can be seen that at 0.8 L/min air flow rate, most discharges are dominated by the A-G mode, and it can also be intuitively seen from the current signal that the number of current signals exceeding 1 A is less. Figure 7b shows the voltage and current signals generated when the air flow rate is 1.6 L/min and the input voltage is 85 V. It can be seen that under the air flow rate of 1.6 L/min, the frequency of current–voltage signal and fluctuation of 0.8 L/min increase, and the number of discharge cycles also increases. Under this condition, the current signal has seven peak changes of more than 1 A. Figure 7c shows the voltage and current signals generated when the air flow rate is 2.4 L/min and the input voltage is 85 V. It can be seen that under the air flow rate of 2.4 L/min, the current signal has a peak change of more than 1 A for 15 to 16 times under this condition, and the number of discharge cycles is significantly increased compared with that under the air flow rate of 1.6 L/min and 0.8 L/min. Figure 7d shows the voltage and current signals generated when the air flow rate is 3.2 L/min and the input voltage is 85 V. It can be seen that under the air flow rate of 3.2 L/min, the increase in the number of discharge cycles is more obvious at the same time. Figure 7e shows the voltage and current signals generated when the air flow rate is 4.0 L/min and the input voltage is 85 V. It can be seen that under the air flow rate of 4.0 L/min, the signal fluctuation is large, and each regeneration of the sliding arc is generated in B-G mode. Therefore, under a strong convection flow rate, the cycle time of the sliding arc discharge is shorter, which also means that the number of B-G modes of re-breakdown increases. The B-G pattern is introduced too frequently, while the A-G pattern is the opposite. Figure 7f shows the proportion of the data of the two discharge modes. When the air flow rate is 0.8 L/min, the A-G mode accounts for a large proportion ( 91%). With an increase in the air flow rate, the A-G mode gradually weakens, and the two discharge modes are almost flat when the air flow rate is 2.4 L/min and 3.2 L/min. The B-G mode is the dominant mode of discharge, and 55% of the discharge patterns in this condition belong to the B-G mode.
As can be seen from the figure above, the change in air flow in the reactor directly affects the distribution of the proportion of discharge modes, and the discharge mode is more transformed from the A-G discharge mode to the B-G discharge mode with the increase in the air flow rate. When the inlet air flow rate of the reactor is 0.8 L/min and 1.6 L/min, the gliding arc discharge mode is dominated by the stable gliding A-G discharge, and the proportion of A-G discharge can reach 91% and 70%, respectively. When the air flow rate increases according to the gradient grade, the B-G discharge mode dominates. When the inlet flow rate of the reactor is 4 L/min, the B-G discharge mode accounts for a larger distribution, up to 55%, while the A-G discharge mode decreases from 91% at 0.8 L/min to 45%, and a large number of current peaks interfere with the gliding stable discharge mode. Therefore, the inlet flow rate of the reactor not only accelerates the energy dissipation of the gliding arc as a means of strengthening the flow but also has a certain effect on the distribution of the discharge mode. Strong convection cooling promotes the development of an extremely unstable B-G discharge mode, while a low flow convection can effectively produce a stable A-G discharge mode.

3.3. Influence of Air Flow Rate on Plasma Nitrogen Fixation

3.3.1. Influence on Nitrogen Oxide Concentration

In the experiment, the input voltage was maintained at 80 V, the atmospheric nitrogen fixation time was maintained at 1 min, and the electrode spacing and angle were unchanged. Figure 8 shows the influence of different air flows on the atmospheric nitrogen fixation products. When the inlet air flow rate of the reactor is 0.8 L/min, the nitrogen oxides generated by atmospheric nitrogen fixation (mainly NO and NO2 as test objects) are the highest, and the nitrogen oxides generated by atmospheric nitrogen fixation are as high as 7722 ppm. However, with an increase in the air flow rate, the nitrogen oxides generated by atmospheric nitrogen fixation are reduced accordingly. In particular, the nitrogen oxides produced at 4 L/min are only 4338 ppm, which is 56.18% of the nitrogen oxides produced at 0.8 L/min. In Section 3.2, we determined that different inlet flow rates have a certain relationship with the distribution of the gliding arc discharge period and mode proportion. From the perspective of the discharge period, the longer “hanging arc” time means a longer gliding arc discharge period and the corresponding nitrogen oxide concentration is the highest at this time. With an increase in the air flow rate, the discharge period becomes increasingly smaller. The product of atmospheric nitrogen fixation also decreases with the shortening of the discharge period. From the point of view of the discharge mode, the gliding arc discharge at a low flow rate is mainly in the A-G mode, where the gliding arc energy is high and the discharge is stable, whereas the strong convection at a high flow rate increases the form of the B-G mode discharge. Therefore, we speculate that the introduction of unstable discharge that is too frequent is the main reason for the low generation of nitrogen oxides.

3.3.2. Influence on Nitrogen Fixation Performance

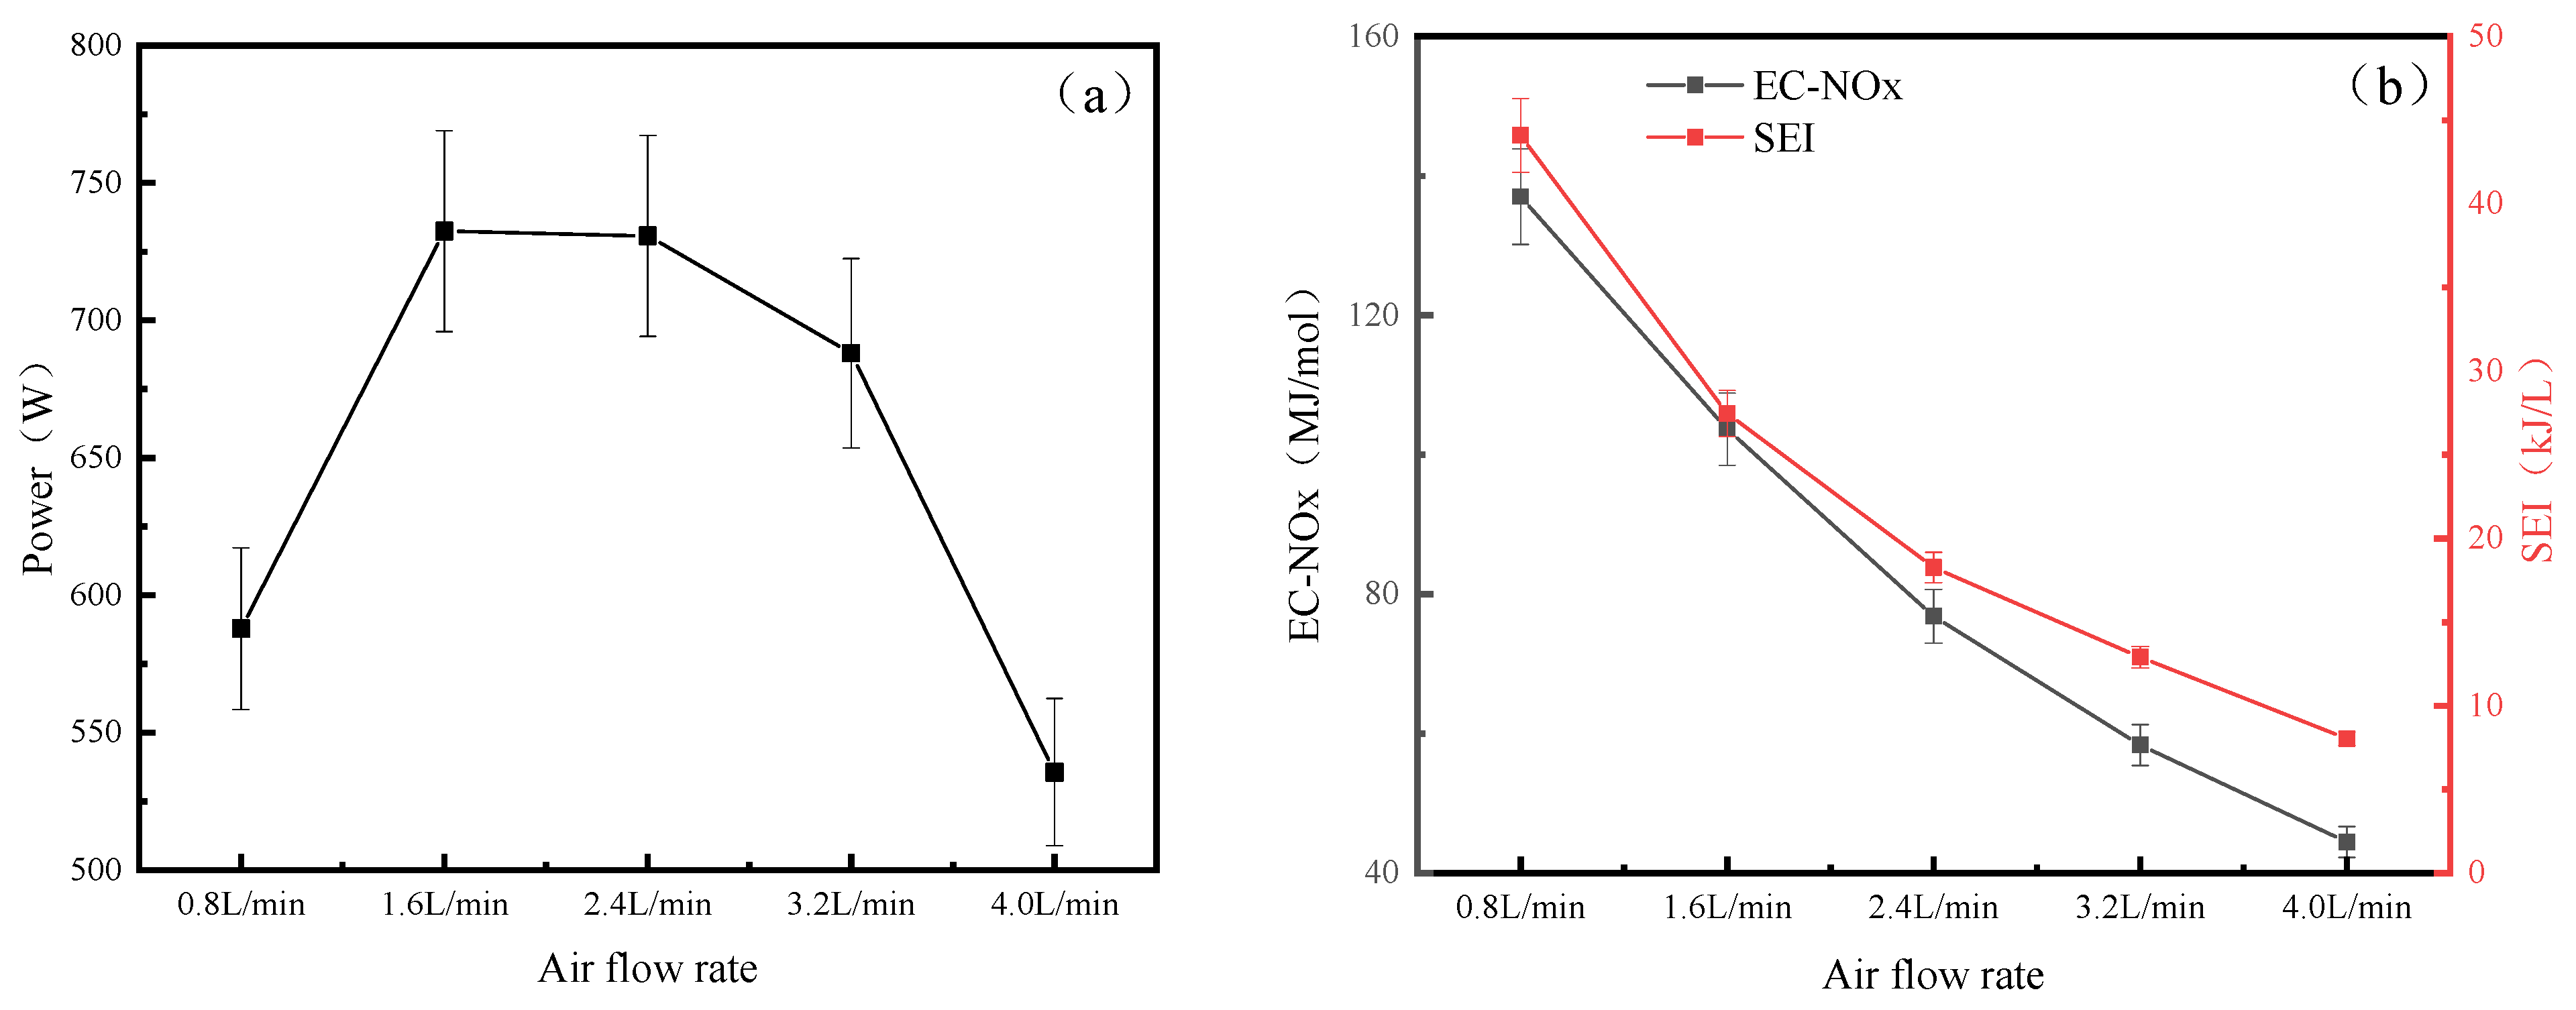
In the experiment, the input voltage was maintained at 80 V, the atmospheric nitrogen fixation time was maintained at 1 min, and the electrode spacing and angle were unchanged. Figure 9a shows the influence of different air flows on atmospheric nitrogen fixation performance, and Figure 9a shows the influence of the sliding arc discharge power. Under different air flow rates, the sliding arc discharge energy increases first and then decreases. Although we performed the experiment at a very small air flow, we speculate that this is related to the electrode length of the plasma reactor, which results in a higher power. The sliding arc discharge power decreases with an increase in the air flow. When the air flow rate is greater than 2.4 L/min, the B-G discharge mode is used as the main discharge mode, which greatly increases the loss of strong convection cooling and weakens the sliding arc discharge. At the same time, it can be seen from Figure 9b that the influence of the sliding arc on nitrogen fixation energy consumption per unit flow shows a decreasing trend. When the air flow rate increases from 0.8 L/min to 1.6 L/min, the energy consumption per unit flow rate decreases by 16.62 kJ/L. Although it is mentioned in Section 3.3.1 that when the air flow rate is 0.8 L/min, the concentration of nitrogen oxides generated is higher, and the energy consumption for generating 1 mol of nitrogen oxides is also quite high from the perspective of the energy consumption of generating 1 mol of nitrogen oxides. The same rule applies to the energy consumed to produce 1 mol of nitrous oxide gas.
Therefore, when the flow rate is 4 L/min, the lowest energy consumption has certain advantages, suitable for accessing the remaining power of distributed photovoltaic nitrogen fixation from an economic point of view, and the nitrogen fixation capacity of the system belongs to the upper level. However, since the energy consumption is high, and the main purpose is to promote regional photovoltaic consumption, we can adjust the nitrogen fixation performance in the solar power period. This also needs to consume more energy, but it is possible to reduce energy consumption during the peak of solar power generation and keep it low so that one can effectively use this double-edged sword.

4. Conclusions

In this paper, a gliding arc plasma agricultural nitrogen fixation system based on solar power generation is designed. The discharge characteristics and discharge modes during the process of nitrogen fixation by the gliding arc are discussed on the basis of experiments. The influences of air flow, an important factor affecting the gliding arc discharge, and the distribution of discharge parameters, discharge period, and discharge modes are studied. The main conclusions are as follows:
(1)
The gliding arc plasma nitrogen fixation has a certain periodicity during discharge, and its electrical parameters, including current, voltage, and power, change periodically. The gliding arc plasma also mainly discharges in two modes during nitrogen fixation, one of which is the bright channel B-G mode discharge generated at the bottom of the electrode in a strong convection and high flow rate environment. At this time, the arc combustion is not stable, and there are many high-voltage points, which are due to the unstable breakdown of the air gap, and the repeated arc breakdown, causing extinction. The other is the red-purple channel A-G mode discharge at a low flow rate and a weak convection environment. At this time, the arc combustion is stable, and with an increase in the arc height, the arc resistance also increases, resulting in a gradual increase in the arc voltage. In the end, the power supply energy is not enough to maintain stable arc combustion, and the arc is extinguished.
(2)
There is a correlation between the air air flow of the reactor and the periodicity of nitrogen fixation in the gliding arc, which affects the discharge time of the gliding arc and the number of cycles under the same acquisition time. When the air flow rate of the air inlet in the reactor increased from 0.8 L/min to 4 L/min, the discharge period was significantly reduced, and the average discharge period was reduced from 49.5 ms to 10.1 ms, and the shortest discharge period was as short as 3 ms. With the gradual increase in the inlet flow rate of the reactor, the reduction in the arc hanging time at the tip of the electrode can significantly shorten the gliding arc discharge period and accelerate the dissipation of gliding arc energy by strengthening the convection, so that it quickly generates a new arc in the throat of the blade electrode to enter the next cycle.
(3)
There is a correlation between the flow rate of the reactor and the nitrogen fixation performance of the gliding arc plasma, which affects the nitrogen oxide concentration, energy density, energy consumption, and other performance parameters of the gliding arc plasma. With an increase in air flow, the nitrogen oxide generated by atmospheric nitrogen fixation decreased; in particular, the nitrogen oxide generated at 4 L/min was only 4338 ppm, which was 56.18% of the nitrogen oxide generated at 0.8 L/min. When the air flow rate is 0.8 L/min, the generated nitrogen oxide concentration is higher, but because of the energy consumption of generating 1 mol of nitrogen oxide, the energy consumption is also quite high. Therefore, when the flow rate is 4 L/min, the minimum energy consumption for generating 1 mol of NOx is 42.69 MJ/mol.
Although the nitrogen oxides generated by the system are not particularly excellent, the access to distributed photovoltaic roofs in rural and remote areas can effectively use available solar energy resources, avoid energy waste in areas where wind and solar energy are abandoned, use new energy generation to power plasma, stop use in the peak of electricity consumption, and continue to fix agricultural nitrogen during the low period, bringing double benefits to farmers. In future work, it is necessary to cooperate with the catalyst to ensure that the system plays a more important role in nitrogen fixation.

Author Contributions

Conceptualization, L.W. and Q.Z.; methodology, L.L. and Q.Z.; software, Y.L. and H.Q.; validation, J.Y., L.W. and Q.Z.; formal analysis, D.Z.; investigation, L.W. and Z.X.; resources, Z.X.; data curation, Y.L. and L.L.; writing—original draft preparation, Q.Z. and H.Q.; writing—review and editing, L.L.; supervision, L.L. and L.W.; project administration, Z.X. and Z.W.; funding acquisition, L.W. All authors have read and agreed to the published version of the manuscript.

Funding

This paper was supported by the Scientific Research Project of the Education Department of Liaoning Province and the Inner Mongolia Autonomous Region Science and Technology Innovation Guidance Award Fund Project with grant numbers LJKMZ20221032 and CXYD2022004.

Data Availability Statement

The data presented in this study are available on request from the corresponding author. The data are not publicly available due to the related plasma discharge equipment made by the laboratory and the related privacy involved.

Acknowledgments

The authors are grateful for the support of the Inner Mongolia Autonomous Region Science and Technology Innovation Guidance Award Fund Project and the Scientific research project of the Education Department of Liaoning Province.

Conflicts of Interest

The authors declare no conflict of interest.

References

  1. Krishan, O.; Suhag, S. Techno-economic analysis of a hybrid renewable energy system for an energy poor rural community. J. Energy Storage 2019, 23, 305–319. [Google Scholar] [CrossRef]
  2. Chaurey, A.; Kandpal, T.C. Assessment and evaluation of PV based decentralized rural electrification: An overview. Renew. Sustain. Energy Rev. 2010, 14, 2266–2278. [Google Scholar] [CrossRef]
  3. Shahsavari, A.; Akbari, M. Potential of solar energy in developing countries for reducing energy-related emissions. Renew. Sustain. Energy Rev. 2018, 90, 275–291. [Google Scholar] [CrossRef]
  4. Xie, M.; Jia, T.; Dai, Y. Hybrid photovoltaic/solar chimney power plant combined with agriculture: The transformation of a decommissioned coal-fired power plant. Renew. Energy 2022, 191, 1–16. [Google Scholar] [CrossRef]
  5. Xue, J. Photovoltaic agriculture-New opportunity for photovoltaic applications in China. Renew. Sustain. Energy Rev. 2017, 73, 1–9. [Google Scholar] [CrossRef]
  6. Krouk, G.; Kiba, T. Nitrogen and phosphorus interactions in plants: From agronomic to physiological and molecular insights. Curr. Opin. Plant Biol. 2020, 57, 104–109. [Google Scholar] [CrossRef]
  7. Parsons, C.; Stüeken, E.E.; Rosen, C.J.; Mateos, K.; Anderson, R.E. Radiation of nitrogen-metabolizing enzymes across the tree of life tracks environmental transitions in Earth history. Geobiology 2021, 19, 18–34. [Google Scholar] [CrossRef]
  8. Takai, K. The nitrogen cycle: A large, fast, and mystifying cycle. Microbes Environ. 2019, 34, 223–225. [Google Scholar] [CrossRef] [Green Version]
  9. Anastasopoulou, A.; Keijzer, R.; Butala, S.; Lang, J.; Van Rooij, G.; Hessel, V. Eco-efficiency analysis of plasma-assisted nitrogen fixation. J. Phys. D Appl. Phys. 2020, 53, 234001. [Google Scholar] [CrossRef]
  10. Chen, S.; Liu, D.; Peng, T. Fundamentals and recent progress of photocatalytic nitrogen-fixation reaction over semiconductors. Sol. Rrl 2021, 5, 2000487. [Google Scholar] [CrossRef]
  11. Vu, M.H.; Sakar, M.; Hassanzadeh-Tabrizi, S.A.; Do, T.O. Photo (electro) catalytic nitrogen fixation: Problems and possibilities. Adv. Mater. Interfaces 2019, 6, 1900091. [Google Scholar] [CrossRef]
  12. Cherkasov, N.; Ibhadon, A.O.; Fitzpatrick, P. A review of the existing and alternative methods for greener nitrogen fixation. Chem. Eng. Process. Process Intensif. 2015, 90, 24–33. [Google Scholar] [CrossRef]
  13. Chen, H.; Wu, A.; Mathieu, S.; Gao, P.; Li, X.; Xu, B.Z.; Yan, J.; Tu, X. Highly efficient nitrogen fixation enabled by an atmospheric pressure rotating gliding arc. Plasma Process. Polym. 2021, 18, 2000200. [Google Scholar] [CrossRef]
  14. Šerá, B.; Scholtz, V.; Jirešová, J.; Khun, J.; Julák, J.; Šerý, M. Effects of non-thermal plasma treatment on seed germination and early growth of leguminous plants—A review. Plants 2021, 10, 1616. [Google Scholar] [CrossRef]
  15. Sharma, H.P.; Patel, A.H.; Pal, M. Effect of plasma activated water (PAW) on fruits and vegetables. Am. J. Food Nutr 2021, 9, 60–68. [Google Scholar] [CrossRef]
  16. Kyere-Yeboah, K.; Bique, I.K.; Qiao, X.C. Advances of non-thermal plasma discharge technology in degrading recalcitrant wastewater pollutants. A comprehensive review. Chemosphere 2023, 320, 138061. [Google Scholar] [CrossRef] [PubMed]
  17. Li, S.; Medrano, J.A.; Hessel, V.; Gallucci, F. Recent progress of plasma-assisted nitrogen fixation research: A review. Processes 2018, 6, 248. [Google Scholar] [CrossRef] [Green Version]
  18. Chen, H.; Yuan, D.; Wu, A.; Lin, X.; Li, X. Review of low-temperature plasma nitrogen fixation technology. Waste Dispos. Sustain. Energy 2021, 3, 201–217. [Google Scholar] [CrossRef]
  19. Discepoli, G.; Cruccolini, V.; Ricci, F.; Di Giuseppe, A.; Papi, S.; Grimaldi, C.N. Experimental characterisation of the thermal energy released by a Radio-Frequency Corona Igniter in nitrogen and air. Appl. Energy 2020, 263, 114617. [Google Scholar] [CrossRef] [Green Version]
  20. Patil, B.S.; Peeters, F.J.J.; van Rooij, G.J.; Medrano, J.A.; Gallucci, F.; Lang, J.; Wang, Q.; Hessel, V. Plasma assisted nitrogen oxide production from air: Using pulsed powered gliding arc reactor for a containerized plant. AIChE J. 2018, 64, 526–537. [Google Scholar] [CrossRef] [Green Version]
  21. Malik, M.A.; Jiang, C.; Heller, R.; Lane, J.; Hughes, D.; Schoenbach, K.H. Ozone-free nitric oxide production using an atmospheric pressure surface discharge–a way to minimize nitrogen dioxide co-production. Chem. Eng. J. 2016, 283, 631–638. [Google Scholar] [CrossRef]
  22. Chen, W.; Jin, D.; Cui, W.; Huang, S. Characteristics of gliding arc plasma and its application in swirl flame static instability control. Processes 2020, 8, 684. [Google Scholar] [CrossRef]
  23. Hu, C.; He, L.; Chen, Y.; Zhao, B.; Jun, D.; Qu, M.J. Electrical and optical characterizations of a rotating gliding arc plasma-enhanced combustion dome in an aero-engine combustor. J. Phys. D Appl. Phys. 2021, 54, 205202. [Google Scholar] [CrossRef]
  24. Jardali, F.; Van Alphen, S.; Creel, J.; Eshtehardi, H.A.; Axelsson, M.; Ingels, R.; Snyders, R.; Bogaerts, A. NOx production in a rotating gliding arc plasma: Potential avenue for sustainable nitrogen fixation. Green Chem. 2021, 23, 1748–1757. [Google Scholar] [CrossRef]
  25. Cheng, X.; Huimin, S.O.N.G.; Huang, S.; Yifei, Z.H.U.; Zhang, Z.; Zhenyang, L.I.; Min, J.I.A. Discharge and jet characteristics of gliding arc plasma igniter driven by pressure difference. Plasma Sci. Technol. 2022, 24, 115502. [Google Scholar] [CrossRef]
  26. Machala, Z.; Tarabová, B.; Sersenová, D.; Janda, M.; Hensel, K. Chemical and antibacterial effects of plasma activated water: Correlation with gaseous and aqueous reactive oxygen and nitrogen species, plasma sources and air flow conditions. J. Phys. D Appl. Phys. 2018, 52, 034002. [Google Scholar] [CrossRef]
  27. Wu, S.; Thapa, B.; Rivera, C.; Yuan, Y. Nitrate and nitrite fertilizer production from air and water by continuous flow liquid-phase plasma discharge. J. Environ. Chem. Eng. 2021, 9, 104761. [Google Scholar] [CrossRef]
  28. Ding, L.; Liu, S.; Mei, D.; Liu, F.; Fang, Z. Discharge Mode and Periodic Characteristics of an AC Gliding Arc Discharge in Nitrogen Environment. Zhongguo Dianji Gongcheng Xuebao/Proc. Chin. Soc. Electr. Eng. 2021, 41, 2939–2947. [Google Scholar] [CrossRef]
  29. Zhu, J.; Sun, Z.; Li, Z.; Ehn, A.; Aldén, M.; Salewski, M.; Leipold, F.; Kusano, Y. Dynamics, OH distributions and UV emission of a gliding arc at various flow-rates investigated by optical measurements. J. Phys. D Appl. Phys. 2014, 47, 295203. [Google Scholar] [CrossRef]
  30. Zhang, K.; Jin, D.; Huang, S.; Sun, J.; Song, F. Experimental Investigation on Multiple-Channel Gliding Arcs Plasma Cracking Kerosene. IEEE Trans. Plasma Sci. 2022, 50, 4732–4743. [Google Scholar] [CrossRef]
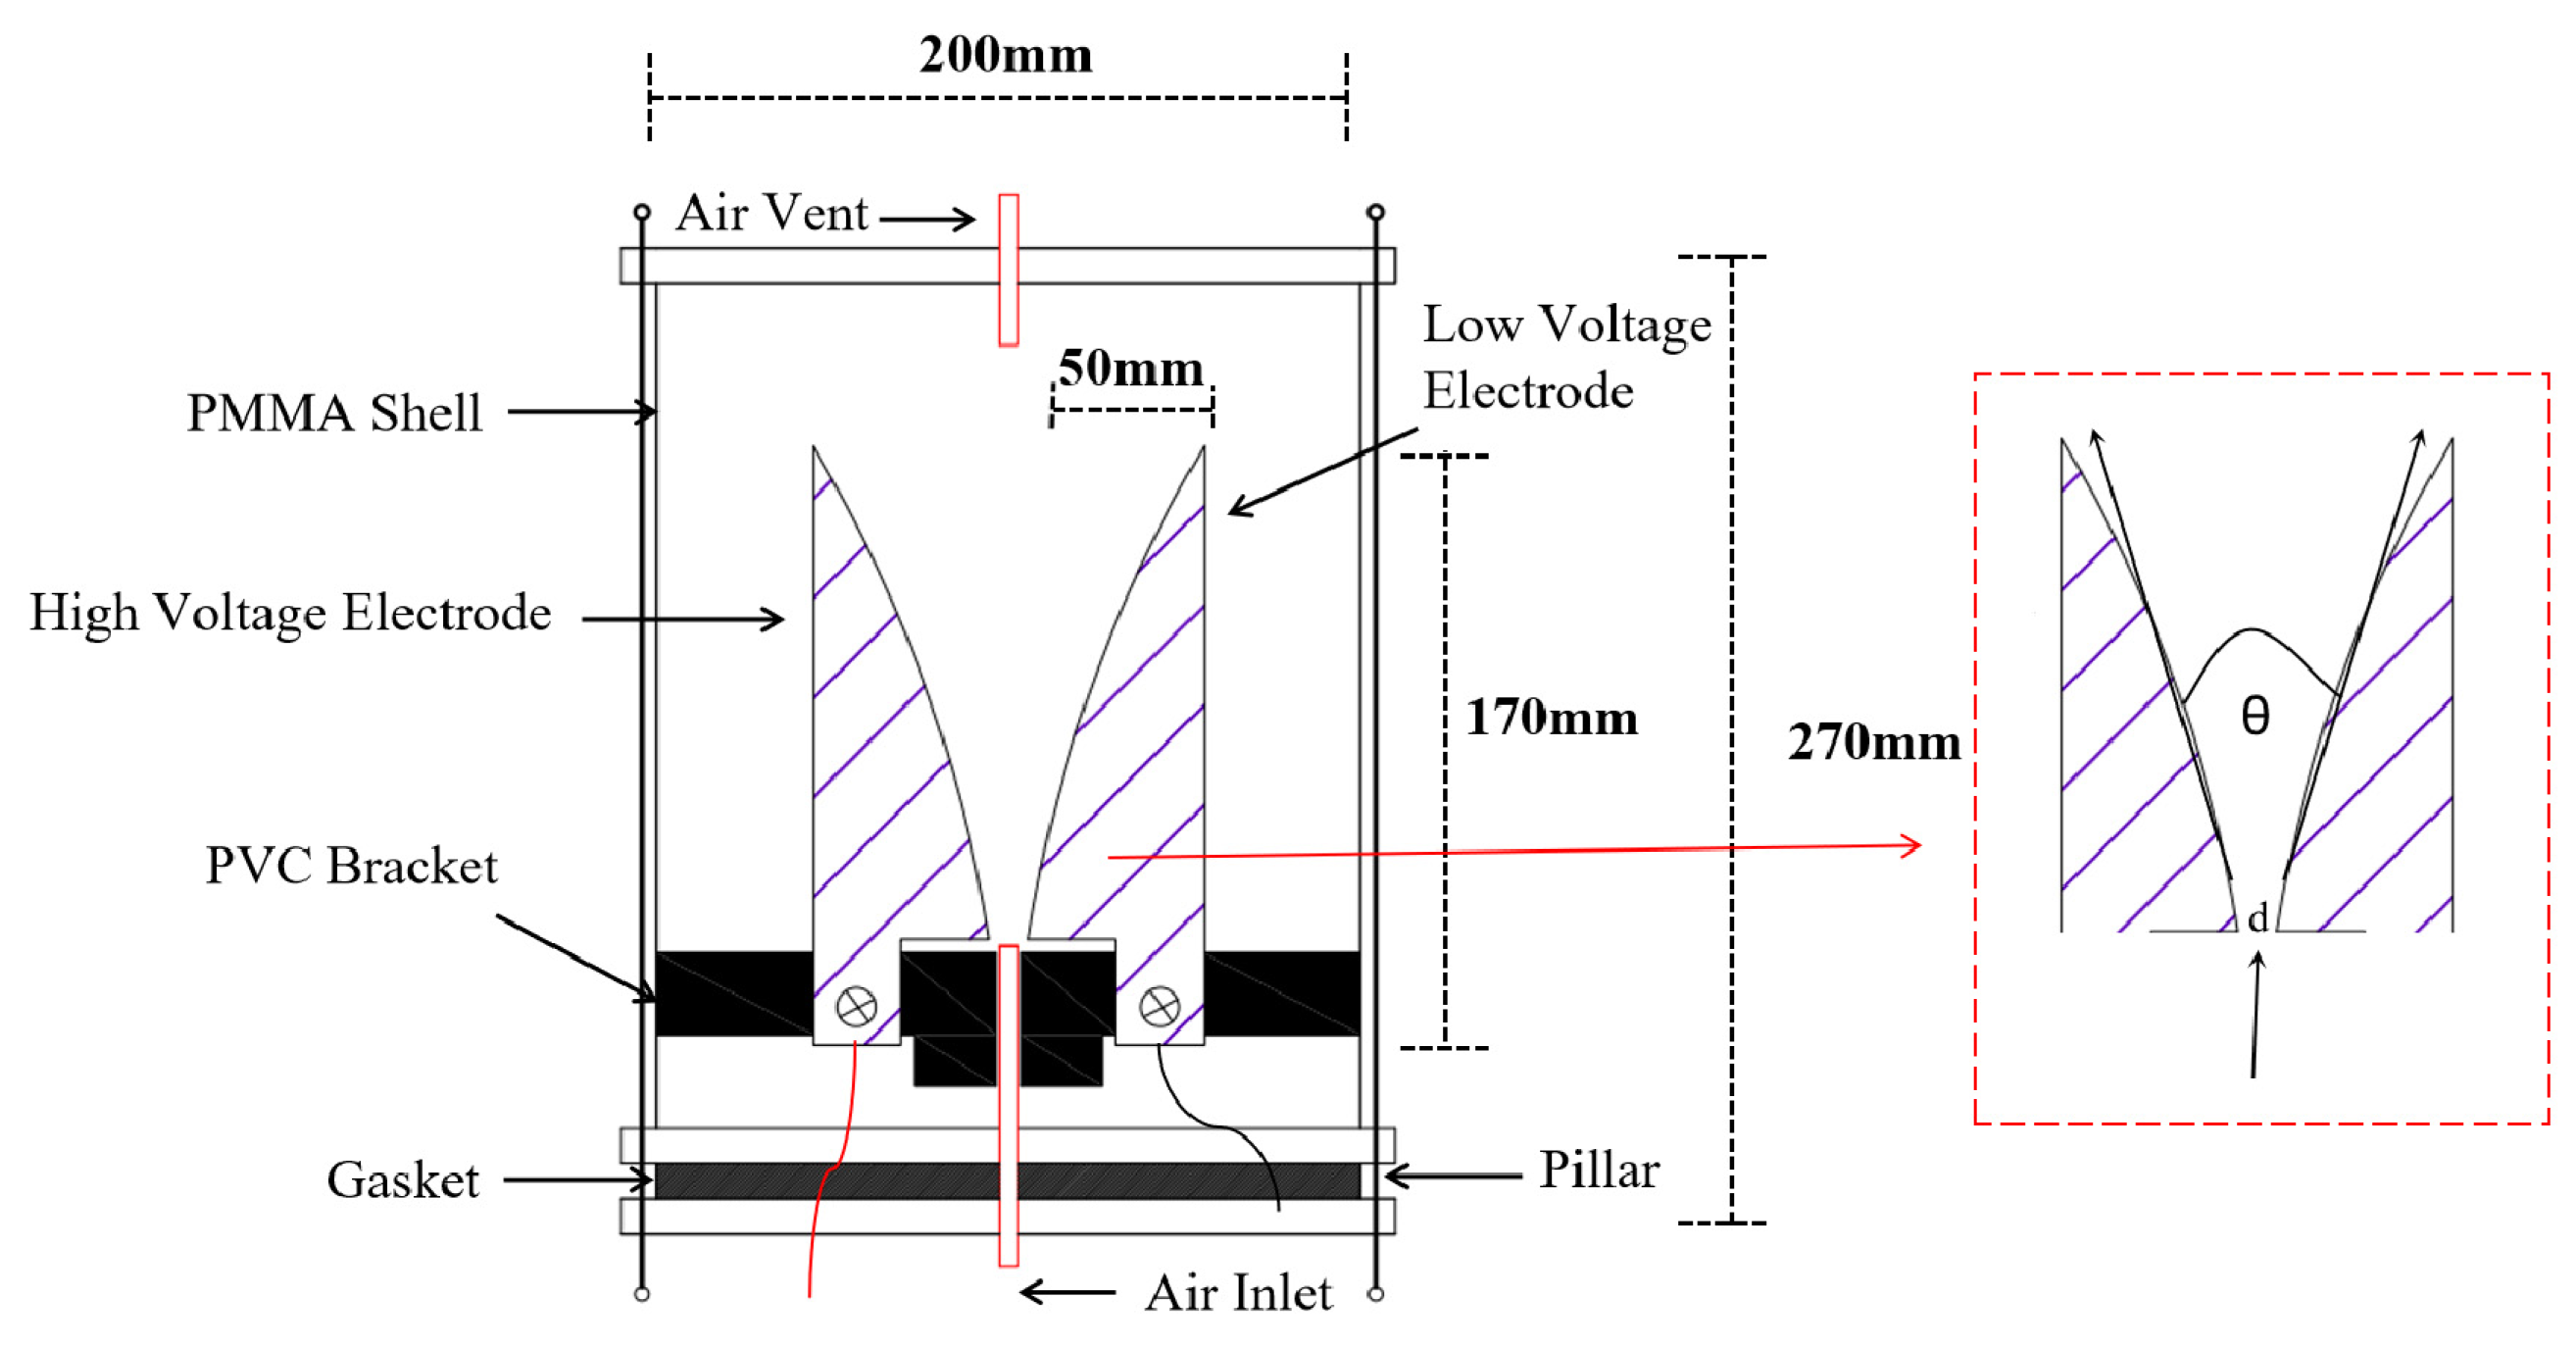
Figure 1. Gliding arc plasma reactor in this system.
Processes 11 02030 g001
Figure 2. Gliding arc discharge plasma system driven by photovoltaic. (a) Schematic diagram; (b) physical diagram.
Processes 11 02030 g002
Figure 3. Gliding arc state and waveform signal in the plasma nitrogen fixation. (a) Gliding arc state (CANON-5D4 camera shooting was used); (b) gliding arc voltage–current waveform signal (from t = −0.025 s to t = 0.055 s) and the three steps of the gliding arc development.
Processes 11 02030 g003
Figure 4. Two discharge modes with ordinary shots. (a) B-G mode; (b) A-G mode.
Processes 11 02030 g004
Figure 5. Voltage and current waveform under different air flow rates. (a) 0.8 L/min; (b) 1.6 L/min; (c) 2.4 L/min; (d) 3.2 L/min; (e) 4.0 L/min.
Processes 11 02030 g005
Figure 6. The influence of different air flow rates on the discharge periods.
Processes 11 02030 g006
Figure 7. Waveform and discharge mode ratio under different air flow rates. (a) 0.8 L/min; (b) 1.6 L/min; (c) 2.4 L/min; (d) 3.2 L/min; (e) 4.0 L/min; (f) proportion of discharge modes.
Processes 11 02030 g007
Figure 8. The influence of different air flow rates on nitrogen oxide concentration.
Processes 11 02030 g008
Figure 9. The influence of different air flow rates on nitrogen fixation performance. (a) Power; (b) energy consumption (energy consumption per unit flow and energy consumption for generating 1 mol of nitrogen oxides).
Processes 11 02030 g009
Table 1. The influence of different air flow rates on the number of discharge periods (500 ms).
Air Flow RateNumber of Discharge PeriodAverage Discharge Period
0.8 L/min1248.5 ms
1.6 L/min2133.9 ms
2.4 L/min3718.7 ms
3.2 L/min4413.2 ms
4.0 L/min6410.1 ms
Table 2. The influence of different air flow rates on the number of discharge periods (50 statistical frequencies).
Air Flow RateAverage Discharge Period
0.8 L/min44.1 ms
1.6 L/min30.8 ms
2.4 L/min17.0 ms
3.2 L/min12.0 ms
4.0 L/min9.18 ms
Disclaimer/Publisher’s Note: The statements, opinions and data contained in all publications are solely those of the individual author(s) and contributor(s) and not of MDPI and/or the editor(s). MDPI and/or the editor(s) disclaim responsibility for any injury to people or property resulting from any ideas, methods, instructions or products referred to in the content.