Article

Analysis of Solid-Liquid Two-Phase Flow in the Area of Rotor and Tailpipe

1
School of Energy and Power Engineering, Lanzhou University of Technology, Lanzhou 730050, China
2
State Key Laboratory of Fluid Machinery and Systems, Lanzhou 730050, China
*
Authors to whom correspondence should be addressed.
Processes 2023, 11(12), 3382; https://doi.org/10.3390/pr11123382
Submission received: 16 October 2023 / Revised: 17 November 2023 / Accepted: 24 November 2023 / Published: 6 December 2023
(This article belongs to the Special Issue Design and Optimization Method of Pumps)

Abstract

:
In order to study the internal flow state and wear law of a bulb cross-flow unit based on the particle non-uniform phase model in the Euler–Euler method, the solid-liquid two-phase flow condition of the hydraulic turbine under different solid-phase diameters, concentrations, and guide vane openings is calculated. The results show that (1) Under the same solid-phase physical parameters, the distribution of solid-phase concentration on the working surface of the blade is positively correlated with the opening degree of the guide vane, the concentration of the solid phase on the back of the blade is negatively correlated with the opening degree of the guide vane. (2) The addition of the solid phase changes the time-domain period of pressure pulsations at the rotor inlet and the tailpipe inlet under clear water conditions, and the tailpipe pressure pulsation coefficient decreases with increasing solid-phase concentration. The pressure pulsation coefficient increases with increasing solid-phase diameter and concentration at the inlet of the rotor. (3) Numerical simulation of the wear characteristics of cross-flow turbine by Finne’s wear model reveals that the two-phase flow condition with high concentration, large particle size and small openings has a more serious effect on turbine blade wear.

1. Introduction

Large hydropower stations constructed on major rivers and tributaries in China have resulted in the wear and tear of the turbine overflow parts due to factors such as reservoir capacity size, operational age and the engineering sand discharge method. In real engineering, cavitation and wear both interact and lead to serious consequences. In more than 100 existing medium and large hydropower stations in China, about 38% of the units have serious sediment wear and cavitation [1]. Wear and damage can lead to reduced efficiency, vibration, noise, and high maintenance cost of the turbine unit, which is very important for the safe and economic operation of the hydropower station. It poses a great threat to the safe and economic operation of hydropower stations [2]. China has a large number of sandy rivers, which is a particularly serious problem. Although a large amount of theoretical research has been carried out in recent years under the efforts of various parties and certain results have been obtained, the existing research, both on a theoretical basis and in practice, has a big gap with the real needs. In particular, it is in the two-phase flow of the basic scientific problems, especially in the two-phase flow of water and sand, the mechanism of water–sand two-phase flow and other basic scientific problems, where there is a lack of in-depth research. The theoretical test of two-phase flow should be actively carried out, and the protective materials and measures should be thoroughly studied and optimized [3]. Ge Xinfeng and other scholars used the Lagrangian particle-tracking model to study the solid-liquid two-phase flow of bulb through-flow in a hydraulic turbine under two blades and ultra-low head, and concluded that sediment particles have an enhancing effect on the vortex, so the unit should not be operated under the small opening condition [4]. Peng Shengyang and other scholars used the vortex analysis method to study the solid-liquid two-phase flow in the through-flow turbine, and calculated the vortex distribution in the region of the guide vane and the rotor [5]. Han Wei et al. carried out a non-stationary numerical simulation of sand-carrying water flow in the end gap of a hydraulic turbine guide vane, and obtained the distribution of the average wear rate of the main wear surfaces at different wear stages, and established a mathematical model and an approximate solution about the average wear rate and wear time [6]. Wu, Wei-Zhang, and other scholars predicted the internal wear of the hydraulic turbine by using the two-phase turbulence model on the basis of the two-phase flow model [7]. Suh predicted sediment erosion for different inlet solid-phase concentrations in a mixed-flow hydraulic turbine runner, and the results showed that the erosion location occurs mainly on the pressure side of the runner blades [8]. Neopane found that sediment wear is related to the sediment shape, concentration, particle size, and the turbine operating conditions, and that the wear rate can be reduced by operating the turbine at the optimum efficiency point [9]. Yasuyuki Nishi et al. studied the performance and flow field of a cross-flow turbine with a different number of blades and the results of the study reveal that the efficiency of an eight-bladed turbine is higher than a 24-bladed turbine [10]. W Yang et al. proposed a method to modify the blades of a bulb cross-flow turbine while keeping the main dimensions of the runner unchanged. In the revision method, the runner blades are represented by a set of co-ordinate points, for which one of the co-ordinates is fixed, and only the angle of the point is changed according to different modification purposes [11]. Esteban Ferrer gave an analytical solution for the blade-tail current interaction phenomenon of axial-flow hydraulic turbines used for wind and tidal energy generation, deduced the limiting case of the bladed turbine, and generalized it to the more common three-bladed turbines [12]. S. Lemay et al. investigated the velocity field inside the runner of a bulb cross-flow turbine using endoscopic PIV measurements [13]. J H Park et al. investigated the effect of runner blade shape on the performance of a cross-flow turbine [14]. G Balarac et al. predicted the flow inside a bulb cross-flow turbine at two different operating points using RANS and large eddy simulation and the results showed that the tailpipe wall’s turbulent kinetic energy is generated nearby and at the center, resulting in head loss [15]. A bulb through-flow hydraulic turbine will show a cavitation flow phenomenon in some working conditions. L G Sun et al. numerically calculated the cavitation flow for the same paddle opening, in the case of having different guide vane openings, and analyzed it, derived the phenomenon of a cavitation-induced zone and the development process, and analyzed it, and finally derived the rule of change of the cavitation performance [16]. T C Vu et al. conducted CFD analysis as well as experimental validation of a bulb cross-flow turbine to investigate the effect of the rotor impeller tip and hub clearance dimensions on the turbine performance [17]. Young-Do Choi conducted numerical simulations to analyze the performance of a miniature cross-flow turbine and the internal flow in the range of very low specific speed. The results show that the optimized arrangement of guide vane placement angle and blade placement angle contributes greatly to the improvement of turbine performance [18]. Sha Yi Liu et al. investigated the solid-liquid two-phase flow hydraulic transport characteristics of vortex pumps, and the results show that under the condition of certain particle concentration, the efficiency and head of the pump usually decrease with the increase of the particle size [19]. Weiguo Zhao conducted a study on the turbine performance and wear of a hydraulic turbine in solid-liquid two-phase flow, dynamics and wear, and the results showed that the distribution of solid particles is larger and wear is more severe at the turn and front end of the worm casing, and cavitation readily occurs at the blade outlet and the blade crown [20]. Sun Yuxiang et al. analyzed the effect of particle motion on the flow of the slurry in the pipeline, and it was shown that the lower the degree of sphericity, the greater the number of collisions between the particles and the pipeline and the greater the energy loss is [21]. Wu Yingchun et al. showed that with the increase of blade thickness in ceramic slurry pumps, the incidence angle of solid particles increases, resulting in a larger solid particle trajectory wrap angle, and the increase of blade thickness can reduce the blade leading edge and pressure surface wear [22]. Yao X. based on the Eulerian–Eulerian method, numerical simulation was carried out on long- and short-blade hydraulic turbines under sandy water conditions, and over a one-year period, under four different sand contents, the wear intensity was predicted [23]. Luo Xingqi investigated the effects of different shapes and positions of the leading edge and backing as well as blade geometrical parameters on the internal flow characteristics and energy properties of a bulb turbine [24].

2. Design Process and Model Building

2.1. Physical Model

The bulb through-flow turbine of Nanping Xiayang Hydropower Station is selected as the physical model for this project. The specific parameters are shown in Table 1.
In order to achieve the research objectives of this paper, the 3D modeling software Pro/E is used to model the full flow channel in three dimensions. The three-dimensional full flow field model from left to right is the inlet runner, bulb body, guide vane, runner, and tail water pipe. The length of the whole turbine is 52,300 mm, with the X-axis as the reference, the front half is 24,800 mm, and the back half is 27,500 mm. Due to the large size of the unit, the modeling needs to be precise and detailed. Its entire overflow components are shown in Figure 1.

2.2. Mesh Classification and Model Building

In order to meet the requirements of adapting to the complex physical boundary conditions, structured meshing is used, because the bulb cross-flow turbine with its flatter blade shape and larger torsion angle, and the rims of the blades and the outlet edges of the runner are thinner, an unstructured mesh is used. The number of full flow channel grids is 8.6 million, inlet section 0.4 million, guide vane section 1.95 million, rotor section 5.76 million, tail pipe section 0.49 million. There are two levels of static and dynamic interference between the turbine runner and the guide vane, and between the runner and the tail water pipe, and the information transfer between the fixed parts and the rotating parts is realized using the slip grid technique, so as to simulate the dynamic and static interferences. The slip grid technique is used to transfer the information between the fixed and rotating parts, thus simulating the dynamic and static interference flows. The unstructured grid of the active guide vane and runner is shown in Figure 2:

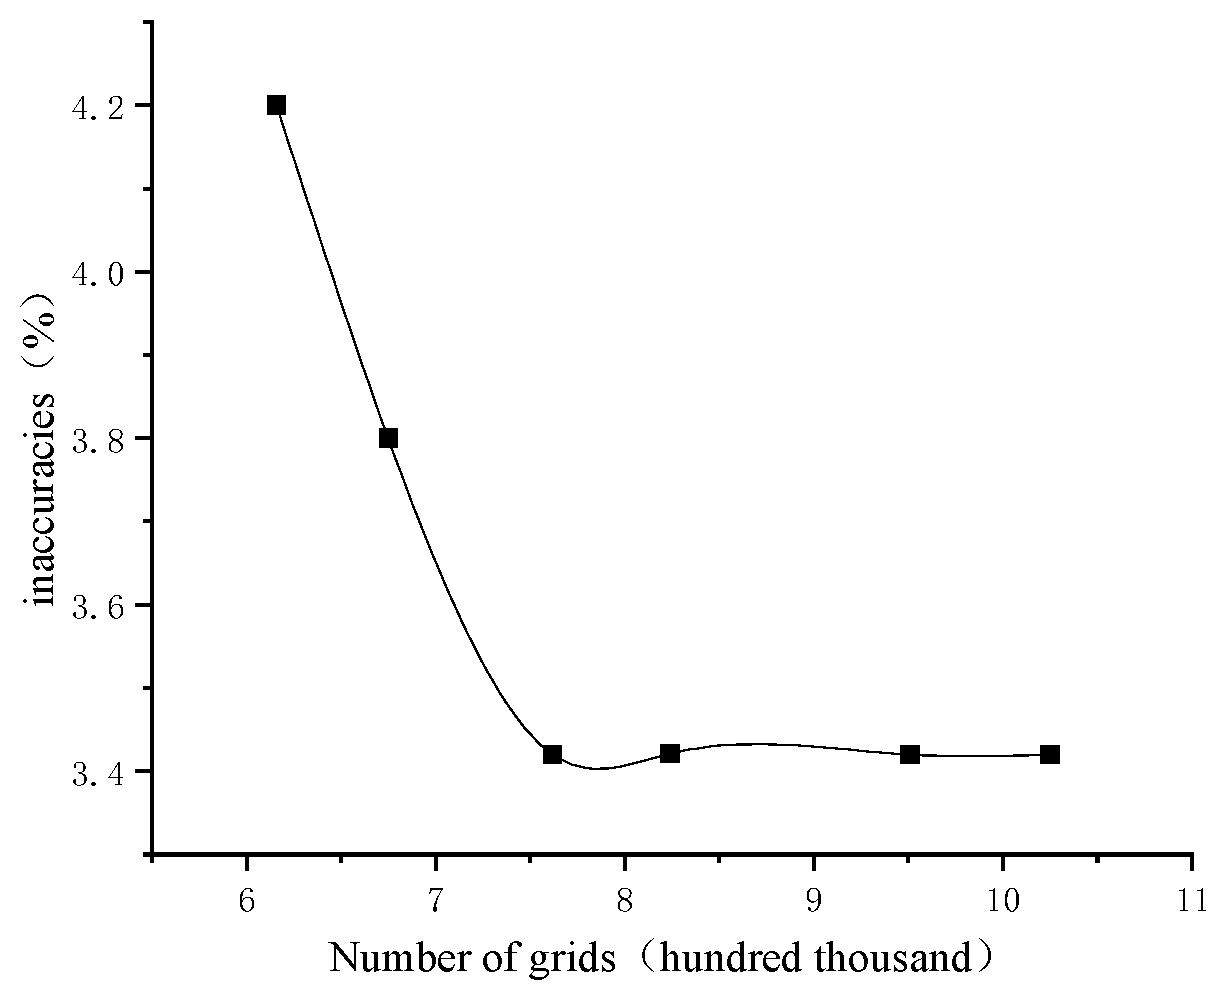
2.3. Grid-Independent Verification

The surface curvature of the overflow components of the bulb through-flow hydraulic turbine is large, and when meshing, in order to avoid the influence of mesh sparsity on the results of numerical calculations, mesh-independence validation should be carried out before further research on the bulb through-flow hydraulic turbine. For the comparison of the calculated efficiency and actual operating efficiency for the co-coupling condition with a paddle opening of 22° and a guide vane opening of 54°, six types of grids are used in the numerical calculation. As shown in Figure 3,the error between the numerical calculation efficiency and the real machine efficiency tends to be stabilized when the number of grids is greater than 8.5 million; the number of grids is finalized by calculation to be about 8.5 million.

2.4. Boundary Conditions

In the clear water condition, the fluid medium is water at a temperature of 298 K. The mass flow inlet is set up, the outlet is used for free outflow, and the turbulence model is RNG k-ε. The rotor area is set up as a rotating domain, and the other areas are stationary domains. For non-stationary calculations, the dynamic–static interface is of transient frozen rotor type, and the interface mesh is connected by GGI with no-slip wall conditions. The convergence accuracy is set to 1.0 × 10⁻⁵, the time step is 0.00583362 s, and the time used to rotate the rotor by 3°, and the transient calculation rotates the rotor by 6 cycles, and the total solution time is 4.20022 s, and the transient calculation is set to have a convergence criterion of 1 × 10⁻⁴. In the calculation of solid-liquid two-phase flow, the Eulerian–Eulerian method of the particle non-uniform phase model is used in the calculation of solid-liquid two-phase flow. The working condition is 58° for the guide vane opening and 22° for the paddle opening. The density of solid-phase particles is 2650 kg/m3, the volume concentration of particles is 1%, 3%, and 5%, and the particle diameters are 0.01 mm, 0.05 mm, and 0.15 mm. The discrete phase is simulated by the equation of zero, the trailing phase is simulated by the Gidaspow drag model, and the turbulence dissipative force is simulated by the Favre averaged drag force model, with a dissipation coefficient of 0.9, and the turbulence transport model is simulated by the Sato enhanced drag force model, with a dissipation coefficient of 0.9. The transport model uses Sato enhanced viscosity, and the SIMPLEC algorithm is used to solve the pressure–velocity coupling. Momentum exchange is considered for drag force and modeled using the Schiller–Naumann function without considering the effect of lift force, virtual mass force and wall lubrication force. The solid phase is set to free-slip and the liquid phase is modeled with no-slip boundary conditions. Constant-phase calculations are performed first, and then this result is used as an initial value before solid- and liquid-phase non-constant-phase calculations are performed.

2.5. Numerical Calculation Method

The Euler–Euler method of continuous and discrete same phase is the same when calculated using the N-S equation. There is no need to model the discrete phase in a separate calculation, applicable to the particle’s proposed fluid two-phase flow calculation model. Solve the governing equations as follows:
Liquid-phase mass conservation equation:
ρ t + x j ρ v j = S = n h m ˙ k
Solid-phase mass conservation equation:
n k t + x j n k v l j = x j v k σ k n k x j
Liquid-phase N-S equation:
t ρ v i + x j ρ v j v i = p x i + x j μ e v i x j + v j x i + Δ ρ g i + Σ ρ i v i i v i τ + v i S + F M i
Solid-phase N-S equations:
t n i v i l + x j n h v i i v i j = n i v i v l i τ i l + n l g i + n l m ˙ i v i v l i m l + F K , M i m h + x j v k n k v l x l + v l i x j + x j v i σ i v l j n k x i + v v n k x j
In the formula ρ is the fluid medium density; t is the time; v is the velocity vector; P is the medium pressure; C is the specific heat capacity; T is the temperature; Q is the flow rate; τ is the viscous force acting on the surface of the microelement; m, n are the unit vectors; μ, ε are the viscous coefficients of the fluid.

2.6. Reliability Verification

In order to ensure that the numerical calculation coincides with the real flow, this paper chooses the paddle opening of 22°, selects the guide vane opening of 50~62° for seven working condition points, and carries out numerical calculations on them, and compares the calculated results with the efficiency curves of the real machine test and the model machine test results, so as to determine a reliable numerical simulation.
Following the turbine efficiency equation to derive the efficiencies at various operating points for different guide vane openings it is found that in the numerical calculations, the efficiency shows a tendency of increasing and then decreasing, but it is consistent with the results of the real machine test. At the guide vane opening of 52°, the efficiency obtained by numerical calculation has the largest difference with that of the model test, but both of them are within the reasonable error range (≤6%), which indicates that the numerical calculation is accurate and reliable. As can be seen from Figure 4, the efficiency value of the real machine test is higher than that of the numerical calculation, which is affected by the fact that the turbine model will increase the local hydraulic loss when scaled down, and the numerically calculated efficiency value is slightly higher than the efficiency of the turbine model in the T5 test stand, shown in Figure 5. Comparison of the experimental results with the numerical calculations shows that the hydraulic model developed in this paper has high accuracy, and the numerical calculations and the turbulence model have high credibility.

3. Result

3.1. Flow Analysis of the Rotor Domain

Figure 6 shows the distribution of blade intermediate cross-section pressure along the streamline direction under different inlet solid-phase concentrations. The pressure gradient change under different inlet solid-phase concentrations is basically the same, and the pressure on the working surface of the blade is larger than that on the back surface, which forms a better pressure difference. The pressure at the working surface of the blade does not change much and shows a slightly decreasing trend along the streamline direction, and the pressure at the back surface gradually increases along the streamline direction. The change of solid-phase concentration has a greater effect on the blade inlet side load. With the increase of solid-phase concentration, the value of blade working surface pressure and negative pressure on the back of the blade increases. The reason for this phenomenon is that with the increase of solid-phase concentration, the impact frequency of particles on the pressure surface of the turbine blade increases, so that the pressure on it increases. And the increase of solid-phase concentration leads to a lower pressure value at the inlet of the back of the blade, which increases the possibility of cavitation. It can be seen that the greater the solid-phase concentration the greater the pressure difference between the front and back of the blade, which are greater than the clear water condition. This is due to the two-phase flow conditions, with solid-phase particles relying on the movement of the water flow-damping effect. This is equivalent to increasing the viscosity of the liquid phase, which increases viscous pressure resistance, solid-phase concentration, fluid viscosity and shaft thrust.
Figure 7 shows the solid-phase velocity distribution on the blade surface for different solid-phase concentrations. It can be seen that with the increase of solid-phase concentration, the maximum solid-phase velocity on the blade surface increases. The maximum solid-phase velocity corresponding to solid-phase concentration of 1%, 3% and 5% is 19.322 m/s, 19.853 m/s and 20.4 m/s, respectively.
Figure 8 shows the solid-phase velocity at the blade surface near the rim along the streamline direction for different inlet solid-phase concentrations. It can be seen at the back of the blade inlet, due to particles and blade impact, that solid-phase velocity decreases rapidly; afterwards, the solid-phase velocity has a small rebound and the back of the overall solid-phase velocity along the direction of the flow gradually decreases. The working surface of the blade in the middle part of the sediment velocity change is not big, and the inlet and outlet of the solid-phase velocity along the direction of the flow line is gradually increased. At the back of the blade, the solid-phase concentration is high in the working condition, and the solid-phase velocity is large, which is more obvious between the inlet position of the blade and the middle of the blade. On the working surface of the blade near the inlet side, the solid-phase velocity decreases with the increase of the inlet solid-phase concentration; near the outlet side the solid-phase velocity increases with the increase of the inlet solid-phase concentration.
Figure 9 shows the distribution of solid-phase concentration on the blade surface at different inlet solid-phase concentrations, with the increase of inlet solid-phase concentration, the solid-phase concentration on the blade surface also increases. Combined with analysis of the solid-phase velocity on the blade surface, it can be concluded that with the increase of solid-phase concentration, the wear of the blade surface is more serious. Aggregation occurs at the water inlet at the back of the blade due to the loss of momentum caused by the solid-phase particles colliding with the water inlet edge and the water flow, so it will be aggregated at the water inlet edge at the back of the blade. There is a small area of low concentration at the inlet edge of the working surface of the blade, which is due to the large curvature of the blade airfoil, where the phenomenon of decanting is likely to occur, resulting in a low volume fraction of the solid phase.

3.2. Tailpipe Domain Flow Analysis

Figure 10 shows the XY-plane velocity streamlines of the tailpipe region under different solid-phase concentrations. Compared with the streamline velocity of 22.012 m/s in the clear-water condition, the streamline velocities in the two-phase flow condition all have different degrees of decrease. Under the solid-liquid two-phase condition, the maximum velocity in the XY plane of the tailpipe increases with the increase of solid-phase concentration, and the corresponding maximum streamline velocities are 21.744 m/s, 21.813 m/s, 21.822 m/s, respectively, for solid-phase concentrations of 1%, 3%, and 5%. The increase of solid-phase volume fraction and the increase of the number of particles result in a greater disturbance of the streamline of the water flow in the tailpipe basin.
Figure 11 shows the liquid-phase velocity distribution in the XY plane of the hydraulic turbine with different solid-phase concentrations. With the increase of solid-phase concentration, the liquid-phase velocity increases gradually, and the solid-phase concentration and the solid-phase velocity increases. The higher the solid-phase concentration, the larger the area of the high-velocity zone of the liquid phase at the tailpipe, which further indicates lower energy recovery in the tailpipe area, resulting in the decrease of the efficiency of the bulb cross-flow hydraulic turbine.
Figure 12 shows the solid-phase concentration distribution in the XY plane of the turbine, from which it can be seen that the high concentration area of the turbine under different solid-phase concentrations is mainly concentrated at the hub, and the tailpipe is close to the water discharge cone. With the increase of solid-phase concentration, the solid-phase concentration in the XY plane of the turbine increases proportionally.

3.3. Effect of Two-Phase Flow Conditions on the External Characteristics of the Unit

Turbine efficiency formula:
η t = M ω 9.81 Q H
where M is the torque of the runner on the rotating shaft, J; ω is the rotational angular velocity, rad/s; Q is the mass flow rate of the hydraulic turbine, kg/s; and H is the hydraulic head, m.
Figure 13 shows a comparison of the external characteristic curves of a bulb through-flow turbine under two-phase flow conditions with a guide vane opening of 58°and a paddle opening of 22°. It can be seen that the efficiency and output of the unit decrease when the solid-phase concentration and diameter increase. The reason for this is mainly due to the increase in solid-particle concentration and diameter. The solid particles on the flow field of the disturbance increases, resulting in vortex dissipation; impingement loss also increases, resulting in reduced hydraulic efficiency and power output. The increase in solid-phase concentration under the same inlet flow rate, and the increase in the number of particles, improves the viscosity of the solid-liquid two-phase fluid, the friction between the particles is enhanced, the energy loss at the wall increases, and the rotor will consume more energy in the rotation. From the point of view of work, the rotor’s need to perform extra work on the particles will lead to a decline in its efficiency. In the guide vane, runner and tail pipe area, collisions between solid-phase particles and overflow components, particles and particles, and between particles and the liquid-phase will cause friction, which will increase the energy loss. It can be seen that the unit output under clear water conditions is 5.516 MW and the efficiency is 95.18%. When the diameter of the solid phase is 0.15 mm, the output of the unit is 5.106 MW, which is 0.41 MW lower than that of the clear water condition, and the efficiency of the unit is 90.38%, which is 4.8% lower than that of the clear water condition. When the concentration of the solid phase is 5%, the output of the unit is 5.189 MW, which is 0.327 MW lower than that of the clear water condition, and the efficiency of the unit is 90.23%, which is 4.95 MW lower than that of the clear water condition. Compared with the clear water condition, the particles increase the friction of the internal flow, and the instability of the flow is enhanced, and the energy loss increases.

3.4. Pressure Pulsation Analysis

In order to carry out an in-depth study on the flow mechanism of solid-liquid two-phase flow inside the bulb cross-flow hydraulic turbine, non-stationary numerical calculations were carried out on the basis of the stationary results to provide a theoretical basis for the efficient and stable operation of the hydraulic turbine. As shown in Figure 14, monitoring points were set up at the turbine runner inlet and outlet locations and inside the tailwater pipe Taking one week of runner rotation as a cycle, six cycles were calculated and the data of the next three cycles were analyzed. The addition of solid-phase particles complicates the flow, thus affecting the stable operation of the bulb cross-flow turbine. Therefore, the study of pressure pulsation in the turbine can help to improve the operational stability of the turbine.
Figure 15 shows the time-domain diagram of different monitoring points under clear water conditions, it can be seen that in the position of the runner inlet and the tailpipe inlet (monitoring points A1–A4, B1–B4) there is a clear periodicity. As shown in Figure 15a, in the position of monitoring point A2, there are four peaks and valleys in one cycle, which coincides with the number of rotor blades, and the cyclic change of pressure pulsation here is completely affected by the number of blades. The maximum pressure value is found at monitoring point A1, which is near the rim of the wheel, and the pressure amplitude gradually decreases from the rim to the hub of the wheel. At the inlet of the tailpipe, the amplitude of the pressure pulsation is highest near the wall, and decreases towards the center. In contrast, At the location of monitoring point B2, as shown in Figure 15b. does not show obvious periodicity. The change rule of pressure pulsation amplitude is consistent with that at the inlet of the tailwater pipe. As shown in Figure 15c, the pressure fluctuation is the largest in the outlet of the rotor, which is due to the axial distance between the rotor blade and the inlet of the tailpipe being too short. There is a certain rotational component after the fluid passes through the rotor blade, and then flows into the inlet of the tailpipe where there is a dynamic and static interference, resulting in sharp pressure fluctuations here.

3.5. Pressure Pulsation Analysis with Different Solid-Phase Concentrations

Figure 16 shows the frequency domain characteristics of different monitoring points inside the turbine under different solid-phase concentrations, and it can be seen that at the A2 monitoring point, the main frequency is the blade-passing frequency of 5.7 Hz, and its corresponding pressure pulsation amplitude is positively correlated with the solid-phase concentration are 0.03686%, 0.0422%, and 0.05836%, respectively. Amplitude of fluctuation for solid phase concentrations of 1%, 3% and 5%. All of them are greater than 0.03067% for the clear water condition. At the monitoring point B2, the main frequency is the rotor rotation frequency of 1.426 Hz, and the larger the volume fraction of the solid phase, the larger the pressure pulsation coefficient corresponding to the main frequency, which are 0.621%, 0.6556%, 0.693%, respectively. All of them are larger than 0.37304% in the clear water condition. This is due to the solid-phase particles in this area. When the rotor rotates at high speed, the solid-phase particles repeatedly impact on the wall, the flow is turbulent, and the pressure pulsation coefficient gradually increases. The main frequency at monitoring point C1 is a low-frequency pressure pulsation of 0.57 Hz. With the increase of solid-phase concentration, the pressure pulsation coefficient corresponding to the main frequency gradually decreases, respectively, to 0.43%, 0.259%, 0.251%. This is because as the inlet solid-phase concentration increases, the mixed density of the two-phase flow medium increases accordingly, and the solid particles occupy a certain volume but do not generate hydrostatic pressure, which leads to a decrease in the instantaneous pressure, resulting in a gradual decrease in the pressure pulsation coefficient.

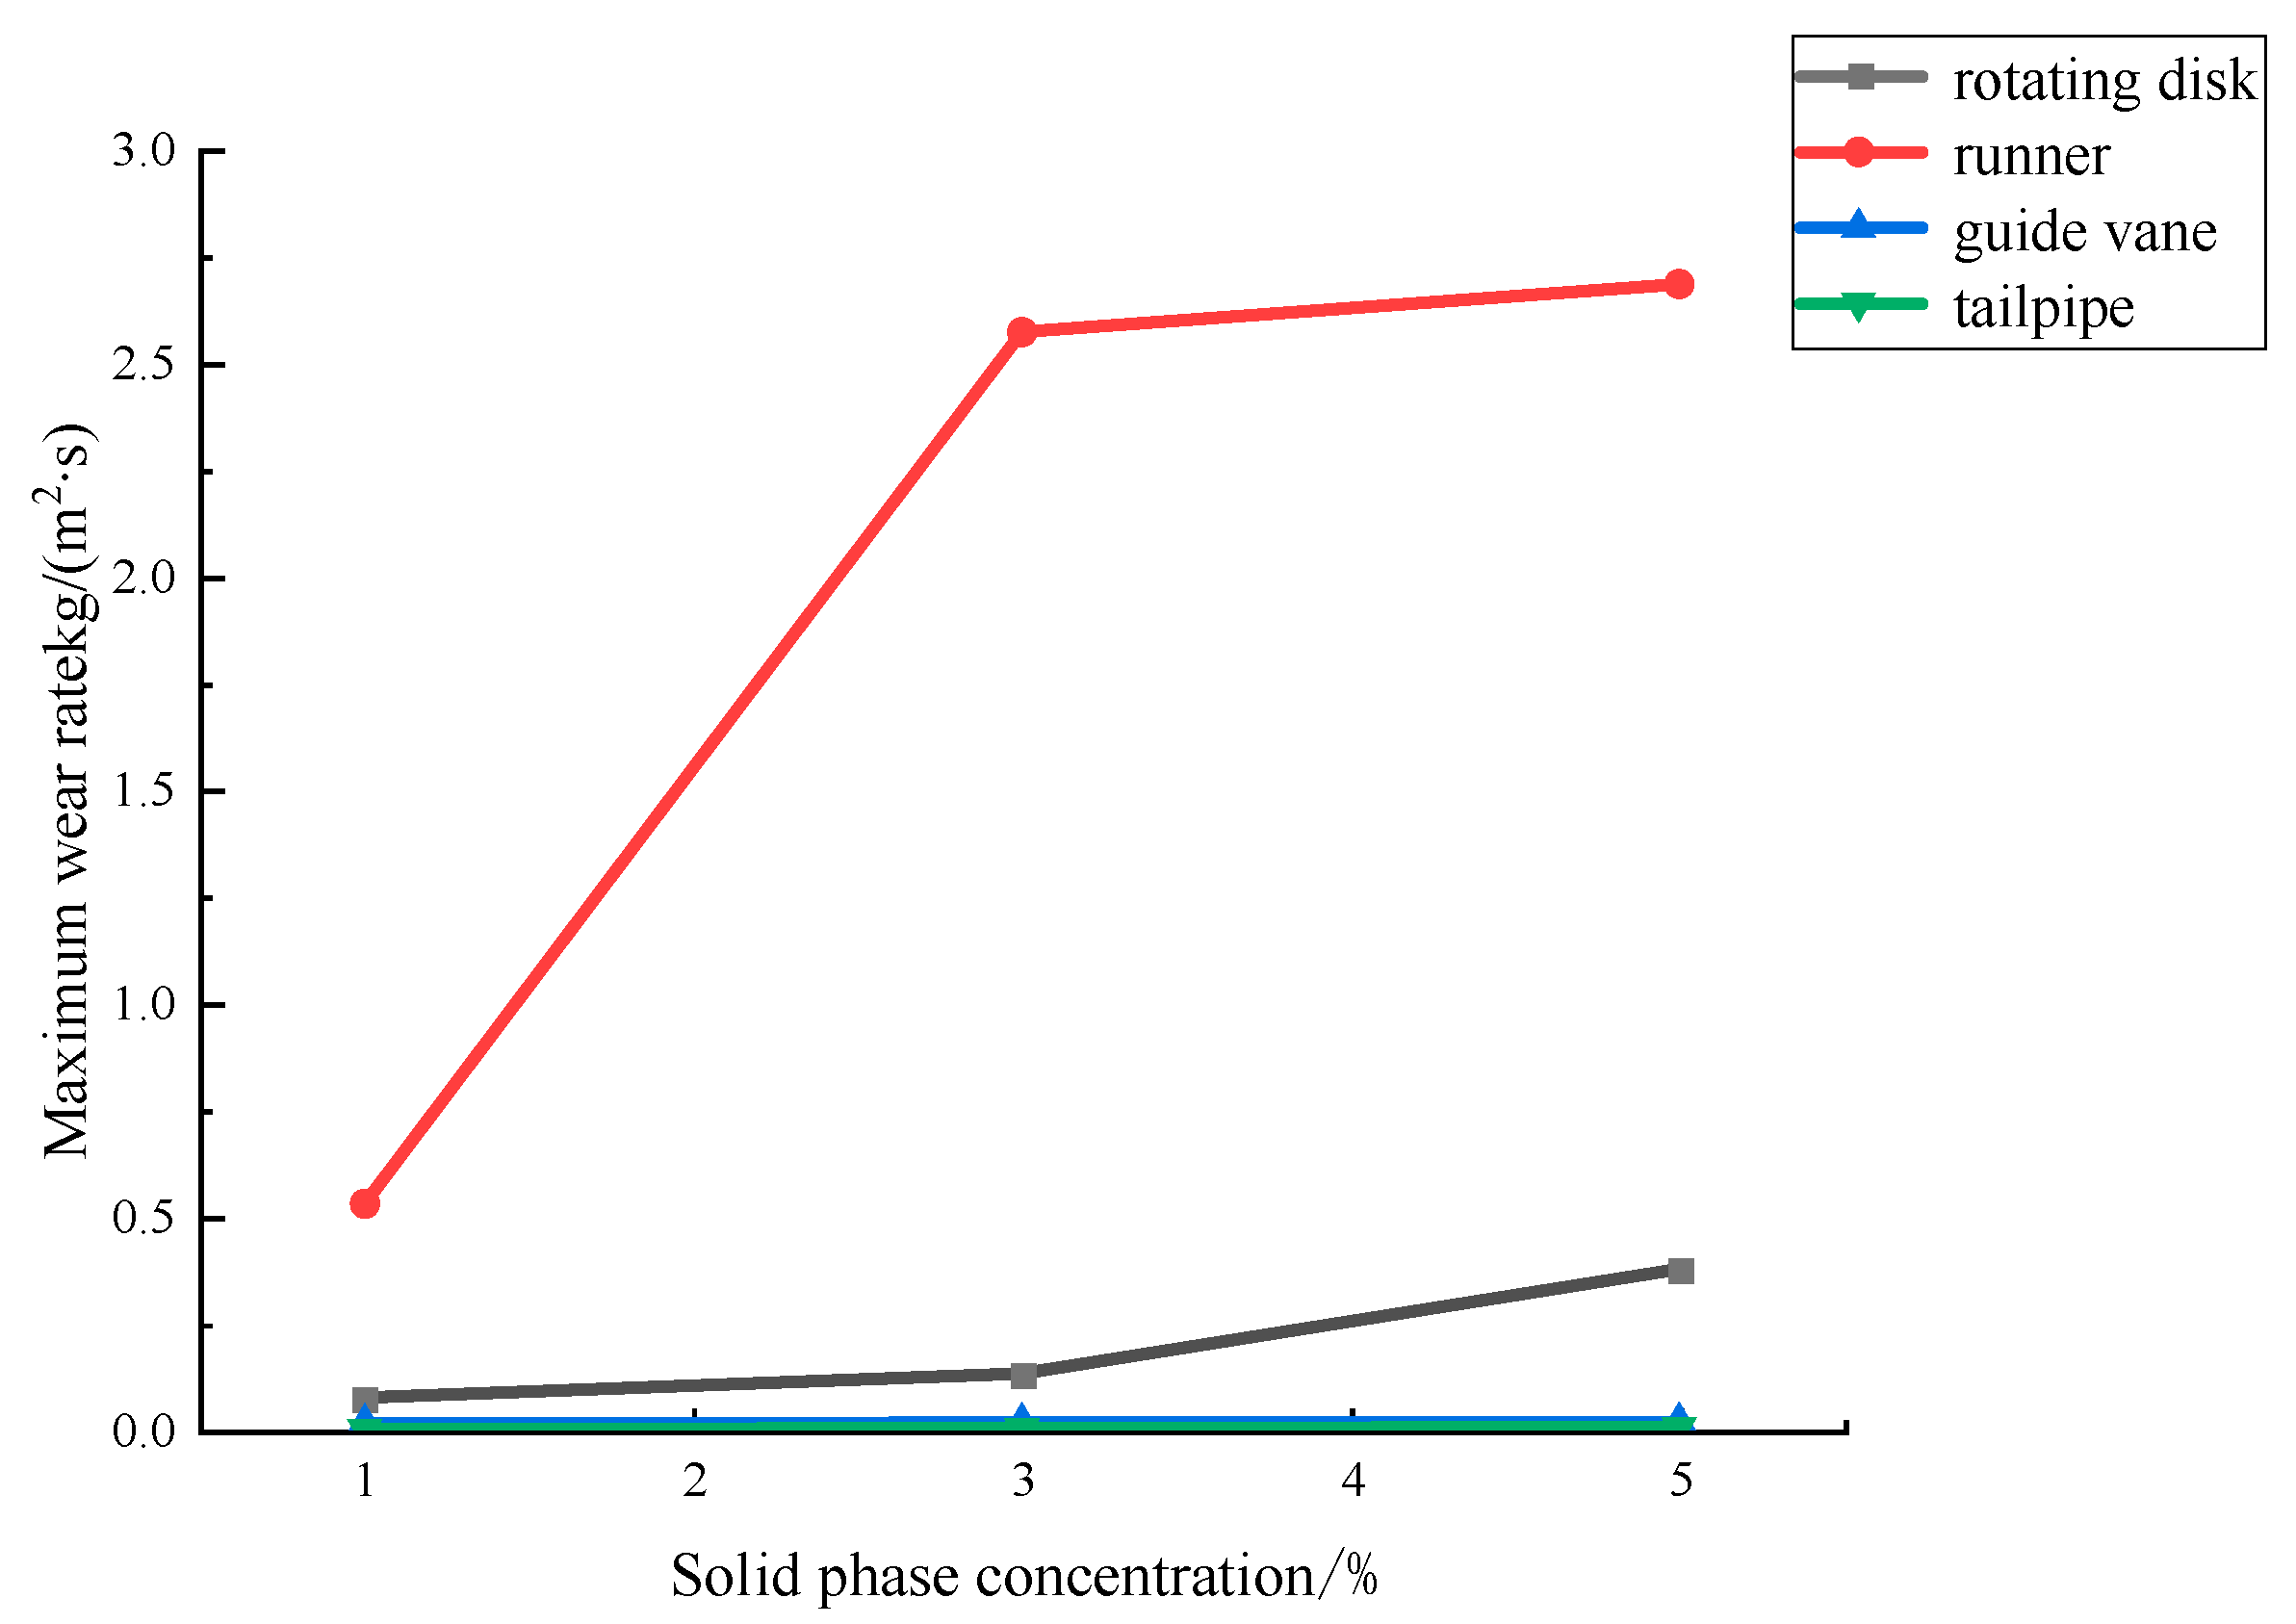
3.6. Wear Characteristics Analysis

Figure 17 shows the maximum wear rate of each component of the bulb through-flow turbine at different sediment concentrations. In general, the maximum wear rates of each overflow component at different sediment concentrations are, from largest to smallest, for the blades, runner chamber, guide vanes, and tailpipe. With the increase of sediment concentration, the maximum wear rate of blade, guide vane, runner chamber and tailpipe increases. It can be seen that the slope of the maximum wear rate curve in the blade region is larger and grows faster when the sediment concentration is 1% to 2%. The maximum wear rate in the rotor chamber area does not increase much when the sediment concentration is 1~2%, and the maximum wear rate grows faster at 2~3%. The change of sediment concentration has little effect on the maximum wear rate of guide vane and tail water pipe. In summary, the blade and runner area are the key parts of the unit to focus on during the flood season operation.

4. Conclusions

(1)
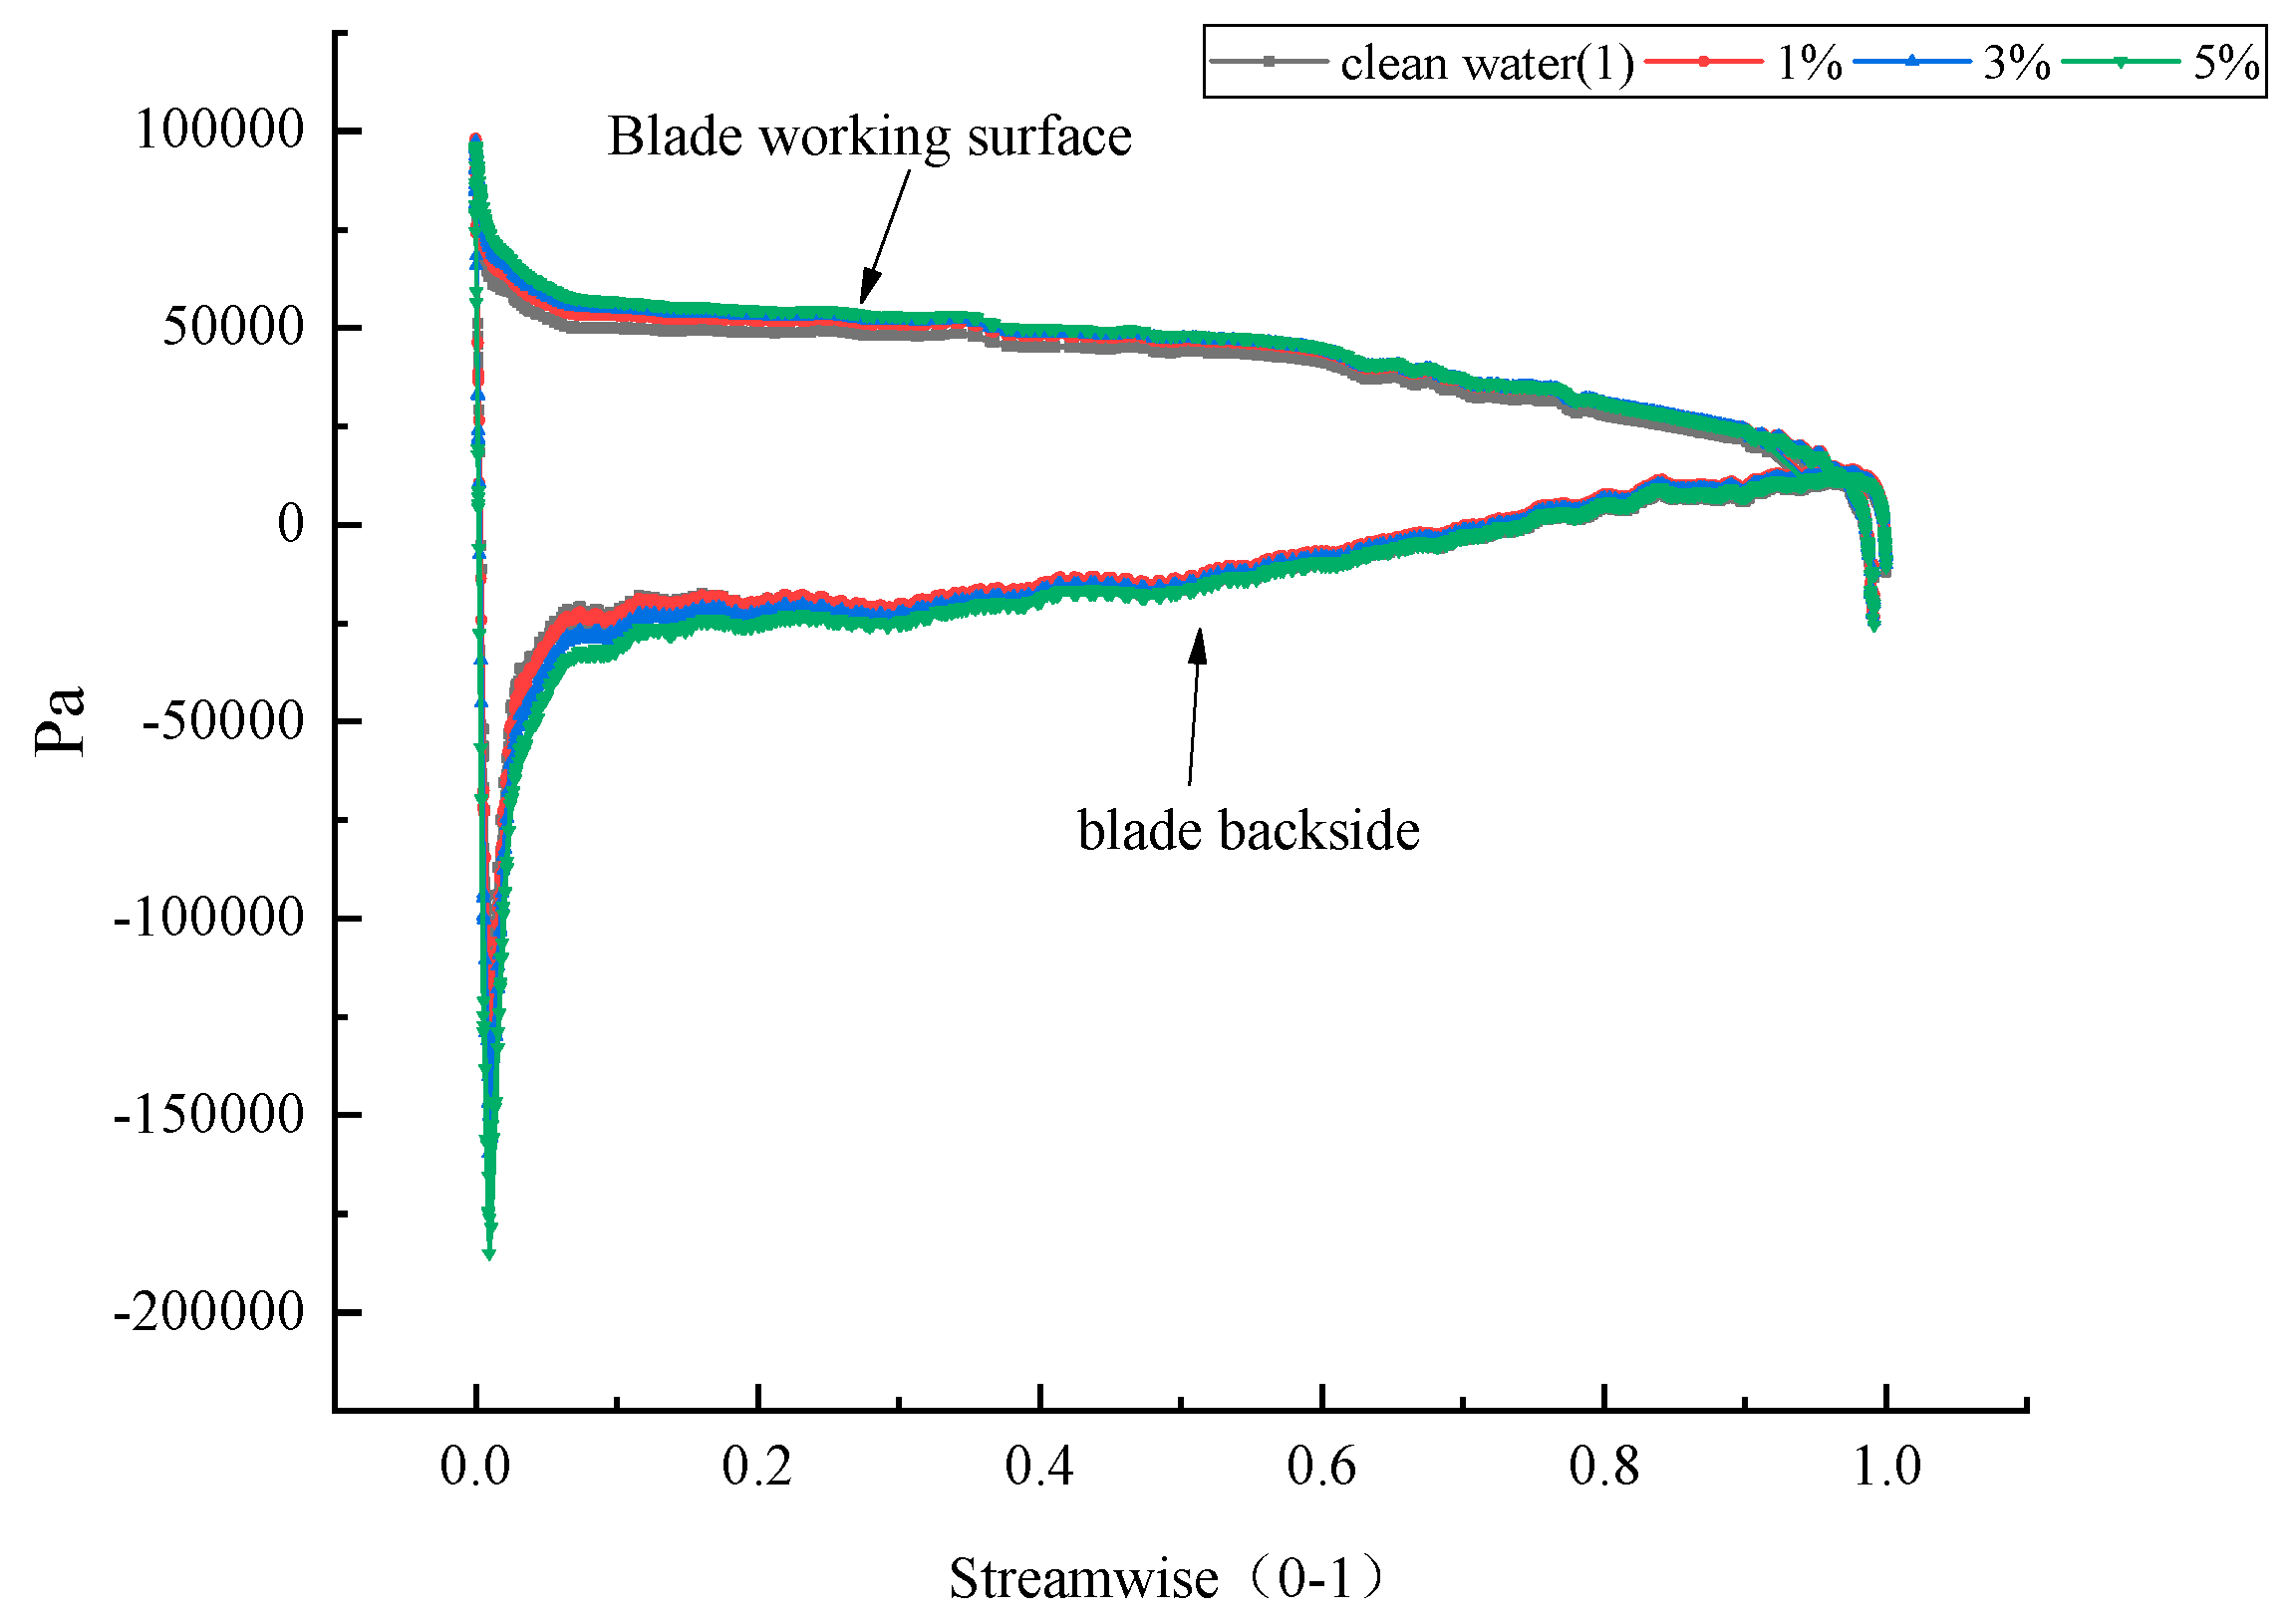
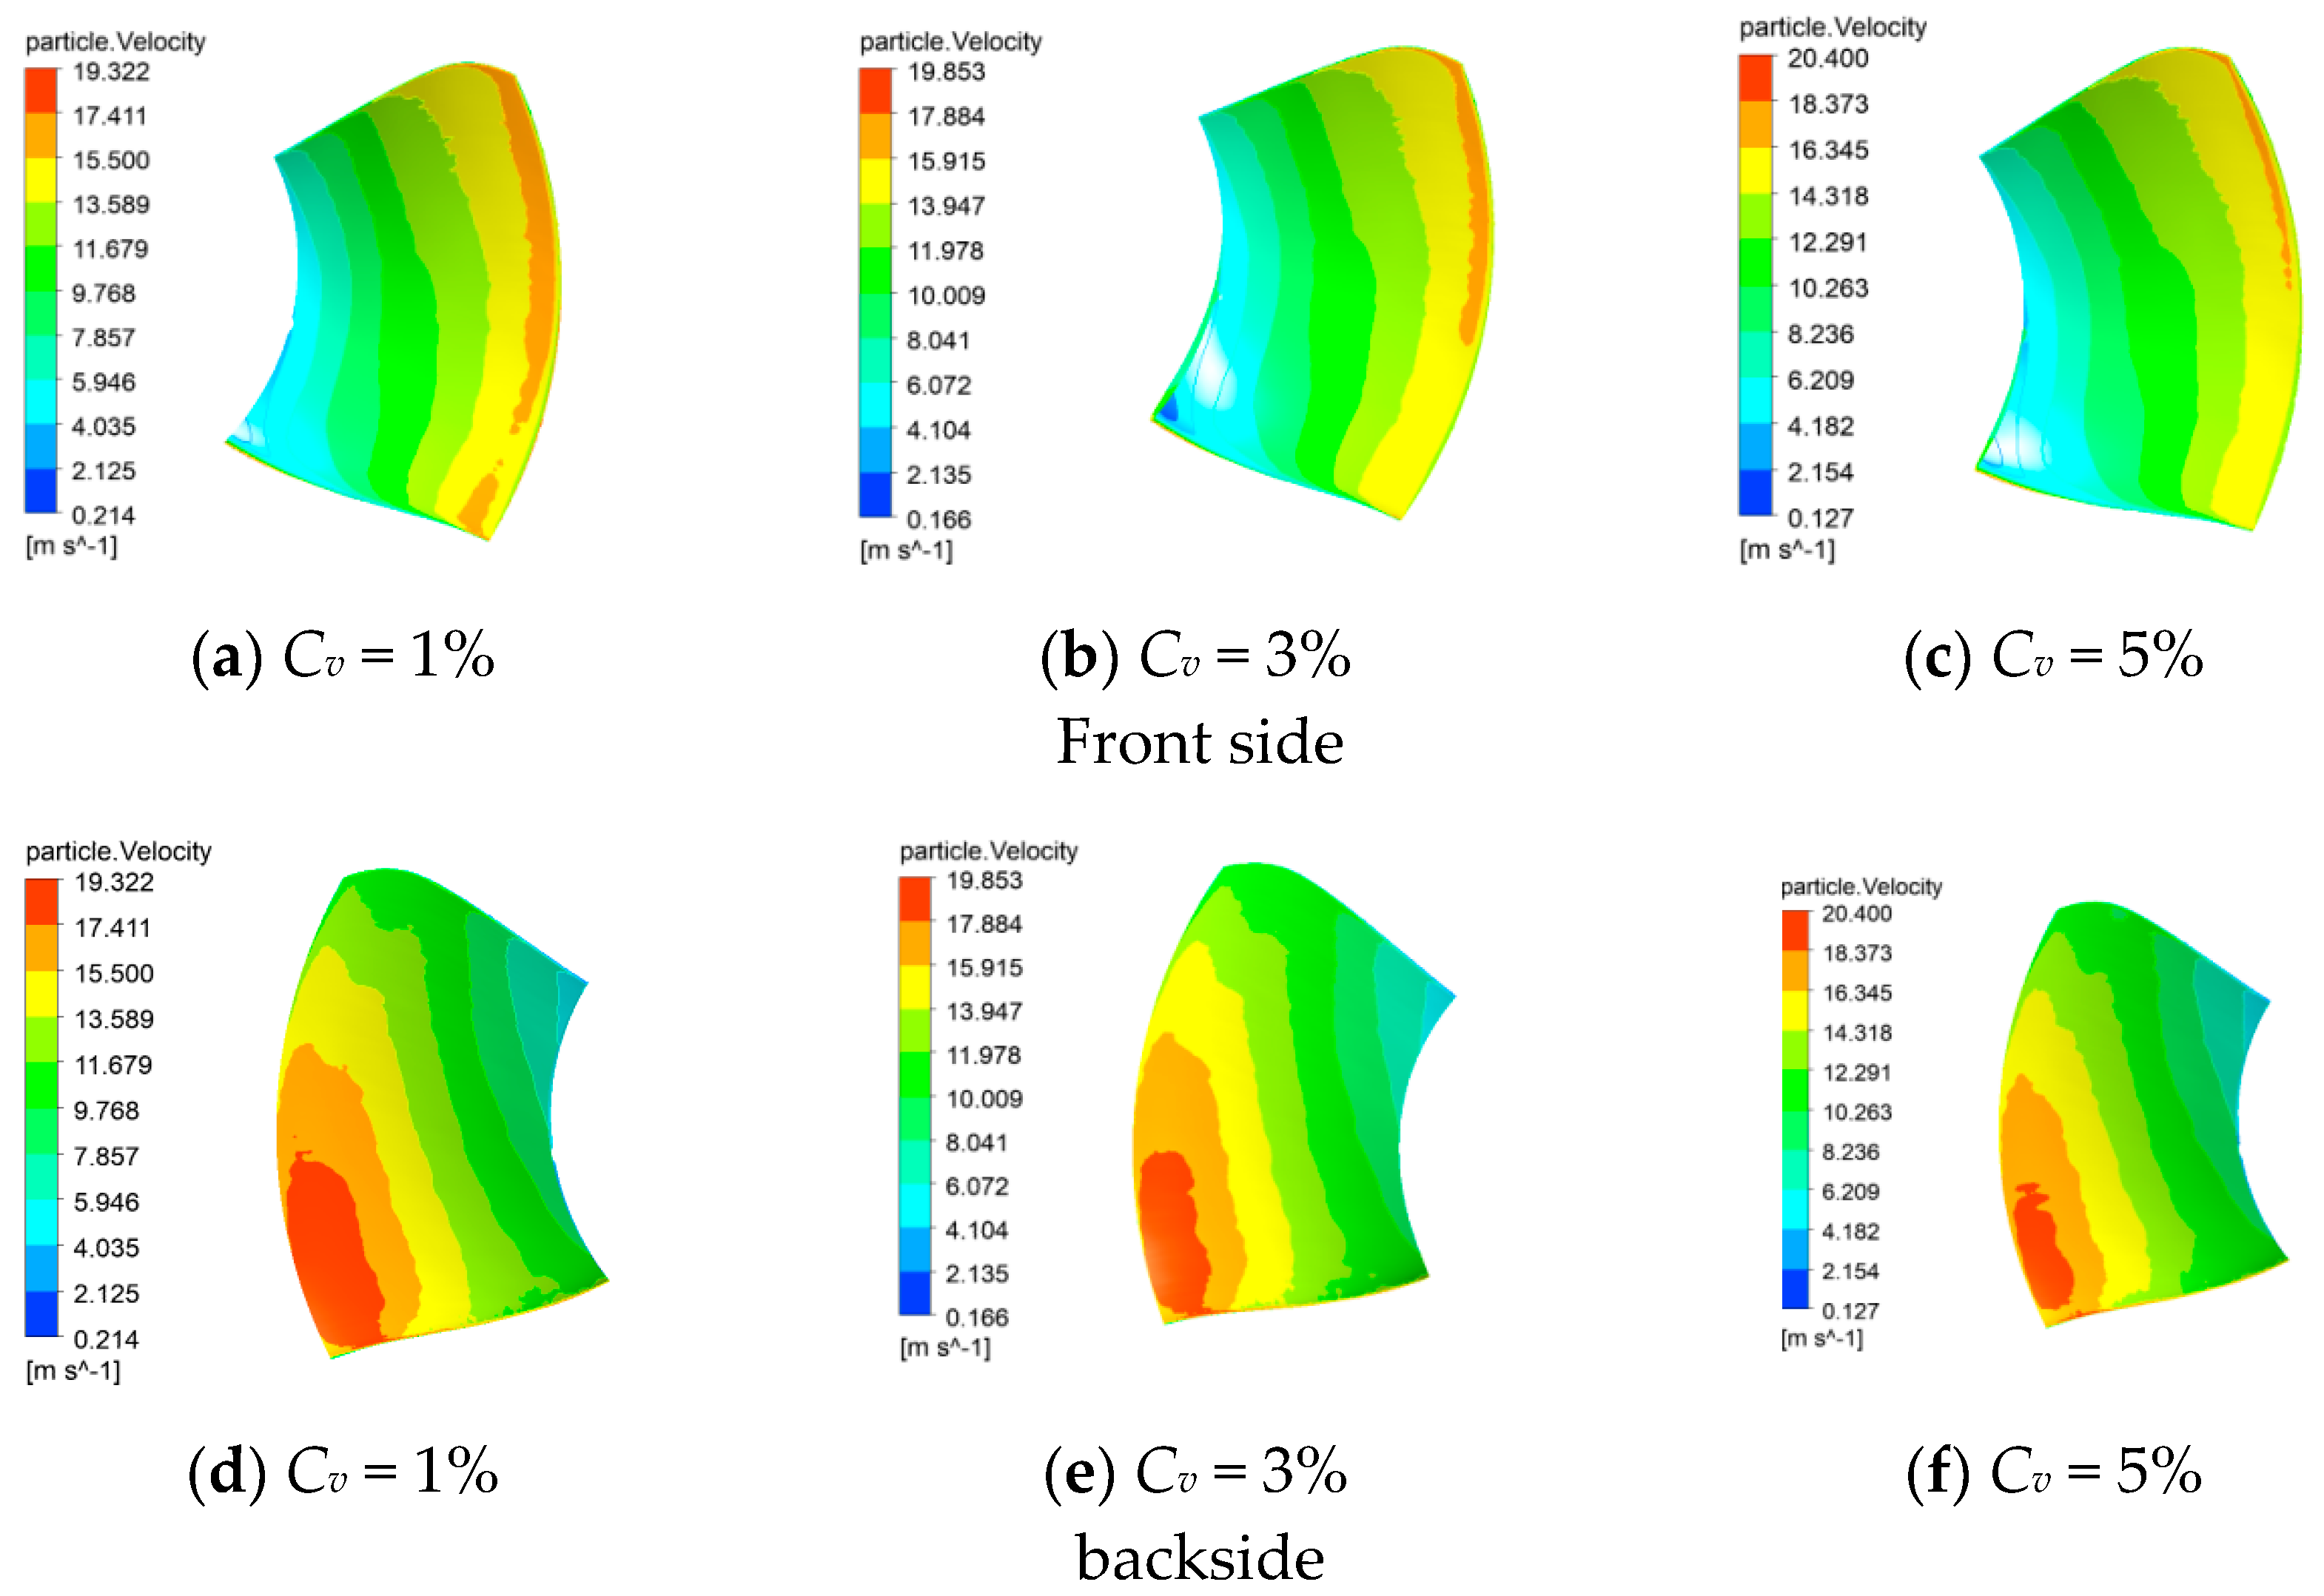
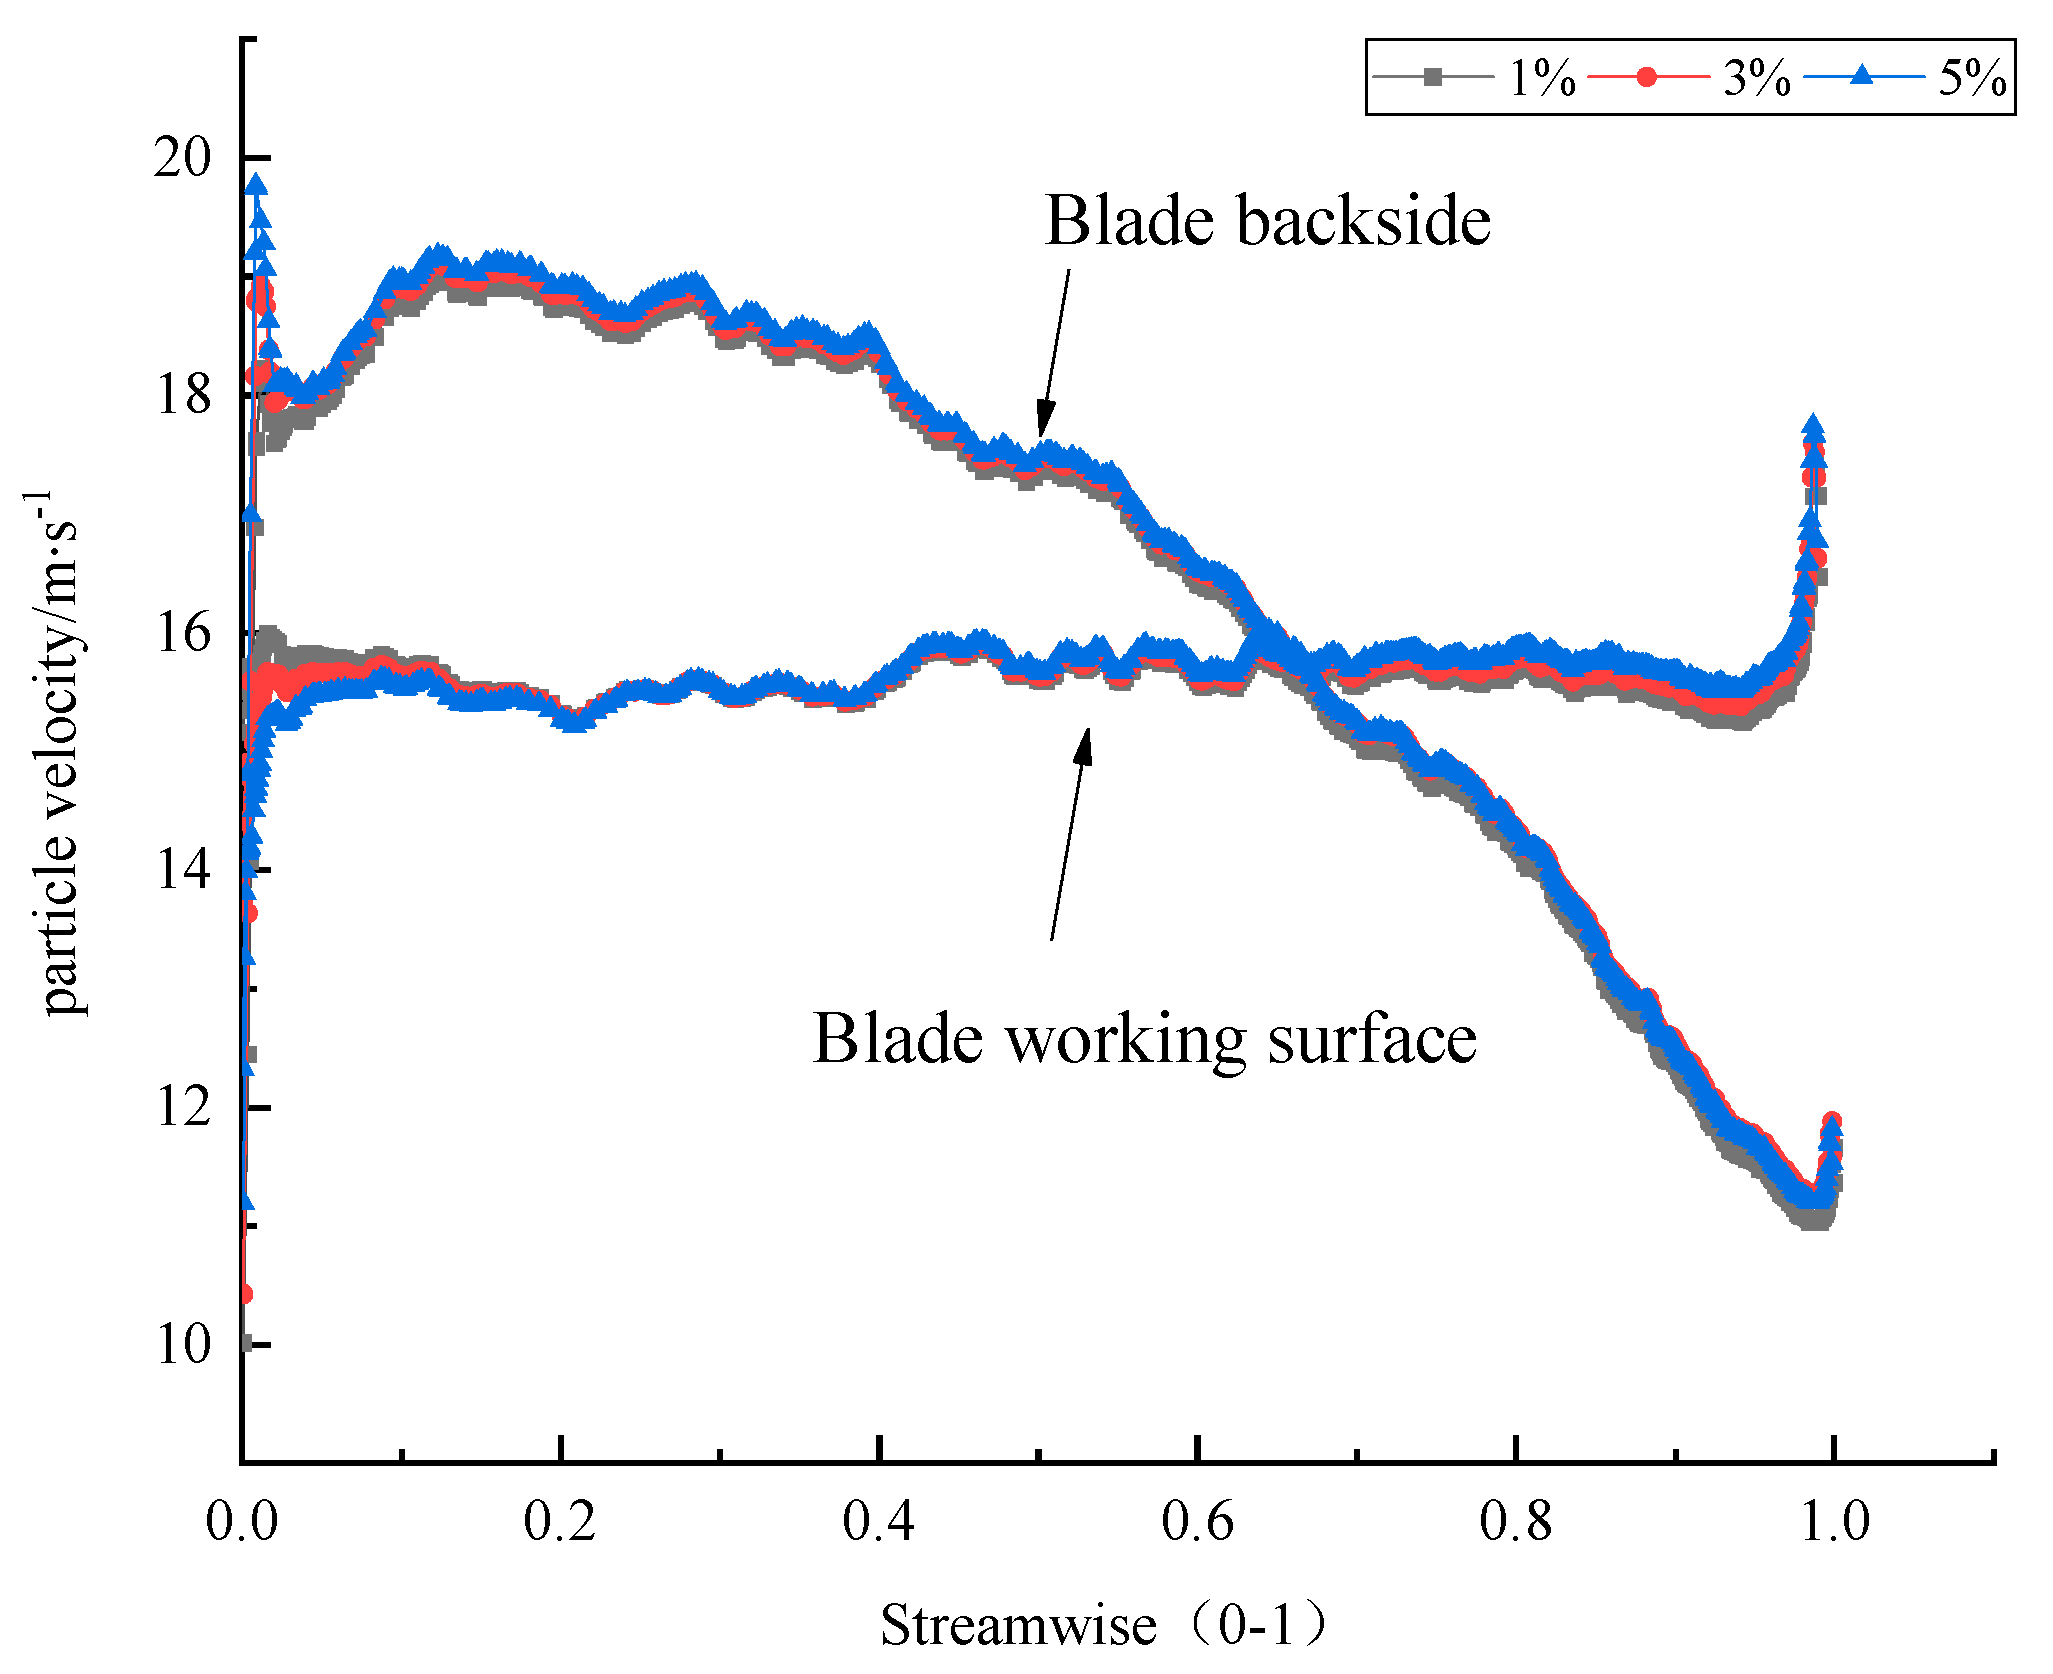
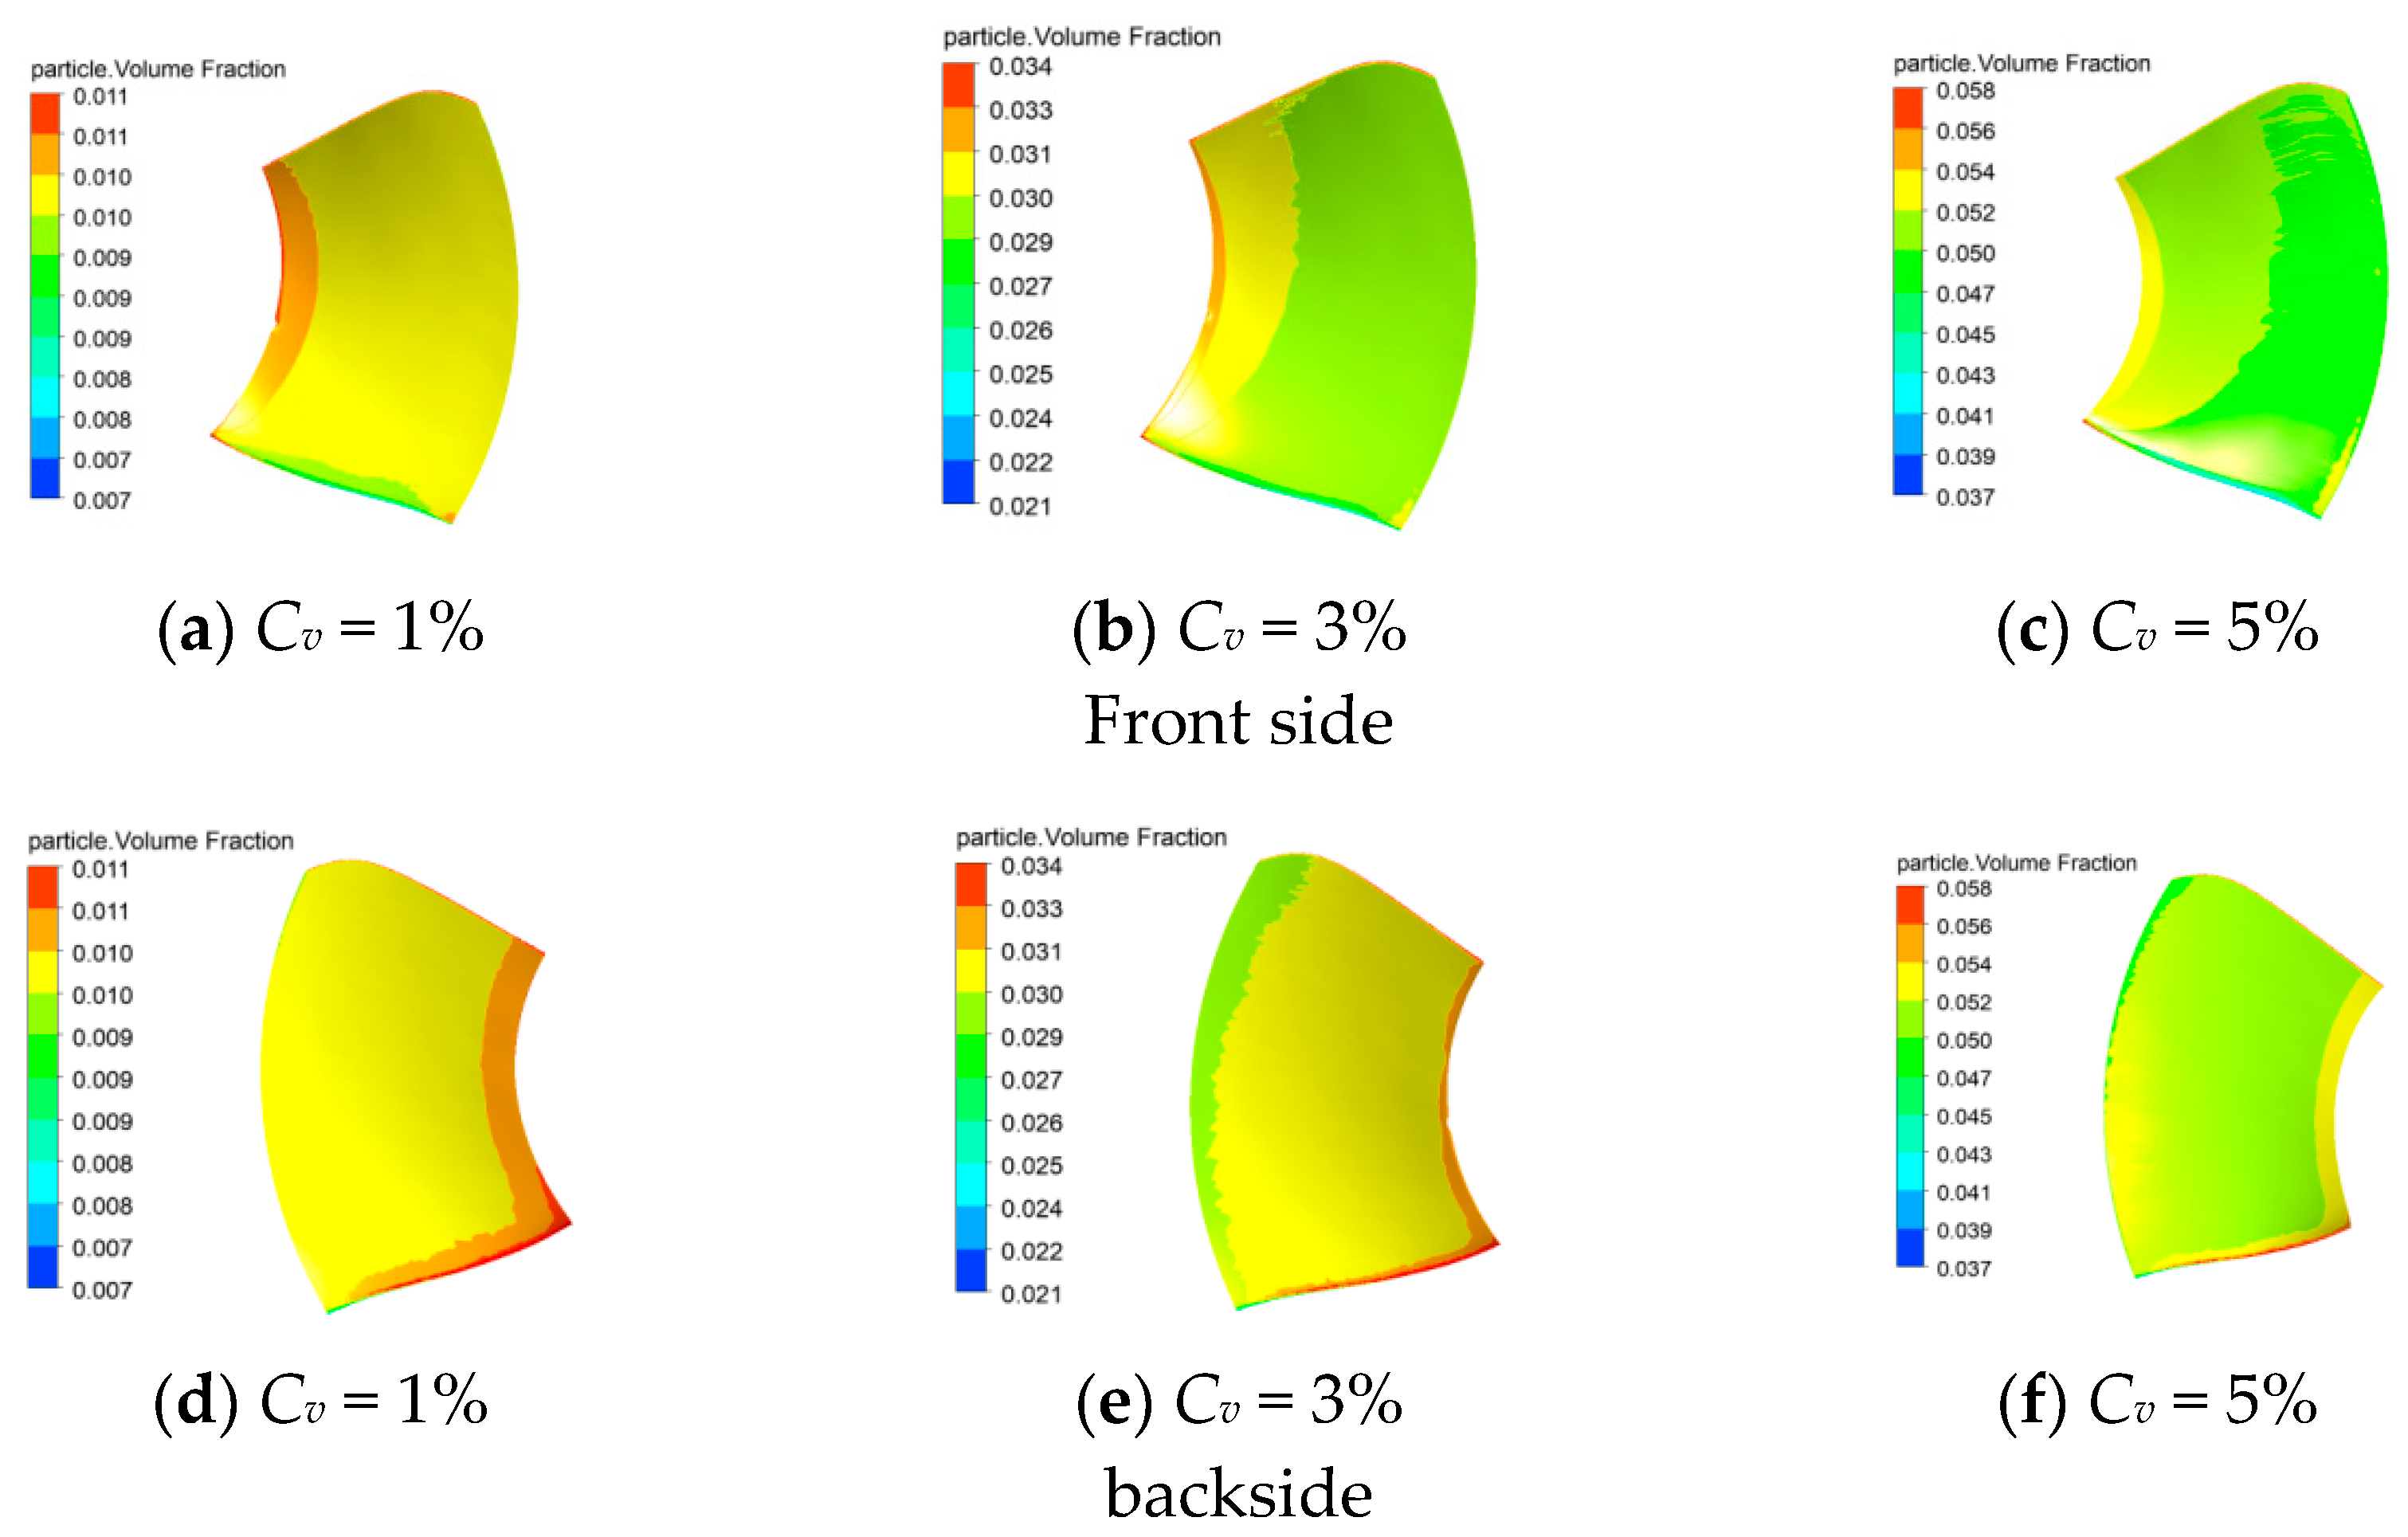
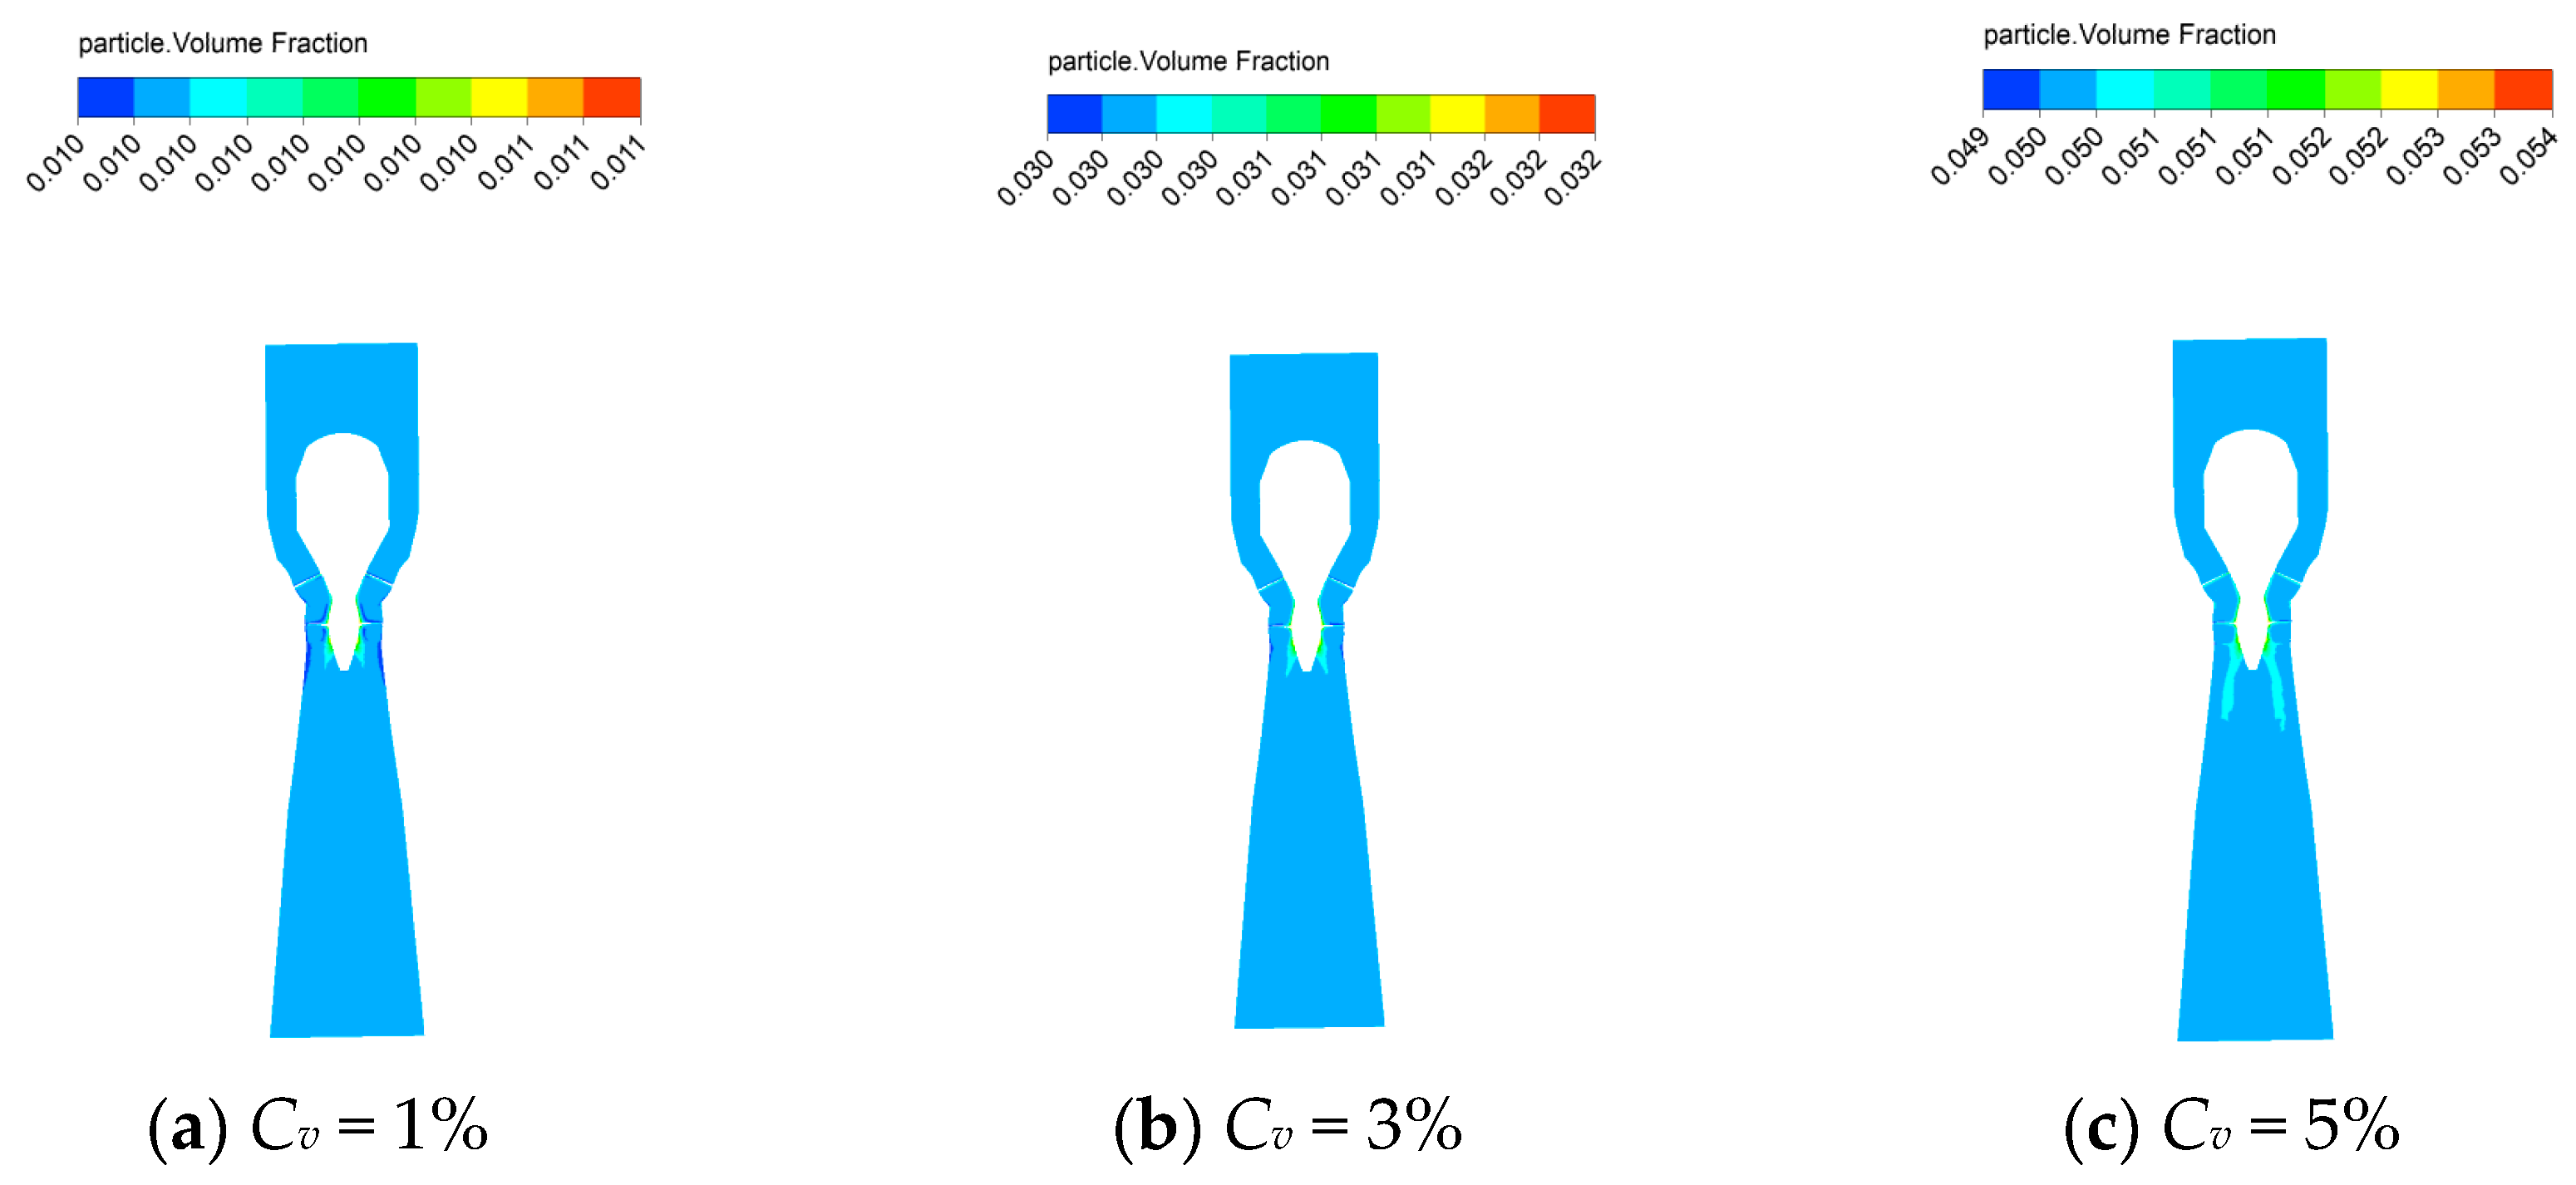
Under the two-phase flow condition, the maximum pressure distribution in the XY plane of the turbine is positively correlated with the solid-phase diameter and concentration, and both are larger than that of the clear water condition. The liquid-phase velocity of the XY cross-section is negatively correlated with the solid-phase diameter, and positively correlated with the solid-phase concentration, and the addition of solid-phase particles makes it easier to produce cavitation and vortex in the area of the tailpipe, and the performance of the tailpipe area in terms of energy recovery deteriorates. The high-concentration zone of the XY plane is mainly located in the runner area and the inlet of the tailpipe. The inlet is positively correlated with the size of solid-phase diameter and concentration. The maximum pressure, solid-phase velocity and solid-phase concentration distribution on the surface of the guide vane are positively correlated with the inlet solid-phase diameter and concentration, and the solid-phase velocity and concentration distribution on the back of the guide vane are larger than those on the front, so it is more likely to produce wear on the back of the guide vane. The addition of solid-phase particles leads to more obvious wear on the inlet side of the back of the blade, which makes its cavitation performance worse, and the pressure difference between the front and back of the blade is greater than that of the clear water condition under two-phase flow condition.
(2)
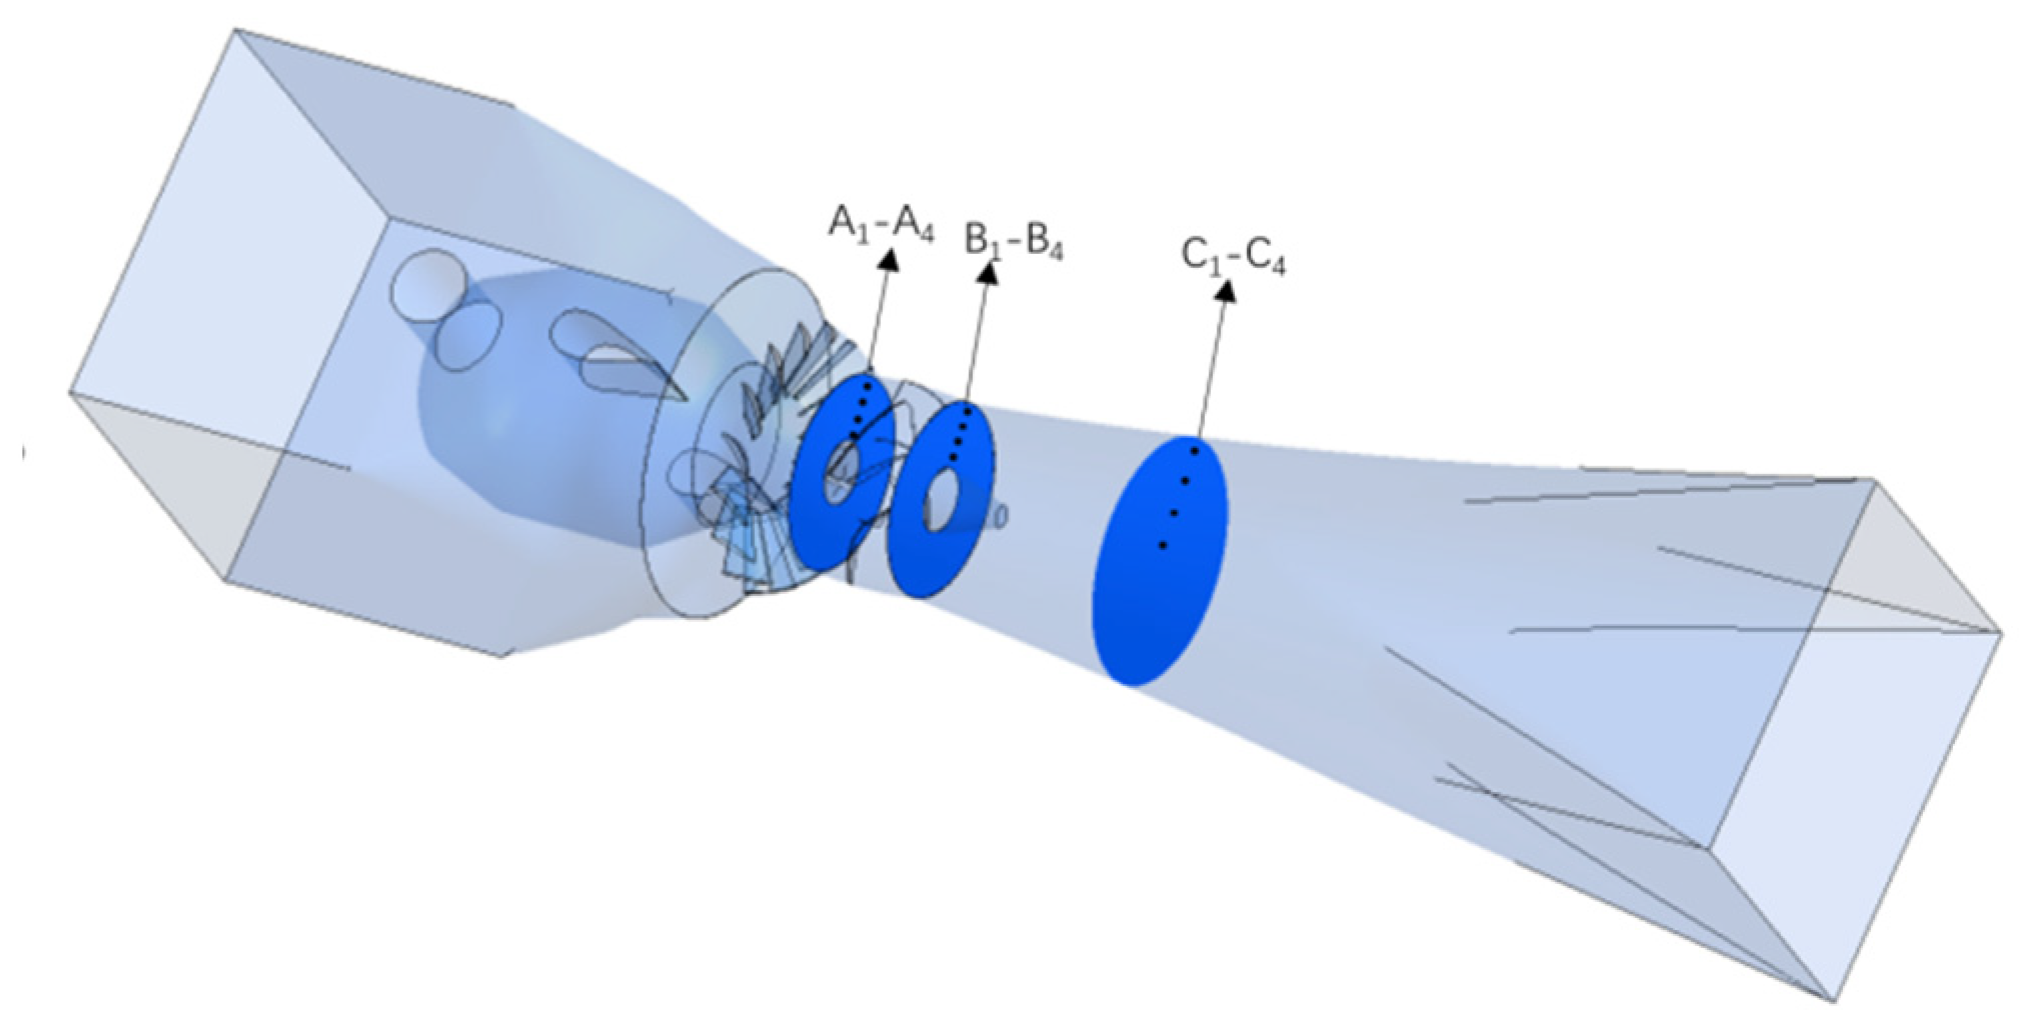
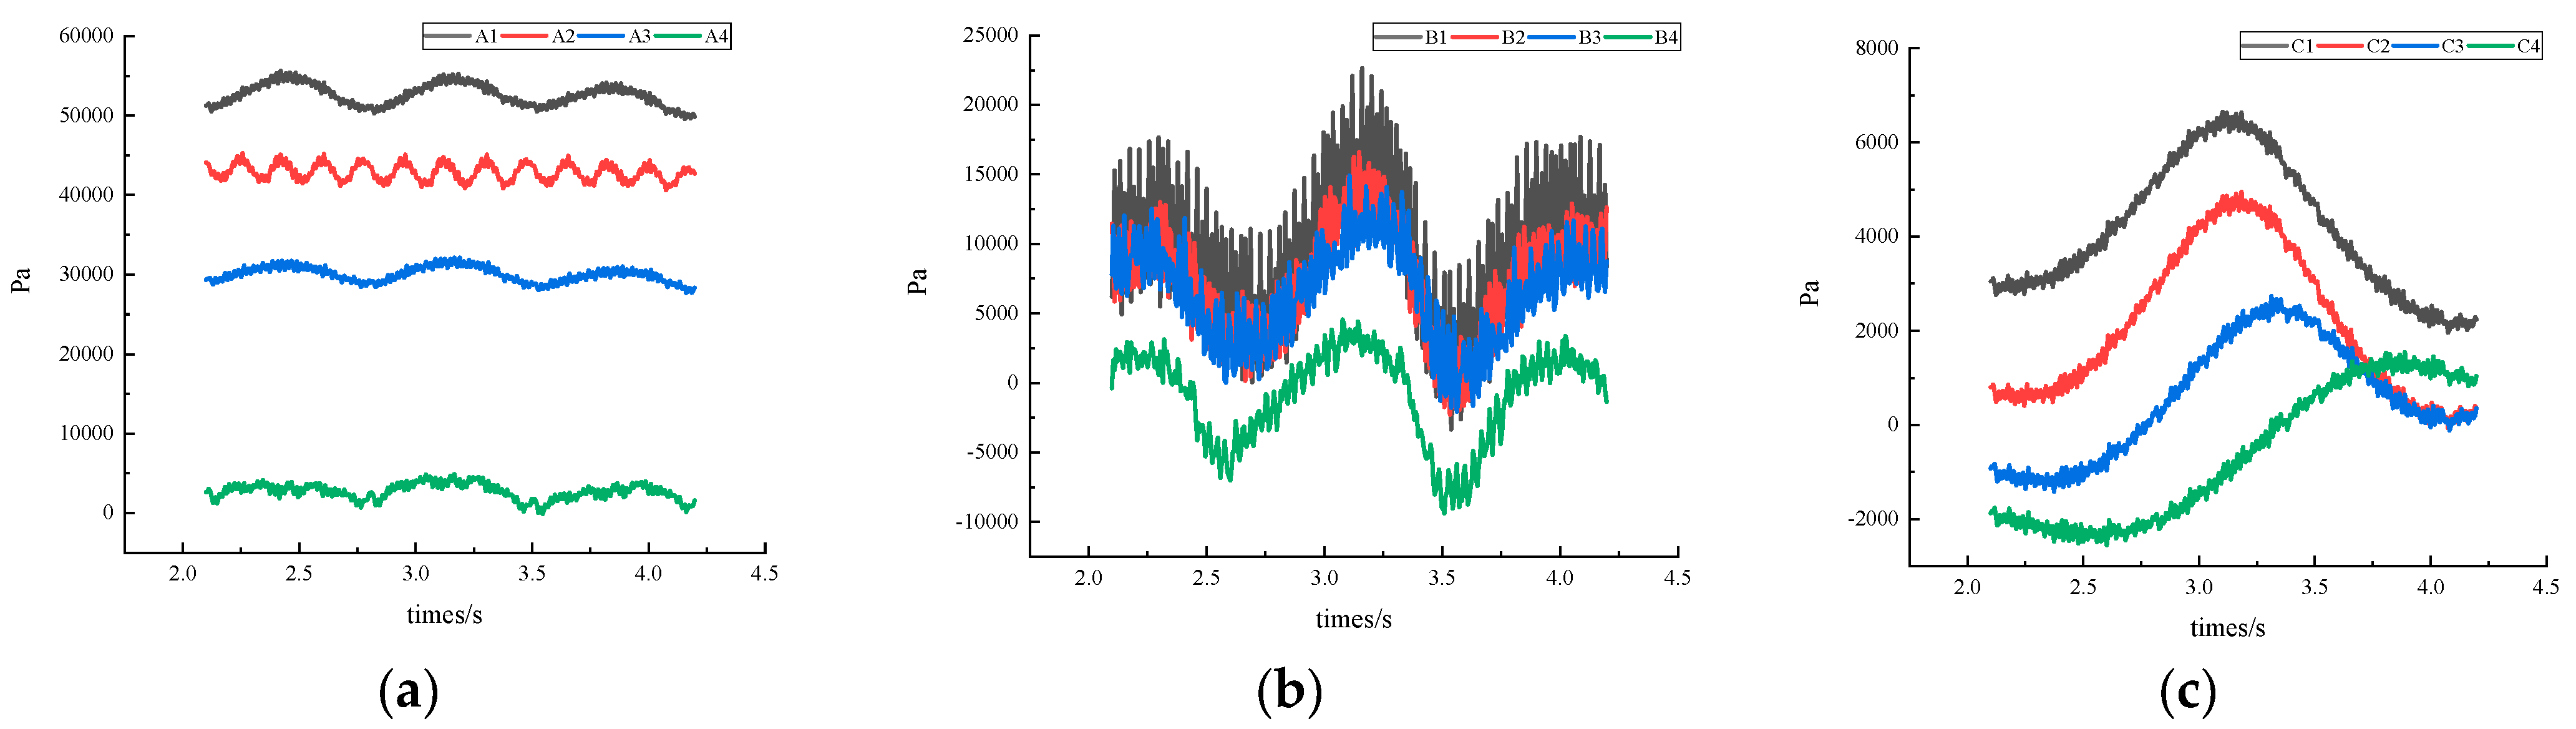
The addition of the solid phase changed the time-domain period of pressure pulsation at the inlet of the runner and the inlet of the tailpipe under the clear water condition. The main frequency at the inlet of the runner and the inlet of the tailpipe is the rotor frequency or the leaf frequency, and the middle section of the tailpipe is the low-frequency pressure pulsation, and the pressure pulsation coefficient decreases with the increase of the concentration of the solid phase in the middle section of the tailpipe. The pressure pulsation coefficients corresponding to the main frequency at each monitoring point of the runner inlet and the tailpipe inlet increase with the increase of the diameter and concentration of the solid phase.

Author Contributions

Conceptualization, G.X. and L.X. methodology, Q.L.; software, G.X.; validation, G.X., L.X. and Z.L.; formal analysis, Z.L.; investigation, G.X.; resources, Q.L.; data curation, G.X.; writing—original draft preparation, G.X.; writing—review and editing, G.X.; visualization, Z.L.; supervision, Q.L.; project administration, Q.L.; funding acquisition, Q.L. All authors have read and agreed to the published version of the manuscript.

Funding

National Natural Science Foundation of China (52066011); Study on the effect of reversible hydraulic turbine movable guide vane wing shape optimization on internal flow characteristics.

Data Availability Statement

The data were obtained by the author Gengda Xie through simulation software.

Conflicts of Interest

The authors declare no conflict of interest.

References

  1. Huang, Y. Research and practice on the effect of river sand on turbine wear in China. Hydropower 2005, 31, 56–58. [Google Scholar]
  2. Xue, W.; Chen, Z. Study on the theory of cavitation and abrasion of hydraulic turbine. Large Electr. Mach. Technol. 1999, 6, 44–48. [Google Scholar]
  3. Lu, L.; Gao, Z.; Pan, L.; Ma, S. Development and review of the field of hydraulic electromechanical research in the past 50 years. J. China Inst. Water Resour. Hydropower Res. 2008, 4, 299–307. [Google Scholar]
  4. Ge, X.; Sun, J.; Cai, J.; Jiang, M.; Han, Y.; Wang, J.; Zhang, L.; Wu, E.; Zheng, Y. Study of solid-liquid two-phase flow in an ultra-low head two-blade bulb cross-flow hydraulic turbine. Chin. J. Electr. Eng. 2022, 42, 1481–1494. [Google Scholar]
  5. Peng, S. Numerical Simulation of Solid-Liquid Two-Phase Flow in Cross-Flow Turbine Based on Vortex Analysis. Master’s Thesis, Xihua University, Chengdu, China, 2020. [Google Scholar]
  6. Han, W.; Chen, Y.; Liu, Y.; Wei, S.; Li, G.; Jin, J. Prediction of abrasion morphology evolution of active guide vane end gap of hydraulic turbine. J. Agric. Eng. 2018, 34, 100–107. [Google Scholar]
  7. Wu, W.; Wu, Y.; Ren, J.; Tang, X. Prediction of internal wear of hydraulic turbine runners. J. Eng. Thermophys. 2000, 21, 709–712. [Google Scholar]
  8. Kang, M.-W.; Park, N.; Suh, S.-H. Numerical study on sediment erosion of Francis turbine with different operating conditions and sediment inflow rates. Procedia Eng. 2016, 157, 457–464. [Google Scholar] [CrossRef]
  9. Neopane, H.P. Sediment Erosion in Hydro Turbines. Ph.D. Thesis, Norwegian University of Science and Technology (NTNU), Trondheim, Norway, 2010. [Google Scholar]
  10. Nishi, Y.; Hatano, K.; Inagaki, T. Study on performance and flow field of an undershot cross-flow water turbine comprising different number of blades. J. Therm. Sci. 2017, 26, 413–420. [Google Scholar] [CrossRef]
  11. Yang, W.; Wu, Y.; Liu, S. A modification method on runner blades in a Bulb turbine. IOP Conf. Ser. Earth Environ. Sci. 2010, 12, 012003. [Google Scholar] [CrossRef]
  12. Ferrer, E.; Willden, R.H.J. Blade–wake interactions in cross-flow turbines. Int. J. Mar. Energy 2015, 11, 71–83. [Google Scholar] [CrossRef]
  13. Lemay, S.; Aeschlimann, V.; Fraser, R.; Ciocan, G.D.; Deschênes, C. Velocity field investigation inside a bulb turbine runner using endoscopic PIV measurements. Exp. Fluids 2015, 56, 120. [Google Scholar] [CrossRef]
  14. Park, J.H.; Lee, N.J.; Wata, J.V.; Hwang, Y.C.; Kim, Y.T.; Lee, Y.H. Analysis of a pico tubular-type hydro turbine performance by runner blade shape using CFD. IOP Conf. Ser. Earth Environ. Sci. 2012, 15, 042031. [Google Scholar] [CrossRef]
  15. Wilhelm, S.; Balarac, G.; Métais, O.; Ségoufin, C. Head losses prediction and analysis in a bulb turbine draft tube under different operating conditions using unsteady simulations. IOP Conf. Ser. Earth Environ. Sci. 2016, 49, 022010. [Google Scholar] [CrossRef]
  16. Sun, L.G.; Guo, P.C.; Zheng, X.B.; Luo, X.Q. Numerical investigation of cavitation performance on bulb tubular turbine. IOP Conf. Ser. Mater. Sci. Eng. 2016, 129, 012039. [Google Scholar] [CrossRef]
  17. Vu, T.C.; Gauthier, M.; Nennemann, B.; Wallimann, H.; Deschênes, C. CFD analysis of a bulb turbine and validation with measurements from the BulbT project. IOP Conf. Ser. Earth Environ. Sci. 2014, 22, 022008. [Google Scholar] [CrossRef]
  18. Choi, Y.-D.; Son, S.-W. CFD Analysis on the Performance and Internal Flow of a Micro Cross-Flow Hydro Turbine in the Range of Very Low Specific Speed. KSFM J. Fluid Mach. 2012, 15, 25–30. [Google Scholar] [CrossRef]
  19. Sha, Y.; Liu, X. Performance test on solid-liquid two-phase flow hydrotransport of vortex pump. Editor. Off. Trans. Chin. Soc. Agric. Eng. 2013, 29, 76–82. [Google Scholar]
  20. Wang, L.; Li, B.; Zhao, W. Dynamics and Wear Analysis of Hydraulic Turbines in Solid-liquid Two-phase Flow. Open Phys. 2019, 17, 790–796. [Google Scholar] [CrossRef]
  21. Chen, L.; Zhao, Z.; Zhang, S.; Sun, Y. Effect of Particle Shape on Pipeline Damage in Liquid-Solid Two-Phase Flow. J. Phys. Conf. Ser. 2019, 130, 012099. [Google Scholar] [CrossRef]
  22. Tao, Y.; Bai, Y.; Wu, Y. Influence of Blade Thickness on Solid–Liquid Two-Phase Flow and Impeller Wear in a Ceramic Centrifugal Slurry Pump. Processes 2021, 9, 1259. [Google Scholar] [CrossRef]
  23. Zhou, W.; Chai, J.; Xu, Z.; Cao, C.; Wu, G.; Yao, X. Numerical Simulation of Solid-Liquid Two-Phase Flow and Wear Prediction of a Hydraulic Turbine High Sediment Content. Exp. Tech. 2022, 47, 281–293. [Google Scholar] [CrossRef]
  24. Zhao, Y.; Liao, W.; Li, Z.; Ruan, H.; Luo, X. Flow field performance of bulb turbine with C-type or S-type blades. Editor. Off. Trans. Chin. Soc. Agric. Eng. 2013, 29, 47–53. [Google Scholar]
Figure 1. Bulb cross-flow turbine model.
Processes 11 03382 g001
Figure 2. Cross-flow hydraulic turbine meshing.
Processes 11 03382 g002
Figure 3. Mesh independence verification.
Processes 11 03382 g003
Figure 4. Efficiency curve.
Processes 11 03382 g004
Figure 5. Experimental characteristic curve of hydraulic turbine.
Processes 11 03382 g005
Figure 6. Blade pressure distribution at different solid-phase concentrations.
Processes 11 03382 g006
Figure 7. Solid-phase velocity distribution on the front and back of the blade.
Processes 11 03382 g007
Figure 8. Solid-phase velocity distribution on blade surface span = 0.9.
Processes 11 03382 g008
Figure 9. Solid-phase concentration distribution on the front and back of the leaf.
Processes 11 03382 g009
Figure 10. Tailpipe XY plane velocity streamline diagram.
Processes 11 03382 g010
Figure 11. Liquid-phase velocity distribution in XY plane.
Processes 11 03382 g011
Figure 12. XY solid-phase concentration distribution.
Processes 11 03382 g012
Figure 13. Curve of external characteristics of the unit.
Processes 11 03382 g013
Figure 14. Schematic diagram of monitoring point setup.
Processes 11 03382 g014
Figure 15. Time-domain plot of pressure pulsation at each monitoring point.
Processes 11 03382 g015
Figure 16. Comparison of pressure pulsation time domain for different solid-phase concentrations at each monitoring point.
Processes 11 03382 g016
Figure 17. Maximum wear rate of each overflow component at different solid-phase concentrations.
Processes 11 03382 g017
Table 1. Parameters of cross-flow turbine.
Number of blades/pc4
Active guide leaf/pc16
Rotor diameter/mm5500
Angle range of paddle7~43°
Angle range of guide vane 14~75°
Diameter of tailpipe inlet/mm5588
Diameter of tailpipe outlet/mm9305
Rated head/m6.85
Rated flow rate/m3/s246.74
Rated speed of real machine/r/min85.71
Disclaimer/Publisher’s Note: The statements, opinions and data contained in all publications are solely those of the individual author(s) and contributor(s) and not of MDPI and/or the editor(s). MDPI and/or the editor(s) disclaim responsibility for any injury to people or property resulting from any ideas, methods, instructions or products referred to in the content.

