Abstract
Pilot diesel ignition is an effective approach for achieving efficient and clean combustion of natural gas. In this study, a rapid compression and expansion machine (RCEM) was constructed for examining diesel-ignited premixed methane combustion. The effects of the methane equivalence ratio and pilot diesel mass on the combustion process of diesel-ignited premixed methane gas were investigated. The results show that the combustion process can be divided into two stages: diesel dominance and premixed methane combustion. An increase in the methane equivalence ratio inhibits diesel combustion, leading to delayed CA10 and OH radical generation. However, it enhances premixed methane flame propagation and improves the heat release rate, resulting in a shorter combustion duration. An increase in the pilot diesel mass contributes to a larger flame area and higher OH generation intensity in the ignition region; however, too large a diesel mass inhibits methane flame propagation towards the diesel nozzle due to an extended injection duration. In conclusion, a larger pilot diesel mass can achieve better overall combustion performance, but excessive amounts may be counterproductive.
1. Introduction
Due to the constraints and impact of energy, the environment, and emission regulations, developing alternative energy sources has become a consensus for countries worldwide to achieve sustainable development [1,2]. As a result, various types of alternative fuels have experienced rapid development and application, with natural gas demonstrating significant advantages in terms of its economic viability and social benefits [3,4]. As a fuel, natural gas (the main component is methane) possesses the following advantages: firstly, it is a low-carbon fuel that can reduce carbon dioxide (CO2) emissions [5]; secondly, it enables clean combustion, effectively reducing pollutant emissions, especially particulate matter emissions [6]; thirdly, natural gas has a high octane rating, exhibiting excellent resistance to knock [7]; fourthly, it mixes well with air, further expanding the operating range; and finally, natural gas reserves have been proven to be relatively abundant [8]. Therefore, natural gas holds vast prospects for application, and the development of natural gas engines represents an effective approach to achieve energy conservation, emissions reduction, and a decrease in CO2 emissions [9,10].
The ignition point of natural gas is higher than that of diesel, and its lower combustion temperature and flame propagation speed under lean conditions can also result in incomplete combustion [11]. Therefore, various combustion modes and techniques for natural gas engines have been explored and developed [12,13]. Natural gas engines can be classified into three categories based on the ignition method: spark-ignition natural gas engines [14], compression-ignition natural gas engines, and diesel-ignited natural gas engines [15]. These natural gas engines also differ in terms of their fuel supply methods, including single-point injection of natural gas into the intake manifold, multi-point injection of natural gas into the intake port, and direct injection of natural gas into the cylinder [4,16]. Currently, the research hotspot is diesel/natural gas dual-fuel engine combustion technology, which is designed based on the working mode of traditional diesel engines [17]. It retains the advantages of having a high compression ratio of the original diesel engine, while benefiting from having the clean combustion characteristics of natural gas [18]. This technology maintains engine power performance while significantly reducing nitrogen oxide (NOx) and soot emissions [19]. Currently for diesel/natural gas dual-fuel engines, the most widely used approach is to employ in-cylinder direct injection for diesel, while natural gas can be injected either into the intake port or directly into the cylinder [12]. In response to the combustion mode of direct injection diesel-ignited intake port injection natural gas, many researchers have explored factors such as the multiple injections of diesel, the injection timing of diesel, and the energy substitution ratio of natural gas [20,21,22,23]. Research results indicate that although multiple injections of diesel for ignition have a relatively small impact on emissions, optimizing the timing and energy ratio of two diesel injections can effectively increase combustion efficiency and reduce engine knock [21,23]. In addition, researchers have also found that the injection timing of diesel and the substitution rate of natural gas have a significant impact on engine combustion efficiency and emissions [23]. By designing appropriate injection timing, it is possible to maintain high thermal efficiency while ensuring a high substitution rate of natural gas [24,25]. Regarding the diesel–natural gas dual direct injection combustion mode, researchers have focused on injection strategies as well as conducted studies on injector structure and combustion chamber shape. Research has found that in this mode, the injection timing of natural gas is one of the key factors affecting combustion and emission performance. As the injection timing of natural gas is delayed, Pmax shows a trend of initially increasing and then decreasing, while CO2 emissions continue to decrease [26]. Due to space limitations, it is challenging to arrange dual injectors for diesel and natural gas on the cylinder head. Therefore, researchers have explored the feasibility of a natural gas/diesel-integrated dual needle valve injector. The results indicate that the performance of the dual needle valve injector can meet the engine requirements and solve the layout difficulties of dual injectors [27]. Researchers also found that the combustion efficiency is higher in engines with a flat-bottom combustion chamber compared to engines with a hemispherical-shaped combustion chamber. The main reason for this is there is increased heat transfer loss in the hemispherical-shaped combustion chamber [28].
Although many researchers have conducted detailed studies on the overall performance of natural gas engines, applying advanced optical diagnostic techniques to measure various parameters during natural gas combustion can deepen the understanding of the combustion and emission processes in natural gas engines. By addressing fundamental issues in the combustion process, it is possible to provide strategies for improving the combustion efficiency, reducing emissions, and optimizing engine design [29,30]. Therefore, some researchers have also explored the combustion and emission characteristics of natural gas–diesel dual-fuel mode in optical engines. Currently, the most commonly used optical diagnostic techniques are the natural luminosity, two-color, and chemiluminescence methods [31]. Wooyeong Kim et al. [32,33] utilized natural luminosity to capture the combustion process of diesel-ignited natural gas under different diesel injection timings and natural gas substitution ratios. They employed color segmentation to analyze and compare the premixed combustion region and the diffusion combustion region. The results showed that natural gas has a greater resistance to autoignition, and as the natural gas substitution ratio increases, the diffusion combustion region decreases. It was also observed that early diesel injection leads to flame kernel displacement towards the piston bowl wall, thereby enhancing the propagation speed of the natural gas flame. Zeeshan Ahmad et al. [34] investigated the impact of the methane equivalence ratio, initial charge temperature, and quantity of pilot diesel on combustion performance using natural luminosity in an optical engine. The study revealed that the ignition delay period is particularly sensitive to the methane equivalence ratio and initial charge temperature, while the quantity of pilot diesel primarily affects the combustion duration. Zhaojun Zhu et al. [35] studied the influence of the natural gas substitution ratio on flame kernel distribution and soot concentration during the combustion process, using natural luminosity and two-color methods. The results indicated that as the natural gas substitution ratio increases, the distribution of ignition points becomes more dispersed, and the concentration of soot formation decreases. Keith R. Dahl et al. [36] investigated the impact of pilot diesel quantity on the combustion process of a natural gas–diesel dual direct injection engine using natural luminosity and OH chemiluminescence methods in an optical engine. The study found that increasing the pilot diesel quantity can enhance the initial heat release, expand the range of initial flame kernel distribution, and improve the combustion speed. In addition to the aforementioned methods, researchers have also employed endoscopic techniques or infrared imaging principles to study flame imaging phenomena during the diesel ignition of natural gas [37,38].
In summary, previous research utilized optical engines to investigate the combustion process of diesel-ignited natural gas or methane. However, these studies used the piston as the visualization component, which significantly reduces the size of the visualization window compared to the actual cylinder diameter, resulting in an inability to fully depict the diesel ignition process. This study introduces an innovative approach by designing the cylinder head of a rapid compression and expansion machine (RCEM) as a visualization window, greatly enhancing the visual range. Additionally, the direction of the diesel spray is parallel to the visualization window, enabling complete visualization of the diesel ignition and combustion processes. The intention is to explore the influence of the methane equivalence ratio and pilot diesel injection mass on flame arrangement, spatiotemporal distribution of OH radicals, and the characteristics of heat release during the combustion process. This research is aimed towards providing a foundational groundwork for the development and design of natural gas engines.
2. Experimental Setup and Methods
2.1. Test Bench
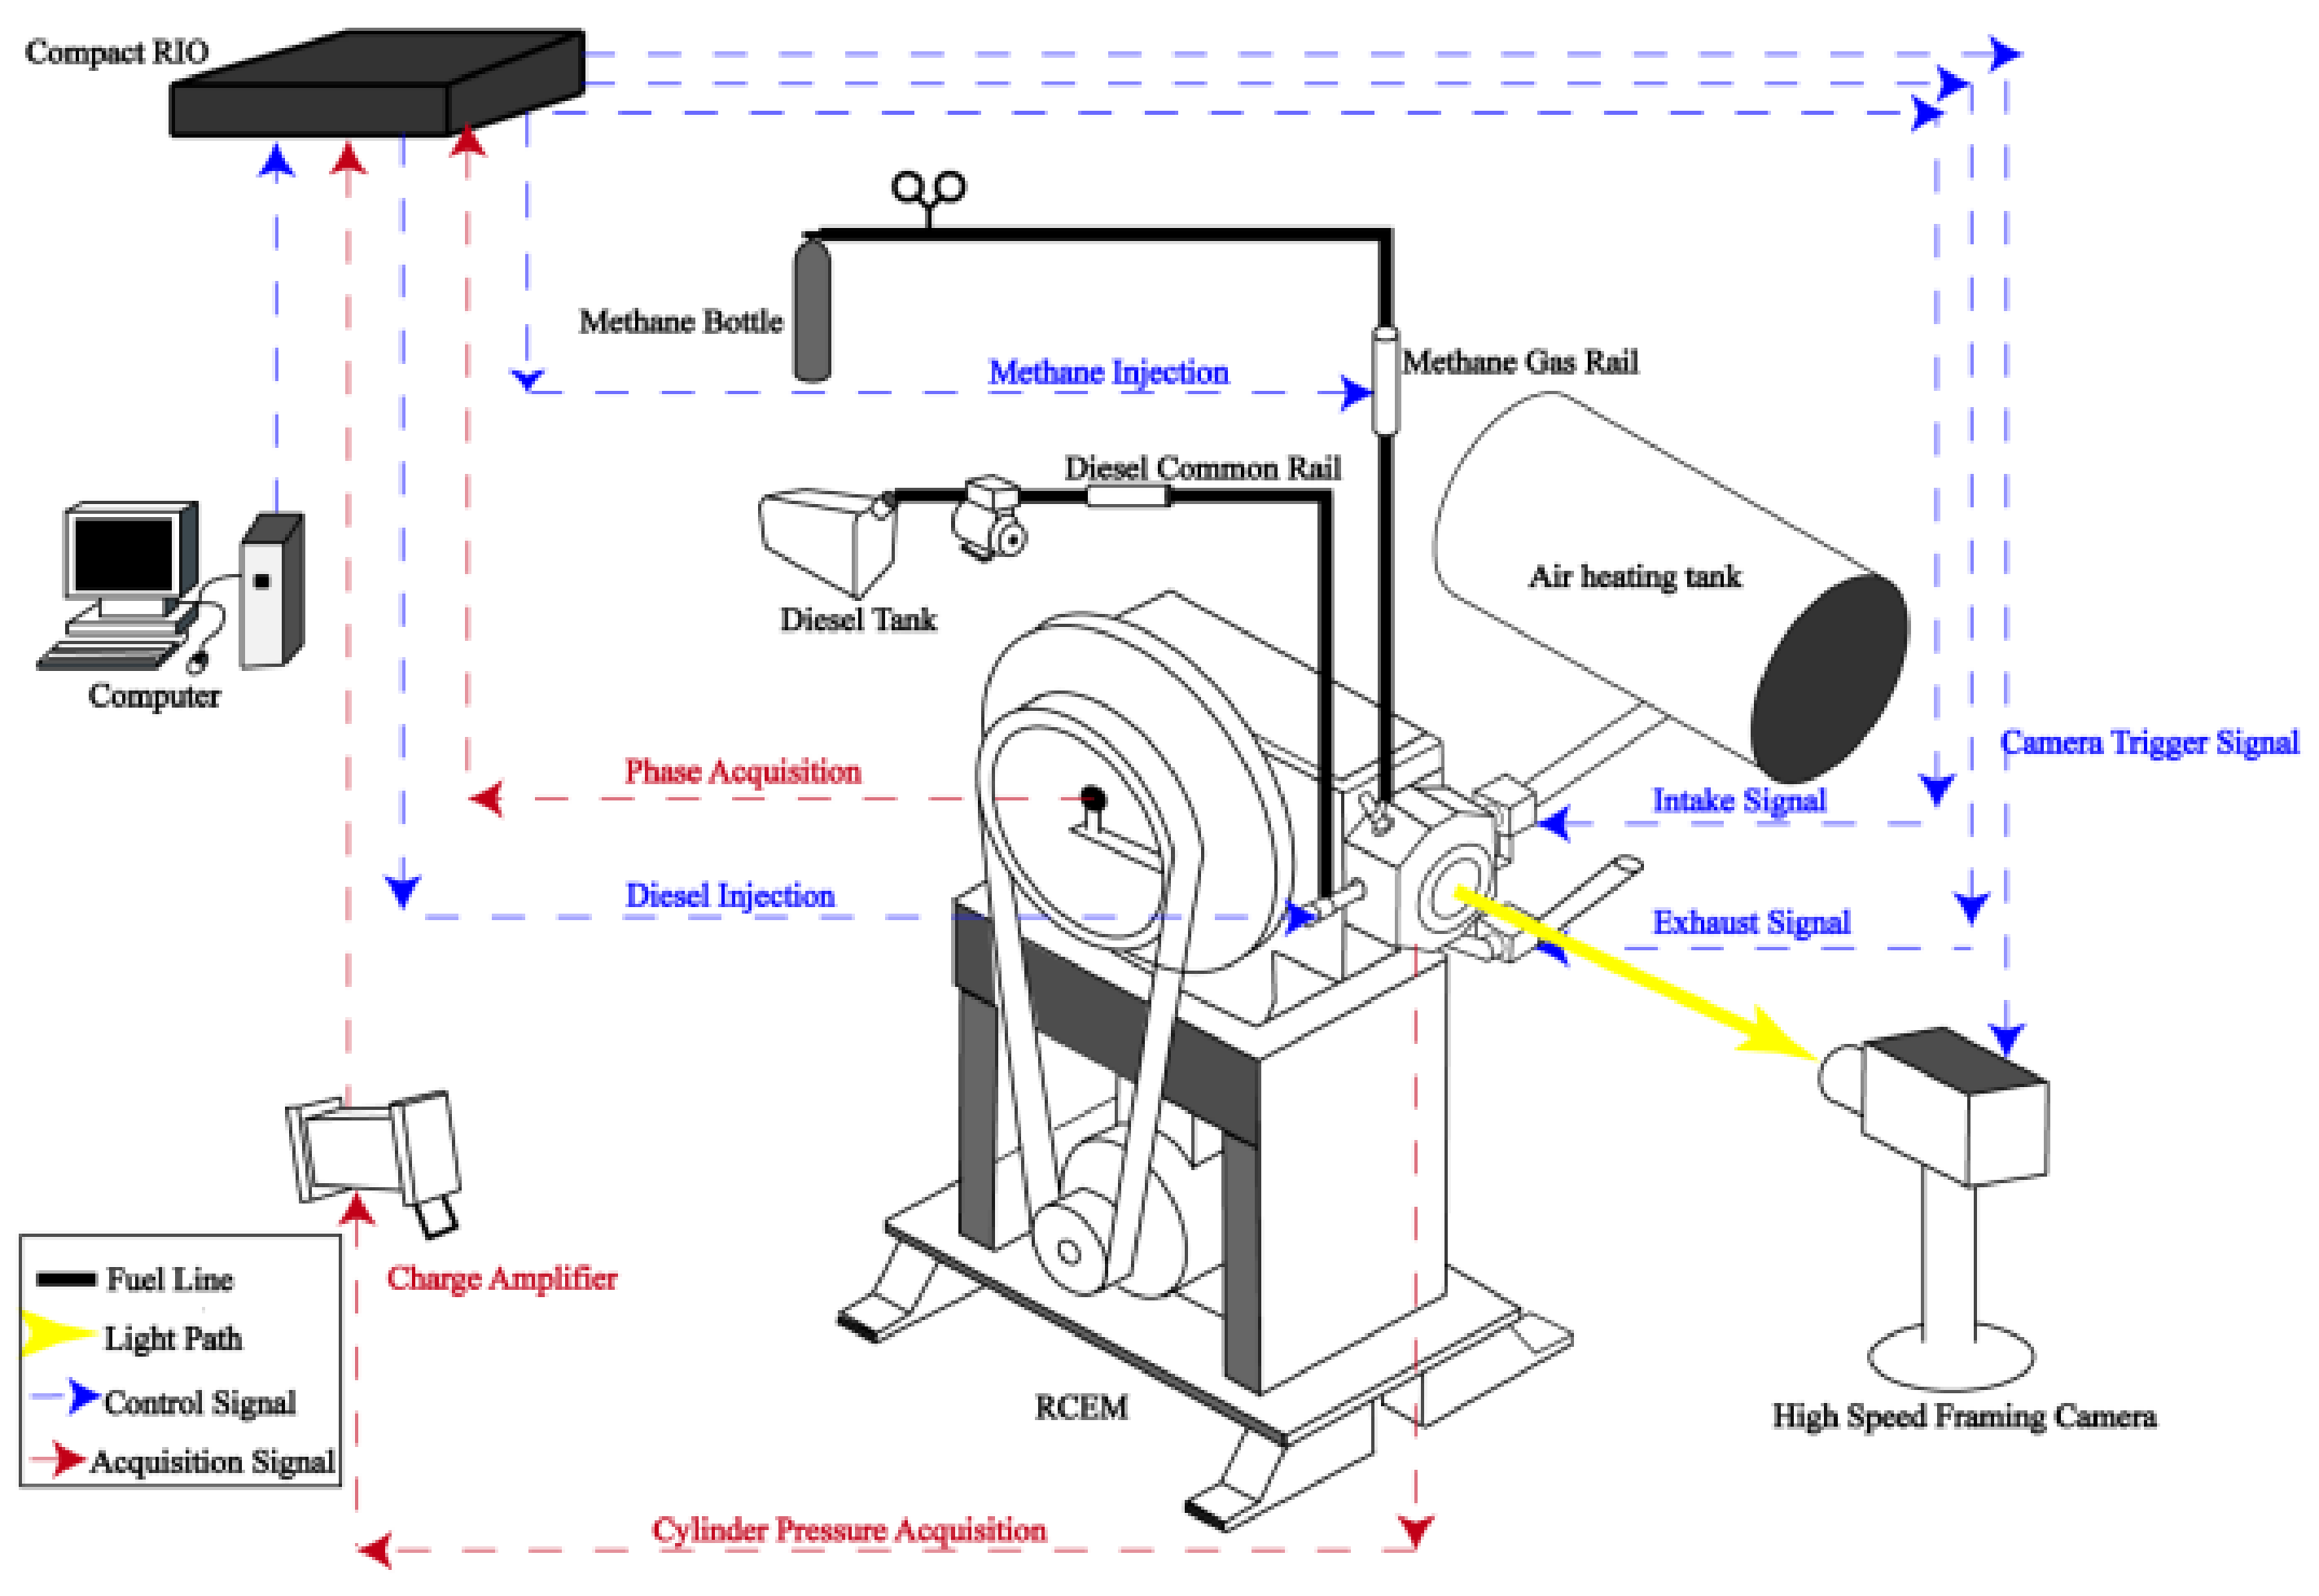
Figure 1 depicts the schematic diagram of the experimental platform for the methane/diesel dual-fuel rapid compression and expansion machine (RCEM). It mainly consists of a single-cylinder engine, an electric motor drive system, an intake pressurization and heating device, an intake and exhaust system, a fuel injection system, a methane supply system, a signal acquisition and synchronous control system, a recording system, and a visual combustion test section. The engine adopts a single-cylinder horizontal engine with a cylinder diameter of 135 mm, a stroke of 145 mm, a displacement of 2.076 L, and a compression ratio of 16.5. After design modification, a visual combustion test section was used to replace the original engine cylinder head. The top dead center volume of the RCEM is approximately 311 mL, with a geometric compression ratio of 7.66, which is significantly lower than the original engine’s geometric compression ratio. Therefore, the RCEM adopts the strategy of intake heating and pressurization to ensure sufficient compression pressure and temperature, meeting the requirements for diesel compression ignition.

Figure 1.
Schematic diagram of test bench for diesel–methane dual-fuel RCEM.
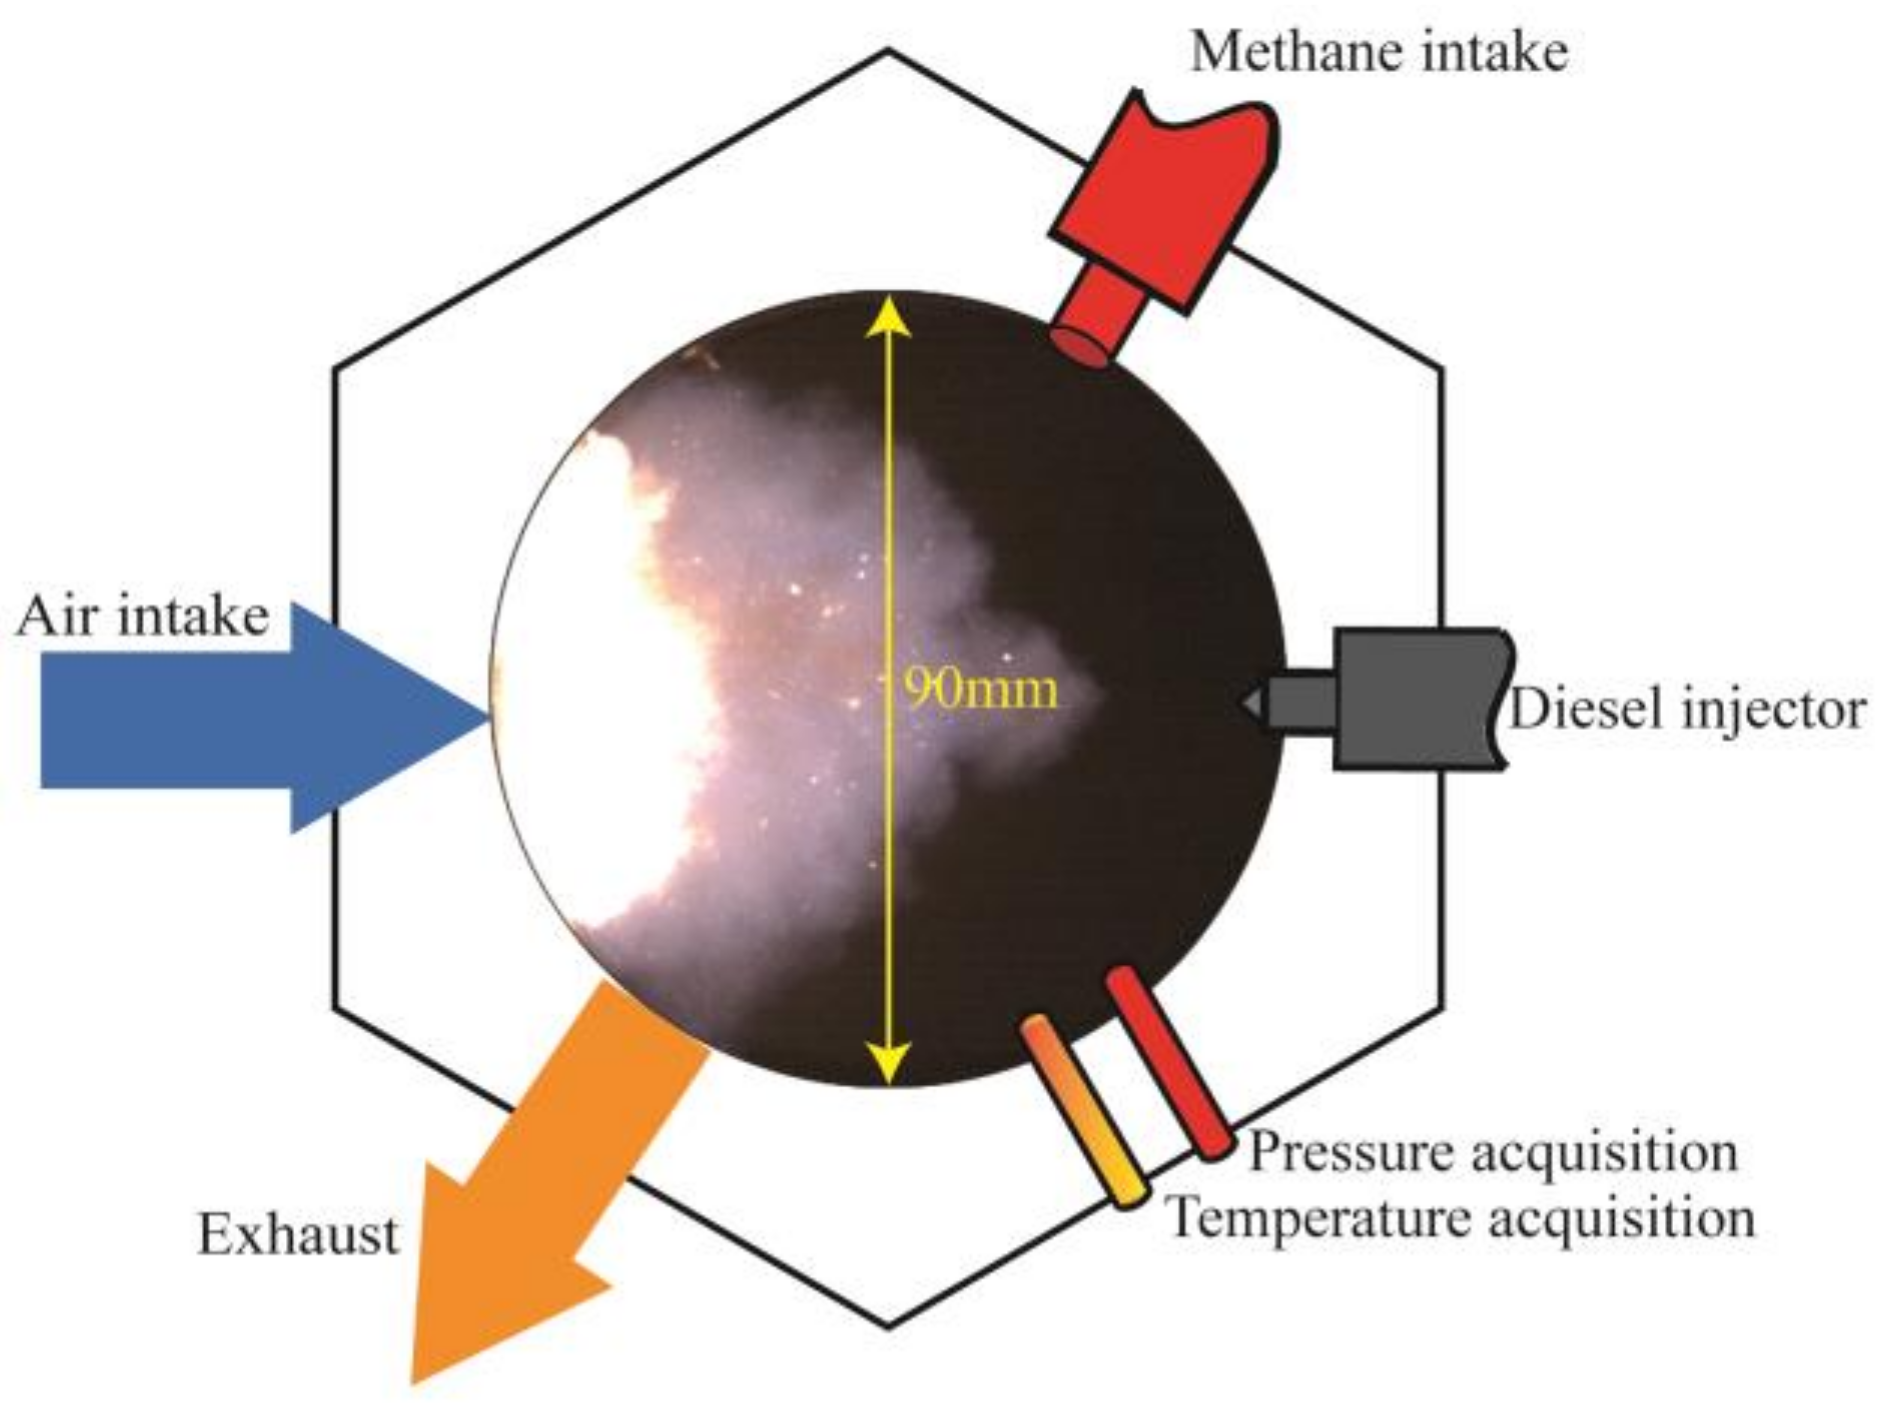
The structure of the combustion visual test section is shown in Figure 2. The valve structure was eliminated in the test section, and electronic control valves were used for programpressure fuel injectors and a set of gas fuel intake components arranged circumferentially. It also has the capability to simultaneously monitor and collect temperature and pressure data. The visible diameter of the test section cylinder head is 90 mm, and the window is made of sapphire glass, capable of withstanding a maximum combustion pressure of 20 MPa.

Figure 2.
Structure of the combustion visual test section.
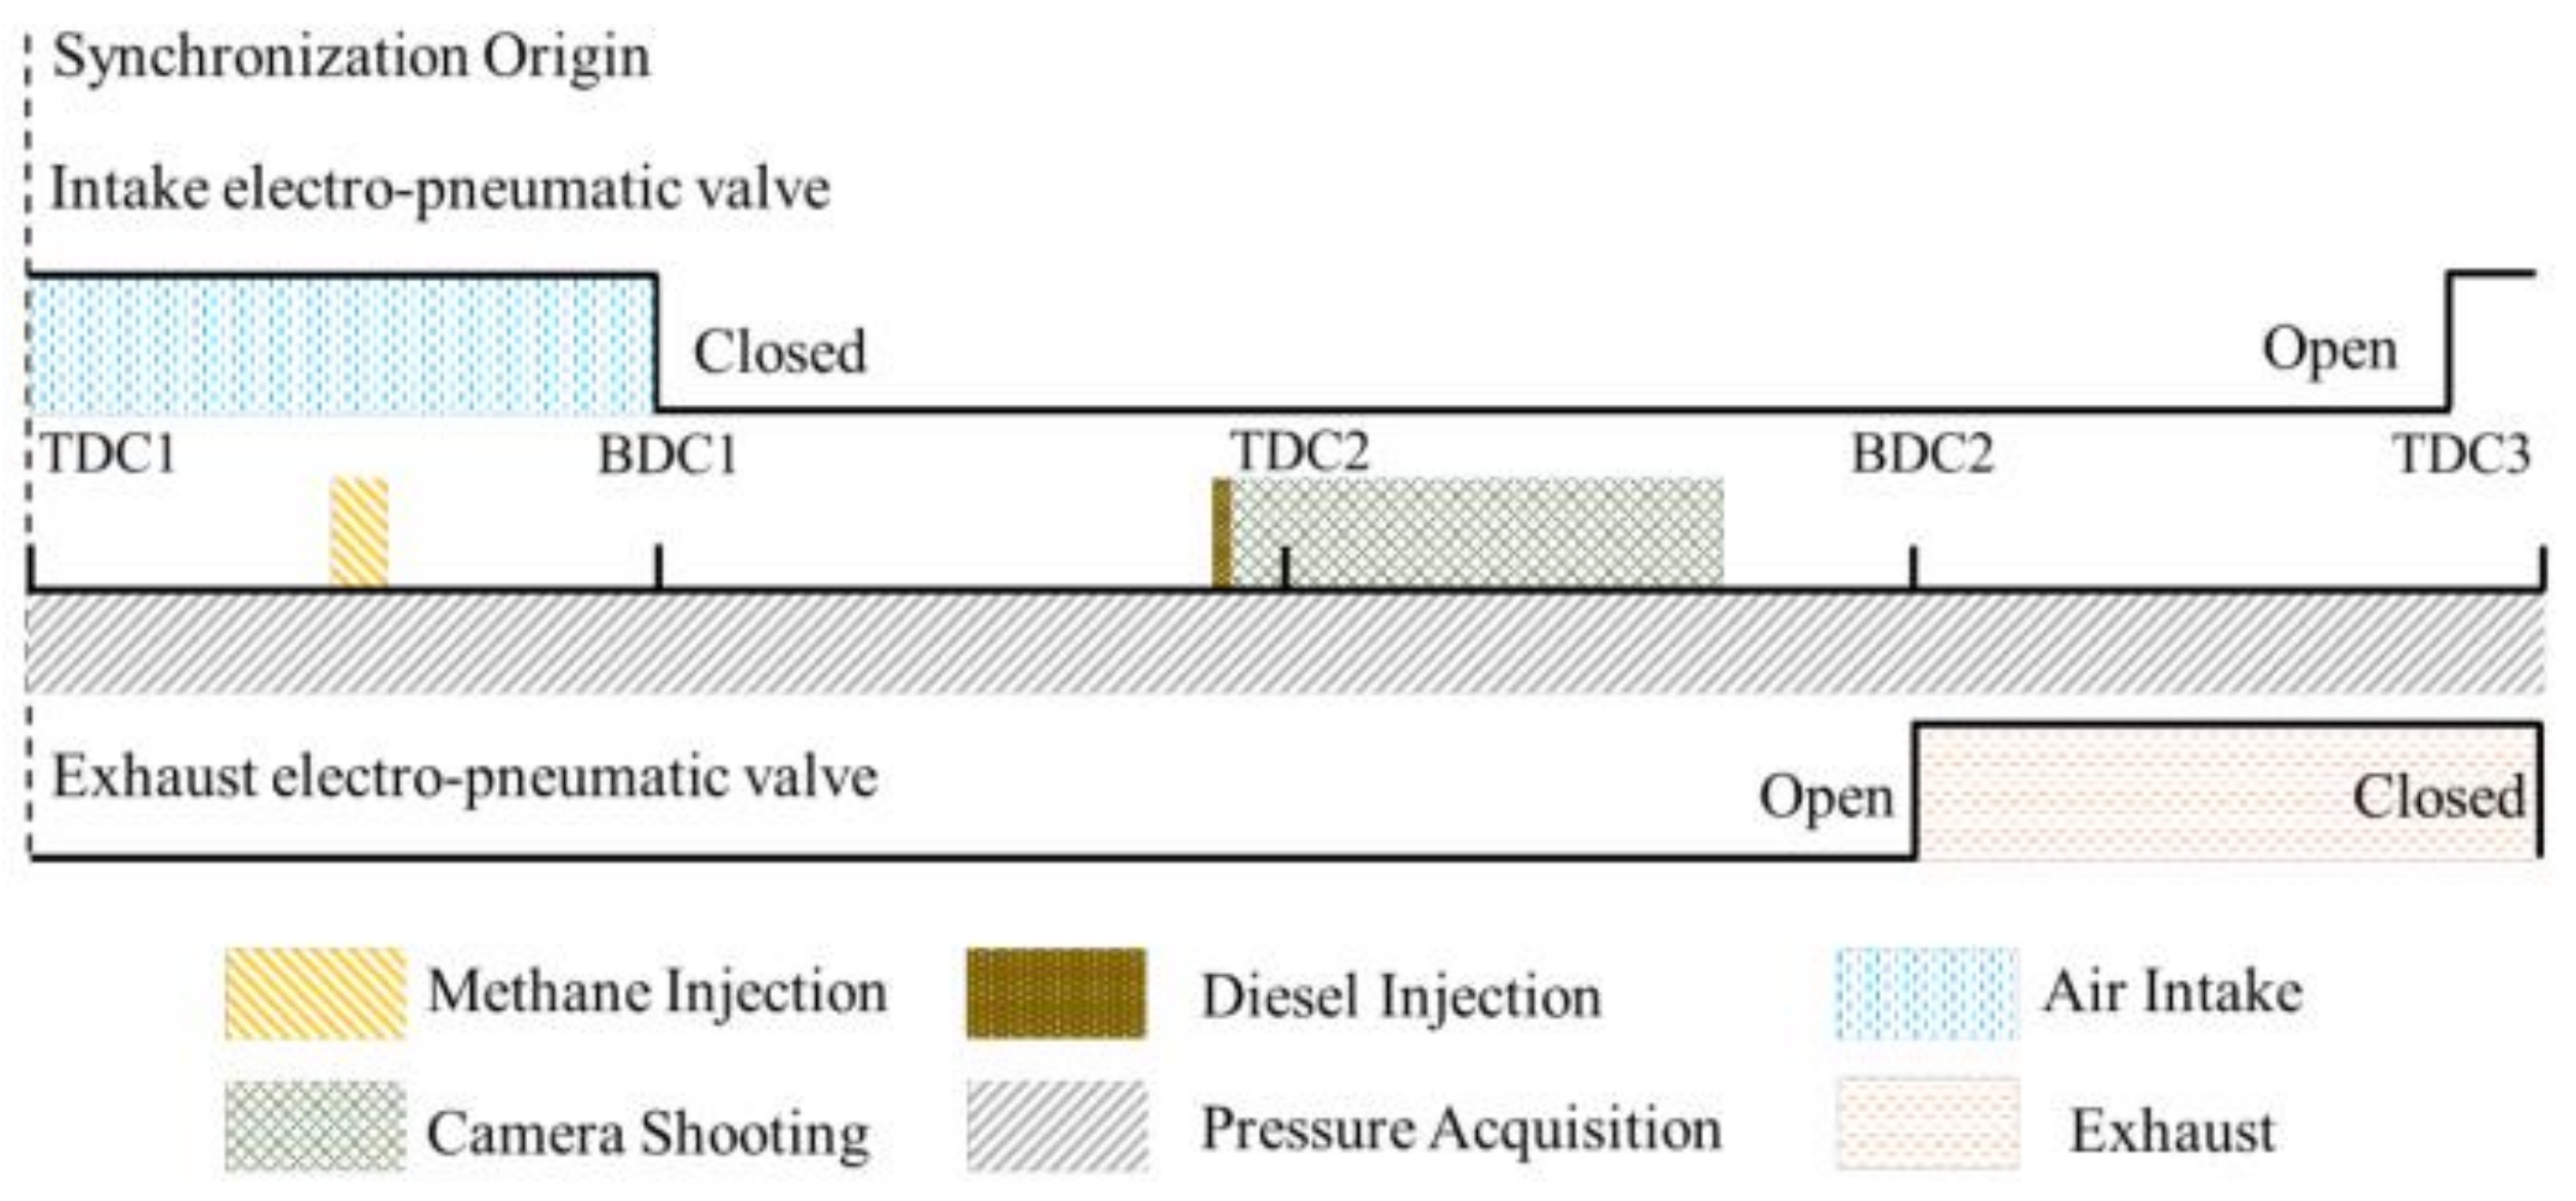
The RCEM operates with a strategy of continuous reciprocation and single-cycle combustion, as shown in Figure 3, driven by an electric motor at a speed of 270 r/min. The pressure of the intake heating tank was controlled by a pressure regulating valve. The temperature inside the test section was monitored and adjusted using temperature-controlled equipment. In the experiments, the intake electro-pneumatic valve remained open by default, establishing a connection between the cylinder and the intake heating tank. A continuous exchange of gas and heat between the cylinder and the intake tank resulted due to the piston’s reciprocating motion, which guaranteed uniformity of the initial temperature and pressure before compression. When the trigger signal is sent by the computer, the intake electro-pneumatic valve is closed at BDC (Bottom Dead Center)1. The exhaust electro-pneumatic valve is normally closed when the intake electro-pneumatic valve is closed, and the cylinder becomes a sealed system. Driven by the electric motor and flywheel inertia, the piston moves towards TDC 2, compressing the gas within the cylinder. The temperature and pressure of ambient gas is increased through compression. Although there is heat exchange between ambient gas and the RCEM’s wall, the temperature and pressure of ambient gas can be considered uniform due to the short compression period. Methane is injected into the cylinder during the intake stroke through a natural gas injection valve, while diesel is injected near the TDC (top dead center) of the compression stroke to ignite the methane–air mixture. The exhaust valve is normally closed, and opens at the BDC of the expansion stroke during the combustion cycle to discharge the combusted exhaust gases.

Figure 3.
Operation strategy of the RCEM in the combustion cycle.
The main shooting and measuring devices are shown in Table 1. A Photron mini UX100 color camera was used for natural luminescence (NL) photography. The frame rate was 10,000 fps and the shutter speed was 1/40,000 s. For chemiluminescence (CL) photography, a shooting system mainly consisting of a Photron SA-Z and a UVI2550 series image intensifier was adopted [39,40]. A filter with a central wavelength of 313 nm was used to capture the OH chemiluminescence. The measuring devices mainly included a pressure sensor, a charge amplifier, and a K-type thermocouple. Their uncertainties were acquired from the technological manuals, and are listed in Table 1.

Table 1.
Main devices.
2.2. Experimental Conditions
This study conducted a visualization experiment on the combustion characteristics of diesel-ignited methane premixed mixture on a rapid compression and expansion machine. The diesel fuel used for ignition was No.0 diesel, and a single straight-hole injector was employed. The axis of the orifice coincided with the axis of the injector body, with orifice diameters of 0.15 mm. The combustion process was captured using a natural luminescence method, while the generation characteristics of OH radicals were obtained using a chemical luminescence method. Combined with cylinder pressure measurement and heat release analysis, the influence of the methane equivalence ratio and the pilot diesel mass on the ignition and combustion process of diesel-ignited methane premixed mixture was investigated. The test parameters are shown in Table 2.
Table 2.
Test parameters.
Compared to traditional gasoline and diesel fossil fuels, methane exhibits distinct physicochemical properties, as it is composed of carbon and hydrogen elements. Methane has a lower cetane number (less than 10) compared to diesel, indicating poorer ignition performance and difficulty in compression ignition. Additionally, methane has a wider ignition limit compared to diesel, allowing it to operate in leaner mixtures, which is advantageous for implementing lean combustion technologies to improve engine efficiency. A comparison of the physicochemical properties between methane and diesel is shown in Table 3 [41,42].
Table 3.
Comparison of methane and diesel fuel properties.
2.3. Processing Methods
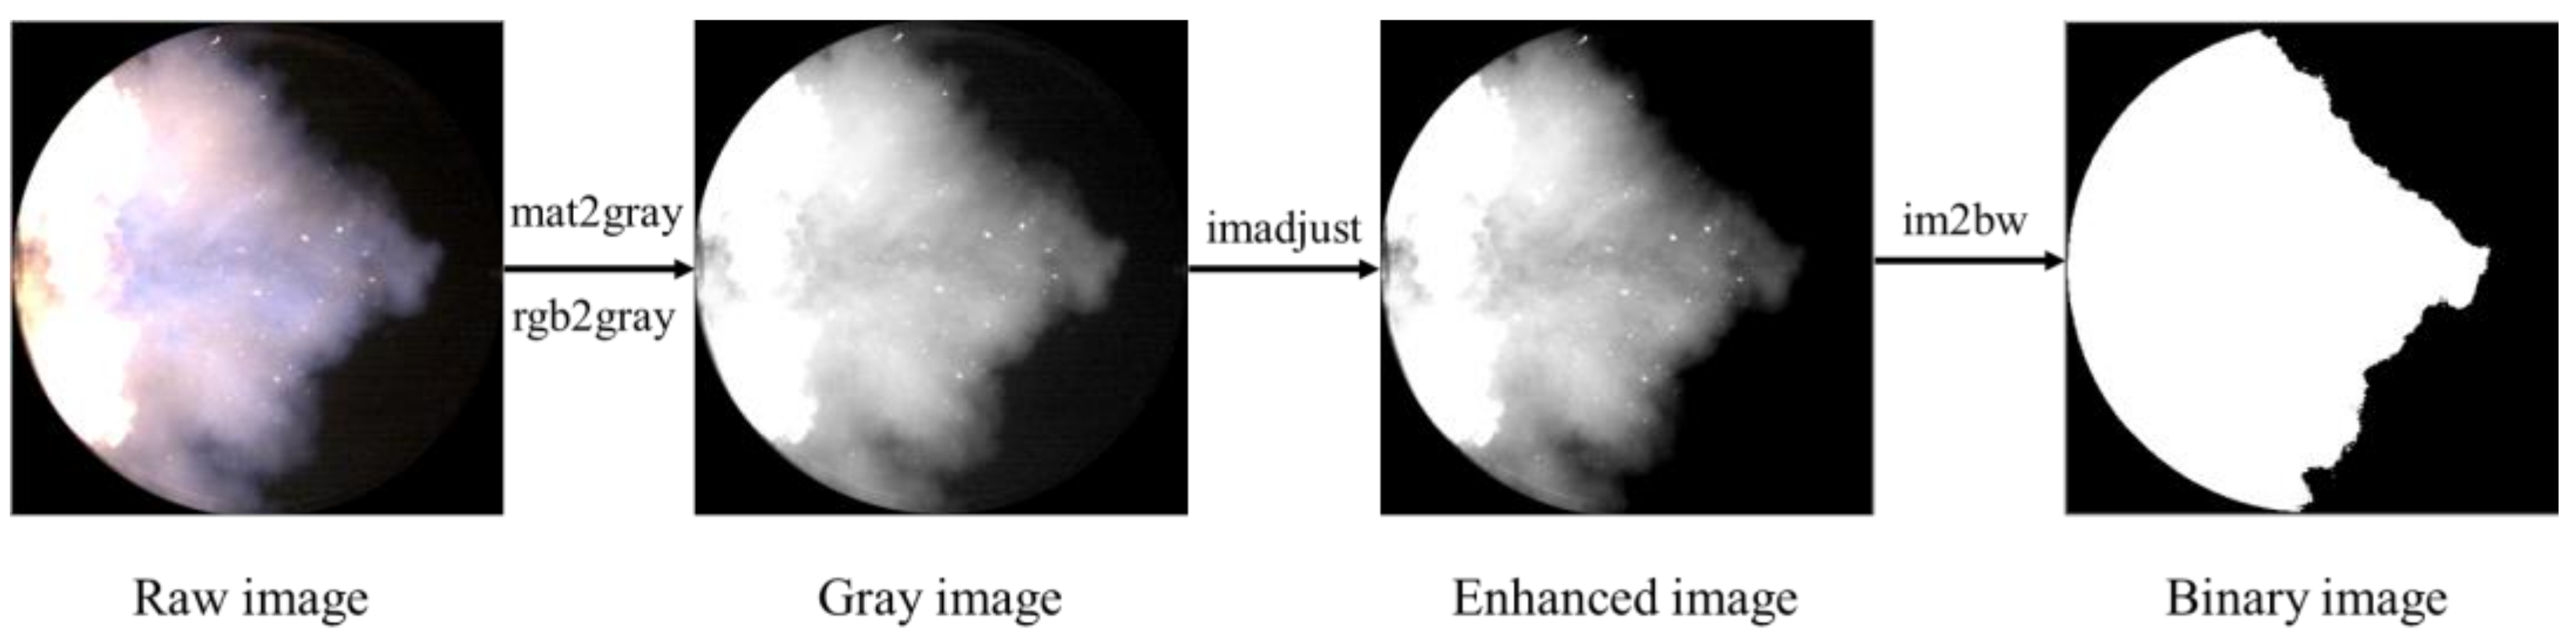
Based on the Matlab language, a processing program for natural luminescence images of flames was developed to obtain data, such as the projected area of the flame. The calculation process and method are shown in Figure 4. First, the 12-bit raw color images were normalized and translated to gray images by the mat2gray and rgb2gray functions. Then, the imadjust function was adopted to adjust the contrast of the images to make the flame area and the background easier to distinguish. Subsequently, the enhanced images were transformed into binary images by the im2bw function, based on the threshold segmentation method. Finally, the flame projection area was obtained by calculating the number of pixels and converting the actual size ratio. The raw gray-scale CL images were also processing by the Matlab program, and the average intensity of the pixel in the flame region was calculated, which could reflect the concentration of active radicals. Additionally, the raw grayscale images were transformed into pseudo color images by the jet formulation in Matlab.
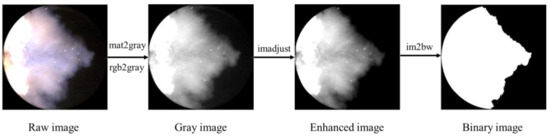
Figure 4.
Steps of image processing.
The cylinder pressure was collected at an interval of 0.2 °CA, within the range of −180 °CA ATDC (after top dead center) to 180 °CA ATDC. The collected cylinder pressure data are in the form of voltage, which needs to be multiplied by the voltage/pressure conversion coefficient and undergo zero-point correction to obtain the actual cylinder pressure value. According to the research of Brunt et al. [43], the heat release rate can be calculated with Equation (1) on the premise of ignoring the wall heat transfer for simplicity. In Equation (1), the represents the specific heat ratio of the working fluid inside the cylinder, that is, the ratio of the specific heat at constant pressure and the specific heat at constant volume. The φ is the crankshaft angle, and the p is the cylinder pressure at such φ. The V is the cylinder volume, which can be calculated based on the geometrical parameters including the stroke, connecting rod length, and the volume at TDC of the RCEM.
3. Results, Discussion, and Analysis
3.1. The Influence of Methane Premixed Mixture Equivalence Ratio
3.1.1. The Development Pattern of Flames
Figure 5 illustrates the natural luminous flames of diesel-ignited methane premixed mixture under different equivalence ratios. The time unit displayed in the figure is ms ASOI (after start of injection). In the experiment, the equivalence ratio ranged from 0.48 to 0.57, with a pilot diesel mass of 9.06 mg. From Figure 5, it can be observed that during the early stage of combustion near 2.5 ms ASOI, compression ignition of diesel fuel dominates the combustion process. At this time, the flame appears bright yellow, and it can be noticed that as the equivalence ratio of methane premixed gas decreases, the diesel flame becomes brighter. This indicates that a higher equivalence ratio of methane premixed gas, to some extent, inhibits the ignition performance of diesel fuel.
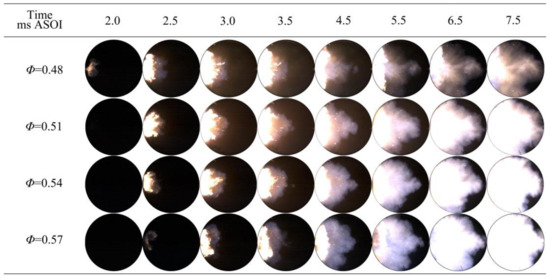
Figure 5.
Natural luminous images of flames under different equivalence ratios.
These results are consistent with the studies of Srna et al. [44] and Schlatter et al. [45]. The main reasons for the above phenomenon are as follows: firstly, the addition of methane decreases the volume fraction of oxygen in the cylinder’s premixed gas, preventing diesel from coming into contact with oxygen molecules; secondly, the addition of methane into the ambient gas reduces the reactivity of the diesel mixture, both of which inhibit the compression ignition of diesel fuel. Between 3.0 and 5.5 ms ASOI, the flame boundary of diesel–methane combustion can be clearly observed from the flame image. At this time, diesel fuel has not been completely consumed, while the methane premixed gas has been ignited, and the premixed methane flame begins to spread outward. After 5.5 ms ASOI, methane combustion becomes the main combustion process in the cylinder, and with the increase in the equivalence ratio of methane premixed gas, the brightness of the methane combustion flame increases, and the flame color gradually turns blue. This indicates that after entering the methane premixed combustion stage, an increase in the equivalence ratio can make the methane combustion more intense.
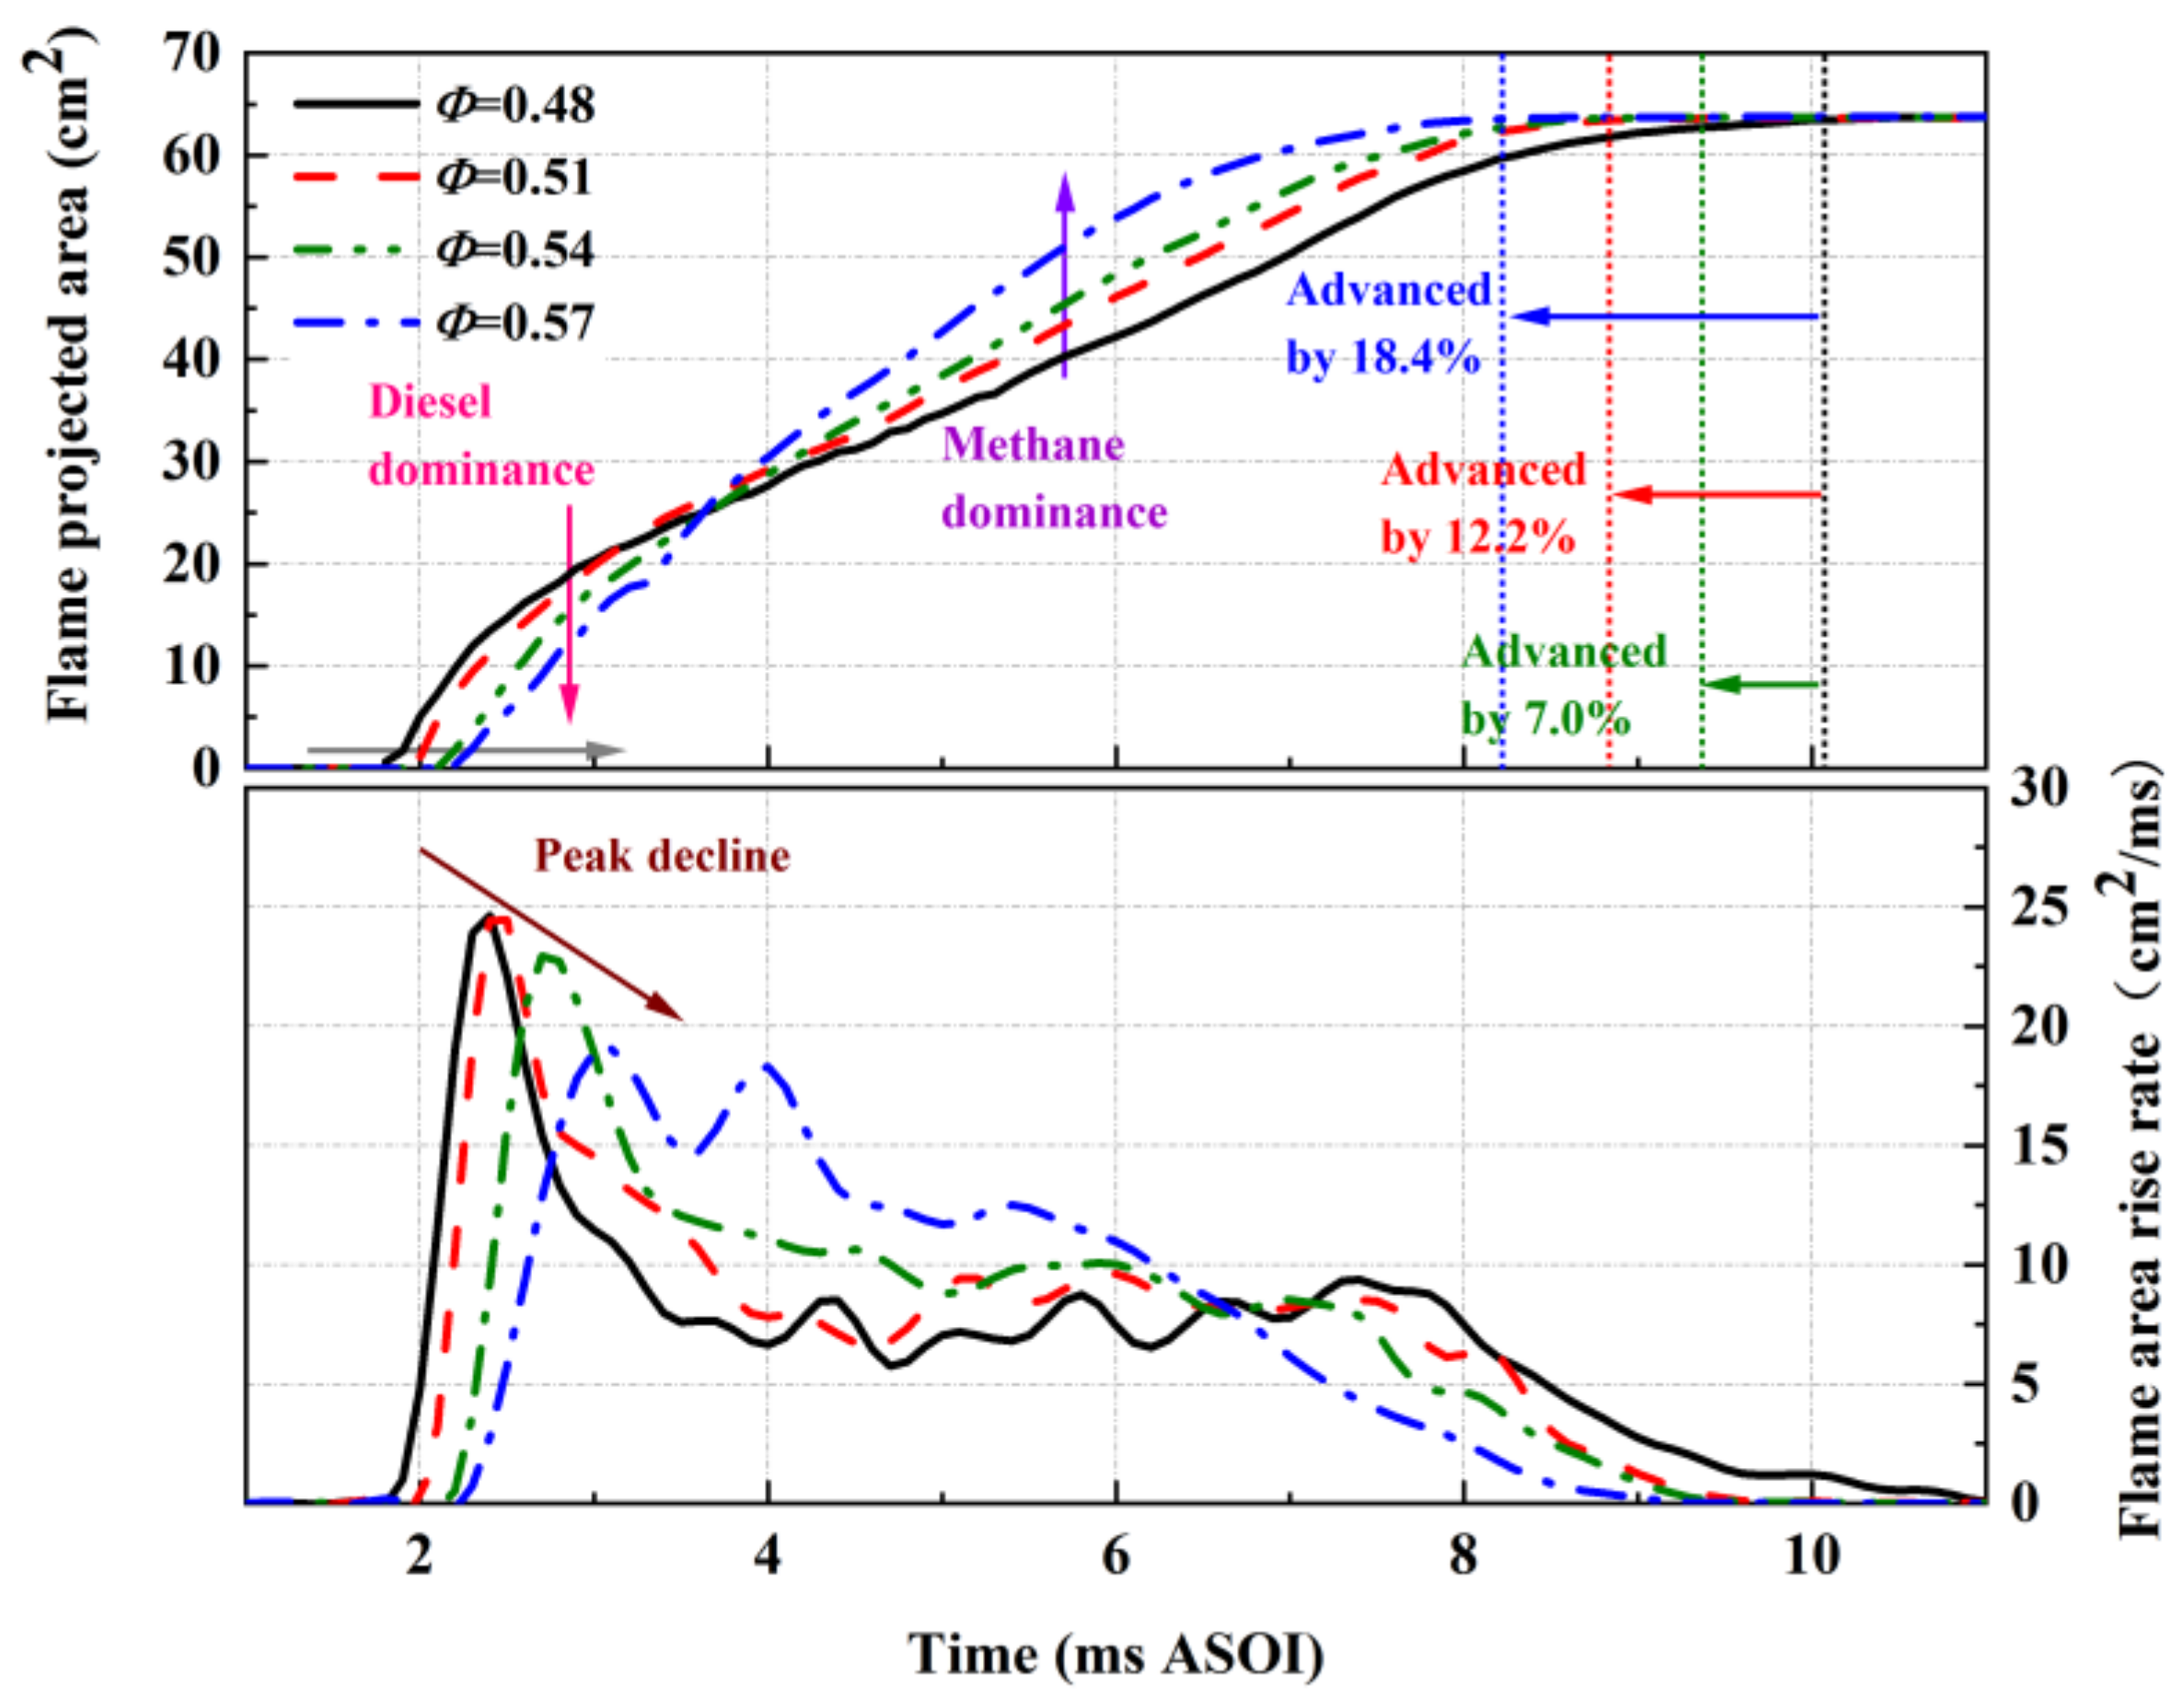
Figure 6 shows the flame development pattern obtained after processing the natural light image. From the flame projection area results in Figure 6, the following phenomena can be observed. Firstly, as the equivalence ratio of methane premixed gas increases, the timing of diesel flame appearance gradually shifts to later, increasing from around 1.8 ms ASOI at to around 2.2 ms ASOI at . This also confirms the inhibitory effect of a methane atmosphere on diesel ignition. Secondly, when entering the dominant region of diesel combustion, the flame projection area decreases with an increase in the equivalence ratio, indicating that at lower equivalence ratios, the initial ignition area is larger, with more ignition points and faster early flame propagation. However, after entering the dominant region of methane combustion, the flame projection area trends in the opposite direction, with a larger flame projection area at higher equivalence ratios. Finally, with an increase in the equivalence ratio, the moment when the flame fills the entire combustion chamber advances. Compared to an equivalence ratio of 0.48, the flame filling moment advances by 7.0%, 12.2%, and 18.4% at equivalence ratios of 0.51, 0.54, and 0.57, respectively. Therefore, although increasing the equivalence ratio may inhibit early diesel combustion, it can promote the propagation of premixed flame in the middle and later stages, thereby shortening the overall flame propagation time.

Figure 6.
Flame development characteristics under different equivalence ratios.
Based on the derivative of the flame projection area, the rise rate of the flame projection area was obtained. From Figure 6, it can be seen that within a very short period of time after ignition, the rise rate of the flame projection area under different equivalence ratios of the premixed gas increases rapidly, reaching its peak within 1 ms. Furthermore, the peak value of the flame area rise rate decreases with an increase in the equivalence ratio. The main reason for this is that during the early stage of combustion, where compression ignition of diesel fuel dominates, a higher concentration of methane premixed gas leads to a more pronounced inhibitory effect on diesel ignition. However, after approximately 3.0 ms ASOI, the combustion gradually transitions to being dominated by the propagation of the methane flame, resulting in an increase in the flame area rise rate with an increase in the equivalence ratio. It is worth noting that under equivalence ratios of 0.48 and 0.51, the flame area rise rate exhibits a bimodal shape. It can be observed that around 4 ms ASOI and 5 ms ASOI, the growth rate curves for these two conditions have valleys. This is because the diesel flame propagates faster, while the methane flame propagates at a slower speed, especially when the equivalence ratio is low. The difference in combustion speeds between the two fuels leads to the appearance of valleys in the flame area rise rate curve when the combustion mode transitions from diesel autoignition dominance to methane premixed flame propagation dominance. As the equivalence ratio increases, the inhibitory effect on diesel fuel becomes stronger, while the propagation speed of the methane premixed flame increases. The difference in propagation speeds between the two fuels is reduced to some extent, resulting in the gradual disappearance of valleys in the flame area rise rate curve.
3.1.2. The Generation Characteristics of OH
Figure 7 displays the distribution maps of OH radicals under various equivalence ratios. An initial observation from Figure 6 shows that OH chemiluminescence is first detected under the condition of , signaling that the high temperature reaction commences first under a low equivalence ratio condition. Furthermore, in the OH maps from 2.5 ms ASOI to 3.5 ms ASOI, corresponding to the early stage of combustion, the intensity of OH chemiluminescence in the diesel ignition region within the maps declines as the equivalence ratio increases. As analyzed earlier, methane inhibits diesel combustion, leading to a weaker OH chemiluminescence intensity under conditions of higher equivalence ratios during the initial combustion stage. However, as combustion progresses, OH produced by diesel combustion is consumed, and the OH chemiluminescence becomes primarily driven by methane combustion. Therefore, as the equivalence ratio escalates, methane combustion intensifies, which results in a stronger OH chemiluminescence intensity under higher equivalence ratios, as observed in Figure 6 at 7.5 ms ASOI.
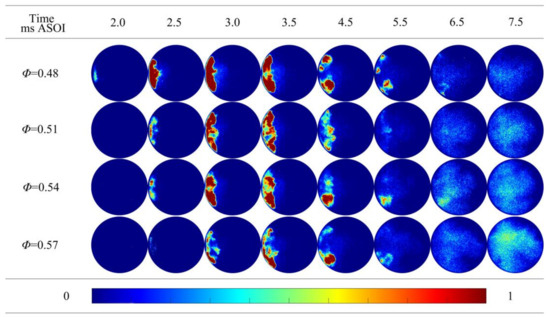
Figure 7.
OH distribution map under different equivalence ratios.
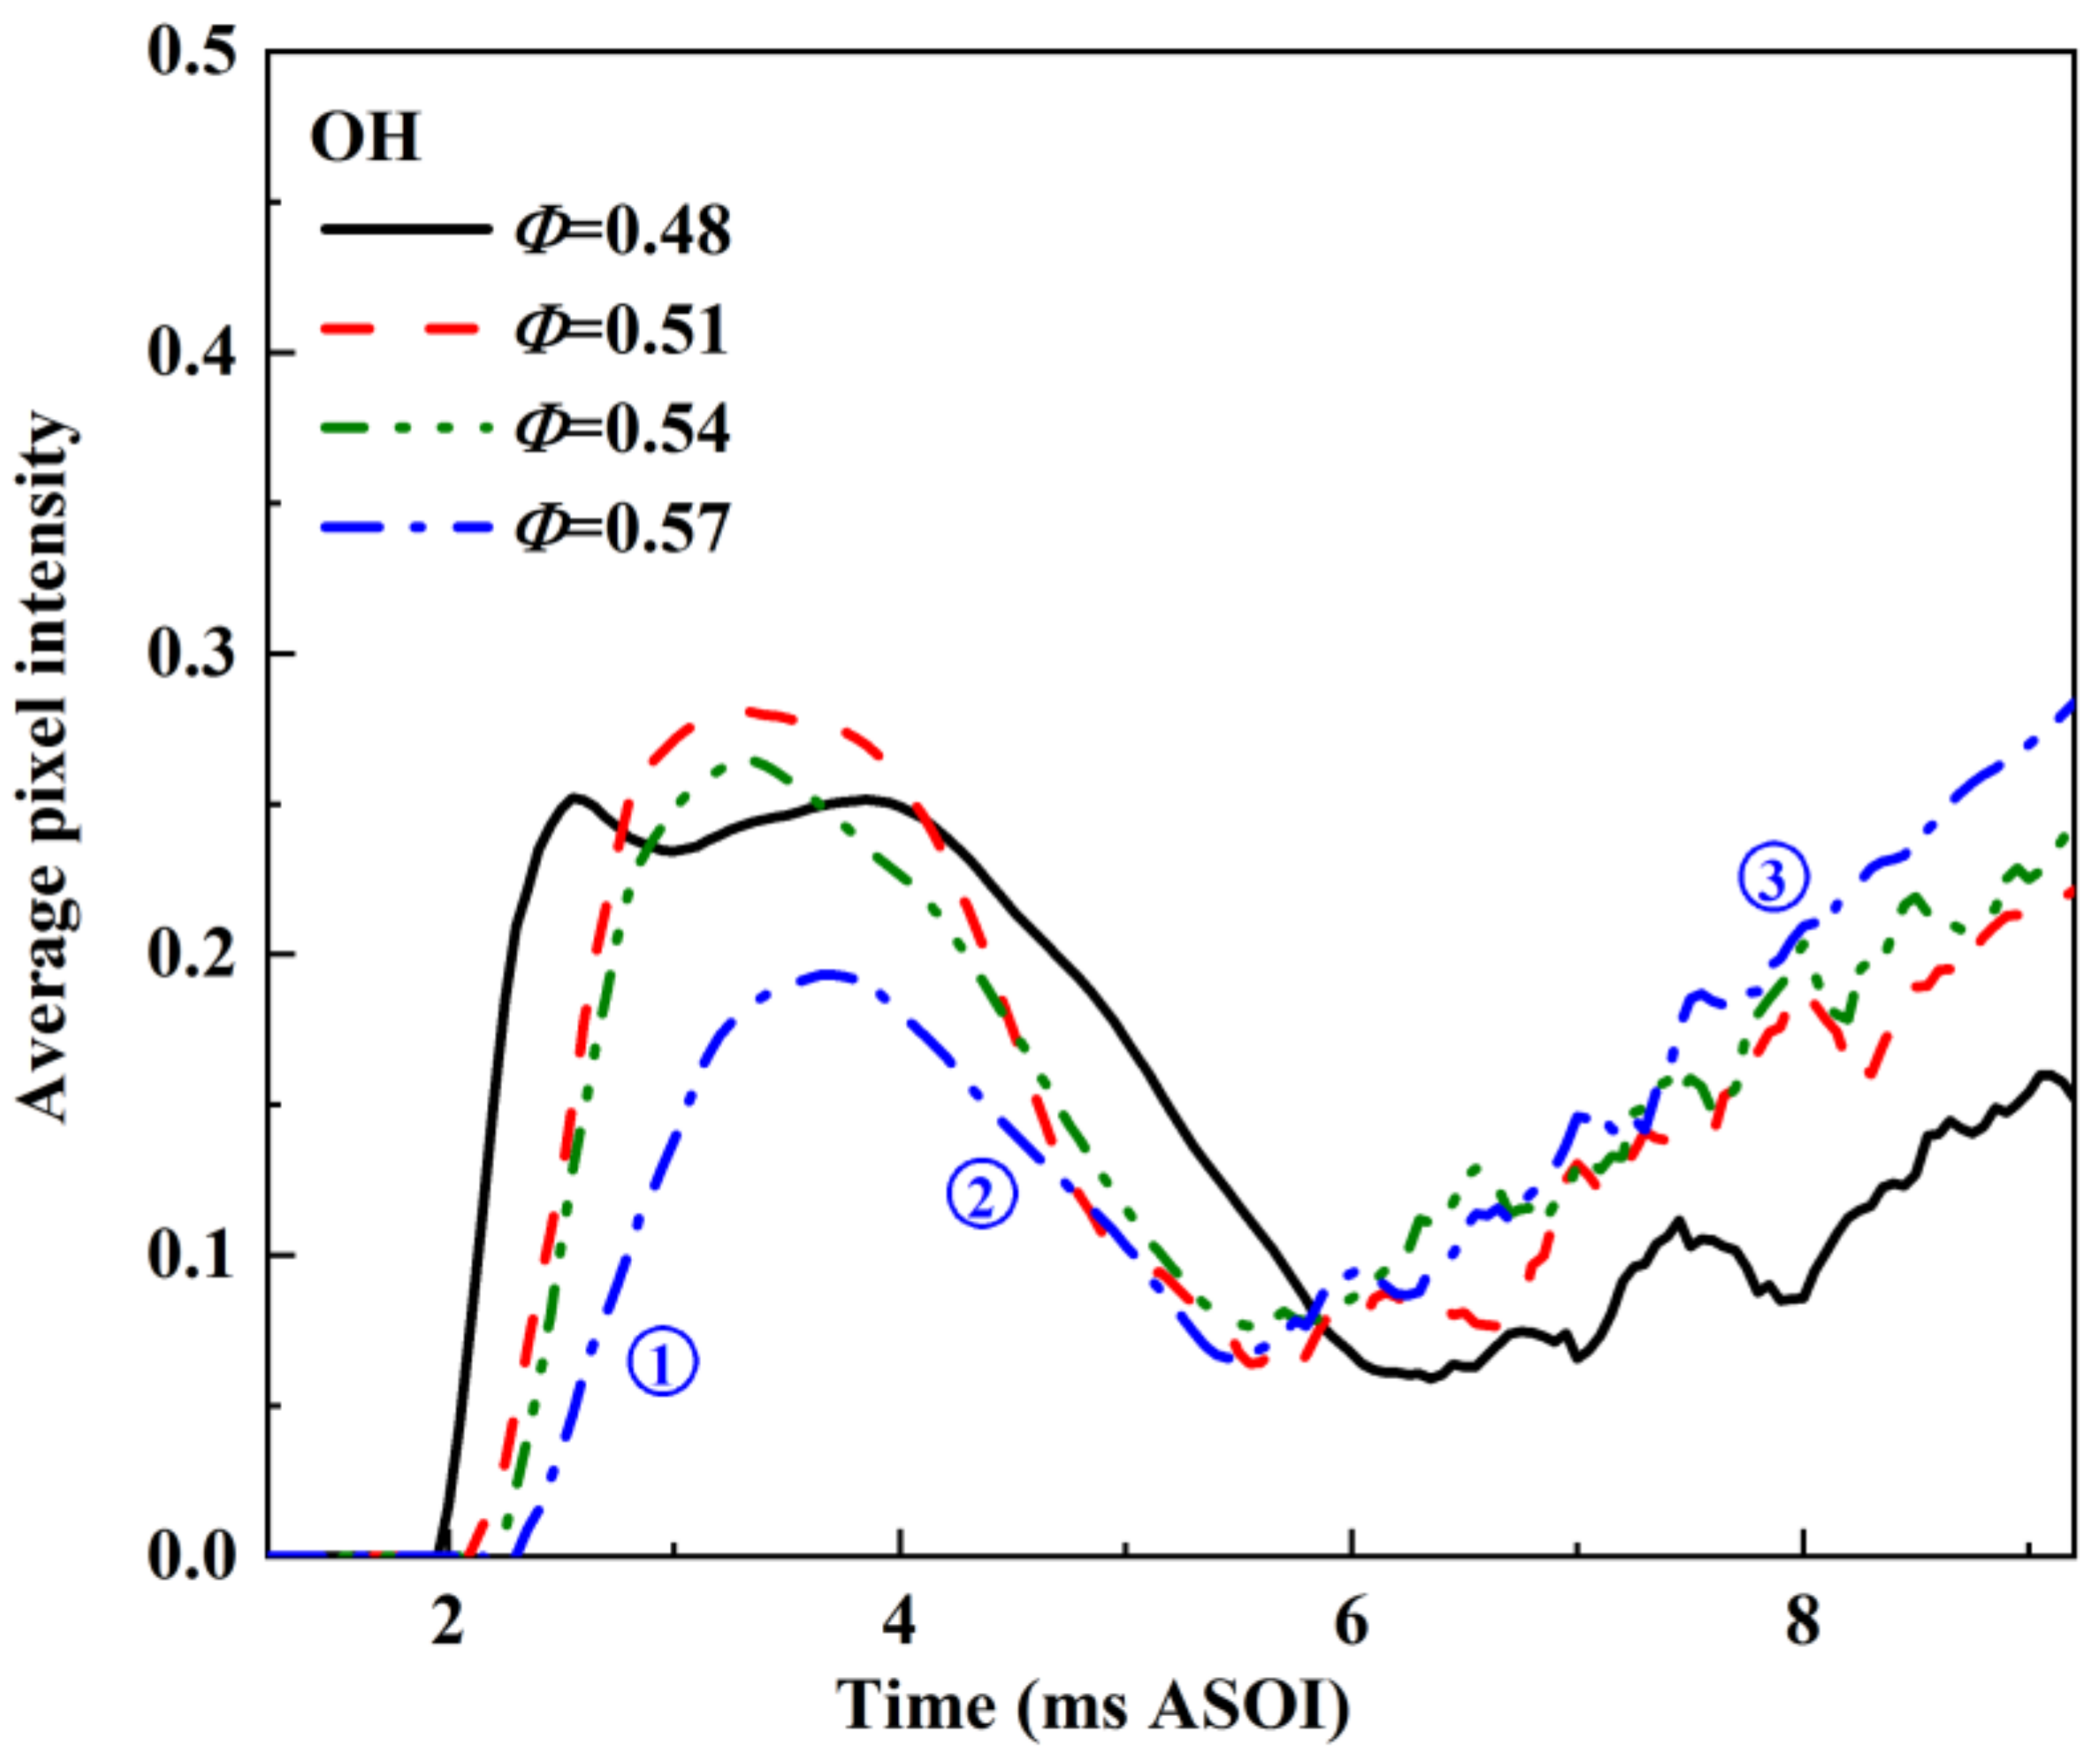
Figure 8 displays the curves of average pixel intensity in the OH generation regions obtained from the chemiluminescence images under different equivalence ratios; these illustrate the evolution of OH chemiluminescence intensities over time. The patterns of OH chemiluminescence intensities with time under various equivalence ratios are essentially the same, encompassing three stages: first increasing (As indicated in ① of Figure 8), then decreasing (②), and finally increasing again (③). This pattern aligns with the characteristics of dual-fuel combustion. In the early stage of combustion, the formation of OH primarily stems from the high-temperature reaction of diesel fuel. As a highly reactive fuel, diesel undergoes a rapid and intense combustion reaction. Moreover, diesel enters the cylinder via direct injection, leading to a relatively high local equivalence ratio in the diesel distribution area. Additionally, diesel molecules contain more hydrogen atoms that are available to bond with oxygen atoms, thereby generating a substantial amount of OH. Consequently, the chemiluminescence signal intensity increases rapidly within 3 ms ASOI. Under the condition of , the curve experiences a brief decline at around 2.5 ms ASOI before continuing its ascent. This may be due to the less inhibited combustion of diesel under the 0.48 equivalence ratio, resulting in a shorter ignition delay period and possibly a higher initial ignition area temperature. Consequently, the methane premixed flame propagates earlier, causing the OH radical formation concentration and chemiluminescence intensity in the methane premixed flame area to be significantly lower than that produced by diesel combustion. This reduces the overall average pixel intensity. Between approximately 4 ms ASOI and 6 ms ASOI, the average signal intensity in the OH formation region begins to decline due to the consumption of the high-intensity OH produced by diesel and the diffusion of low-intensity OH radicals in the methane premixed flame. After 6 ms ASOI, the continuous combustion reaction of methane increases the concentration of OH generated by the reaction, causing the OH-group signal intensity curves to climb again. The OH signal intensity under higher equivalence ratio conditions is higher due to the larger methane concentration.
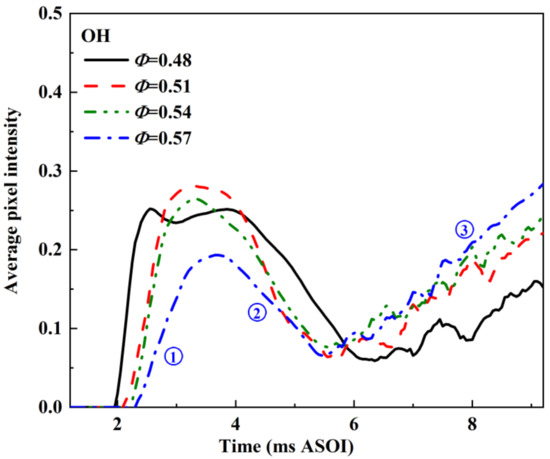
Figure 8.
OH radical intensity curves under different equivalence ratios.
3.1.3. Combustion Characteristics
Figure 9 shows the cylinder pressure and heat release rate characteristics under different equivalence ratios of methane premixed gas. It can be observed that with an increase in the equivalence ratio, the maximum cylinder pressure (pmax) generated by combustion gradually increases from 6.7 MPa at .48 to 7.6 MPa at .57, due to the increase in the concentration of the mixture and the overall fuel quantity. The maximum heat release rate (HRRmax) also increases from 430 J/°CA at .48 to 708 J/°CA at .57, an increase of 65%. It is worth noting that in the region dominated by diesel combustion marked in Figure 9b, combined with the magnified plot of the early-stage heat release rate curve in Figure 9c, it can clearly be seen that the HRR exhibits a segmented increase from −4 °CA ATDC to 0 °CA ATDC. From −4 °CA ATDC to −2.2 °CA ATDC, the HRR increases rapidly, suggesting that the combustion heat release during this period is mainly dominated by diesel combustion. In this region, as the equivalence ratio increases, the HRR gradually decreases, which is consistent with the previous observation regarding flame projection area development. Additionally, from Figure 9c, it can be seen that there is a significant overlap between the diesel injection duration and the heat release period at low equivalence ratios. When the equivalence ratio is 0.57, this overlap region disappears, indicating that a higher equivalence ratio has a more pronounced inhibitory effect on diesel combustion, and the combustion mode is mainly dominated by premixed compression ignition.
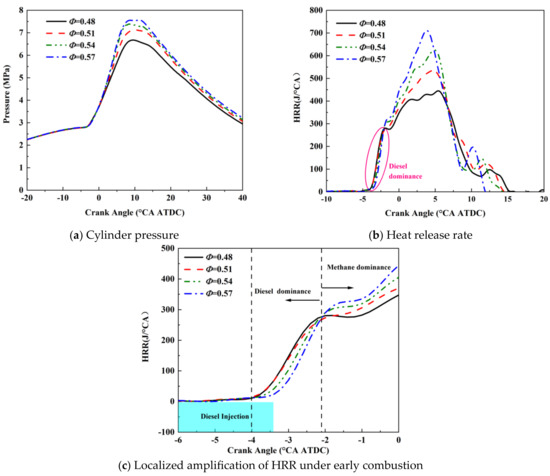
Figure 9.
Combustion characteristics at different equivalence ratios.
Figure 10 shows the combustion phasing (left axis) and combustion duration (right axis) under different equivalence ratios of premixed gas. As the equivalence ratio of the premixed gas increases, the early ignition process dominated by diesel combustion is suppressed, resulting in a gradual delay in the CA10 phase. On the other hand, the increased flame propagation speed of methane premixed gas leads to an advancement in both the CA50 and CA90 phases. Overall, the combustion duration is shortened with an increase in the equivalence ratio of the premixed gas.
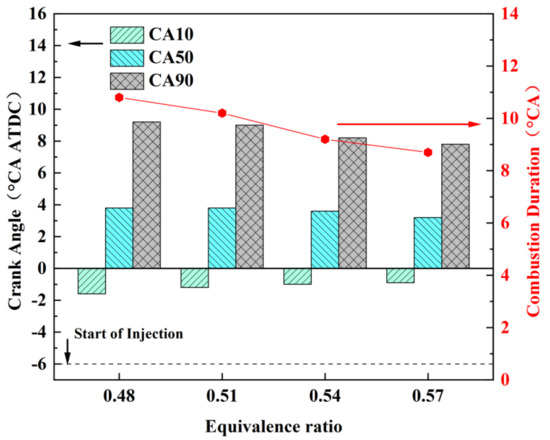
Figure 10.
Combustion phasing and duration under different equivalence ratios.
3.2. The Influence of Pilot Diesel Injection Mass
3.2.1. The Development Pattern of Flames
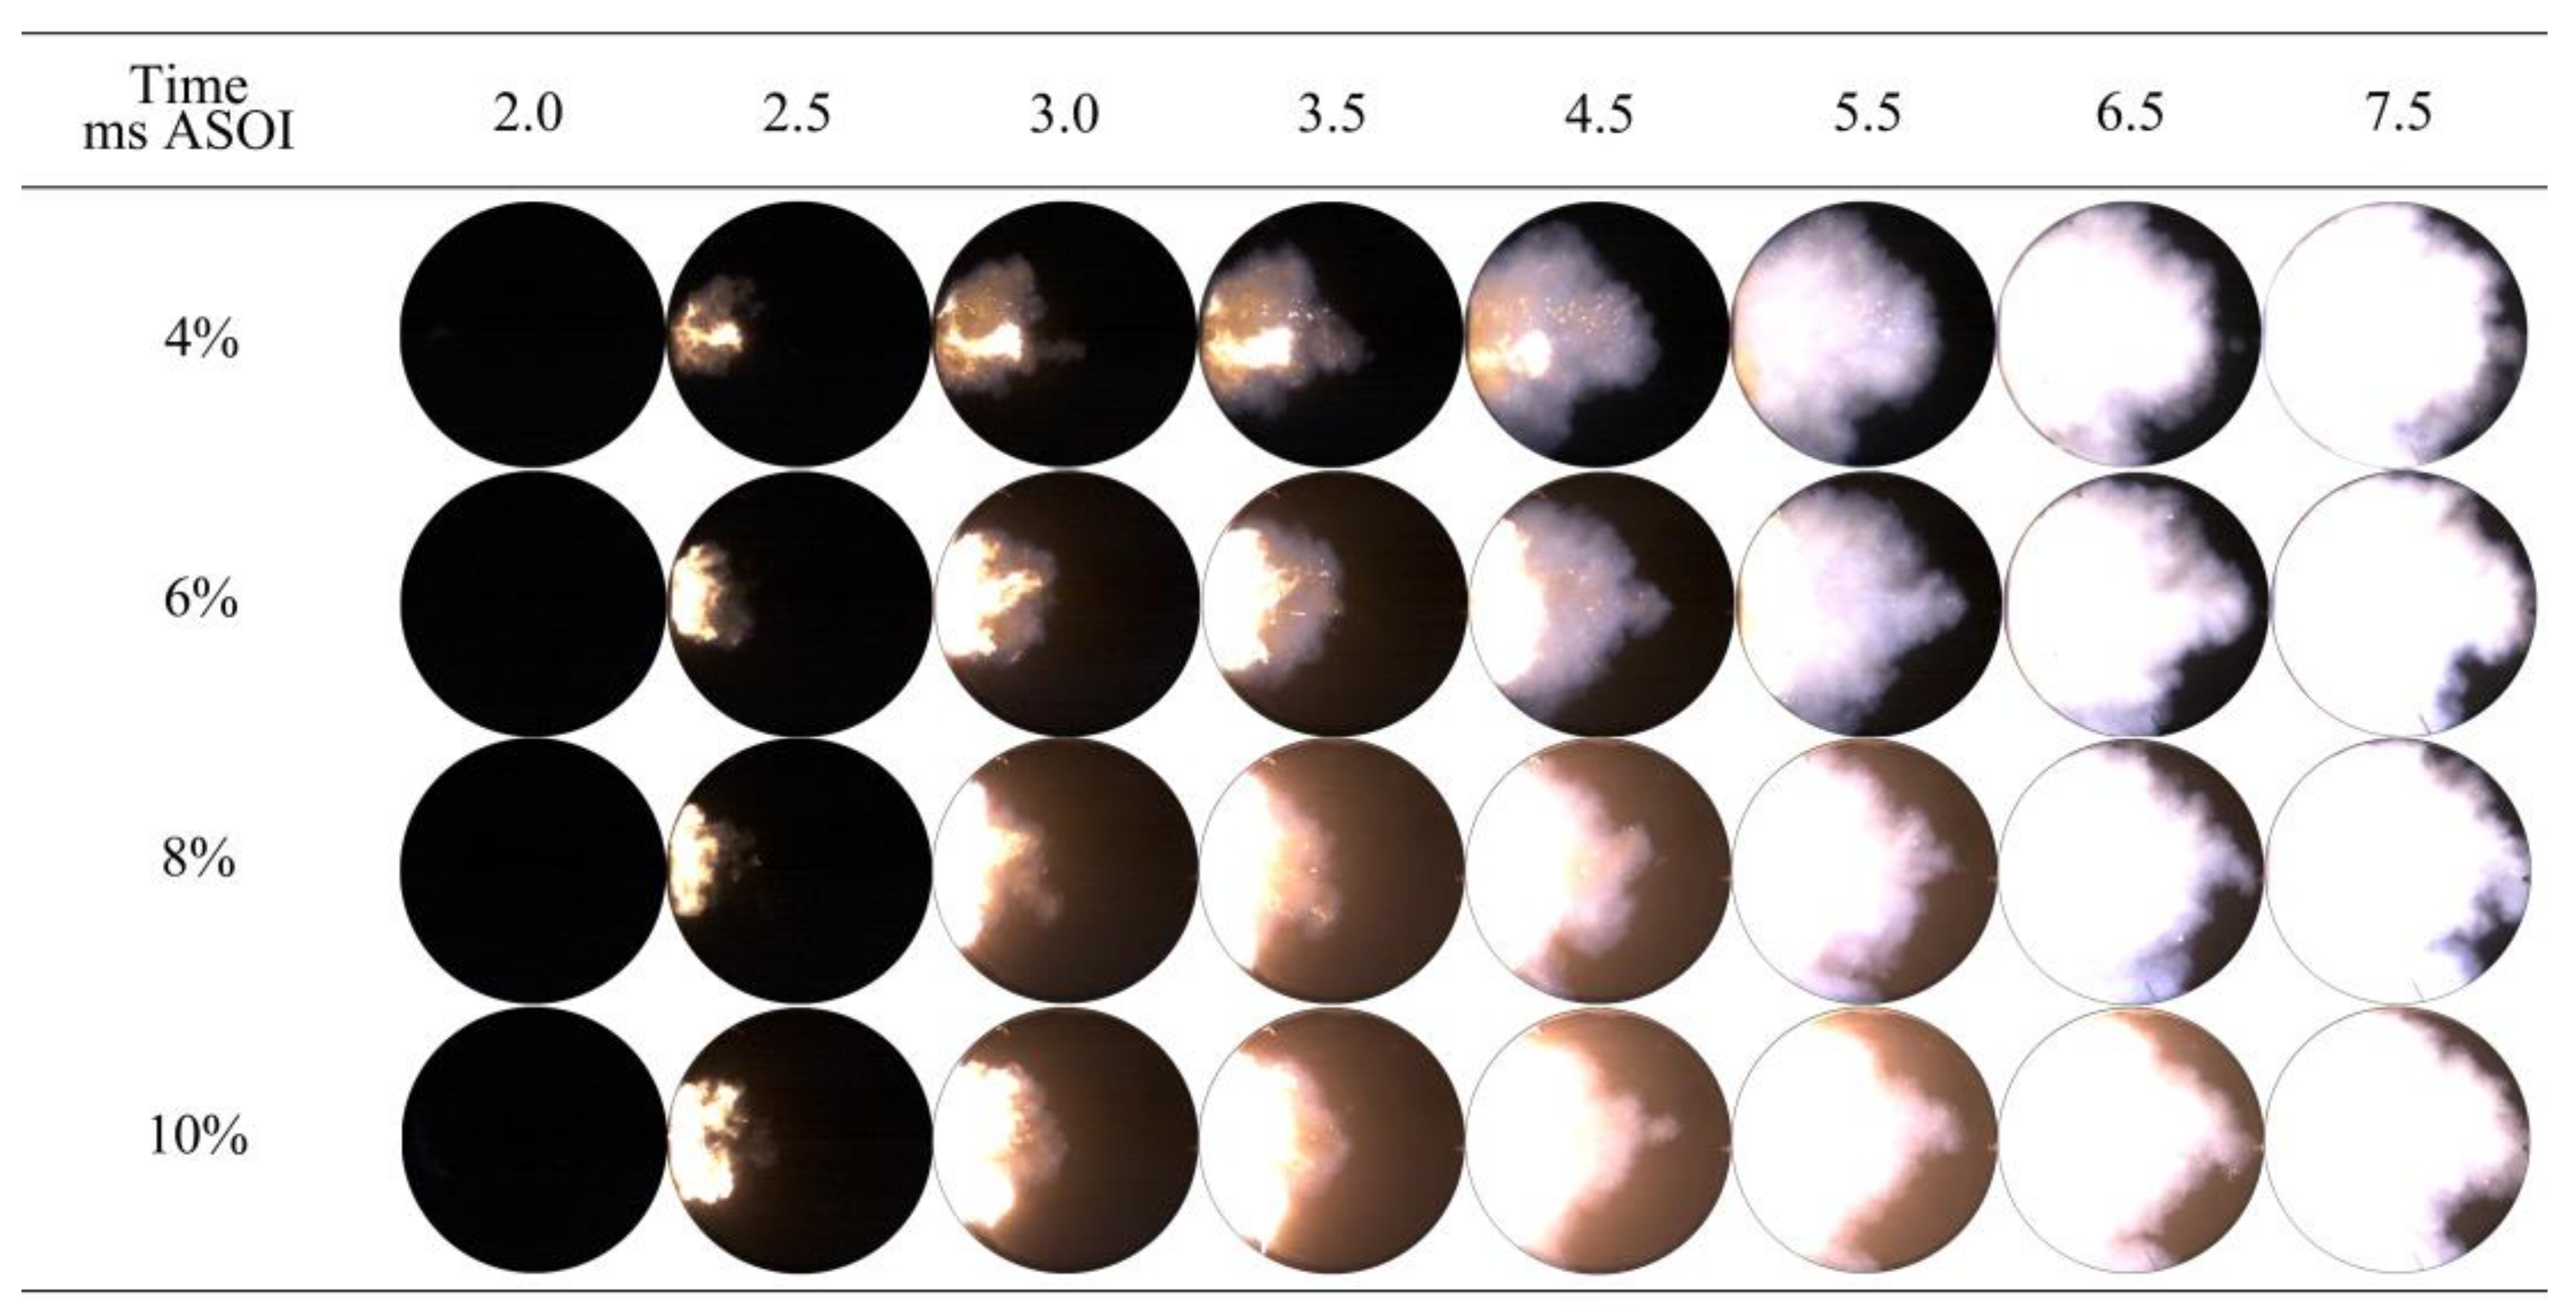
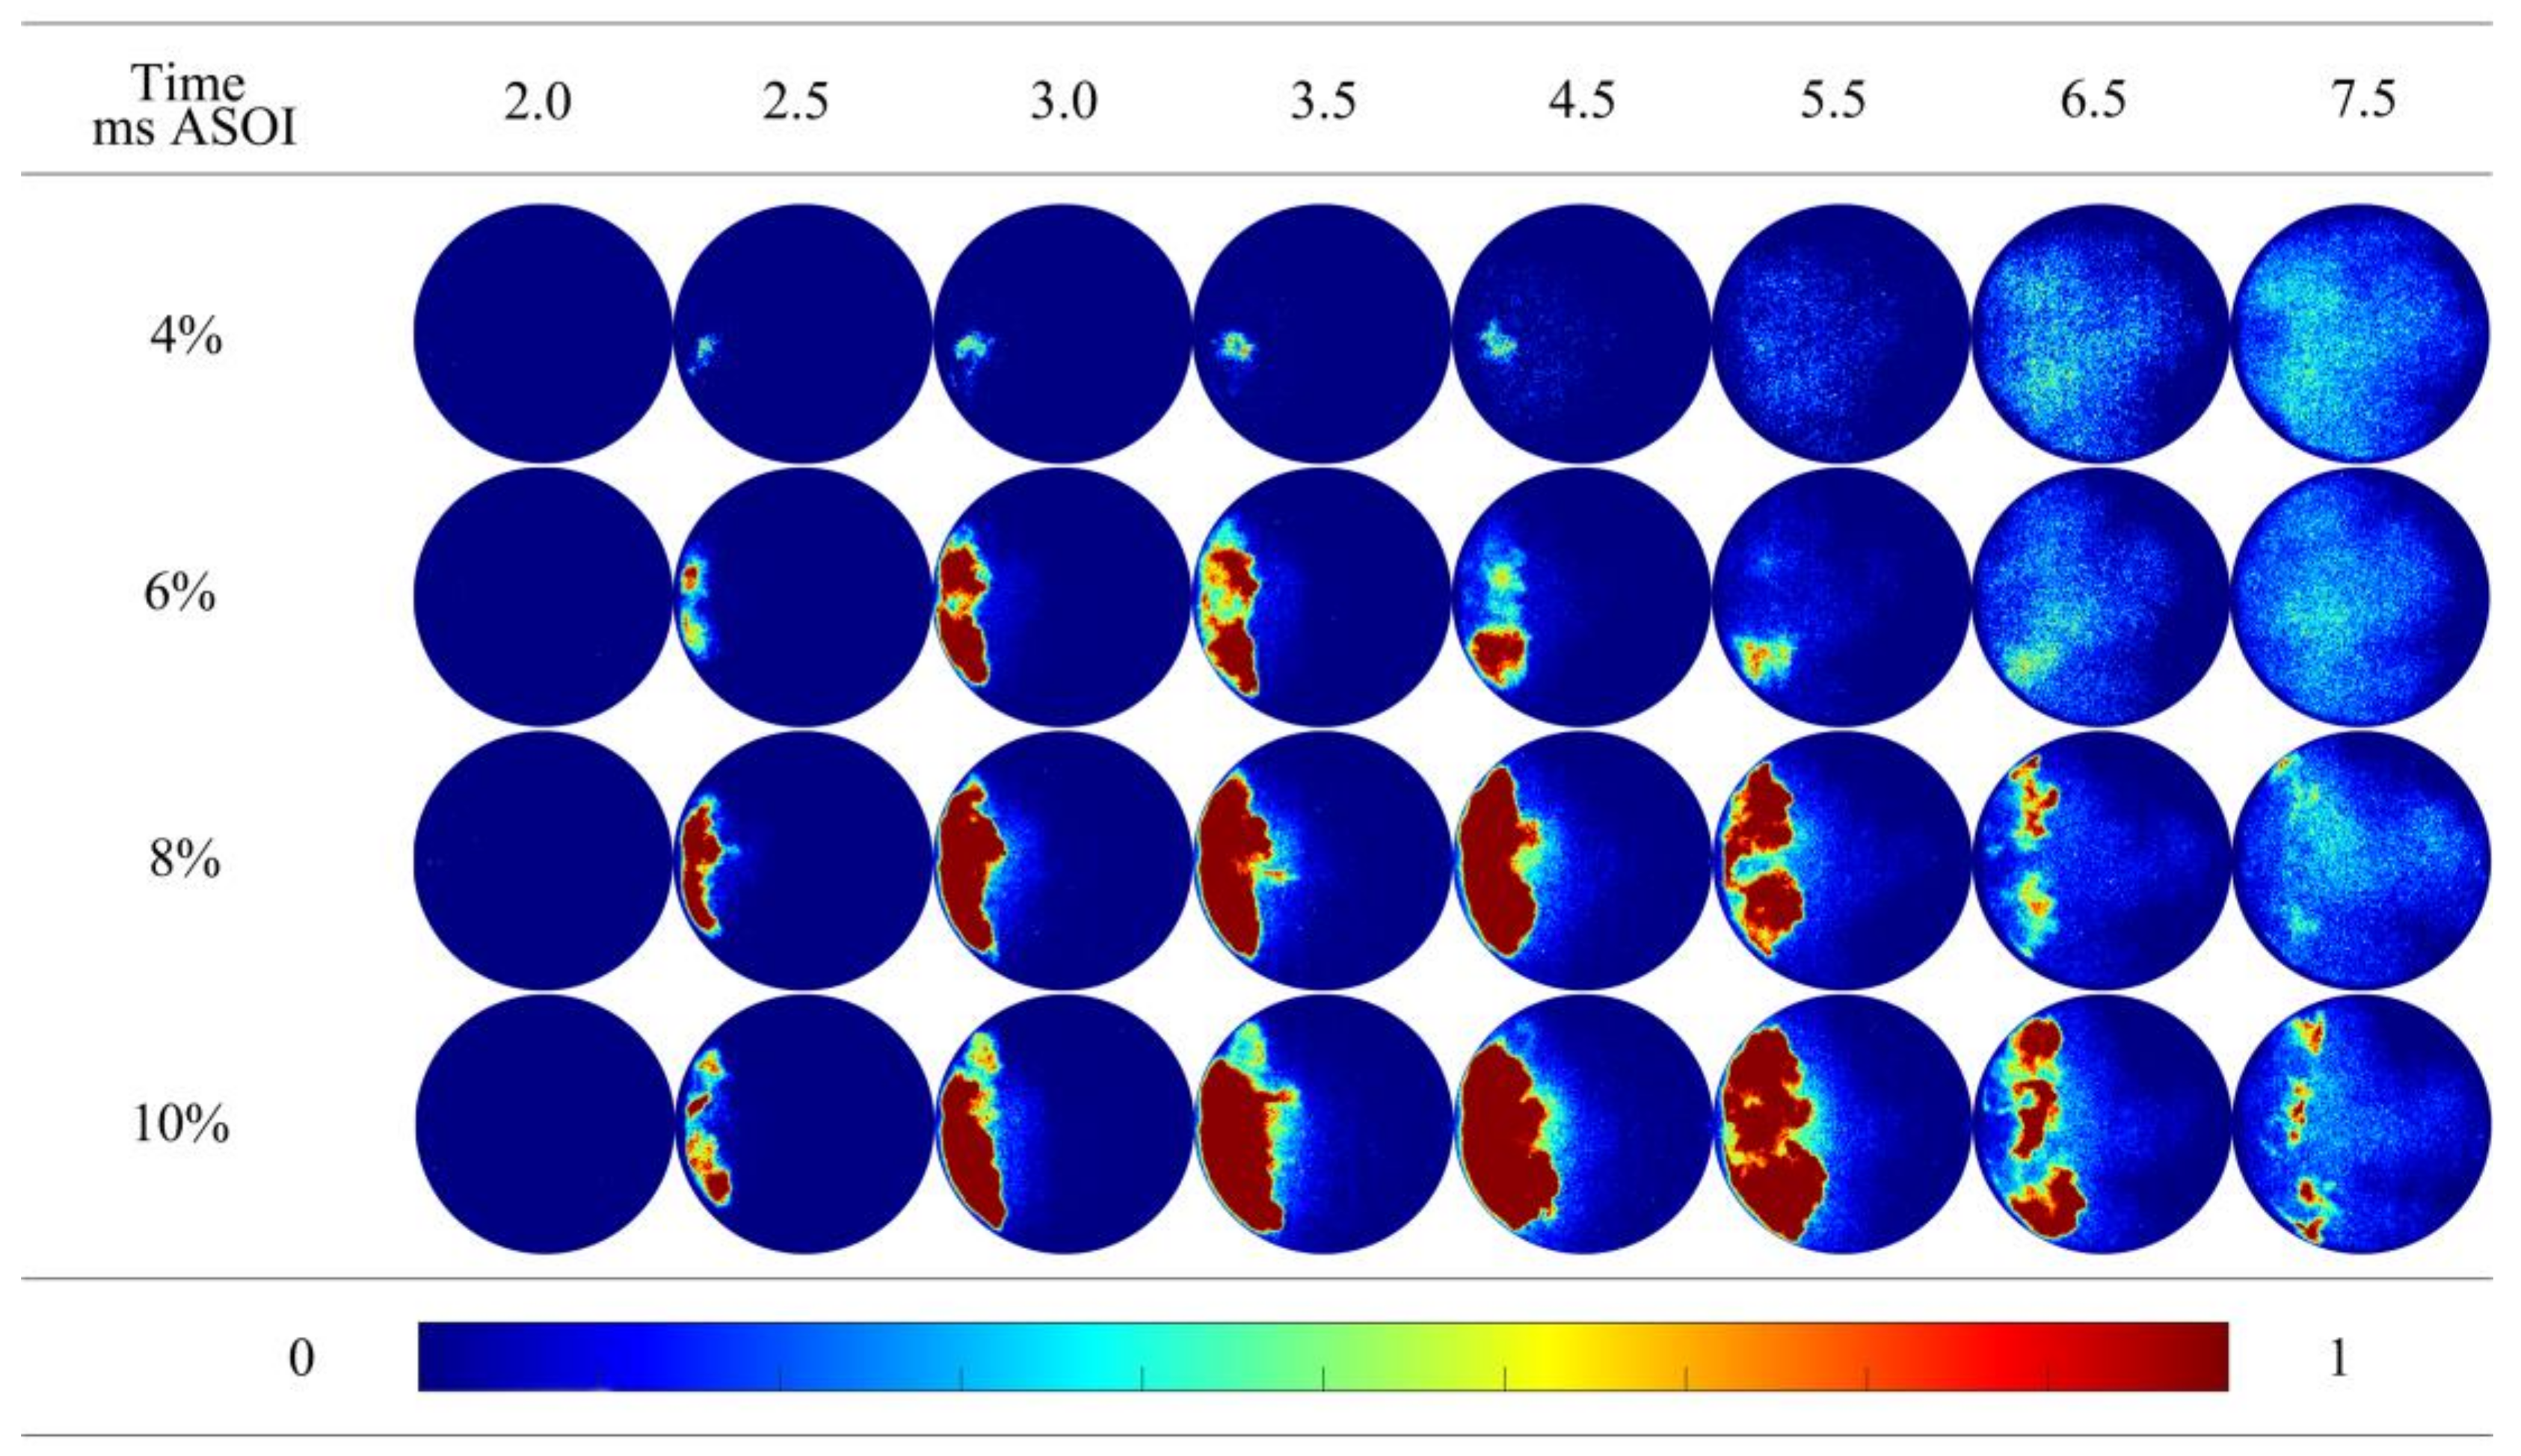
Figure 11 showcases the natural luminous flames of diesel-ignited methane–air premixed mixtures under varying injection masses of pilot diesel. In the experiment, diesel was injected at masses of 6.04 mg, 9.06 mg, 12.07 mg, and 15.09 mg, with energy ratios of 4%, 6%, 8%, and 10% relative to methane, respectively. The equivalence ratio of the methane–air premixed mixture was 0.54. It is evident from the figure that as the diesel injection mass increases, the bright yellow region produced by diesel combustion in the flame image gradually enlarges, and the flame luminosity also increases accordingly. From 3.5 ms ASOI to 4.5 ms ASOI, when the diesel injection mass is 4%, the bright yellow region in the flame image has already started to shrink due to the smaller diesel injection mass under this operating condition, while the other three sets of operating conditions with larger diesel injection masses still exhibit an expanding bright yellow region in the flame.
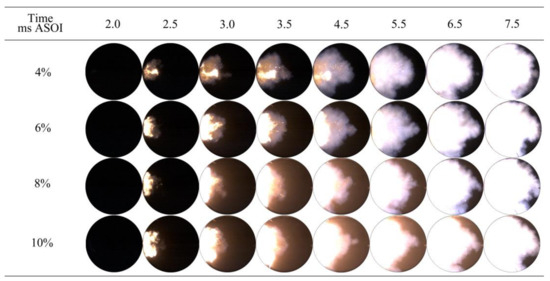
Figure 11.
Natural luminous images of flames under different injection masses of pilot diesel.
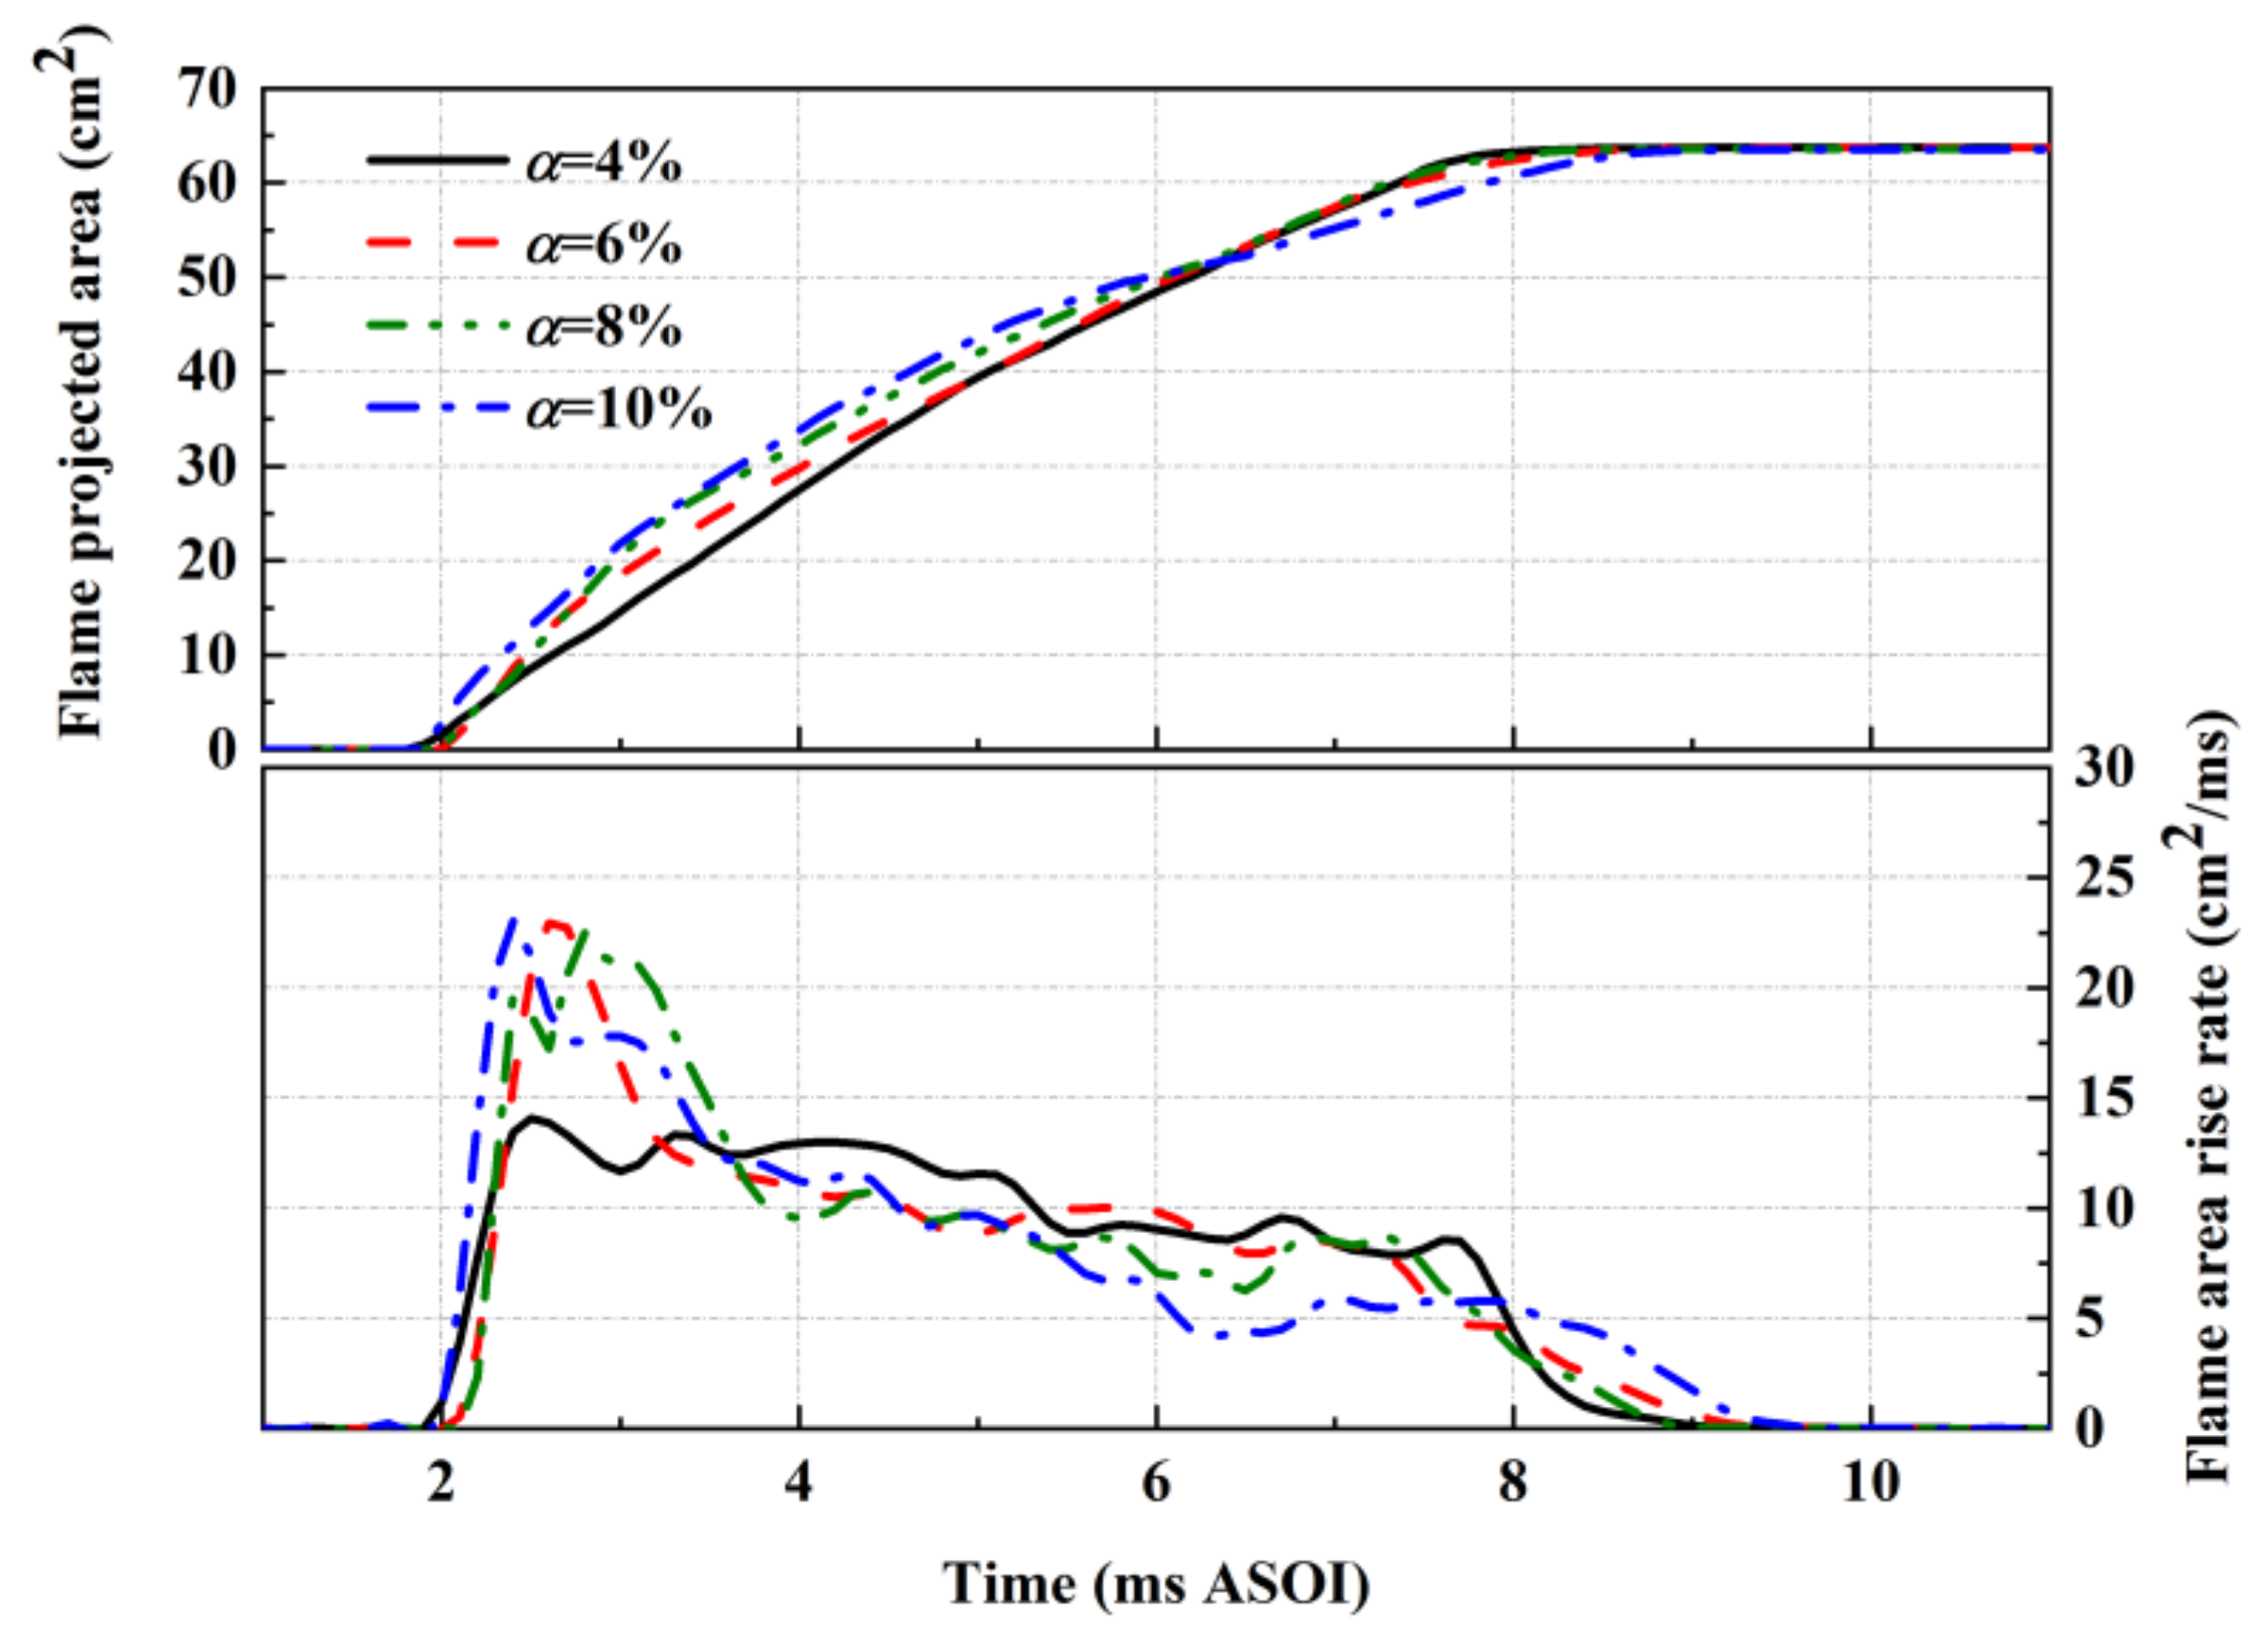
Figure 12 illustrates the development pattern of the flame projection area under different injection masses of pilot diesel. From the upper part of the figure, it can be observed that before approximately 6.5 ms ASOI, the flame projection area gradually increases with an increase in the diesel injection mass. It is not difficult to understand that as the diesel injection mass, which serves as the ignition energy source, increases, the heat released by diesel in the early stage of combustion also increases. This leads to an elevated temperature in the ignition region, resulting in a larger range of multi-point ignition and promoting the combustion of methane premixed gas. However, in the later stage of flame propagation, the condition with a diesel injection mass of 10% reaches the maximum flame projection area latest, while the other three conditions reach their maximum values relatively earlier. Combining the flame projection area rise rate curve in the lower part of Figure 12, it can also be observed that when the diesel injection mass is 4%, due to the smaller diesel injection mass, the heat released by diesel combustion is limited, resulting in a significantly lower flame projection area rise rate compared to the other three conditions. However, after approximately 3.6 ms ASOI, the flame projection area rise rate shows a decreasing trend with an increase in the diesel injection mass. While the injection pressure and diesel nozzle diameter were kept constant, the diesel injection mass was changed by adjusting the injection duration in the experiments. The prolonged injection duration leads to a longer penetrating period for the diesel spray, carrying the surrounding methane premixture along the injection direction. This makes the combustion region tend to concentrate downstream in the injection direction of the diesel spray, and hinders the methane premixed flame from propagating back. These observations indicate that blindly increasing the injection mass of pilot diesel in the engine is not advisable. It is necessary to consider parameters such as injection direction, injection pressure, and injection mass to ensure full development of the methane premixed flame.

Figure 12.
The flame development characteristics under different injection masses of pilot diesel.
3.2.2. The Generation Characteristics of OH
Figure 13 illustrates the OH radical maps under various injection masses of pilot diesel. As the injection mass increases, more reactants are provided, which enhances early-stage combustion. Consequently, it can be observed that with the rising injection mass of pilot diesel, the areas of high-intensity regions (red regions) in the OH maps expand. During the combustion reaction’s progression, the OH produced by diesel combustion is progressively consumed. Higher amounts of OH are generated for larger diesel mass conditions; thus, the OH map reveals that as the injection mass of pilot diesel increases, the dissipation time of local high-intensity OH regions in the early stage gradually prolongs. At a 4% diesel injection mass, there are no OH regions with noticeably high signal intensities in the OH maps at 5.5 ms ASOI. However, when the diesel injection mass reaches 10%, high-intensity local OH signals can still be observed at 7.5 ms ASOI.

Figure 13.
OH distribution map under different injection masses of pilot diesel.
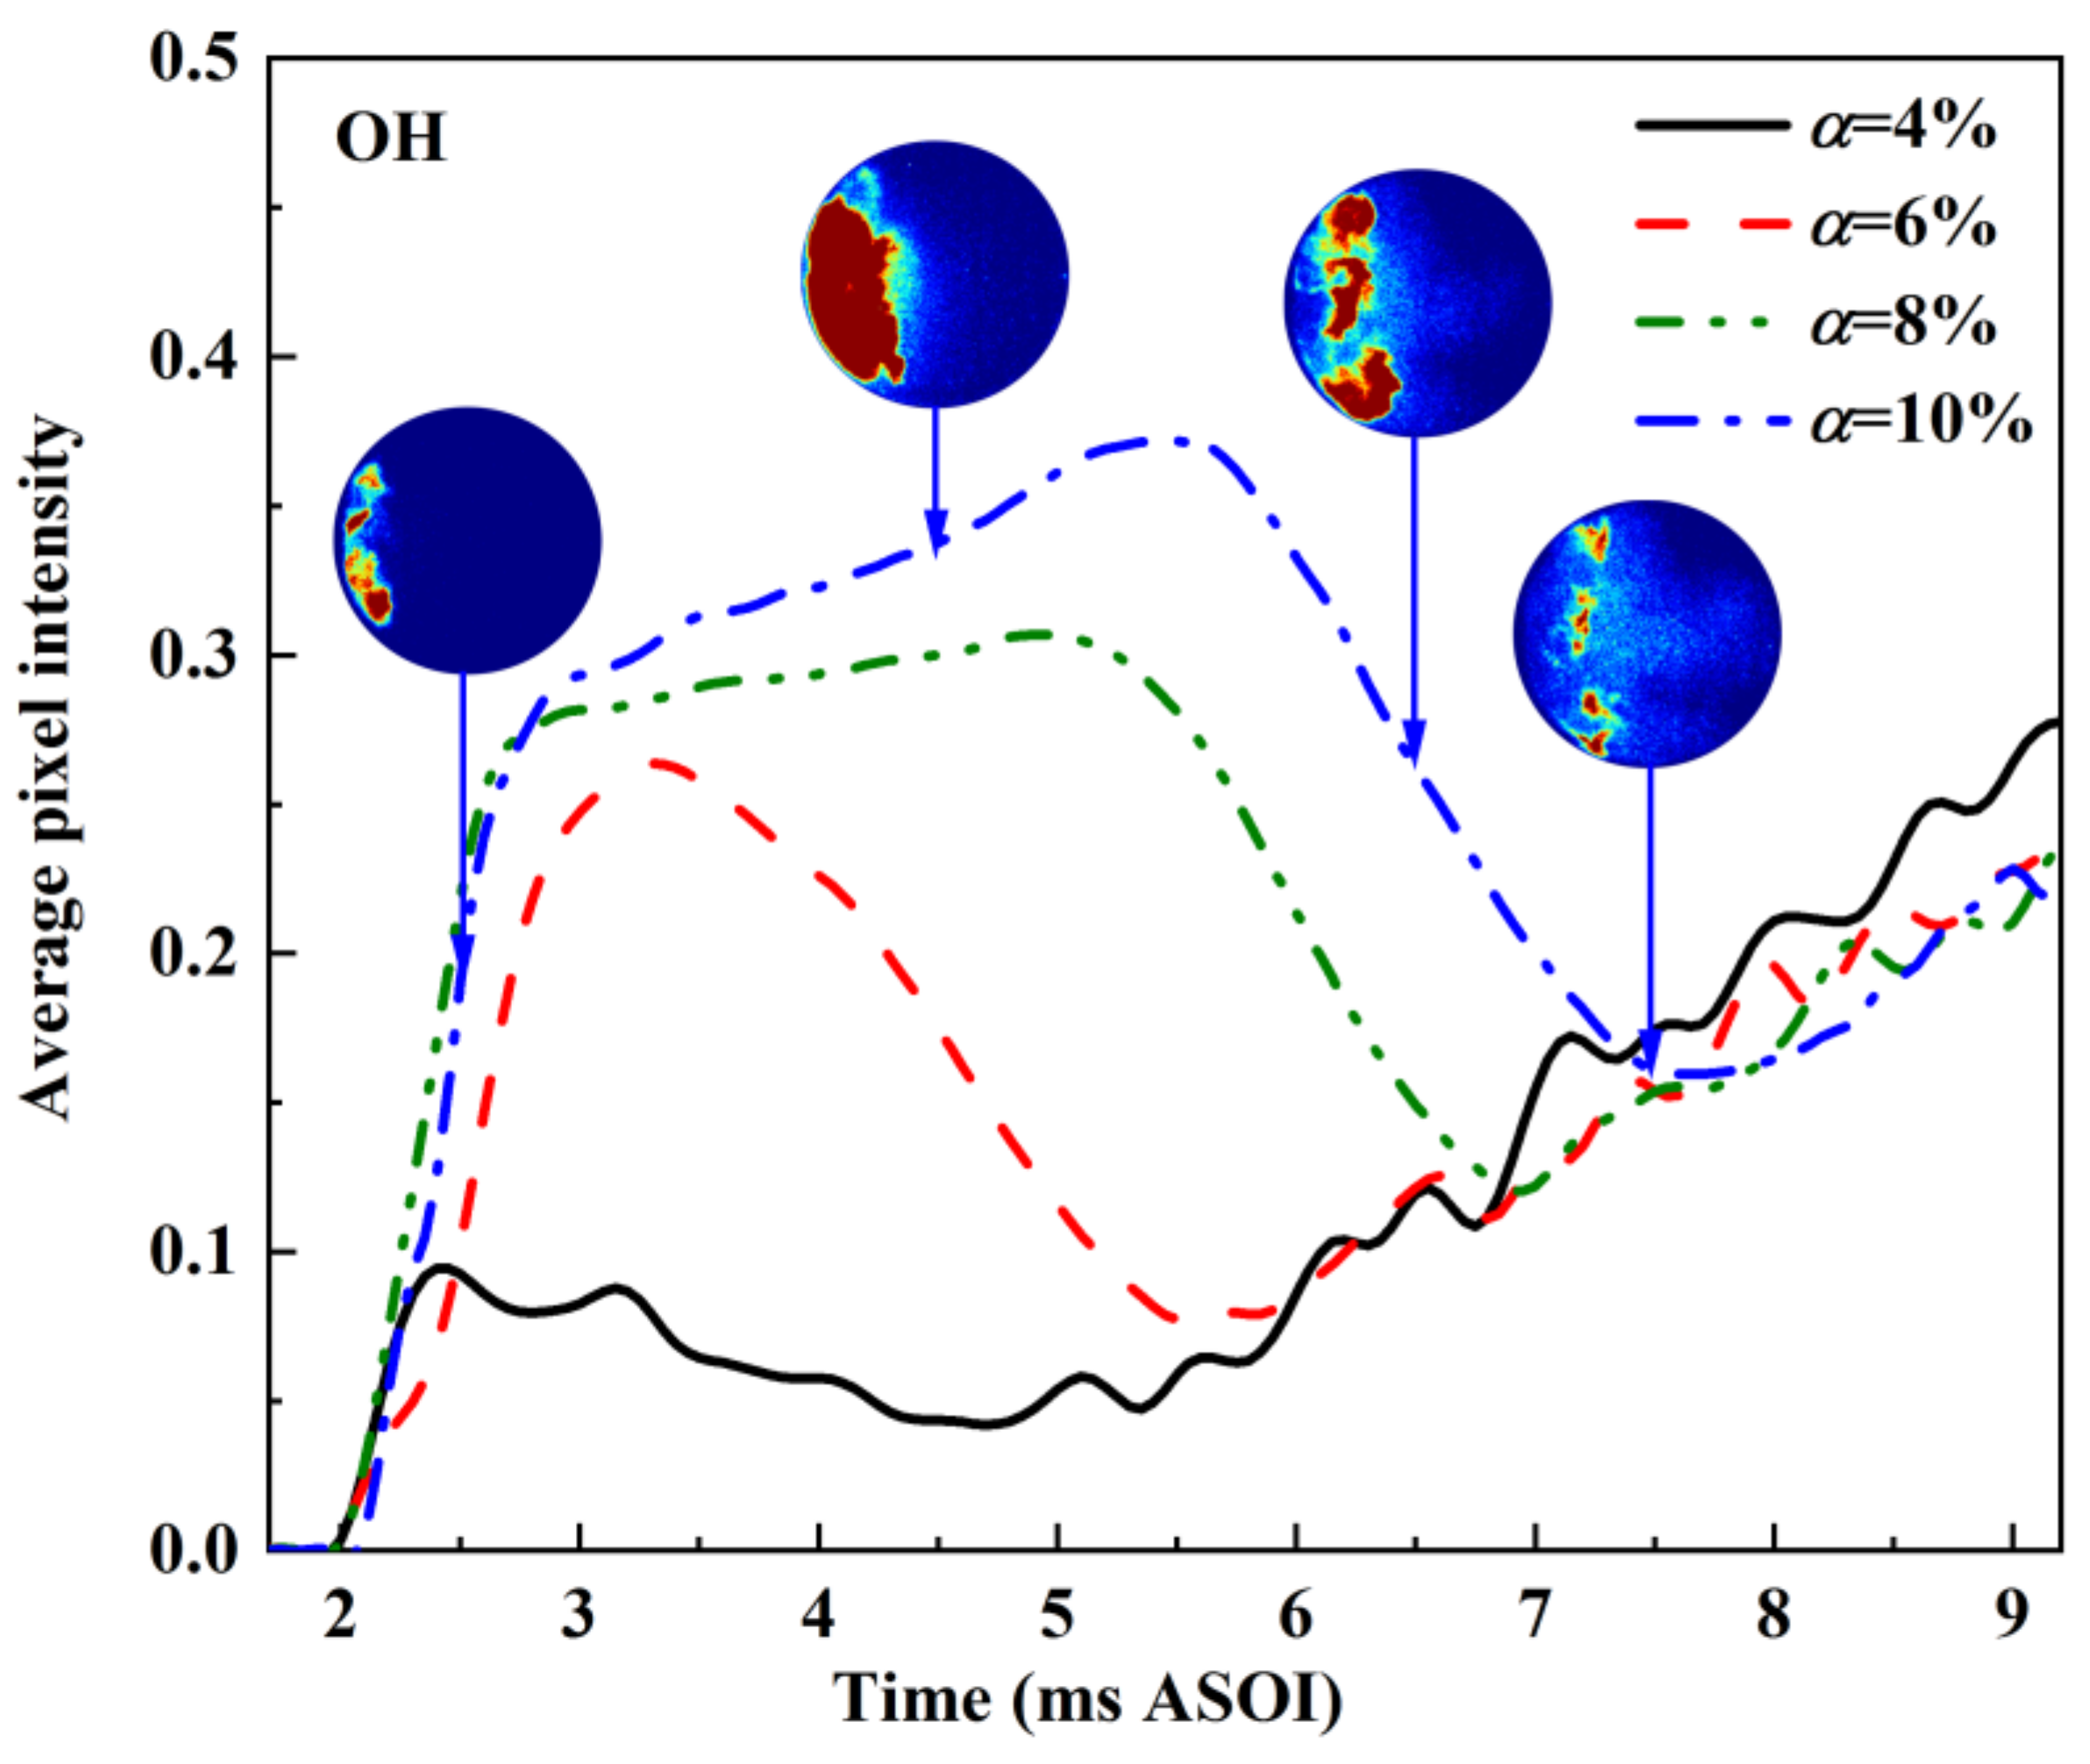
Figure 14 displays the curves of the average pixel intensity in the OH generation regions under different injection masses of pilot diesel. It can be observed from Figure 14 that at the conditions of α = 4% and α = 6%, the pixel intensity curves have the same development trend as discussed regarding Figure 8. And the first peak of the curve of α = 4% is the lowest among the four conditions due to its tiniest diesel mass. When the diesel injection mass increases to 8% and 10%, the curves present a four-stage development pattern, that is, rapid rise, slower rise, fall, and rise again. The curves have one more stage of slower rise under the conditions of large pilot diesel mass. This is because the high concentration of OH produced by large masses of pilot diesel has not been consumed and continues to be generated, while methane has started to burn and propagate outwardly. The methane has a lower reactivity and a thinner fuel concentration compared to the pilot diesel, therefore its OH chemiluminescence intensity may be weaker. The OH generated in the methane flame area reduces the average pixel intensity in the entire OH generation region. As a result, the rise rate of the curve slows down. Subsequently, the OH intensity curves fall due to the consumption of the high density of OH generated by the combustion of diesel. After a while, the curve rises again. As discussed above, the amount of OH generated is larger, and needs a longer time to be consumed under greater diesel mass conditions. Therefore, the curve starts to rise again more slowly with the increase in the injection mass of pilot energy.

Figure 14.
Average pixel intensities of OH under different injection masses of pilot diesel.
3.2.3. Combustion Characteristics
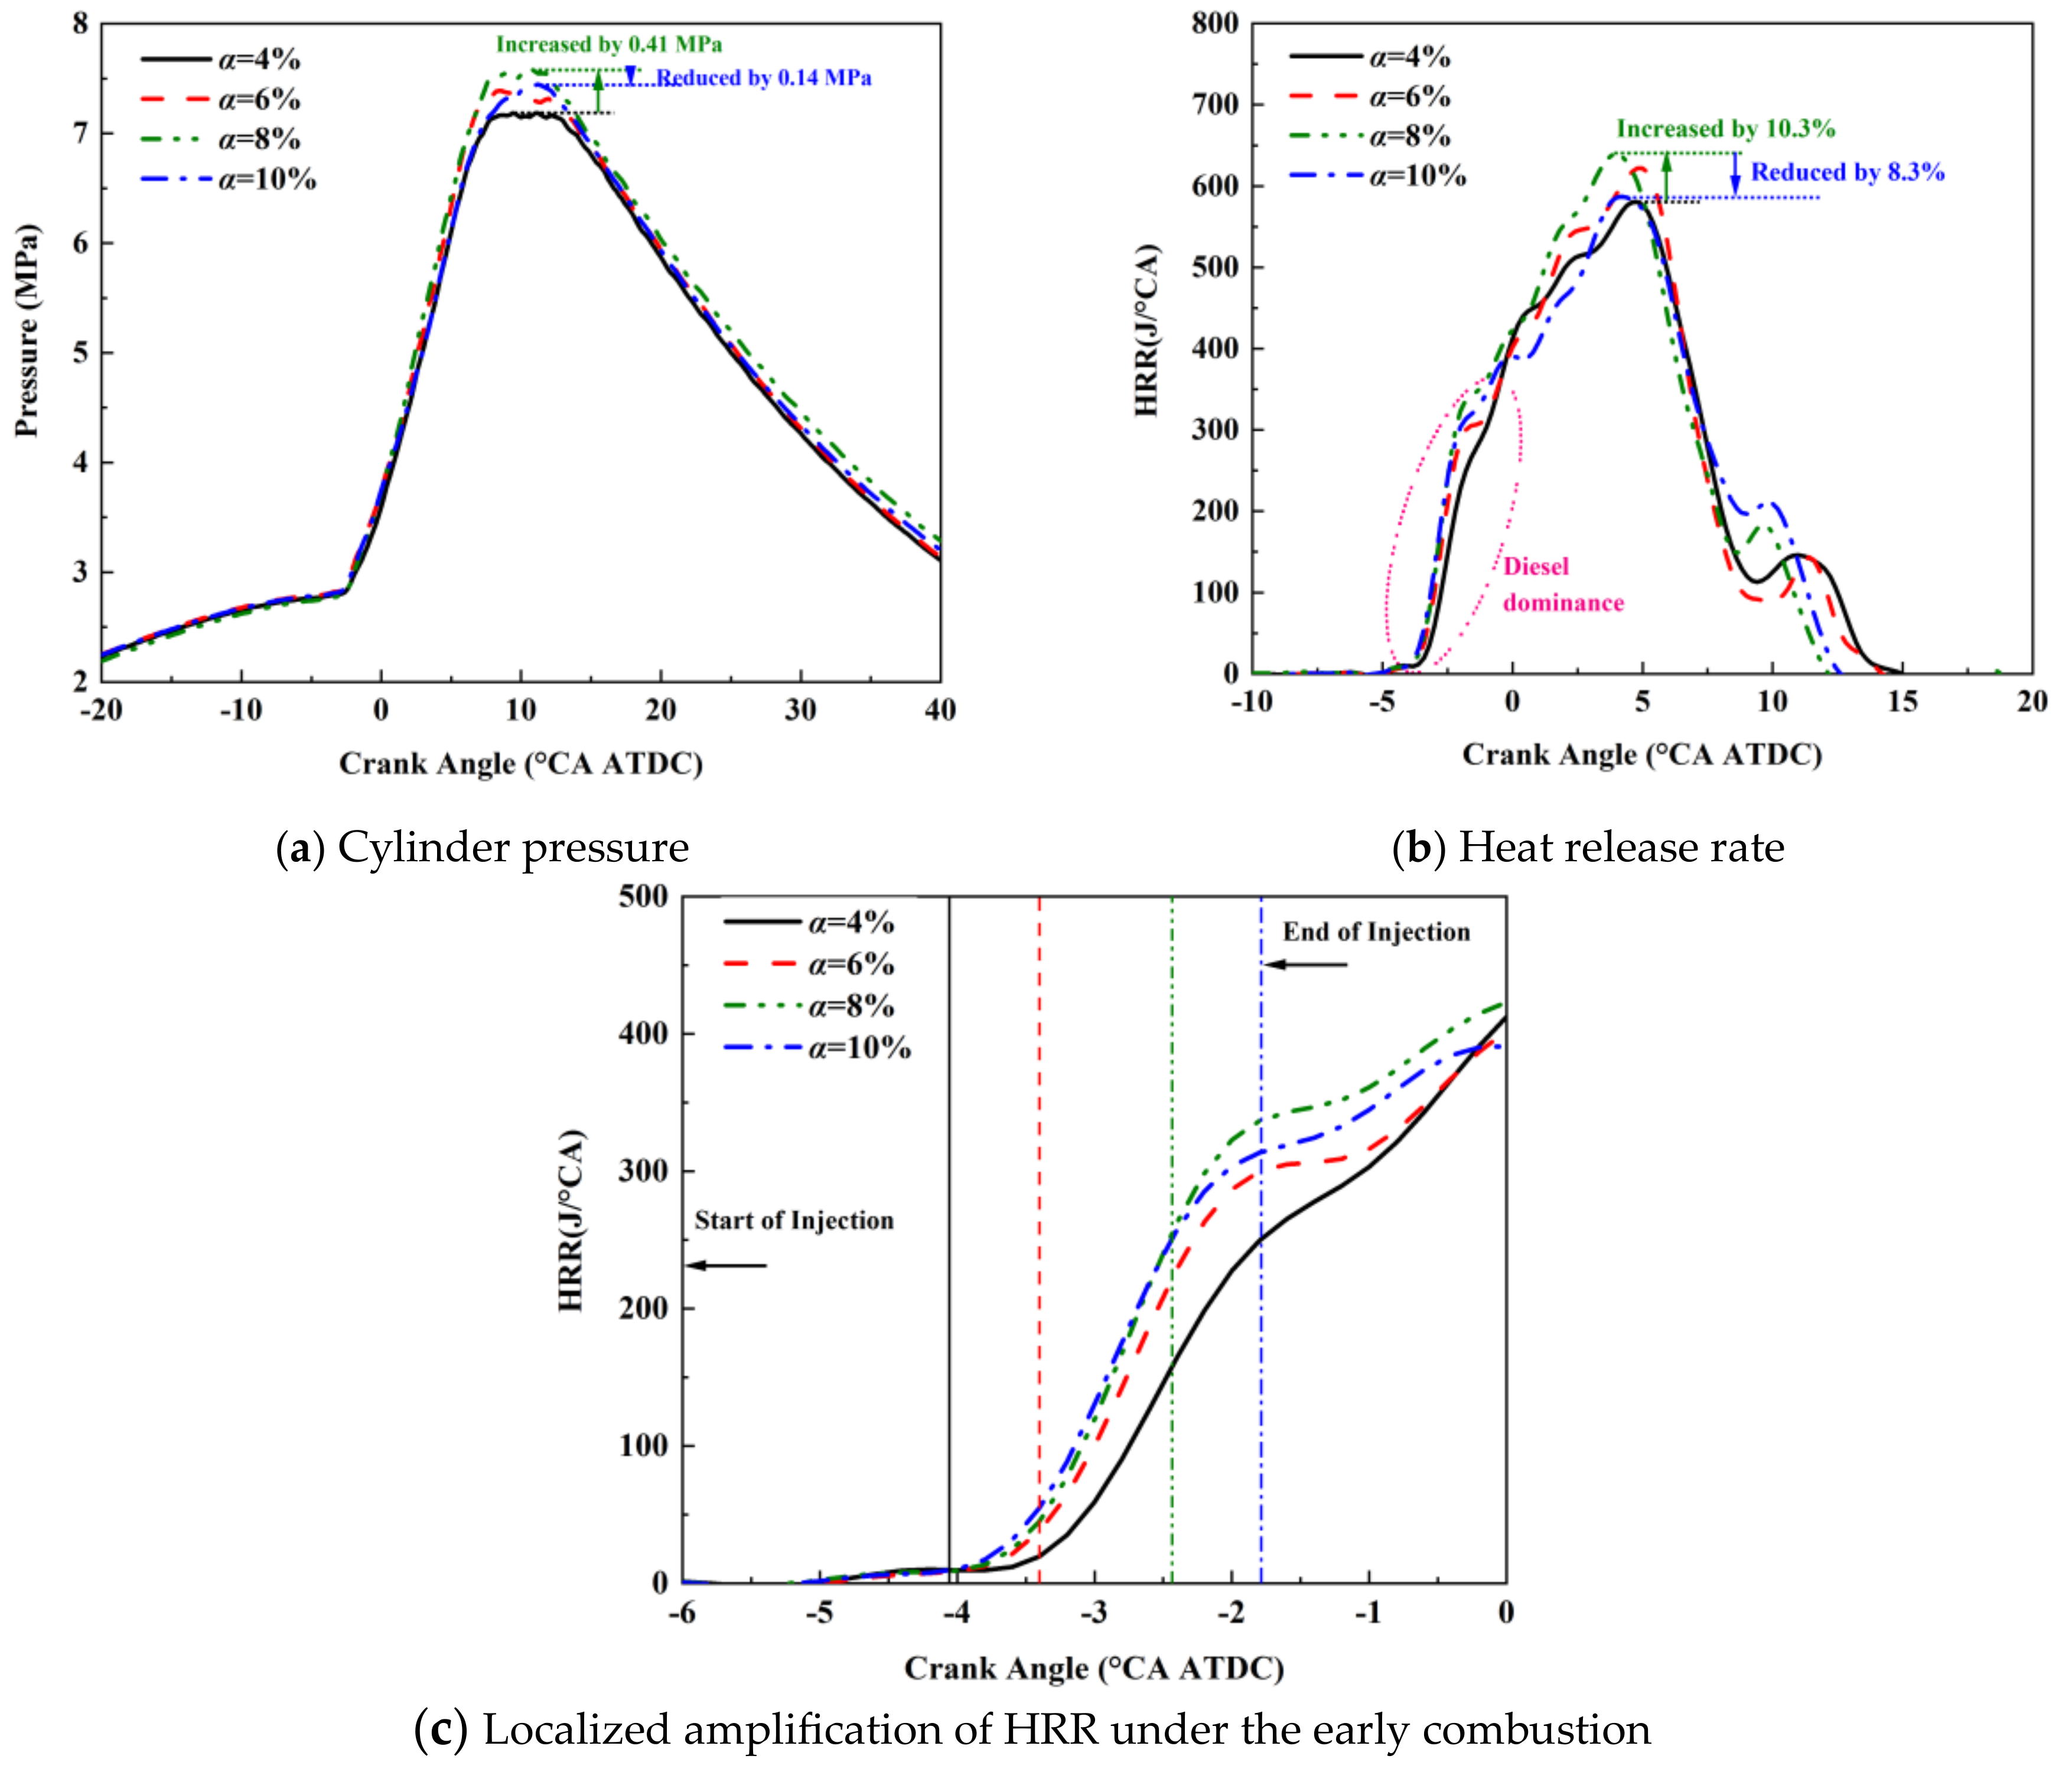
Figure 15 shows the cylinder pressures and heat release rates under different injection masses of pilot diesel.
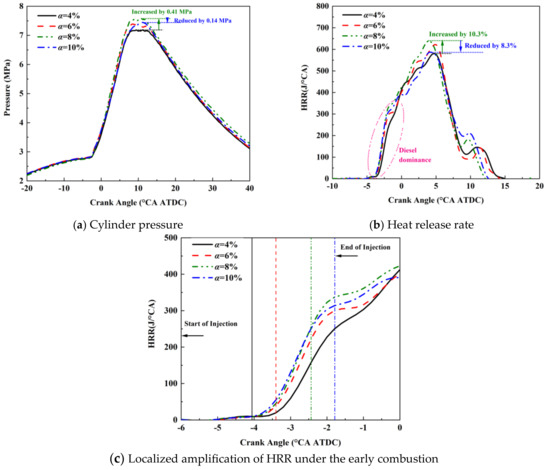
Figure 15.
Combustion characteristics at different injection masses of pilot diesel.
From Figure 15b,c, it can be observed that within the diesel-dominant region, a higher injection mass of diesel leads to a higher HRR. However, it is worth noting that there is a significant change in this trend when entering the methane-combustion-dominant region. From Figure 15a, it can be seen that as the injection mass of diesel increases from 4% to 8%, pmax gradually increases. Specifically, at an 8% injection mass, pmax increases by 0.41 MPa compared to the 4% condition. However, when the injection mass is increased to 10%, pmax decreases by 0.14 MPa compared to the 8% condition. The same phenomenon can be observed from the heat release rate curve in Figure 15b. The HRRmax at an 8% injection mass is 10.3% higher than that at 4%, while the HRRmax at a 10% injection mass is 8.3% lower than that at 8%. A similar phenomenon can be found in Sun’s study of engine performance tests [46]. Increasing the pilot diesel mass can improve the heat release rate of the first stage, but under some conditions, the heat release rate of the second stage decreases. These observations indicate that there is a limit to increasing the injection mass of pilot diesel, and beyond a certain point, it can actually decrease combustion performance. The main reason for this is that when the diesel mass is too high, the excessively prolonged injection duration makes the flame concentrate downstream from the diesel injection direction and limit backwards flame propagation.
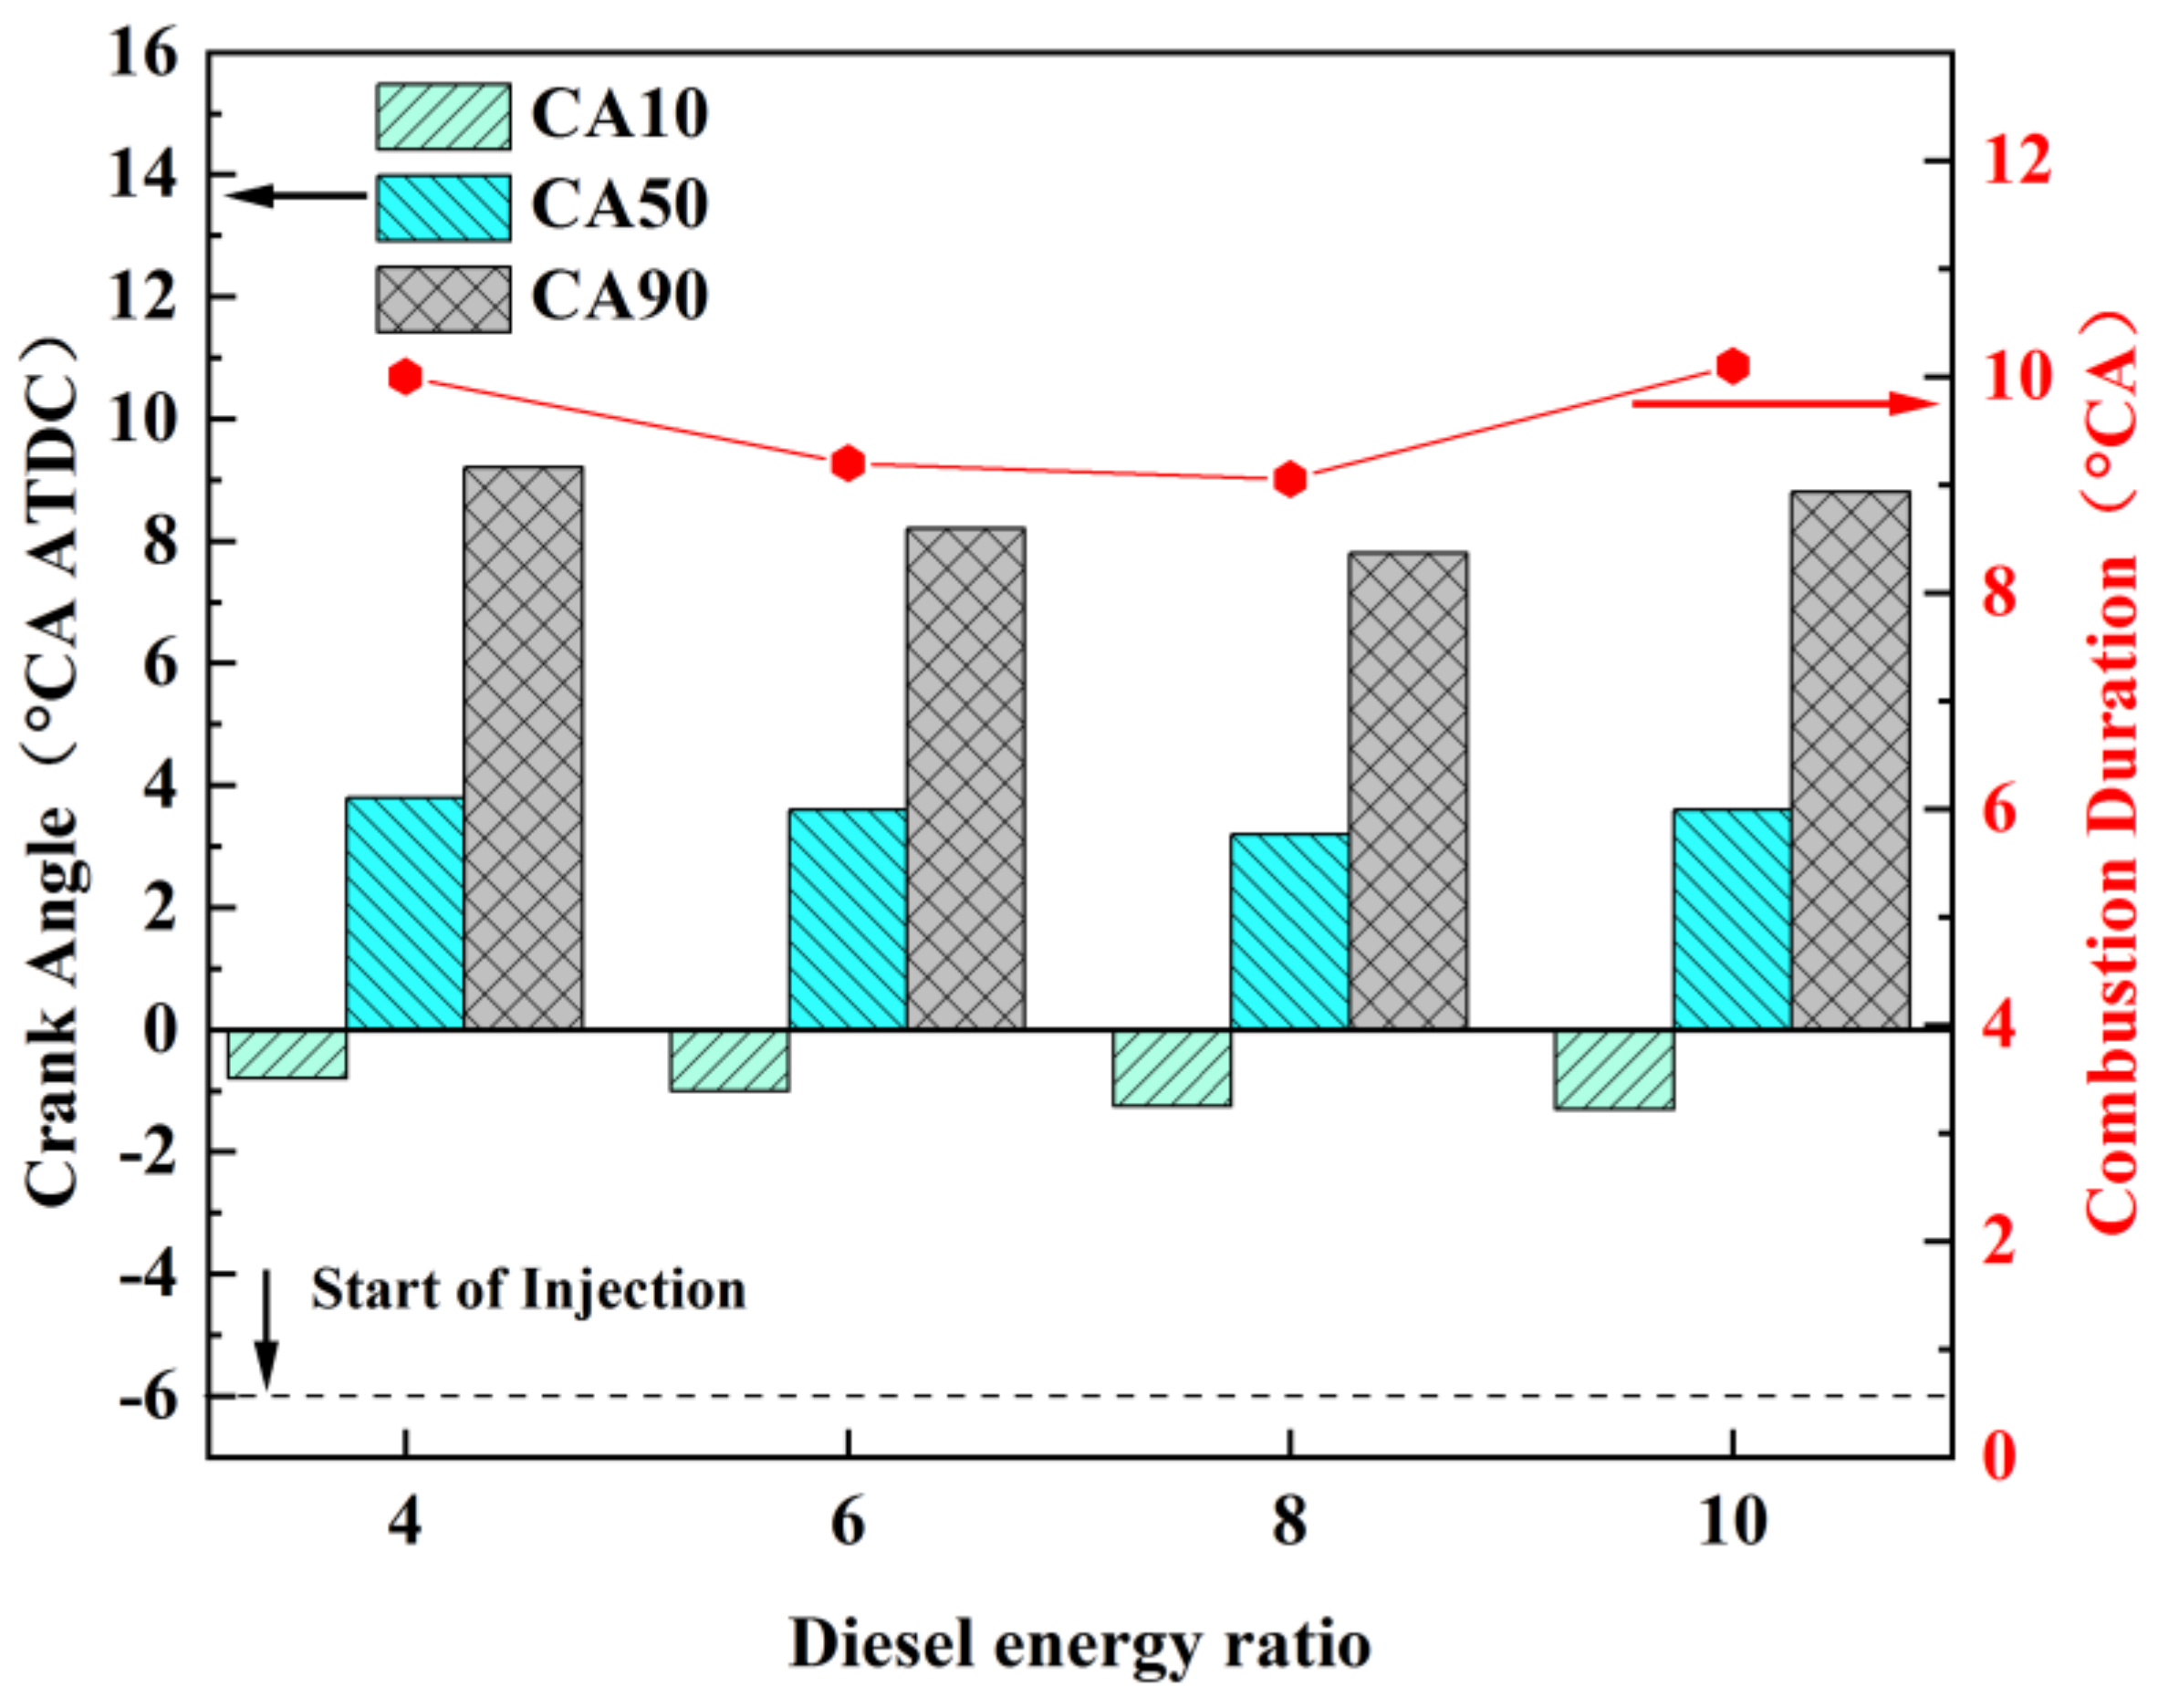
Figure 16 illustrates the combustion phasing under different injection masses of pilot diesel. It can be observed that when the injection mass of diesel increases from 4% to 8%, both CA50 and CA90 advance gradually, and the combustion duration shortens. This indicates that increasing the injection mass of pilot diesel within this range can increase the combustion rate and improve the isochoric combustion of the engine, which is beneficial for enhancing performance. However, after the injection mass of pilot diesel increases to 10%, CA50, CA90, and the combustion duration show a clear increasing trend. In particular, the combustion duration is almost consistent with that at the 4% injection mass. This suggests that an excessively high injection mass of pilot diesel is not conducive to improving isochoric combustion, and may worsen engine performance. These conclusions are of great significance in guiding the selection of injection parameters for pilot diesel in practical engine development.
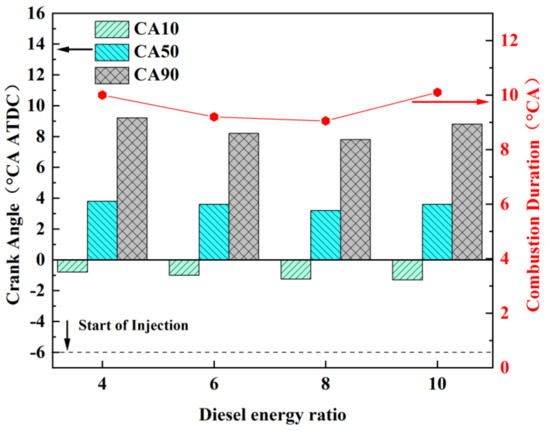
Figure 16.
Combustion phasing and durations under different injection masses of pilot diesel.
4. Conclusions
In order to gain a deeper understanding of the combustion process of diesel ignition premixed natural gas, this study innovatively and comprehensively applied the methods of natural luminescence, chemiluminescence, and cylinder pressure, as well as heat release rate analysis methods, based on a horizontal engine converted into a rapid compression expansion machine with in-cylinder direct injection of diesel to ignite premixed natural gas. These methods successfully analyzed the impacts of the methane equivalence ratio and injection mass of pilot diesel on flame development, OH radical generation, and combustion performance during the combustion process. The following conclusions were reached:
- (1)
- During the early diesel dominance combustion stage, increasing the methane equivalence ratio inhibits the combustion of diesel, resulting in a longer ignition delay period and a decline in flame propagation. However, in the premixed combustion stage of methane, flame propagation is enhanced by increasing the methane equivalence ratio.
- (2)
- The evolution of OH during the dual-fuel combustion process presents characteristic segmented growth. A lower methane equivalence ratio leads to an earlier generation of OH radicals but a lower average intensity in the premixed combustion stage.
- (3)
- With the increase in the methane equivalence ratio, the pmax and HRRmax are both promoted, especially the HRRmax. Although the CA10 is delayed, the overall combustion duration is shortened by the increase in the methane equivalence ratio.
- (4)
- Increasing the diesel injection mass results in a larger flame area and greater OH generation intensity in the ignition region. However, a prolonged injection duration may impede the propagation of the methane flame along the direction to the diesel nozzle.
- (5)
- The pmax and HRRmax increase when the injection mass of pilot diesel increases from 4% to 6%, and then to 8%. However, when it increases from 8% to 10%, the pmax and HRRmax both decrease, and the combustion duration is also prolonged. An appropriate increase in the mass of pilot diesel fuel can promote the overall combustion performance, but too much may be counterproductive.
Author Contributions
J.T., formal analysis, methodology, writing—review and editing; Z.C., writing—original draft preparation, formal analysis, methodology; G.X., writing—original draft preparation, data curation, funding acquisition; Y.W., project administration, writing—review and editing; S.Y., resources, project administration; D.S., investigation, visualization. All authors have read and agreed to the published version of the manuscript.
Funding
This research was supported by the National Natural Science Foundation of China (Grant No: 52071064), the National Key R&D Program of China (Grant No: 2022YFB4300700), and the National Key Laboratory of Marine Engine Science and Technology, Shanghai201108, China (Grant No: LAB-2023-09-WD).
Data Availability Statement
The data presented in this study are available upon request from the corresponding author.
Conflicts of Interest
The authors declare no conflict of interest.
Abbreviations
| RCEM | Rapid compression and expansion machine |
| TDC | Top dead center |
| BDC | Bottom dead center |
| FPS | Frames per second |
| BP | Band pass |
| pC | Picometer Coulomb |
| NL | Natural luminescence |
| CL | Chemiluminescence |
| Φ | Pre-mixed gas fuel–air equivalence ratio |
| A | Energy ratio of diesel to methane |
| Ɵ | Orifice axis angle |
| ASOI | After start of injection |
| V | Cylinder volume |
| γ | Adiabatic coefficient |
| p | Cylinder pressure |
| φ | Crank Angle |
| HRR | Heat release rate |
| CA10/50/90 | The crankshaft angle when the cumulative released heat reaches 10%/50%/90% of the maximum heat release |
| OH | Hydroxyl radical |
References
- Zarrinkolah, M.T.; Hosseini, V. Methane slip reduction of conventional dual-fuel natural gas diesel engine using direct fuel injection management and alternative combustion modes. Fuel 2023, 331, 125775. [Google Scholar] [CrossRef]
- Kumar, S.; Goga, G. Emission characteristics & performance analysis of a diesel engine fuelled with various alternative fuels—A review. Mater. Today Proc. 2023. [Google Scholar] [CrossRef]
- Zhang, Q.; Wang, X.; Song, G.; Li, M. Performance and emissions of a pilot ignited direct injection natural gas engine operating at slightly premixed combustion mode. Fuel Process. Technol. 2022, 227, 107128. [Google Scholar] [CrossRef]
- Li, M.; Wu, H.; Liu, X.; Wei, Z.; Li, Z. Numerical investigations on pilot ignited high pressure direct injection natural gas engines: A review. Renew. Sustain. Energy Rev. 2021, 150, 111390. [Google Scholar] [CrossRef]
- Fang, Z.; Dong, X.; Tang, X.; Lv, Z.; Qiao, X.; Wang, L.; Yu, X. Study on supercritical CO2 power cycles for natural gas engine energy cascade utilization. Appl. Therm. Eng. 2023, 225, 120255. [Google Scholar] [CrossRef]
- Li, M.; Li, C.; Wei, Z.; Zhang, Q.; Rao, Z. Numerical study on the combustion and emission characteristics of a direct injection natural gas engine ignited by diesel/n-butanol blends. Appl. Therm. Eng. 2023, 226, 120333. [Google Scholar] [CrossRef]
- Luo, K.; Huang, Y.; Li, Y.; Tao, Y.; Hu, Z. Effects of high pressure and high-low pressure EGR strategies on the knock tendency, combustion, and performance of a stoichiometric operation natural gas engine. Fuel 2023, 348, 128530. [Google Scholar] [CrossRef]
- Lu, Z.; Ma, M.; Wang, T.; Lu, T.; Wang, H.; Feng, Y.; Shi, L. Numerical research of the in-cylinder natural gas stratification in a natural gas-diesel dual-fuel marine engine. Fuel 2023, 337, 126861. [Google Scholar] [CrossRef]
- Sun, X.; Liu, H.; Duan, X.; Guo, H.; Li, Y.; Qiao, J.; Liu, J. Effect of hydrogen enrichment on the flame propagation, emissions formation and energy balance of the natural gas spark ignition engine. Fuel 2022, 307, 121843. [Google Scholar] [CrossRef]
- Binyang, W.; Puze, Y.; Yinmi, L.; Zhi, J. Effects and mechanism of pilot diesel injection strategies on combustion and emissions of natural gas engine. Proc. Inst. Mech. Eng. Part D J. Automob. Eng. 2023, 2023, 09544070221145738. [Google Scholar] [CrossRef]
- Chen, X.; Zeng, W.; Zheng, W.; Hu, E.; Ma, H. Experimental and kinetic modeling study on the oxidation and laminar combustion characteristics of natural gas. Fuel 2023, 344, 128019. [Google Scholar] [CrossRef]
- Hall, C.; Kassa, M. Advances in combustion control for natural gas–diesel dual fuel compression ignition engines in automotive applications: A review. Renew. Sustain. Energy Rev. 2021, 148, 111291. [Google Scholar] [CrossRef]
- Li, Y.; Yang, F.; Linxun, X.; Liu, J.; Wang, J.; Duan, X. Influences of the control parameters and spark plug configurations on the performance of a natural gas spark-ignition engine. Fuel 2022, 324, 124728. [Google Scholar] [CrossRef]
- Pan, K.; Wallace, J.S. A low temperature natural gas reaction mechanism for compression ignition engine application. Combust. Flame 2019, 202, 334–346. [Google Scholar] [CrossRef]
- Gharehghani, A.; Salahi, M.M.; Andwari, A.M.; Mikulski, M.; Könnö, J. Reactivity enhancement of natural gas/diesel RCCI engine by adding ozone species. Energy 2023, 274, 127341. [Google Scholar] [CrossRef]
- Wang, Z.; Fu, X.; Wang, D.; Xu, Y.; Du, G.; You, J. A multilevel study on the influence of natural gas substitution rate on combustion mode and cyclic variation in a diesel/natural gas dual fuel engine. Fuel 2021, 294, 120499. [Google Scholar] [CrossRef]
- Chen, W.; Pan, J.; Liu, Y.; Fan, B.; Liu, H.; Otchere, P. Numerical investigation of direct injection stratified charge combustion in a natural gas-diesel rotary engine. Appl. Energy 2019, 233, 453–467. [Google Scholar] [CrossRef]
- Wang, Z.; Zhang, F.; Xia, Y.; Wang, D.; Xu, Y.; Du, G. Combustion phase of a diesel/natural gas dual fuel engine under various pilot diesel injection timings. Fuel 2021, 289, 119869. [Google Scholar] [CrossRef]
- Cong, Y.; Gan, H.; Wang, H. Parameter investigation of the pilot fuel post-injection strategy on performance and emissions characteristics of a large marine two-stroke natural gas-diesel dual-fuel engine. Fuel 2022, 323, 124404. [Google Scholar] [CrossRef]
- Felayati, F.M.; Cahyono, B.; Bakar, R.A.; Birouk, M. Performance and emissions of natural gas/diesel dual-fuel engine at low load conditions: Effect of natural gas split injection strategy. Fuel 2021, 300, 121012. [Google Scholar] [CrossRef]
- Altinkurt, M.D.; Merts, M.; Tunér, M.; Turkcan, A. Effects of split diesel injection strategies on combustion, knocking, cyclic variations and emissions of a natural gas-diesel dual fuel medium speed engine. Fuel 2023, 347, 128517. [Google Scholar] [CrossRef]
- Park, H.; Shim, E.; Lee, J.; Oh, S.; Kim, C.; Lee, Y.; Kang, K. Comparative evaluation of conventional dual fuel, early pilot, and reactivity-controlled compression ignition modes in a natural gas-diesel dual-fuel engine. Energy 2023, 268, 126769. [Google Scholar] [CrossRef]
- Liu, J.; Liu, Y.; Ji, Q.; Sun, P.; Zhang, X.; Wang, X.; Ma, H. Effects of split injection strategy on combustion stability and GHG emissions characteristics of natural gas/diesel RCCI engine under high load. Energy 2023, 266, 126542. [Google Scholar] [CrossRef]
- Liu, J.; Zhang, X.; Liu, Y.; Sun, P.; Ji, Q.; Wang, X.; Ma, H. Experimental study on in-cylinder combustion and exhaust emissions characteristics of natural gas/diesel dual-fuel engine with single injection and split injection strategies. Process Saf. Environ. Prot. 2023, 172, 225–240. [Google Scholar] [CrossRef]
- Liu, J.; Guo, Q.; Guo, J.; Wang, F. Optimization of a diesel/natural gas dual fuel engine under different diesel substitution ratios. Fuel 2021, 305, 121522. [Google Scholar] [CrossRef]
- Yang, K.; Wang, Z.; Zhang, K.; Wang, D.; Xie, F.; Xu, Y.; Yang, K. Impact of natural gas injection timing on the combustion and emissions performance of a dual-direct-injection diesel/natural gas engine. Energy 2023, 270, 126813. [Google Scholar] [CrossRef]
- Yang, X.; Dong, Q.; Wang, X.; Zhou, T.; Wei, D. An experimental study on the needle valve motion characteristics of high pressure natural gas and diesel co-direct injector. Energy 2023, 265, 126257. [Google Scholar] [CrossRef]
- Oh, S.; Oh, J.; Jang, H.J.; Lee, S.; Lee, S.; Kim, C.; Lee, J. Effects of piston shape and nozzle specifications on part-load operation of natural gas–diesel dual-fuel RCCI engine and its application to high load extension. Fuel 2022, 328, 125361. [Google Scholar] [CrossRef]
- Jagadish, D.; NageswaraRao, A.V.; Kumar, M.S. Engine combustion and emission analysis using optical methods: An overview. Mater. Today Proc. 2023. [Google Scholar] [CrossRef]
- Tian, J.; Cui, Z.; Ren, Z.; Tian, H.; Long, W. Experimental study on jet ignition and combustion processes of natural gas. Fuel 2020, 262, 116467. [Google Scholar] [CrossRef]
- Zhang, X.; Tian, J.; Cui, Z.; Xiong, S.; Yin, S.; Wang, Q.; Long, W. Visualization study on the effects of pre-chamber jet ignition and methane addition on the combustion characteristics of ammonia/air mixtures. Fuel 2023, 338, 127204. [Google Scholar] [CrossRef]
- Kim, W.; Park, C.; Bae, C. Characterization of combustion process and emissions in a natural gas/diesel dual-fuel compression-ignition engine. Fuel 2021, 291, 120043. [Google Scholar] [CrossRef]
- Kim, W.; Park, C.; Bae, C. Combustion Phenomena and Emissions in a Dual-Fuel Optical Engine Fueled with Diesel and Natural Gas. SAE Int. J. Adv. Curr. Pract. Mobil. 2021, 4, 502–513. [Google Scholar] [CrossRef]
- Ahmad, Z.; Kaario, O.; Qiang, C.; Vuorinen, V.; Larmi, M. A parametric investigation of diesel/methane dual-fuel combustion progression/stages in a heavy-duty optical engine. Appl. Energy 2019, 251, 113191. [Google Scholar] [CrossRef]
- Zhu, Z.; Li, Y.; Shi, C. Effect of natural gas energy fractions on combustion performance and emission characteristics in an optical CI engine fueled with natural gas/diesel dual-fuel. Fuel 2022, 307, 121842. [Google Scholar] [CrossRef]
- Dahl, K.R.; Ghandhi, J.; Rothamer, D. Optical Investigation of the Impact of Pilot Ratio Variations on Natural Gas Diesel Dual-Fuel Combustion. SAE Tech. Pap. 2019, 2019-01-1159. [Google Scholar] [CrossRef]
- Di Iorio, S.; Magno, A.; Mancaruso, E.; Vaglieco, B.M. Analysis of the effects of diesel/methane dual fuel combustion on nitrogen oxides and particle formation through optical investigation in a real engine. Fuel Process. Technol. 2017, 159, 200–210. [Google Scholar] [CrossRef]
- Mancaruso, E.; Todino, M.; Vaglieco, B.M. Study on dual fuel combustion in an optical research engine by infrared diagnostics varying methane quantity and engine speed. Appl. Therm. Eng. 2020, 178, 115623. [Google Scholar] [CrossRef]
- Hultqvist, A.; Christensen, M.; Johansson, B.; Franke, A.; Richter, M.; Aldén, M. A study of the homogeneous charge compression ignition combustion process by chemiluminescence imaging. SAE Trans. 1999, 108, 2114–2127. [Google Scholar] [CrossRef]
- Kawahara, N.; Tomita, E.; Kagajyo, H. Homogeneous charge compression ignition combustion with dimethyl ether-Spectrum analysis of chemiluminescence. SAE Trans. 2003, 112, 1214–1221. [Google Scholar] [CrossRef]
- Mehra, R.K.; Duan, H.; Juknelevičius, R.; Ma, F.; Li, J. Progress in hydrogen enriched compressed natural gas (HCNG) internal combustion engines—A comprehensive review. Renew. Sustain. Energy Rev. 2017, 80, 1458–1498. [Google Scholar] [CrossRef]
- Wang, B.; Yao, A.; Yao, C.; Chen, C.; Wang, H. In-depth comparison between pure diesel and diesel methanol dual fuel combustion mode. Appl. Energy 2020, 278, 115664. [Google Scholar] [CrossRef]
- Brunt, M.F.; Rai, H.; Emtage, A.L. The calculation of heat release energy from engine cylinder pressure data. SAE Trans. 1998, 107, 1596–1609. [Google Scholar] [CrossRef]
- Srna, A.; Bolla, M.; Wright, Y.M.; Herrmann, K.; Bombach, R.; Pandurangi, S.S.; Boulouchos, K.; Bruneaux, G. Effect of methane on pilot-fuel auto-ignition in dual-fuel engines. Proc. Combust. Inst. 2019, 37, 4741–4749. [Google Scholar] [CrossRef]
- Schlatter, S.; Schneider, B.; Wright, Y.M.; Boulouchos, K. N-heptane micro pilot assisted methane combustion in a Rapid Compression Expansion Machine. Fuel 2016, 179, 339–352. [Google Scholar] [CrossRef]
- Sun, L.; Liu, Y.; Zeng, K.; Yang, R.; Hang, Z. Combustion performance and stability of a dual-fuel diesel–natural-gas engine. Proc. Inst. Mech. Eng. Part D J. Automob. Eng. 2015, 229, 235–246. [Google Scholar] [CrossRef]


Disclaimer/Publisher’s Note: The statements, opinions and data contained in all publications are solely those of the individual author(s) and contributor(s) and not of MDPI and/or the editor(s). MDPI and/or the editor(s) disclaim responsibility for any injury to people or property resulting from any ideas, methods, instructions or products referred to in the content. |
© 2023 by the authors. Licensee MDPI, Basel, Switzerland. This article is an open access article distributed under the terms and conditions of the Creative Commons Attribution (CC BY) license (https://creativecommons.org/licenses/by/4.0/).