Article

Analyzing Local Shear Rate Distribution in a Dual Coaxial Mixing Bioreactor Handling Herschel–Bulkley Biopolymer Solutions through Computational Fluid Dynamics

by
Forough Sharifi
1,
Ehsan Behzadfar
2 and
Farhad Ein-Mozaffari
1,*
1
Department of Chemical Engineering, Toronto Metropolitan University, 350 Victoria Street, Toronto, ON M5B 2K3, Canada
2
Sustainable Polymers Research Lab, The Creative School, Toronto Metropolitan University, 350 Victoria Street, Toronto, ON M5B 2K3, Canada
*
Author to whom correspondence should be addressed.
Processes 2023, 11(12), 3387; https://doi.org/10.3390/pr11123387
Submission received: 15 November 2023 / Revised: 24 November 2023 / Accepted: 1 December 2023 / Published: 7 December 2023

Abstract

:
For the aeration of highly viscous non-Newtonian fluids, prior studies have demonstrated the improved efficacy of dual coaxial mixing bioreactors fitted with two central impellers and a close clearance anchor. Evaluating the effectiveness of these bioreactors involves considering various mixing characteristics, with a specific emphasis on shear rate distribution. The study of shear rate distribution is critical due to its significant impact on the mixing performance, gas dispersion, and homogeneity in aerated mixing systems comprising shear-thinning fluids. Although yield-pseudoplastic fluids are commonly employed in various industries, there is a research gap when it comes to evaluating shear rate distribution in aerated mixing bioreactors that utilize this fluid type. This study aims to investigate shear rate distribution in an aerated double coaxial bioreactor that handles a 1 wt% xanthan gum solution, known as a Herschel–Bulkley fluid. To achieve this goal, we employed an experimentally validated computational fluid dynamics (CFD) model to assess the effect of different mixing configurations, including down-pumping and co-rotating (Down-Co), up-pumping and co-rotating (Up-Co), down-pumping and counter-rotating (Down-Counter), and up-pumping and counter-rotating (Up-Counter) modes, on the shear rate distribution within the coaxial mixing bioreactor. Our findings revealed that the Up-Co system led to a more uniform local shear distribution and improved mixing performance.

1. Introduction

The majority of biological operations take place in the presence of aerobic microorganisms. The main goal of these processes is to provide sufficient oxygen in liquids for cell growth and the production of desired products, such as metabolites, enzymes, and proteins [1,2]. An inadequate level of oxygen in these processes can lead to impaired cell growth, altered metabolism, the accumulation of toxic compounds, and diminished product yields [3,4]. Therefore, finding an efficient bioreactor design that maintains a sufficient level of oxygen concentration in the fluid is essential, particularly for processes involving highly viscous non-Newtonian fluids. In fact, gas dispersion in bioreactors containing highly viscous non-Newtonian fluids presents challenges such as uneven distribution of gas bubbles, reduced gas–liquid contact area, lower mass transfer coefficient, increasing sensitivity to shear rate, scale-up complexities, fouling risks, and elevated power consumption [5,6].
Stirred bioreactors are superior compared to other aerated systems such as bubble columns and airlift bioreactors due to improved gas hold-up, a higher volumetric mass transfer coefficient, a more homogeneous shear rate distribution within the tank, and a lower possibility of aggregate formation [7,8]. Despite their extensive range of applications in various industries, the effectiveness of aerated mixing bioreactors containing high-viscosity shear-thinning fluids faces challenges due to the uneven distribution of gas and shear forces [9]. Furthermore, due to the non-uniform distribution of shear rate, the stirring of yield-pseudoplastic fluids results in the formation of a thoroughly mixed zone near the impeller, commonly referred to as the “cavern”, with other areas remaining stationary [10,11]. This phenomenon is particularly notable within laminar and transitional flow regimes [12]. To address these issues, several studies demonstrated that intensifying operational conditions such as the impeller rotational speed and the aeration rate could positively influence mixing performance and offset the rise in broth viscosity [5,13]. In contrast, Jamshidzadeh et al. [14] reported instances of flooding and poor mixing patterns arising from higher aeration rates. Additionally, preventing the formation of high shear zones is crucial to avoid morphological damage to shear-sensitive microorganisms, especially in the case of plant or animal cells lacking protective cell walls [15].
In recent years, coaxial mixers integrating high-speed inner impellers alongside low-speed outer impellers have been introduced to confront the challenge of uneven gas and shear distribution encountered in traditional stirred bioreactors when dealing with highly viscous shear-thinning fluids. Coaxial mixers significantly improve mixing effectiveness by merging the benefits associated with both small-diameter and large-diameter impellers. The primary function of the low-speed outer impeller is to prevent the formation of stagnant zones by mobilizing the bulk fluid and the fluid adjacent to the tank walls [5,16,17]. In contrast, the high-speed inner impellers generate elevated shear rates in the center of the mixing tank, facilitating the breakup of bubbles. Over the past few years, research on the performance of aerated coaxial mixers handling highly viscous non-Newtonian fluids has primarily centered on analyzing gas hold-up, power consumption, and volumetric mass transfer coefficient [18,19,20]. Nevertheless, it is essential to acknowledge the growing significance of evaluating shear rate distribution within these systems. Shear-thinning fluids, characterized by decreasing viscosity as shear rates increase, introduce distinctive flow hydrodynamics when compared to Newtonian fluids, which significantly impact mass and momentum transfer as well as energy dissipation rates near the impeller [21]. Consequently, the focus has shifted towards studying shear rate distribution due to its substantial influence on enhancing gas dispersion efficiency and achieving system homogeneity. For instance, an even shear rate distribution promotes enhanced dispersion of gas bubbles, improved gas–liquid interactions, and uniform product quality. Sossa-Echeverria et al. [22] concluded that the comprehensive analysis of shear rate distribution enables the anticipation of flow patterns, optimization of power consumption, and identification of potential stagnation zones.
Both experimental and numerical methods have been employed to study factors affecting mixing effectiveness. Non-intrusive visualization methods, like particle image velocimetry (PIV), provide valuable insights into flow patterns by measuring tracer particle displacement to capture instantaneous velocity fields and related properties [22,23,24]. However, PIV, an experimental technique, necessitates transparent media for effective implementation [22]. This becomes a significant limitation when dealing with highly viscous non-Newtonian fluids with yield stress, as they are often opaque [25,26,27]. Consequently, conducting a comprehensive experimental investigation of fluid hydrodynamics within mixing systems containing such fluids becomes nearly impossible.
Computational fluid dynamics (CFD) is a powerful tool offering insights into the assessment of flow patterns and mixing characteristics that are often prohibitively expensive or simply unattainable through available experimental techniques [28,29,30]. This method provides comprehensive information regarding shear rates, flow patterns, velocity distributions, energy dissipation rate, power consumption, pumping capacities, and mixing time under various operating conditions [31,32]. Sossa-Echeverria et al. [22] employed computational fluid dynamics to explore the mixing performance of shear-thinning fluids with yield stress in a stirred tank equipped with various axial-flow impellers across laminar to transitional flow regimes. Their findings demonstrated that the spatial distribution was determined using the trajectory of the impeller’s discharge. However, while their CFD model effectively simulated the impact of operating conditions on mixing characteristics, it could not fully capture the flow symmetry observed in the experiments, which was attributed to limitations in the moving reference frame technique. Zang et al. [33] investigated the distribution of local shear rates in a stirred bioreactor containing pseudoplastic fluids near the impeller blade under a transitional flow regime using the CFD approach. They observed that the increase in consistency index and power-law index reduced the high-shear regions below the impeller blades. They showed that the influence of the impeller speed on the average local shear rate surpassed that of the rheological parameters. Furthermore, they showed that, given the complex dynamics of fluid flow in the vicinity of the impeller blade within stirred bioreactors with non-Newtonian fluids, the validated CFD model stands as a dependable approach that offers a comprehensive understanding of the flow phenomenon. This understanding, in turn, holds the potential to provide valuable insights for the optimization and design of stirred bioreactors.
Despite the widespread use of yield-pseudoplastic fluids across various industries, including food, chemical, biochemical, pharmaceutical, cosmetic production, and wastewater treatment plants, scarce information is available in the literature regarding the assessment of shear rate distribution in aerated mixing systems containing this type of media. Despite the recognized advantages of double coaxial stirred bioreactors compared to conventional systems, to the best of our knowledge, no prior study has investigated the distribution of the local shear rate in dual coaxial mixing bioreactors handling pseudoplastic fluids possessing yield stress. Therefore, this study addresses a significant research gap pertaining to the shear rate distribution in aerated coaxial mixing bioreactors that handle shear-thinning fluids with yield stress. The present work evaluates the influence of different mixing configurations, such as up-pumping and co-rotating (Up-Co), down-pumping and co-rotating (Down-Co), up-pumping and counter-rotating (Up-Counter), and down-pumping and counter-rotating (Down-Counter), on shear rate distribution within a double-aerated coaxial mixer containing 1 wt% xanthan gum solution, a pseudoplastic fluid with yield stress, using computational fluid dynamics (CFD). For this purpose, we employed a double coaxial mixing bioreactor with an aspect ratio greater than 1.0. This factor plays a critical role in ensuring the quality and consistency of the final product in the pharmaceutical, food processing, and cosmetics industries. The findings of this study contribute to understanding the behavior of aerated mixing of yield-pseudoplastic fluids and shed light on optimizing stirred bioreactors for improved shear distribution and gas dispersion.

2. Material and Methods
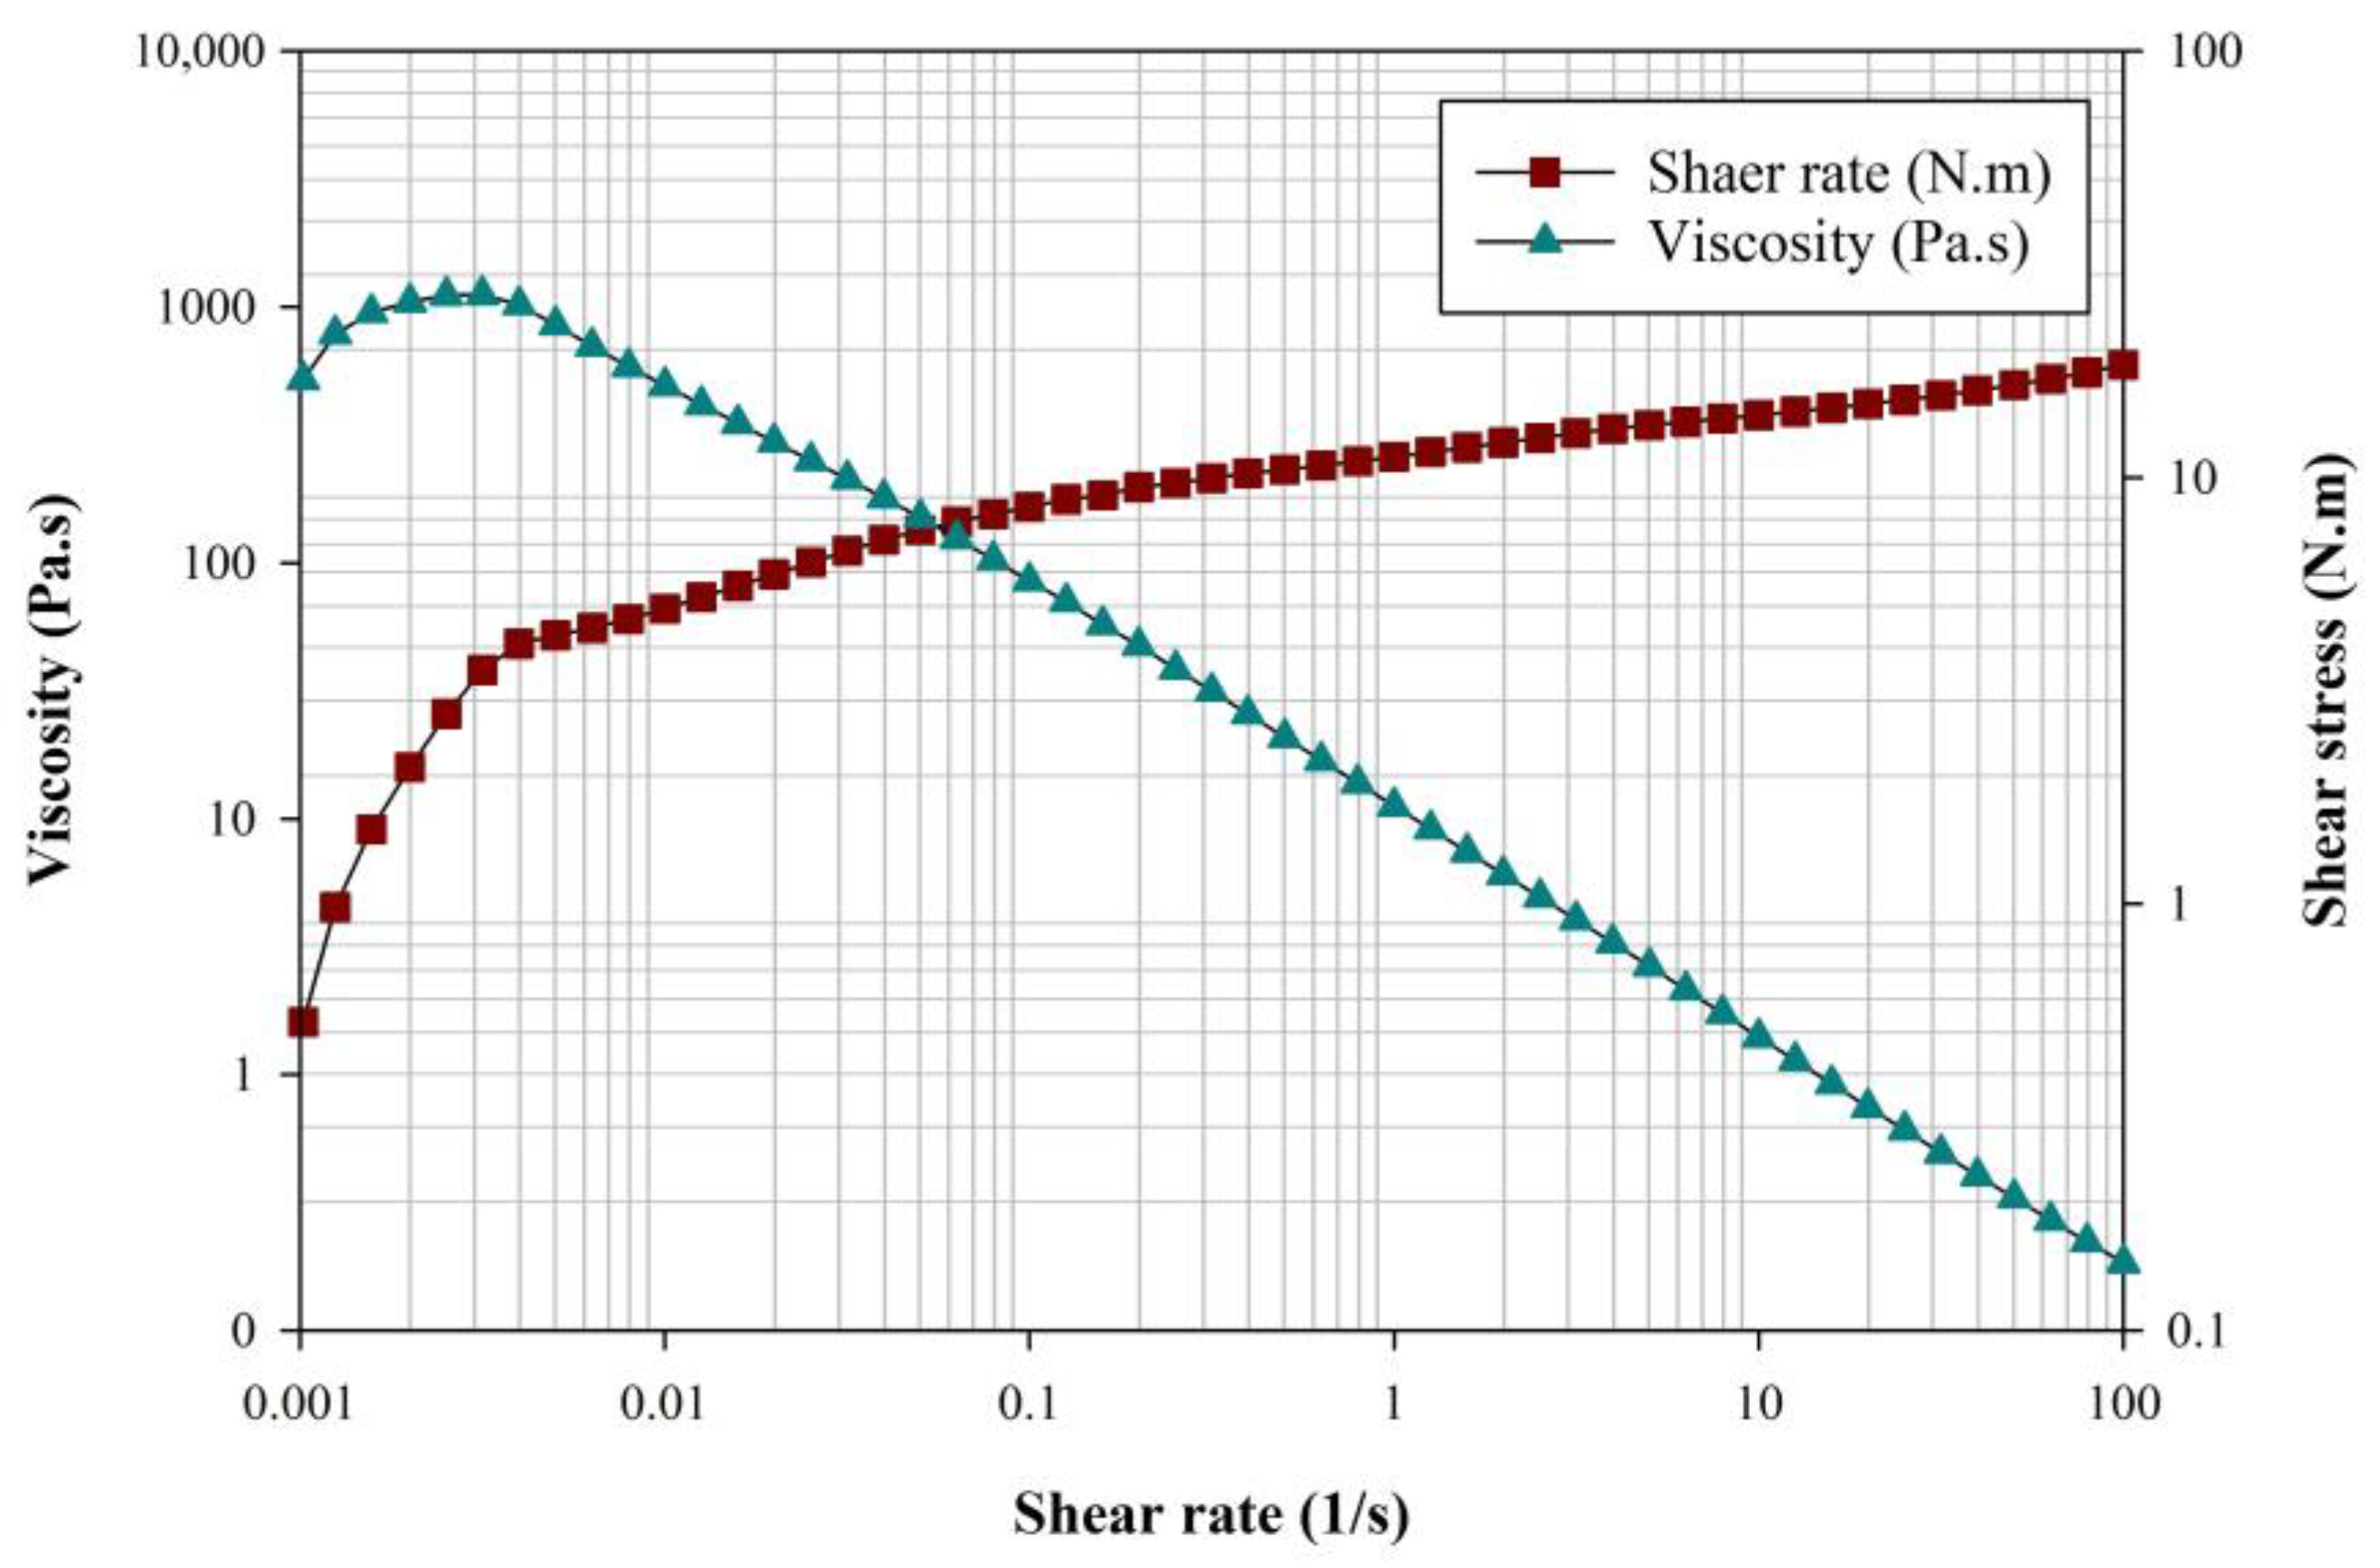
The experimental setup employed in this work consists of a flat-bottom cylindrical coaxial mixing tank with a diameter of 0.40 m, as depicted in Figure 1. The liquid level within the tank was maintained at a height of 0.50 m, resulting in a fluid volume of 0.063 m3 and an aspect ratio of 1.25. The coaxial mixer comprised two shafts: an upper shaft equipped with dual centrally positioned pitched-blade impellers and a lower shaft housing a close-clearance anchor impeller. These shafts were powered with two independent electric motors and regulated through frequency converters. Four distinct mixing configurations, namely Down-Co, Up-Co, Down-Counter, and Up-Counter, were examined in this study. A ring sparger featuring 20 holes was positioned at a clearance of 0.1 m from the tank base for introducing air into the system, and air dispersion within the system was regulated by measuring and controlling the airflow rate using a rotameter and a control valve, respectively.

2.1. Working Liquid

The aqueous solution of xanthan gum with a concentration of 1 wt% was employed as the working fluid. The rheological characteristics were assessed using a Kinexus Pro+ Rheometer (Malvern Instruments, Westborough, MA, USA). The rheological properties were measured using the shear rate table test at a constant temperature of 22 °C, which corresponds to the operating temperature of the experiments. Figure 2 displays the apparent viscosity and shear stress of the working fluid under varying shear rates. The working fluid exhibits shear-thinning behavior with yield stress. The rheological properties are closely aligned with the Herschel–Bulkley model for shear rates ranging from 0.1 to 100 L/s, and the corresponding model parameters are detailed in Table 1.

2.2. Electrical Resistance Tomography (ERT)

In this work, both local and overall gas hold-ups were measured experimentally using the electrical resistance tomography (ERT) approach. For this purpose, the ERT system (Industrial Tomography Systems, model P2+) was used. As shown in Figure 1, the ERT system comprises four planes with 16 stainless steel electrodes on each plane, evenly distributed around the bioreactor tank. The ERT planes were labeled by number, and their heights from the bottom of the tank were: 0.38 m for plane 1, 0.27 m for plane 2, 0.22 m for plane 3, and 0.17 m for plane 4. A current of 5 mA with a frequency of 4800 Hz was applied to neighboring electrodes, and the voltages across consecutive pairs of these electrodes were recorded. This procedure was iterated to ascertain the local fluid conductivity. To mitigate the influence of the impellers, sparger, and shafts on fluid conductivity, 50 reference frames were recorded while the coaxial mixer rotated within a xanthan gum solution before introducing air. Subsequent to air introduction, an additional 50 frames were captured to establish a steady-state condition, and an extra 100 frames were recorded to quantify gas hold-up. It is important to mention that a minimum of 100 frames is essential for generating high-resolution tomography images and precisely assessing gas hold-up in the gas–liquid coaxial mixing bioreactors. Subsequently, the acquired data were sent to a data acquisition (DAQ) system for further processing. The linear back projection method was employed to reconstruct tomograms and analyze variations in the conductivity of the xanthan gum solution after air injection. Finally, the local fluid conductivity values were converted to local gas hold-ups using the Maxwell equation [34]:
ε g = 2 σ l + σ g 2 σ m σ m σ g σ l σ m σ g σ l σ m + 2 ( σ l σ g )
where ε g , σ l , σ g , and σ m represent the conductivity of the liquid, gas, gas–liquid mixture, and gas hold-up. Due to the negligible conductivity of the gas phase, the above equation can be simplified accordingly:
ε g = 2 ( σ l σ m ) 2 σ l + σ m

2.3. Numerical Model
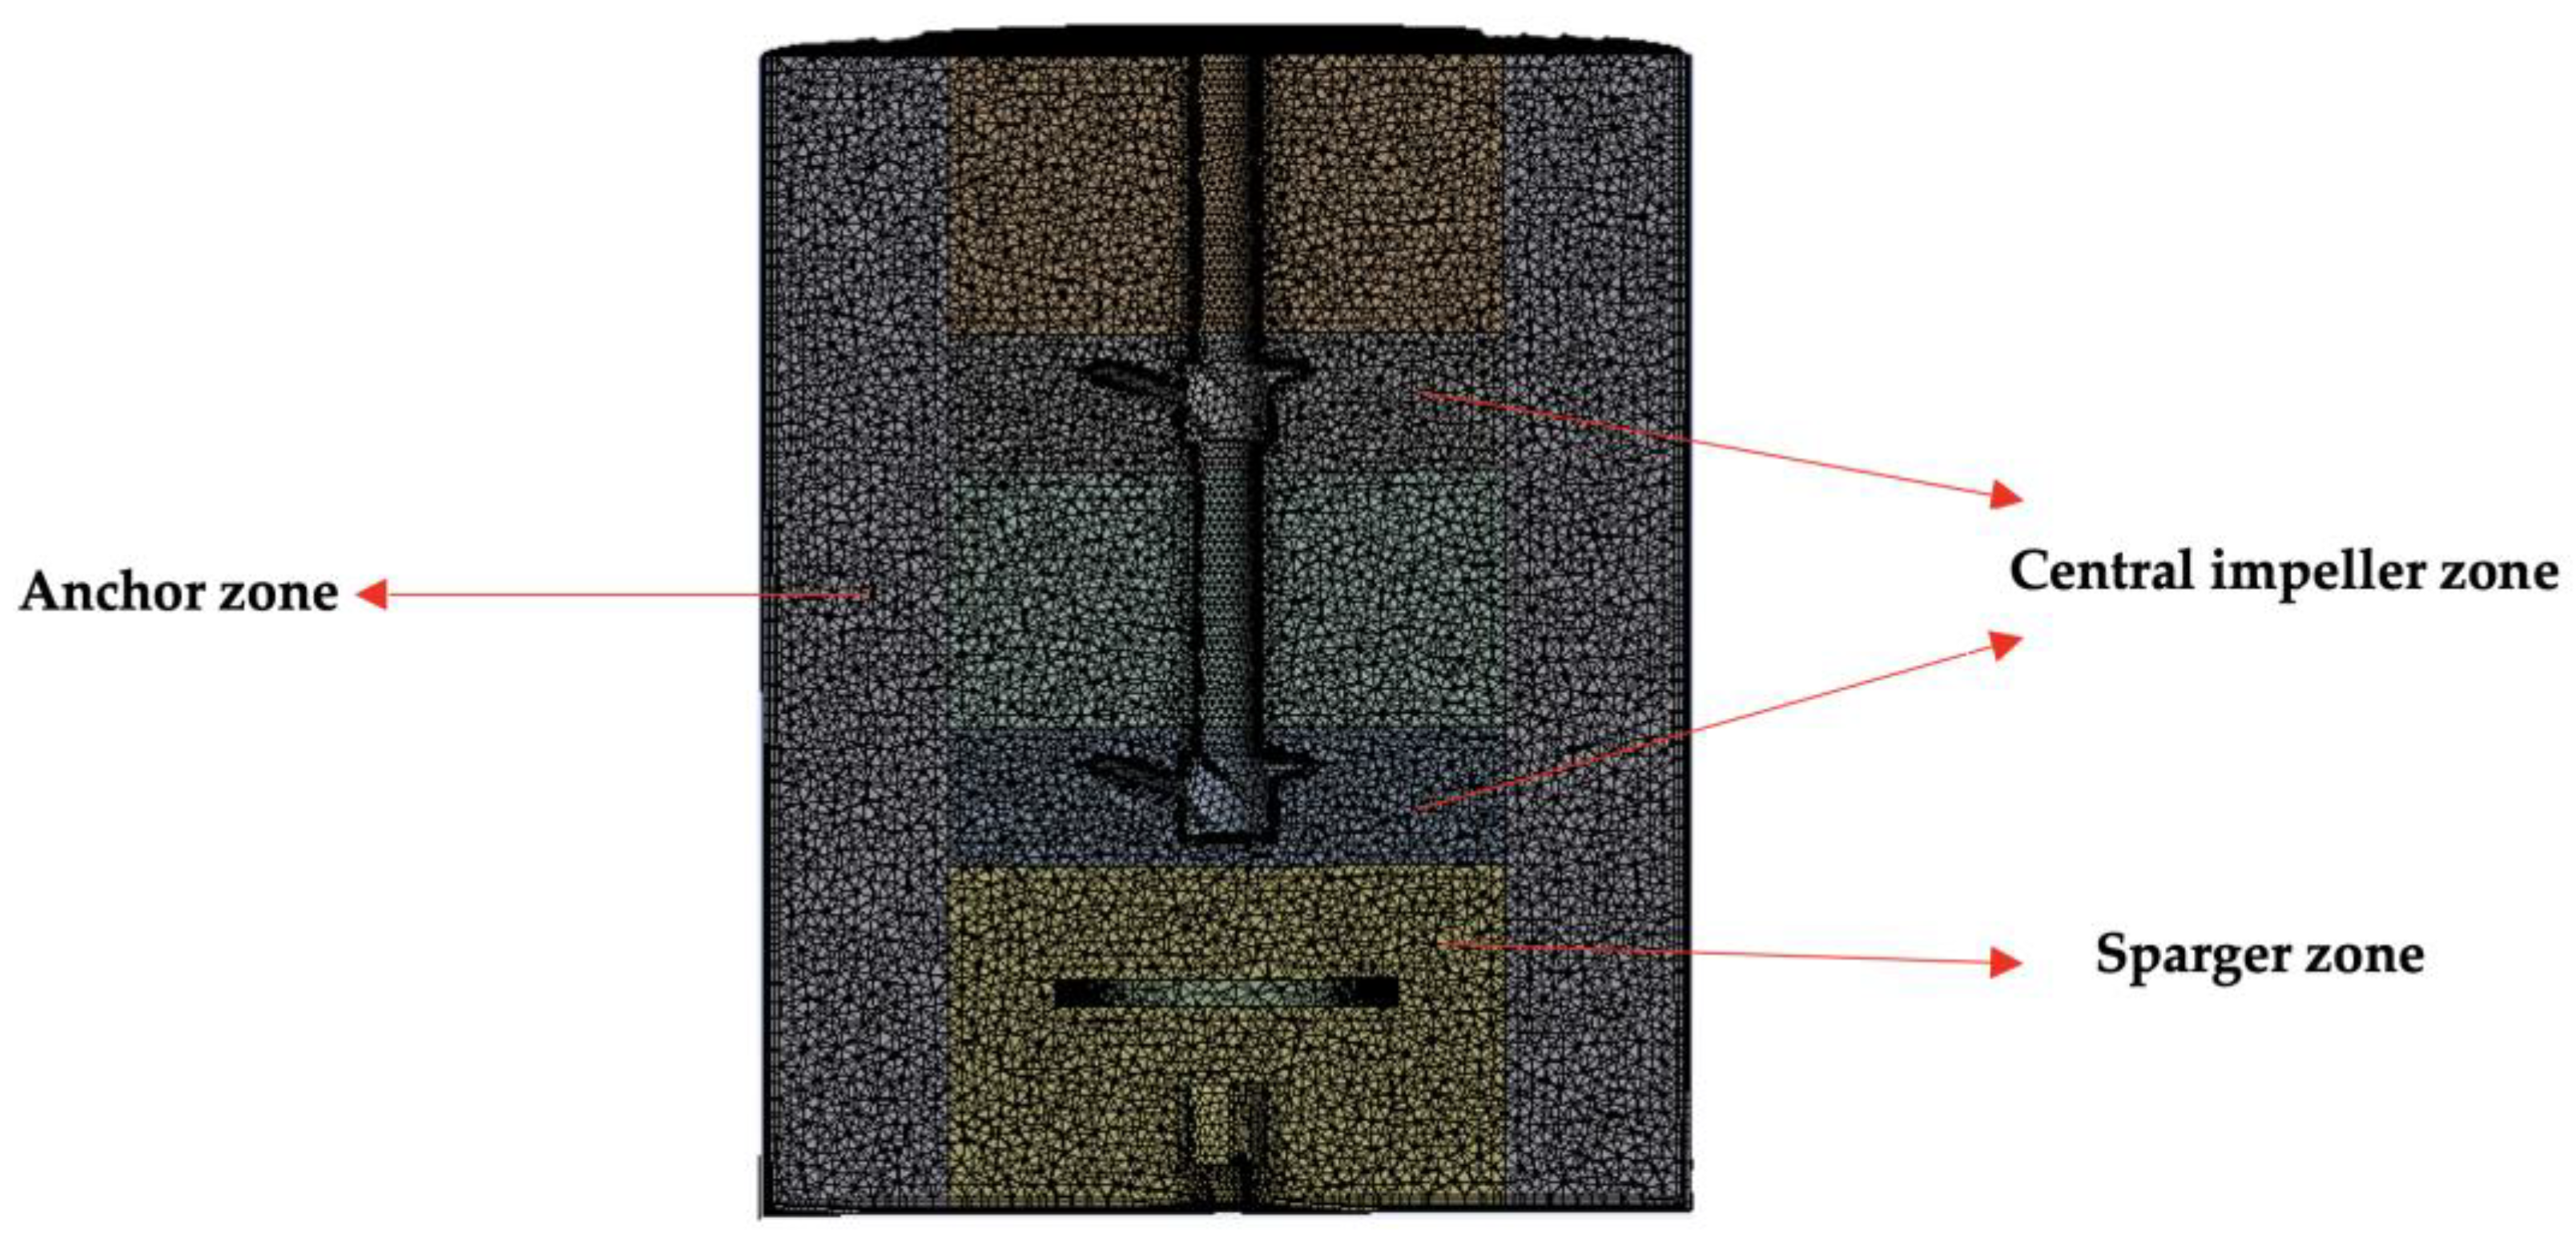
In this study, a fluid Eulerian–Eulerian approach was used to model the gas–liquid multiphase flow within the double coaxial mixing bioreactor. In this approach, both gas and liquid phases are considered interpenetrating continua; however, governing equations are independently solved for each phase [35]. The summation of the volume fractions of both phases is considered as one for all domains (Equation (3). The continuity and momentum equations for each phase are presented in Equation (4) and Equation (5), respectively:
l + g = 1
𝜕 ( ρ i i ) 𝜕 t + · ( ρ i i u i ) = 0
𝜕 ( i ρ i u i ) 𝜕 t + · ( i ρ i u i u i ) = i p + · ( τ = e f f ) + i ρ i g ± F i
In the above equations, ρi, ϕi, ui, and Fi are density, volume fraction, mean velocity, and the interface momentum exchange of phase i, respectively. Reynolds stress tensor, τ = e f f , as a function of time-averaged velocity is defined below [35]:
τ = e f f = i ( μ i + μ T , i ) ( u i + u i T ) + ( λ i 2 3 ( μ i + μ T , i ) . u i I =
where λ i is the bulk viscosity of the phase i and μi and μT,i are the laminar and turbulent viscosity of phase i, respectively.
In our prior research, we have demonstrated the accuracy of the modified Jamshidzadeh’s correlation in reliably predicting the power number and Reynolds number [36]. Therefore, the apparent Reynolds number was estimated using Equation (7):
R e = ρ ( f P c N c + f P a N a ) ( f p c D c + f p a D a ) 2 τ y K s N c + k ( K s N c ) n 1
where
f P c = P c P t
and
f P a = P a P t
where fPc, fPa, and Pt are the central impeller power fraction, the anchor impeller power fraction, and the total gassed power consumption, respectively. Na, Nc, Dc, and Da are anchor speed, central impeller speed, anchor impeller diameter, and central impeller diameter, respectively. The Metzner–Otto constant (Ks) for the pitched blade turbine impeller was considered to be 12 [37]. Using Equation (7) and the rotational speeds of the impellers employed in this study, the range of Reynolds numbers for co-rotating and counter-rotating modes falls within 120 < Re < 2000 and 150 < Re < 2200, respectively. It is worth noting that the fully turbulent regime typically occurs when Re ≥ 10000, while the laminar flow regime prevails when Re ≤ 10 in stirred tanks. Consequently, the current flow regime in this study is transitional.
The interphase force, Fi (Equation (5)), is used to describe the interaction between the gas and liquid phases. In reality, fluid-induced forces such as drag, lift, and virtual mass all have an impact on the velocity of a bubble. However, several studies have demonstrated that the only dominant force is the drag force, making it possible to ignore the impact of other interfacial forces [38,39,40].
Despite various drag models proposed in the literature to calculate the drag force in gas–liquid systems, the Schiller–Naumann drag model stands out for its accuracy in predicting mixing parameters. In addition, as reported in the literature, this model demonstrated the ability to effectively model the drag force for gas dispersion in non-Newtonian fluids under a laminar regime [41].
F d r a g = 3 4 g l ρ l C D d b | u g u l | ( u g u l )

2.4. CFD Model

The 3D CFD modeling of the aerated double coaxial mixing bioreactor was developed using the commercial software ANSYS Fluent 2022 R1. Several studies have reported that assuming laminar flow in the transitional regime is justifiable when mixing shear-thinning fluids with yield stress [10,22]. Therefore, a laminar flow model was used in the simulations. The sliding mesh technique was employed to model the rotation of the impeller, enabling the transient simulation of the flow field. As shown in Figure 3, the fluid domain was discretized using non-uniform and unstructured tetrahedral elements. To assess the independence of the grid size on the simulation results, three distinct mesh configurations were employed in this study, consisting of 974,234, 1,843,861, and 3,642,931 mesh cells, respectively. The investigation of the impact of various mesh sizes on the xanthan gum velocity in the axial direction was carried out through simulations with three different mesh sizes: a coarse grid size (974,234), a medium grid size (1,843,861), and a fine grid size (3,642,931), with the corresponding results depicted in Figure 4. In this figure, the profiles of liquid velocity along the axial direction are depicted for three distinct grid sizes. Based on the data presented in this figure, it can be observed that the results obtained from the medium and fine grids exhibited negligible differences. Consequently, the grid with a size of 1,843,861 was chosen as the optimal mesh.
The governing equations were solved using the finite volume method (FVM), and the pressure–velocity coupling was conducted using the SIMPLE technique. A second-order implicit scheme controlled time advancement, while a second-order upwind scheme discretized the momentum equation. To achieve convergence in each time step, 20 iterations were employed to ensure that the specified convergence tolerance of 10−7 was met for every normalized residual. Furthermore, the convergence of the model was verified by monitoring the dynamic profiles of gas hold-up in the four ERT planes. It was observed that nearly 72 revolutions of the central impeller were required for local gas hold-up profiles to attain a quasi-steady-state condition, indicating successful simulation convergence. To achieve convergence in each simulation, parallel computing with 12 CPUs was employed, with computational times ranging from 180 to 220 h.
The validation of the CFD model was performed by comparing the numerical results with experimental measurements of gassed power consumption and overall gas hold-up. The validation outcomes are displayed in Table 2. It is evident that there is a fairly good agreement between the experimental and CFD results, demonstrating the model’s predictive capability for other mixing characteristics.

3. Results and Discussion

The results obtained from the CFD model were used to compare the mixing characteristics of four mixing configurations, including Down-Co, Up-Co, Down-Counter, and Up-Counter. For this purpose, local shear rate distribution, velocity fields, and dynamic viscosity were evaluated for different mixing configurations at varying rotational speeds of central impellers.

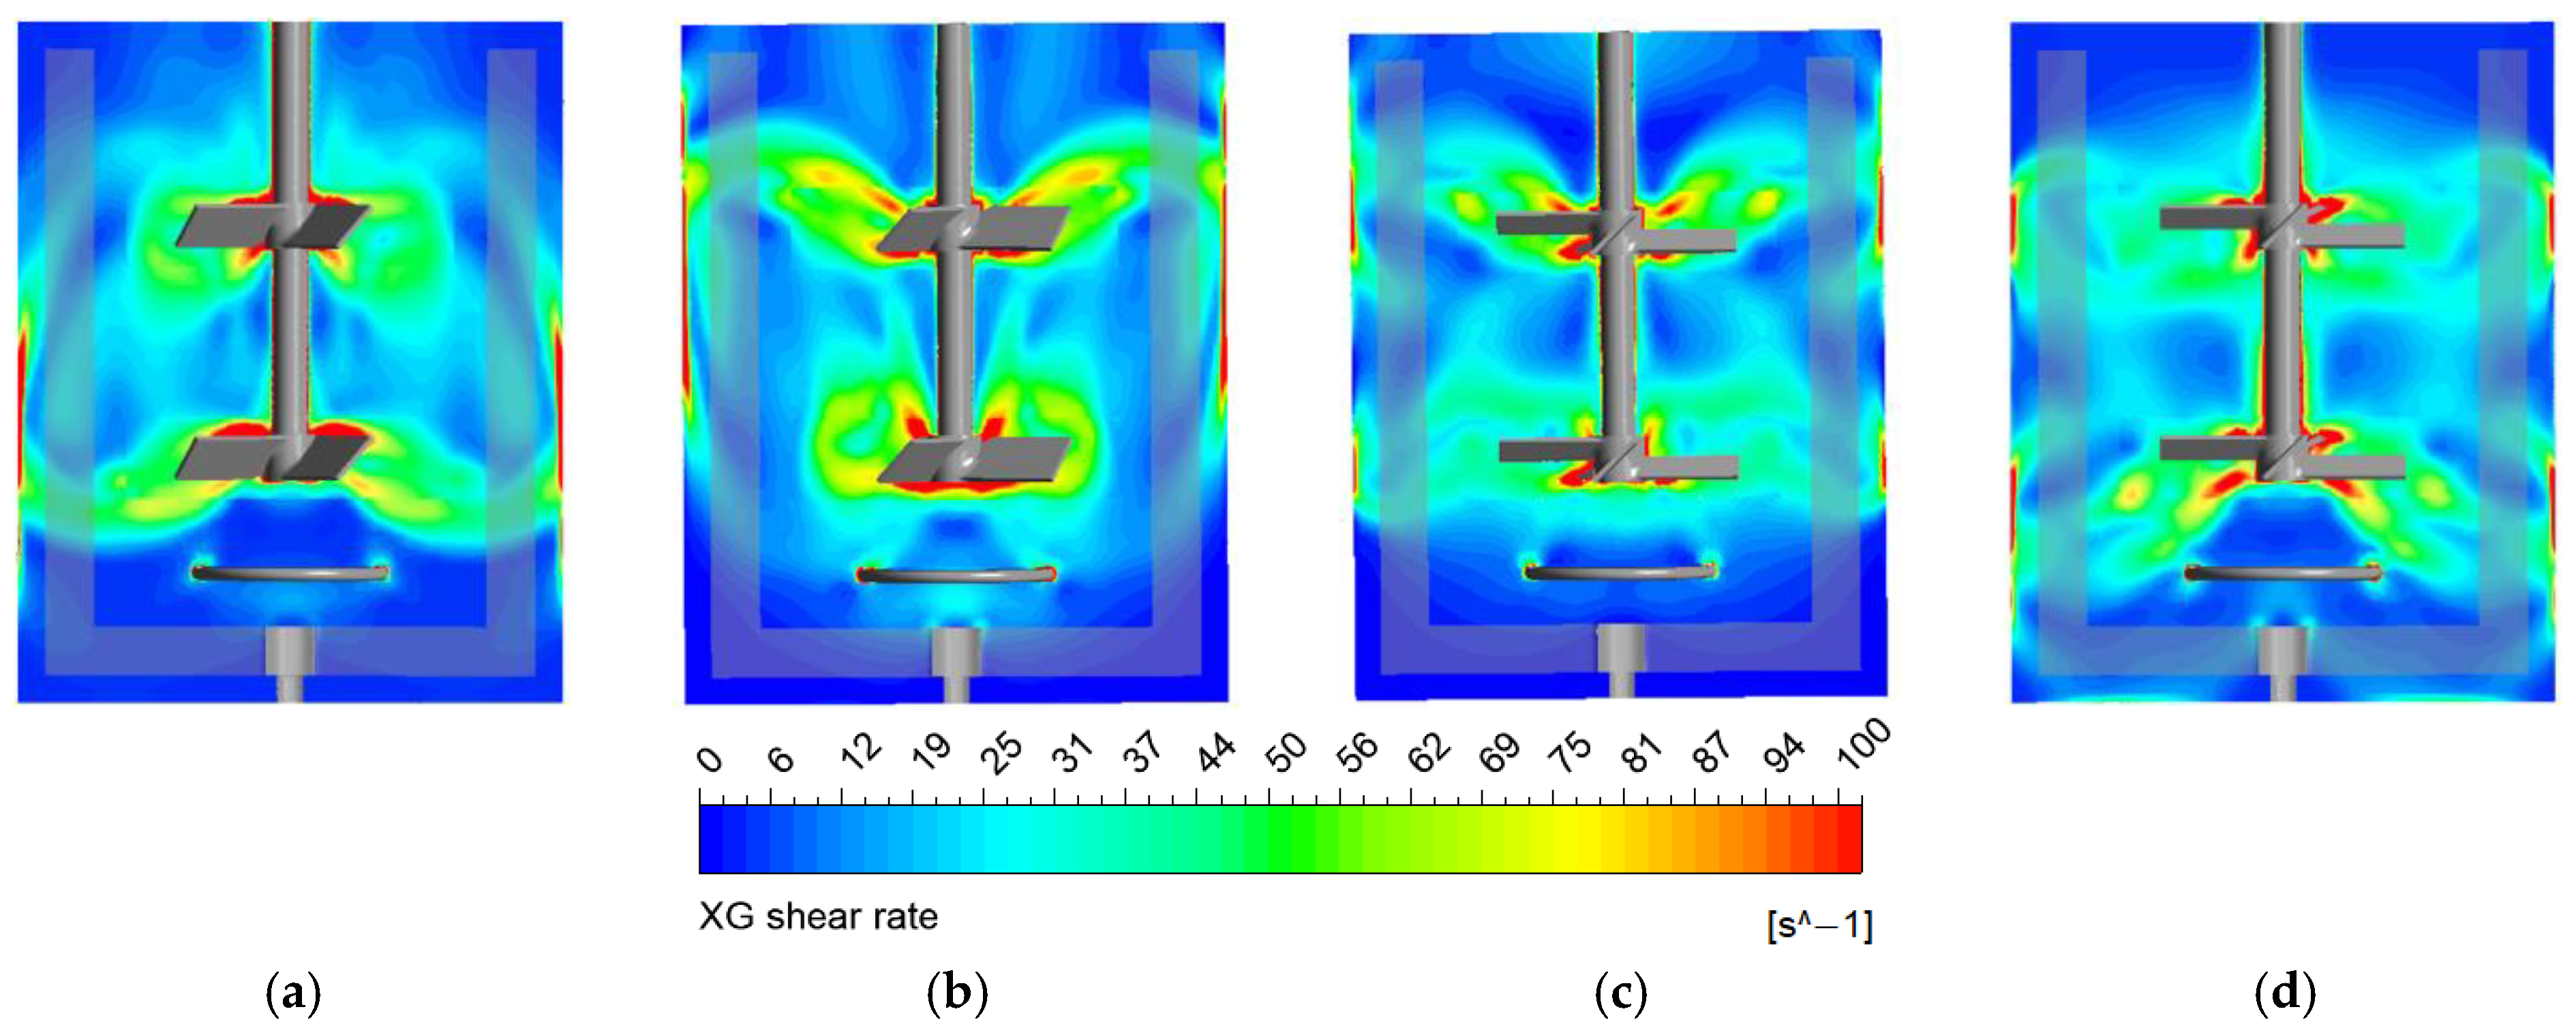
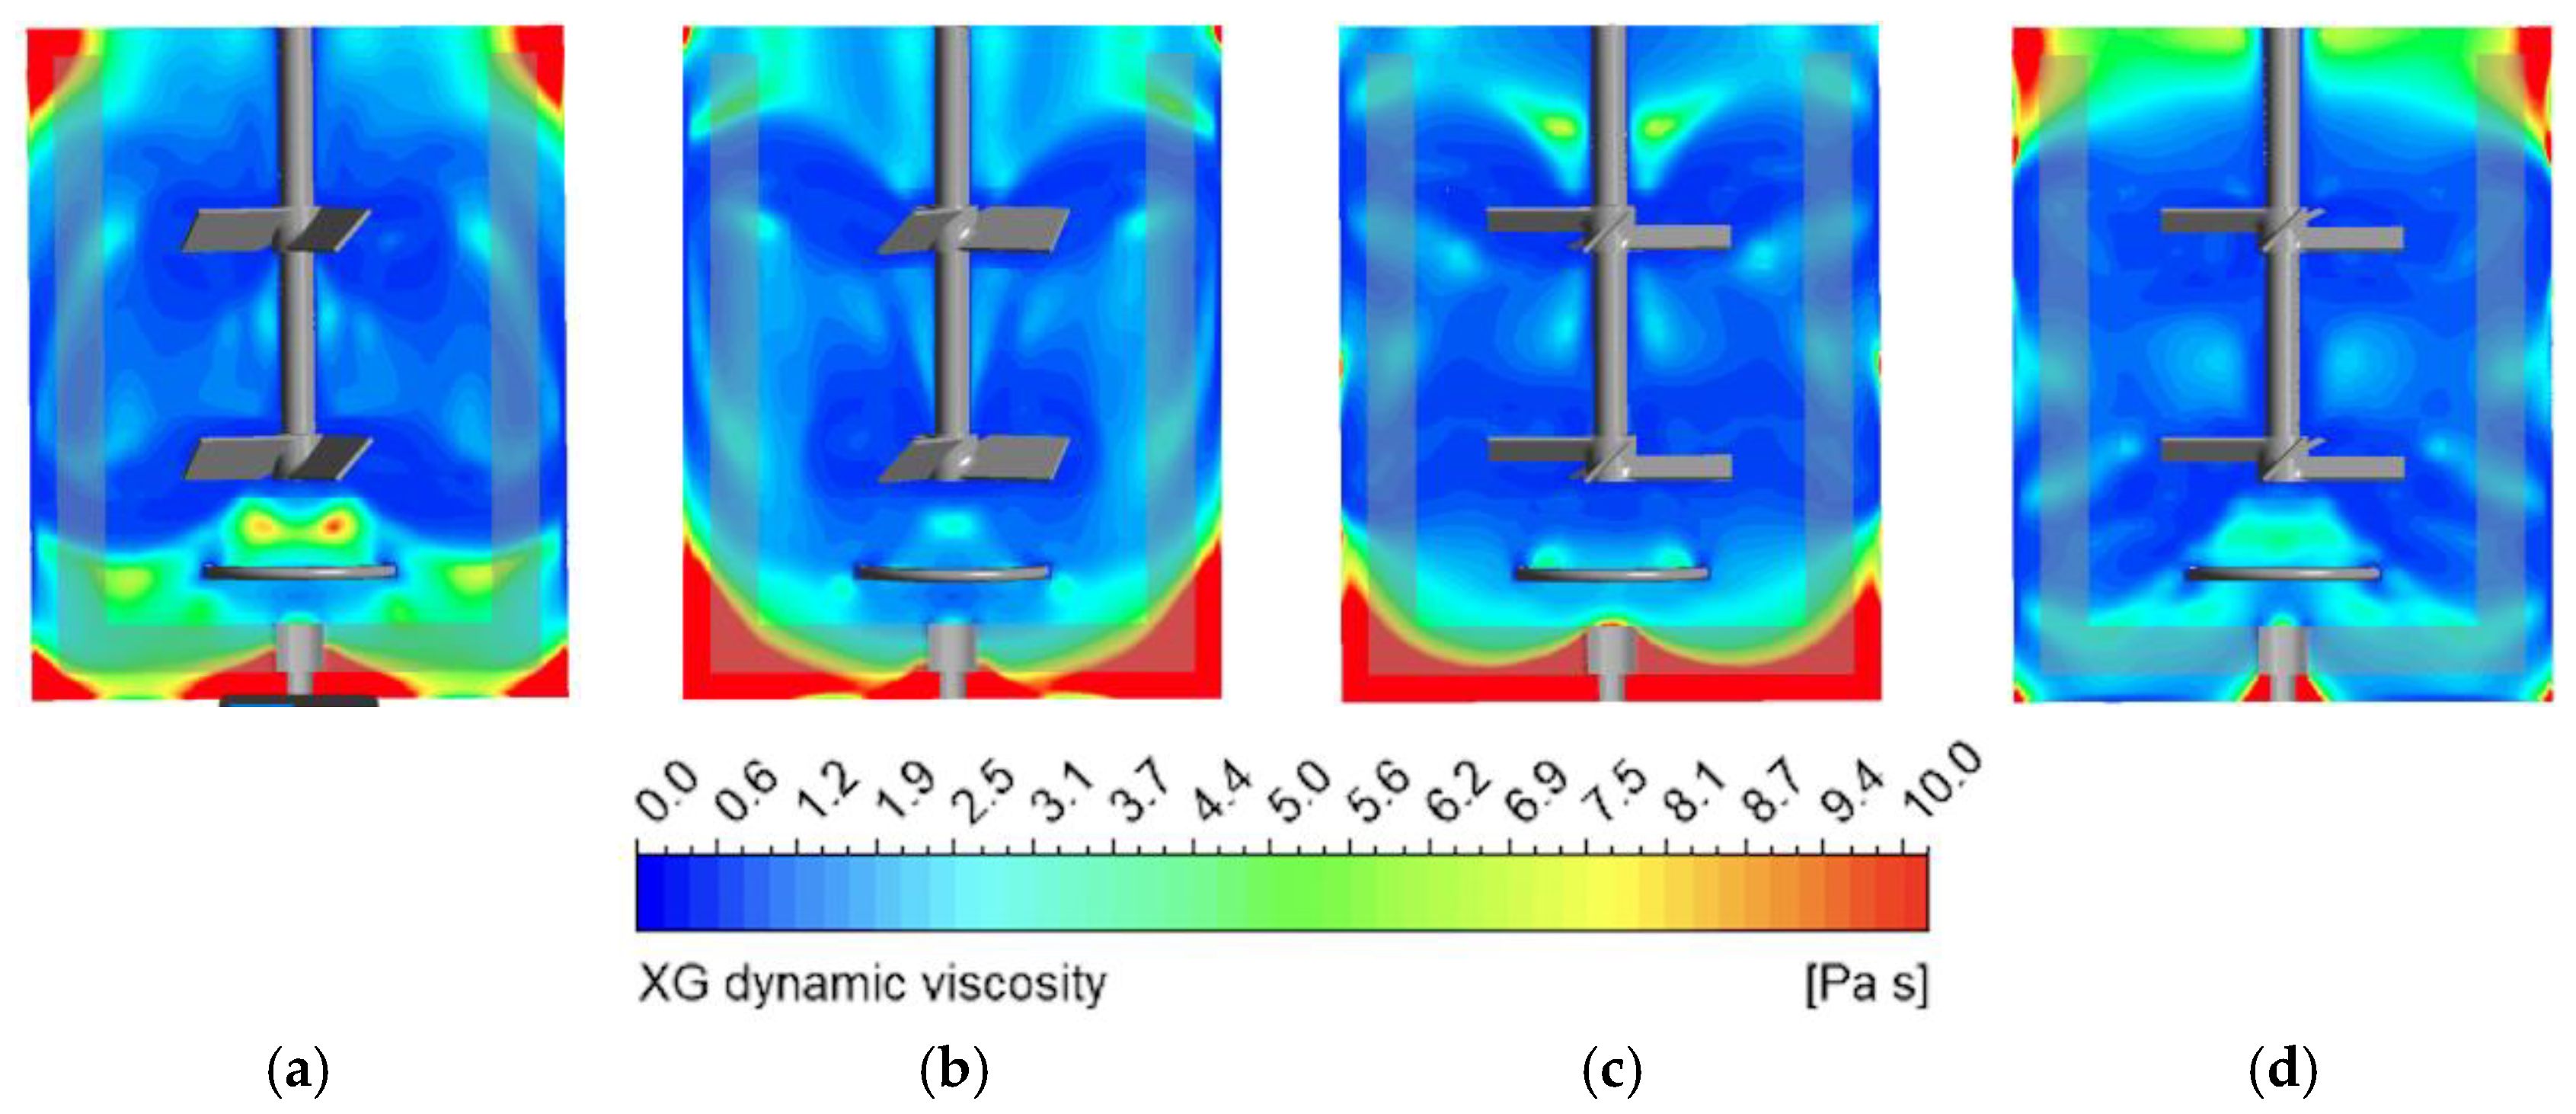
3.1. Comparing Different Mixing Configurations

Given the paramount importance of comprehending shear distribution in coaxial mixing bioreactors handling yield-pseudoplastic fluids, this study endeavors to investigate how various mixing configurations, namely Down-Co, Up-Co, Down-Counter, and Up-Counter, impact shear rate profiles within the system. In this regard, the shear rate contours were created using CFD post-processing within the range of 0.1 to 100 L/s, which aligns with the shear rate range selected for the rheological measurements. As depicted in Figure 5, a higher shear rate (indicated in red) was observed at the central impeller’s blades, impeller discharge area, impeller swept zone, and tank wall. In general, a predominance of radial shear distribution was observed in the counter-rotation mode, whereas the co-rotating mode exhibited a more prominent axial shear distribution. For the Up-Co mode, the shear rate was distributed axially, which is attributed to the synergistic impact of the anchor and central impellers. In addition, in the vicinity of the tank wall, a higher shear rate was observed in the Up-Co configuration compared to other configurations, which reduced the likelihood of stationary zones.
The wider red areas were observed for the Up-Co mode around the impeller blades. Additionally, Figure 5 shows the presence of more uniformly distributed medium-shear zones in the axial direction for this configuration. When comparing the downward-pumping and upward-pumping in the co-rotating mode, it is evident that in the Down-Co mode, the area of high shear rate is limited to the vicinity of the central impellers, while a more homogeneous shear distribution was observed in the Up-Co mode.
The distribution of viscosity can be inferred from the shear rate contours due to the shear-thinning behavior displayed by the 1 wt% xanthan gum solution (Figure 6). As expected, lower apparent viscosities were observed in proximity to the impellers’ discharge (indicated with a dark blue color) and along the tank wall, while an increase in viscosity was observed as the fluid moved away from the central impeller. In fact, high-viscosity regions were experienced below the sparger and near the liquid surface, while a reduction in viscosity occurred in the low-pressure zones created behind the blades, attributed to the acceleration of the rate of deformation caused by the central impellers. When comparing the shear distribution of all mixing configurations, the Up-Co mode showed a more uniform dynamic viscosity distribution, while the least uniformity was observed in the viscosity contours of the Down-Co and Down-Counter modes.
To provide more insight, the local shear distribution contours were created on the radial planes at y = 0.18 m and y = 0.36 m (as depicted in Figure 7), corresponding to the centers of the top and bottom impellers, respectively. The red areas represent the high shear rates generated by the discharged jets from the central impeller through this plane. Similar to the axial shear rate contours, the radial shear rate contours for the Up-Co configuration illustrated a wider high-shear area surrounding the central impellers’ blades and a more uniformly distributed shear rate, with large zones of medium shear rate values compared to the other mixing configurations. However, while the shear distribution near the central impeller in the Up-Counter mode closely resembles that of the Up-Co configuration, the presence of dark blue areas adjacent to the tank wall indicates insufficient shear dispersion in these regions. This deficit in shear distribution disrupts uniformity within the Up-Counter configuration.
The velocity fields were analyzed to conduct a more in-depth analysis of how mixing configurations affect shear rate distribution. Consequently, the velocity vectors were created for the 1 wt% xanthan gum solution over an axial plane for all configurations, including the Down-Co, Up-Co, Down-Counter, and Up-Counter, operating at Nc = 350 rpm, Na = 10 rpm, and Qg = 20 L/min, using CFD post-processing as shown in Figure 8. According to this figure, the high-speed red vectors represent the jets discharged from the central impellers, while the low-speed blue vectors indicate areas of slow motion. In a conventional double-mixing bioreactor without a close-clearance impeller, the radial jets discharged from the impeller move both upward and downward, forming upper and lower loops around each central impeller. Notably, Jamshidzadeh et al. [42] demonstrated that in a coaxial mixing system equipped with a close-clearance anchor and two central impellers, the synergistic effect of the anchor and central impellers led to the merging of the upper and lower loops, resulting in stable axial circulation loops in the middle of the tank, as shown in Figure 8a,b. When comparing the upward and downward pumping in the co-rotating mode, it became evident that while in the Down-Co configuration, the lower loops generated by the bottom impeller existed, the upper loops formed by the top impeller disappeared. This led to a significant reduction in the magnitude of the velocity vectors, resulting in decreased fluid motion near the anchor blades at the top part of the tank and a subsequent reduction in shear distribution in these areas. However, in the Up-Co mode, the upper loops generated by the top impeller ensured efficient mixing near the anchor blades at the top part of the tank.
In the counter-rotating mode, the circulation loops exhibited inconsistent shapes, resulting in small and disorderly circulation patterns in certain areas of the aerated tank. Additionally, a decrease in the magnitude of the velocity vector was observed at the top and bottom of the tank compared to the co-rotating mode, with a higher velocity observed around the central impellers (Figure 8c,d). Therefore, it can be concluded that the flow pattern generated by the counter-rotating mode led to compartmentalization within the coaxial mixing bioreactor, resulting in reduced axial flow from the top to the bottom of the system. For example, in the Up-Counter configuration, poor mixing was noted at the bottom of the tank, while in the Down-Counter configuration, insufficient mixing was noted in the upper section of the tank.
Overall, when comparing all the velocity vectors of the xanthan gum solution obtained for all mixing configurations at Nc = 350 rpm and Na = 10 rpm, it becomes evident that more efficient mixing occurs in the Up-Co mode. This accounts for the more uniform shear rate distribution in this configuration.
The quantitative analysis of xanthan gum velocity was conducted to provide a more comprehensive explanation of the velocity fields. In this context, profiles of normalized fluid velocity along a vertical line at 2r/D = 0.5 were plotted for 1.0 wt% xanthan gum solution at Nc = 350 rpm and an aeration rate of 0.32 vvm for all configurations, including Down-Co, Up-Co, Down-Counter, and Up-Counter. It is important to note that the tip velocity of the central impellers (πDcNc) served as a reference for calculating the normalized fluid velocities. As depicted in Figure 9, the fluid velocity variation exhibited a bimodal distribution for all mixing configurations. The peaks on the plots correspond to the velocities of the jets discharged from each central impeller. Notably, the maximum velocity along the axial line is consistently lower than 60% of the central impeller tip speed (Utip). This reduction is attributed to the high apparent viscosity of the xanthan gum solution. It can be inferred that the high apparent viscosity of the fluid led to resistance of the fluid to deformation, resulting in a lower transfer of shear rate generated by the impeller to the fluid and subsequently causing a decrease in the fluid velocity.
According to Figure 9, in the co-rotating mode, the velocity peaks were observed in the vicinity of the central impeller. However, it was noted that in the Up-Counter mode, the lower peak shifted above the impeller blades, while the upper peak remained at the axial position of the upper impeller’s blades. Conversely, in the Down-Counter mode, the axial position of the lower peak remained around the bottom impeller’s blades, and the upper peak shifted below the blades of the top central impeller. This observation indicates that, in the counter-rotating mode, the axial positions of the upper and lower peaks were closer to each other, centered in the middle of the mixing tank. This phenomenon can be attributed to a reduced impeller pumping capacity in the counter-rotating mode. As a result, the lower fluid velocity and the closer peak positions in the counter-rotating mode diminished the efficient axial distribution of shear rate from top to bottom when compared to the co-rotating mode.
Figure 9 shows that the highest peak was located at the top central impeller in the Up-Co mode, while the highest peak at the bottom central impeller was observed in the Down-Co configuration. These observations are in agreement with the stable axial circulation loops seen in Figure 8a,b for the co-rotating mode, indicating that the higher fluid velocity in the co-rotating mode led to a greater impeller pumping capacity. Consequently, the fluid flow generated by the co-rotating mode was more directed in the axial direction compared to the counter-rotating mode. This finding corroborates the shear rate distribution seen in Figure 5.

3.2. The Effect of Central Impeller Speed

The substantial significance of the central impeller speed’s influence on the shear rate distribution has been well-demonstrated in the literature [20]. Thus, this research aims to explore the effect of the central impeller speed on the shear distribution within a double coaxial mixer containing a 1 wt% xanthan gum solution. Therefore, both radial and axial shear rate distributions were examined for Up-Co and Up-Counter configurations, as illustrated in Figure 10, at three different central impeller speeds: 250, 350, and 450 rpm. As shown in Figure 10 at Nc = 250 rpm, the shear rate distribution displayed non-uniformity in both the Up-Co and Up-Counter modes. The medium-shear rate regions (indicated in green) were observed around the central impellers, while dark blue regions at the lower and upper parts of the tank and near the tank wall indicated very low shear rates generated by the impellers in those areas.
Elevating the central impeller speed to 450 rpm significantly enhanced both radial and axial shear distribution within the double coaxial bioreactor for both configurations. As shown in Figure 10c, in the Up-Co mode, raising the central impeller speed from 350 rpm to 450 rpm notably improved the uniformity of shear distribution within the system, particularly in the bottom half of the mixing tank, where shear rates had been very low at lower central impeller speeds. However, in the Up-Counter mode, while the shear rate distribution considerably improved at Nc = 450 rpm compared to lower impeller speeds, the presence of the dark blue region in the lower part of the tank still indicates insufficient shear distribution in those areas.
As reported in the literature [14], designing efficient coaxial mixing bioreactors for pseudoplastic fluids with yield stress is crucial to eradicating or minimizing stagnant zones. CFD post-processing enables the identification of stagnant zones in mixing systems containing Herschel–Bulkley fluids by constraining the minimum shear rate in the shear rate contours to the critical shear rate value. To investigate the effect of increasing the central impeller speed on potential stagnant zones in a double coaxial bioreactor with pseudoplastic fluids possessing yield stress, shear rate contours were plotted for the Up-Co and Up-Counter modes at three central impeller speeds, as shown in Figure 11. To display stagnant zones in the shear rate contours, the minimum shear range was selected higher than the shear rate corresponding to the yield stress. Therefore, the uncolored regions in Figure 11 within the shear rate contours represent stagnant areas. According to this figure, the stagnant zones developed at the bottom of the tank for both the Up-Co and Up-Counter modes, with larger stagnant zones in the Up-Counter mode.
Comparing shear rate contours with dynamic viscosity contours at Nc = 250 rpm revealed that the red regions in the dynamic viscosity contours corresponded to uncolored regions in the shear rate contours, confirming the presence of dead zones. Additionally, at Nc = 250 rpm, stagnant regions were observed above the top impeller in the Up-Counter mode, indicating inadequate mixing performance in this configuration. As the central impeller speed increased, the size of the undesired dead zone decreased, showing the positive impact of higher central impeller speeds on mixing performance. Interestingly, elevating the central impeller speed to 450 rpm in the Up-Co mode prevented the formation of undesired dead zones, enhancing fluid mixing effectiveness. However, small stagnant zones were still observed at the bottom corner and around the anchor impeller shaft in the Up-Counter configuration.
In order to further elaborate on the positive contribution of increasing the central impeller speed to eliminating dead zones, the radial profile of the normalized liquid axial velocity is depicted in Figure 12 at z/H = 0.54 for both the Up-Co and Up-Counter modes. It should be noted that in this profile, the location of the central impeller blade tip is at 2r/D = ±0.45. It was observed that, for both configurations at Nc = 250 rpm, the distribution of liquid axial velocity was mostly radial in the region from the impeller tip to the tank wall. This indicates that the axial flow was not effectively generated by the central impellers at low rotational speeds. However, in the Up-Co mode, with a further increase in the central impeller speed, a negative peak was observed between the shaft and the central impeller tip, while a positive peak was observed at the anchor blades. Similarly, this pattern was observed for the Up-Counter configuration.
As reported in the literature, the transition in the axial velocity from positive to negative affirms the existence of circulation loops [5]. Additionally, the values of both negative and positive peaks of the normalized axial velocity increased with a further increase in the central impeller speed, demonstrating the development of stronger circulation loops, which is in line with the findings in Figure 8. It is noteworthy that higher values of the axial liquid velocity were obtained in the Up-Co mode compared to the Up-Counter mode, once again indicating enhanced flow hydrodynamics in the Up-Co mode.

4. Conclusions

In conclusion, this study thoroughly explored the mixing characteristics of four mixing configurations, namely Down-Co, Up-Co, Down-Counter, and Up-Counter, within a double coaxial mixing bioreactor handling a 1 wt% xanthan gum solution with yield stress. The investigation encompassed an extensive analysis of local shear rate distribution, velocity fields, and dynamic viscosity under varying central impeller speeds. The findings revealed that the choice of mixing configuration significantly impacts shear rate profiles within the system. The mixing configurations in the co-rotating mode (Up-Co and Down-Co) exhibited distinct shear distributions, with the Up-Co mode offering a more prominent axial shear distribution and superior shear uniformity. In contrast, the coaxial mixing systems in the counter-rotating mode (Down-Counter and Up-Counter) exhibited radial shear predominance and less uniform shear rate distribution, resulting in compartmentalization within the reactor. Furthermore, this study demonstrated the crucial role of central impeller speed in shear rate distribution. Higher impeller speeds led to improved shear uniformity, particularly in the bottom half of the tank, and reduced the presence of stagnant zones. In particular, the Up-Co mode at higher impeller speeds showcased enhanced mixing effectiveness and the prevention of undesired dead zones.

Author Contributions

Conceptualization, F.S., E.B. and F.E.-M.; Methodology, F.S.; Software, F.S.; Validation, F.S.; Formal analysis, F.S.; Investigation, F.S.; Resources, E.B. and F.E.-M.; Writing—original draft, F.S.; Writing—review & editing, E.B. and F.E.-M.; Supervision, E.B. and F.E.-M.; Project administration, E.B. and F.E.-M.; Funding acquisition, E.B. and F.E.-M. All authors have read and agreed to the published version of the manuscript.

Funding

We express profound gratitude for the financial assistance offered by Natural Sciences and Engineering Research Council of Canada (NSERC) under grant number RGPIN-2019-04644.

Data Availability Statement

The data will be available upon request.

Acknowledgments

We appreciate ANSYS for granting us a license and acknowledge Niagara for generously providing supercomputer resources for our computational fluid dynamics simulations.

Conflicts of Interest

The authors declare no conflict of interest.

Nomenclature

DTank diameter, m
DcDiameter of the central impeller, m
fpaThe ratio of the anchor power to the total power, dimensionless
fpcThe ratio of the central impeller power to the total power, dimensionless
F i Interface momentum exchange, N
HHeight of the tank, m
kConsistency index, Pa.sn
KsMetzner and Otto constant
nPower index, dimensionless
NcCentral impeller rotational speed, rpm
NaAnchor impeller rotational speed, rpm
QgVolumetric flow rate of the gas, L/min
ReReynolds number, dimensionless
rRadius, m
RTank radius, m
UaxialLiquid axial velocity, m/s
UtipImpeller tip velocity, m/s
ULiquid velocity in stationary frame, m/s
zHeight, m
Greek letters
γ ˙ Shear rate, L/s
ε g Gas hold-up, dimensionless
λ Bulk viscosity, Pa.s
μLaminar viscosity, Pa.s
μTTurbulent viscosity, Pa.s
ρDensity of liquid, kg/m3
σgGas conductivity, S/cm
σlLiquid conductivity, S/cm
σmcMixture conductivity, S/cm
τShear stress, Pa
τ = e f f Reynolds stress tensor, Pa
τyYield stress, Pa
ϕVolume fraction, dimensionless

References

  1. Paulová, L.; Patáková, P.; Brányik, T. Advanced fermentation processes. In Engineering Aspects of Food Biotechnology; CRC Press: Boca Raton, FL, USA, 2013; pp. 89–110. [Google Scholar] [CrossRef]
  2. Wang, S.J.; Zhong, J.J. Bioreactor engineering. In Bioprocessing for Value-Added Products from Renewable Resources; Elsevier: Amsterdam, The Netherlands, 2007; pp. 131–161. [Google Scholar]
  3. Moucha, T.; Linek, V.; Prokopová, E. Gas hold-up, mixing time and gas–liquid volumetric mass transfer coefficient of various multiple-impeller configurations: Rushton turbine, pitched blade and techmix impeller and their combinations. Chem. Eng. Sci. 2003, 58, 1839–1846. [Google Scholar] [CrossRef]
  4. Dhanasekharan, K.M.; Sanyal, J.; Jain, A.; Haidari, A. A generalized approach to model oxygen transfer in bioreactors using population balances and computational fluid dynamics. Chem. Eng. Sci. 2005, 60, 213–218. [Google Scholar] [CrossRef]
  5. Sharifi, F.; Behzadfar, E.; Ein-Mozaffari, F. Intensified gas-liquid mixing in bioreactors equipped with a dual coaxial mixer containing biopolymer solutions. Chem. Eng. Res. Des. 2023, 191, 109–126. [Google Scholar] [CrossRef]
  6. Terasaka, K.; Shibata, H. Oxygen transfer in viscous non-Newtonian liquids having yield stress in bubble columns. Chem. Eng. Sci. 2003, 58, 5331–5337. [Google Scholar] [CrossRef]
  7. De Jesus, S.S.; Neto, J.M.; Maciel Filho, R. Hydrodynamics and mass transfer in bubble column, conventional airlift, stirred airlift and stirred tank bioreactors, using viscous fluid: A comparative study. Biochem. Eng. J. 2017, 118, 70–81. [Google Scholar] [CrossRef]
  8. Núñez EG, F.; Leme, J.; de Almeida Parizotto, L.; Chagas, W.A.; de Rezende, A.G.; da Costa BL, V.; Monteiro DC, V.; Boldorini VL, L.; Jorge SA, C.; Astray, R.M.; et al. Influence of aeration–homogenization system in stirred tank bioreactors, dissolved oxygen concentration and pH control mode on BHK-21 cell growth and metabolism. Cytotechnology 2014, 66, 605–617. [Google Scholar] [CrossRef]
  9. Tang, W.; Pan, A.; Lu, H.; Xia, J.; Zhuang, Y.; Zhang, S.; Chu, J.; Noorman, H. Improvement of glucoamylase production using axial impellers with low power consumption and homogeneous mass transfer. Biochem. Eng. J. 2015, 99, 167–176. [Google Scholar] [CrossRef]
  10. Arratia, P.E.; Kukura, J.; Lacombe, J.; Muzzio, F.J. Mixing of shear-thinning fluids with yield stress in stirred tanks. AIChE J. 2006, 52, 2310–2322. [Google Scholar] [CrossRef]
  11. Jaworski, Z.; Pacek, A.W.; Nienow, A.W. On flow close to cavern boundaries in yield stress fluids. Chem. Eng. Sci. 1994, 49, 3321–3324. [Google Scholar] [CrossRef]
  12. Adams, L.W.; Barigou, M. CFD analysis of caverns and pseudo-caverns developed during mixing of non-Newtonian fluids. Chem. Eng. Res. Des. 2007, 85, 598–604. [Google Scholar] [CrossRef]
  13. Wang, S.; Li, H.; Tao, C.; Liu, R.; Wang, Y.; Liu, Z. Study on cavern evolution and performance of three mixers in agitation of yield-pseudoplastic fluids. Chin. J. Chem. Eng. 2023, 55, 111–122. [Google Scholar] [CrossRef]
  14. Jamshidzadeh, M.; Ein-Mozaffari, F.; Lohi, A. Local and overall gas holdup in an aerated coaxial mixing system containing a non-Newtonian fluid. AIChE J. 2020, 66, e17016. [Google Scholar] [CrossRef]
  15. Garcia-Ochoa, F.; Gomez, E. Bioreactor scale-up and oxygen transfer rate in microbial processes: An overview. Biotechnol. Adv. 2009, 27, 153–176. [Google Scholar] [CrossRef]
  16. Foucault, S.; Ascanio, G.; Tanguy, P.A. Power characteristics in coaxial mixing: Newtonian and non-Newtonian fluids. Ind. Eng. Chem. Res. 2005, 44, 5036–5043. [Google Scholar] [CrossRef]
  17. Thibault, F.; Tanguy, P.A. Power-draw analysis of a coaxial mixer with Newtonian and non-Newtonian fluids in the laminar regime. Chem. Eng. Sci. 2002, 57, 3861–3872. [Google Scholar] [CrossRef]
  18. Rahimzadeh, A.; Ein-Mozaffari, F.; Lohi, A. Scale-up study of aerated coaxial mixing reactors containing non-newtonian power-law fluids: Analysis of gas holdup, cavity size, and power consumption. J. Ind. Eng. Chem. 2022, 113, 293–315. [Google Scholar] [CrossRef]
  19. Rahimzadeh, A.; Ein-Mozaffari, F.; Lohi, A. Investigation of power consumption, torque fluctuation, and local gas hold-up in coaxial mixers containing a shear-thinning fluid: Experimental and numerical approaches. Chem. Eng. Process.-Process Intensif. 2022, 177, 108983. [Google Scholar] [CrossRef]
  20. Amiraftabi, M.; Khiadani, M.; Mohammed, H.A. Performance of a dual helical ribbon impeller in a two-phase (gas-liquid) stirred tank reactor. Chem. Eng. Process.-Process Intensif. 2020, 148, 107811. [Google Scholar] [CrossRef]
  21. Ameur, H.; Bouzit, M. Mixing in shear thinning fluids. Braz. J. Chem. Eng. 2012, 29, 349–358. [Google Scholar] [CrossRef]
  22. Sossa-Echeverria, J.; Taghipour, F. Computational simulation of mixing flow of shear thinning non-Newtonian fluids with various impellers in a stirred tank. Chem. Eng. Process. Process Intensif. 2015, 93, 66–78. [Google Scholar] [CrossRef]
  23. Ciou, Z.Y.; Wu, C.Y. Investigation of the flow patterns and mixing efficiency in a stirred tank through particle image velocimetry. J. Taiwan Inst. Chem. Eng. 2023, 149, 104988. [Google Scholar] [CrossRef]
  24. Laakkonen, M.; Honkanen, M.; Saarenrinne, P.; Aittamaa, J. Local bubble size distributions, gas–liquid interfacial areas and gas holdups in a stirred vessel with particle image velocimetry. Chem. Eng. J. 2005, 109, 37–47. [Google Scholar] [CrossRef]
  25. Fontaine, A.; Guntzburger, Y.; Bertrand, F.; Fradette, L.; Heuzey, M.C. Experimental investigation of the flow dynamics of rheologically complex fluids in a Maxblend impeller system using PIV. Chem. Eng. Res. Des. 2013, 91, 7–17. [Google Scholar] [CrossRef]
  26. Alberini, F.; Liu, L.; Stitt, E.H.; Simmons MJ, H. Comparison between 3-D-PTV and 2-D-PIV for determination of hydrodynamics of complex fluids in a stirred vessel. Chem. Eng. Sci. 2017, 171, 189–203. [Google Scholar] [CrossRef]
  27. Ayala, J.S.; de Moura, H.L.; de Lima Amaral, R.; Júnior FD, A.O.; Nunhez, J.R.; de Castilho, G.J. Two-dimensional shear rate field and flow structures of a pseudoplastic fluid in a stirred tank using particle image velocimetry. Chem. Eng. Sci. 2022, 248, 117198. [Google Scholar] [CrossRef]
  28. Wang, H.; Jia, X.; Wang, X.; Zhou, Z.; Wen, J.; Zhang, J. CFD modeling of hydrodynamic characteristics of a gas–liquid two-phase stirred tank. Appl. Math. Model. 2014, 38, 63–92. [Google Scholar] [CrossRef]
  29. Jia, Z.; Xu, L.; Duan, X.; Mao, Z.S.; Zhang, Q.; Yang, C. CFD simulation of flow and mixing characteristics in a stirred tank agitated by improved disc turbines. Chin. J. Chem. Eng. 2022, 50, 95–107. [Google Scholar] [CrossRef]
  30. 37 Wang, H.; Duan, X.; Feng, X.; Mao, Z.S.; Yang, C. Effect of impeller type and scale-up on spatial distribution of shear rate in a stirred tank. Chin. J. Chem. Eng. 2022, 42, 351–363. [Google Scholar] [CrossRef]
  31. Ihejirika, I.; Ein-Mozaffari, F. Using CFD and ultrasonic velocimetry to study the mixing of pseudoplastic fluids with a helical ribbon impeller. Chem. Eng. Technol. Ind. Chem.-Plant Equip.-Process Eng.-Biotechnol. 2007, 30, 606–614. [Google Scholar] [CrossRef]
  32. Kumaresan, T.; Joshi, J.B. Effect of impeller design on the flow pattern and mixing in stirred tanks. Chem. Eng. J. 2006, 115, 173–193. [Google Scholar] [CrossRef]
  33. Zhang, Y.; Wang, L.; Huo, H.; Li, Z.; Gao, Z. Computational and experimental investigation of flow fields in a Rushton turbine stirred tank with shear-thinning fluid. Asia-Pac. J. Chem. Eng. 2022, 17, e2735. [Google Scholar] [CrossRef]
  34. Maxwell, J.C. A Treatise on Electricity and Magnetism: Pt. III. Magnetism. pt. IV. Electromagnetism; Clarendon Press: Oxford, UK, 1881; Volume 2. [Google Scholar]
  35. Ansys Fluent. Ansys Fluent Theory Guide; Ansys Inc.: Canonsburg, PA, USA, 2011; Volume 15317, pp. 724–746. [Google Scholar]
  36. Sharifi, F.; Behzadfar, E.; Ein-Mozaffari, F. Investigating the Power Consumption for the Intensification of Gas Dispersion in a Dual Coaxial Mixer Containing Yield-Pseudoplastic Fluids. Chem. Eng. Process.-Process Intensif. 2023, 191, 109461. [Google Scholar] [CrossRef]
  37. Kelly, W.; Gigas, B. Using CFD to predict the behavior of power law fluids near axial-flow impellers operating in the transitional flow regime. Chem. Eng. Sci. 2003, 58, 2141–2152. [Google Scholar] [CrossRef]
  38. Scargiali, F.; D’Orazio, A.; Grisafi, F.; Brucato, A. Modelling and simulation of gas–liquid hydrodynamics in mechanically stirred tanks. Chem. Eng. Res. Des. 2007, 85, 637–646. [Google Scholar] [CrossRef]
  39. Jahoda, M.; Tomášková, L.; Moštěk, M. CFD prediction of liquid homogenisation in a gas–liquid stirred tank. Chem. Eng. Res. Des. 2009, 87, 460–467. [Google Scholar] [CrossRef]
  40. Khopkar, A.R.; Kasat, G.R.; Pandit, A.B.; Ranade, V.V. CFD simulation of mixing in tall gas–liquid stirred vessel: Role of local flow patterns. Chem. Eng. Sci. 2006, 61, 2921–2929. [Google Scholar] [CrossRef]
  41. Lins Barros, P.; Ein-Mozaffari, F.; Lohi, A. Gas Dispersion in Non-Newtonian Fluids with Mechanically Agitated Systems: A Review. Processes 2022, 10, 275. [Google Scholar] [CrossRef]
  42. Jamshidzadeh, M.; Ein-Mozaffari, F.; Lohi, A. Local distribution of oxygen mass transfer coefficient in CMC solutions in bioreactors furnished with different types of coaxial mixers. Chem. Eng. Res. Des. 2021, 174, 213–224. [Google Scholar] [CrossRef]
Figure 1. (a) Schematic diagram of experimental setup: (1) air control valve, (2) rotameter, (3) ring sparger, (4) pitched-blade turbine impellers, (5) anchor impeller, (6) ERT sensors, (7) torque meter, (8) couplings, (9) electric motor, (10) data acquisition system, (11) host computer, and (12) drain valve; (b) pitched-blade turbine impeller; and (c) anchor impeller.
Processes 11 03387 g001
Figure 2. Rheological behavior of the xanthan gum solution with the concentration of 1 wt%.
Processes 11 03387 g002
Figure 3. Computational grid structure of the double coaxial mixing bioreactor.
Processes 11 03387 g003
Figure 4. Grid independency test for three varying grid sizes.
Processes 11 03387 g004
Figure 5. Local shear rate distribution for different mixing configurations: (a) Down-Co, (b) Up-Co, (c) Down-Counter, and (d) Up-Counter at Nc = 350 rpm, Na = 10 rpm, and Qg = 20 L/min.
Processes 11 03387 g005
Figure 6. Local viscosity distribution for different mixing configurations: (a) Down-Co, (b) Up-Co, (c) Down-Counter, and (d) Up-Counter at Nc = 350 rpm, Na = 10 rpm, and Qg = 20 L/min.
Processes 11 03387 g006
Figure 7. Radial distribution of shear rate in vicinity of the top and bottom central impellers: (a) Down-Co, (b) Up-Co, (c) Down-Counter, and (d) Up-Counter at Nc = 350 rpm, Na = 10 rpm, and Qg = 20 L/min.
Processes 11 03387 g007aProcesses 11 03387 g007b
Figure 8. XG velocity vector plots for different mixing configurations: (a) Down-Co, (b) Up-Co, (c) Down-Counter, and (d) Up-Counter at Nc = 350 rpm, Na = 10 rpm, and Qg = 20 L/min.
Processes 11 03387 g008
Figure 9. Axial profile of the normalized fluid velocity for all mixing configurations at Nc = 350 rpm, Na = 10 rpm, and Qg = 20 L/min.
Processes 11 03387 g009
Figure 10. Shear rate contour at various central impeller speeds: (a) 250 rpm, (b) 350 rpm, and (c) 450 rpm at Na = 10 rpm and Qg = 20 L/min.
Processes 11 03387 g010
Figure 11. Impact of central impeller speed on the stagnant zones: (a) 250 rpm, (b) 350 rpm, and (c) 450 rpm.
Processes 11 03387 g011
Figure 12. Radial profile of dimensionless liquid axial velocity for: (a) Up-Co, (b) Up-Counter modes at z/H = 0.54 at Na = 10 rpm and Qg = 20 L/min.
Processes 11 03387 g012
Table 1. The rheological characteristic of the 1 wt% xanthan gum solution.
Density, ρ (kg/m3)Yield Stress, τy (Pa)Consistency Index, k (Pa·sn)Power-Law Index (n)
9833.2210.160.13
Table 2. CFD model validation results for the Up-Co and Up-Counter modes at Nc = 350, Na = 10 rpm, and Qg = 20 L/min.
Mixing ConfigurationPower Consumption (W) Local Gas Hold-Up
EXPCFDError% EXPCFDError%
Up-Co155.9142.38.72Plane 10.05200.04748.85
Plane 20.05340.04967.12
Plane 30.05090.04776.29
Plane 40.05000.04725.60
Up-Counter181.9167.97.69Plane 10.04070.034914.25
Plane 20.04020.03707.96
Plane 30.03860.03596.99
Plane 40.03330.03106.91
Disclaimer/Publisher’s Note: The statements, opinions and data contained in all publications are solely those of the individual author(s) and contributor(s) and not of MDPI and/or the editor(s). MDPI and/or the editor(s) disclaim responsibility for any injury to people or property resulting from any ideas, methods, instructions or products referred to in the content.

