1. Introduction
Meltblown nonwoven fabric is a chemical fiber product used for making masks, protective clothing, industrial filters, and sanitary products. Demand for this fabric is increasing as the range of use has recently expanded, and various production processes are required for different types of use.
Meltblown nonwoven fabric is produced by heating polypropylene-based thermoplastic chips at a high temperature of over 200 °C; this process involves supplying the thermoplastic in a fixed amount through an extruder and gear pump, and high-temperature, high-speed air of over 200 °C is sprayed through fine nozzle holes of around 0.3 mm in diameter. The fabric is then produced through the process of forming a web on a conveyor belt after stretching [
1].
Meltblown nonwoven fabrics require different fiber diameters and porosities, depending on their use. Porosity and fiber diameter are related to the collection efficiency and pressure differential, which determine the performance of meltblown nonwoven fabrics. To construct such a nonwoven web, many process variables such as nozzle diameter, material extrusion amount, air temperature, flow rate, and conveyor speed must be taken into consideration.
Theoretical and experimental studies [
2] have been conducted to analyze the theoretical correlation between process variables and the fiber diameter of meltblown nonwoven fabric to produce fabric with the target fiber diameter; however, environmental variables are difficult to control in industrial practice. Industrial sites spend a lot of time and money on process setting to produce desired meltblown nonwoven products according to product groups, and process parameters are often changed until stable production is achieved.
Theoretical models and computational fluid dynamics (CFD) were used in a previous study to predict the production process conditions of meltblown nonwoven fabric and to investigate the correlations among different process condition factors [
3]. Although the theory underlying the production of meltblown nonwoven fabrics has been established, the theoretical relationship between pressure differential and collection efficiency, which determine the performance of nonwoven fabrics in actual industrial practice, has not been studied.
In this study, an SEM image-based deep neural network (CNN) algorithm was applied to the meltblown nonwoven fabric production process, which is difficult to predict using theory alone, and a model capable of inversely predicting the process conditions was developed. A method for minimizing the process setting time and cost during the production of nonwoven fabrics was proposed.
Deep neural network algorithms are used in various fields such as medicine, healthcare, and finance, and research is being conducted on the use of these algorithms in the field of nonwoven fabric manufacturing.
Various deep learning-based learning models using such algorithms have been developed to predict not only the performance of meltblown nonwoven fabrics but also defects that occur during the production of general knitting and woven fabrics [
4]. Research in the field of providing feedback through real-time monitoring and analysis is also being actively conducted.
To detect stains, holes, and knot defects in textile fabrics that may occur during textile production, a previous study [
5] used the CNN-LeNet model and compared its accuracy to other models such as AlexNet and VGG16 models. CNN-ResNet512 was used in a study for real-time detection and prediction of defects, dust foreign matter, pattern defects, etc. [
6]. Another study focusing on stain detection according to shadows used the VGG19 model [
7], and a study on fiber quality used transfer learning and RCNN (Region-Based Convolutional Neural Network) models. To improve accuracy various model has applied, such as a study that aimed to de-tect holes and damaged parts [
8].
Recently, research was conducted to analyze the functionality of fabrics using a machine vision system and deep learning-based AI technology to analyze defects in jacquard fabrics [
9].
In order to produce samples with a low basis weight and high bending stiffness using non-woven fabric, a study was conducted to predict the process by modeling the non-woven fabric tissue using an artificial neural network [
10].
A study was also conducted to predict the air filtration efficiency and air flow performance, which are key performances of non-woven filters, using CNN based on SEM images simulated by digitally replicating non-woven fabric tissue [
11].
Research based on visualization analysis of image-based deep neural networks is conducted by using Grad-CAM analysis in various applications [
12,
13,
14]. However, most of these studies have been conducted in other industrial fields, such as the medical field, rather than the textile industry [
15]. In particular, in the field of radiology, visualization analysis of a learned model is important; thus, visualization models, such as LRP and Grad-CAM, are being actively applied to understand deep neural network algorithms from a macroscopic perspective and to analyze their relevance.
In the textile industry, deep neural network algorithms are predominantly applied in studies focusing on the detection of production defects, and studies that aimed at predicting meltblown nonwoven fabric production process conditions or explain how deep neural networks predict process conditions have also been reported. However there is no study using visualization models such as LRP or Grad-CAM.
In this study, SEM measurement images of meltblown nonwovens produced under various experimental process conditions were used to train VGG16, VGG19, ResNet50, and DenseNet121 models, and the accuracy of each model in predicting the production process was compared and analyzed. LRP and Grad-CAM visualization models were used to confirm the criteria for classification from a macroscopic perspective, and the characteristics of the two visualization models were compared.
In this paper, we presented that a deep learning model with transfer learning can predict the complicated non-woven fabric process with high accuracy even in non-binary classification using simple SEM images, which are much more complex than clearly distinguished binary problems such as dogs or cats.
The remainder of this paper is organized as follows: in
Section 2, experiment setup and dataset are presented for the meltblown nonwoven fabric production process prediction. In
Section 3, the various deep learning architectures are introduced to conduct the meltblown nonwoven fabric production process prediction and the LRP method is utilized to perform visualization analysis. In
Section 4, we present the results and discussion of experiments. The conclusions are presented in
Section 5.
2. Experiments and Data
2.1. Meltblown Nonwoven Fabric Production Process
The meltblown nonwoven fabric production process is shown in
Figure 1. To produce meltblown nonwoven fabrics, polypropylene-based thermoplastic resin is supplied through a hopper, passed through an extruder at 200 °C or higher, and quantitatively supplied from a gear pump to a meltblown die. After passing through a new nozzle, it is stretched by means of high-temperature high-speed air of 200 °C or higher, and a web is formed on a conveyor-type collector equipped with air suction, which is wound through post-processing such as calendering.
The meltblown process depends on process variables such as material properties, extruder temperature, gear pump supply, nozzle diameter, meltblown die temperature, air speed, air temperature, nozzle and collector distance, and conveyor speed. Different process conditions are applied depending on the target product, and the fiber diameter, differential pressure, and filtering efficiency performance of newly produced nonwoven fabrics appear differently.
2.2. Experimetal Setup
For CNN-based model learning, SEM image data of nonwoven fabrics for each process are required. To obtain SEM images, a meltblown nonwoven fabric production experimental device that can adjust the diameter of fiber and factors affecting performance was developed. It was configured as shown in
Figure 2.
The experimental device includes an extruder and a fixed-rate gear pump capable of heating polypropylene-based resin and supplying it in a fixed amount, a spin beam that uniformly supplies the resin to the nozzle, a precision-processed meltblown nozzle with a diameter of 0.3 mm, and a uniform air supply. The device also consists of an air knife, a conveyor, and a suction to form webs.
Process parameters that can affect the nonwoven structure, for example, the material discharge rate was fixed at 180 g/min, the nozzle temperature at 220 °C, the distance from the collector at 300 mm, and the suction pressure at 2.45 kPa.
However, five test samples were fabricated by changing the temperature of the extruder and the wind speed of the rotating air, which directly affect the quality of the nonwoven fabric and these can be easily modified.
2.3. Dataset
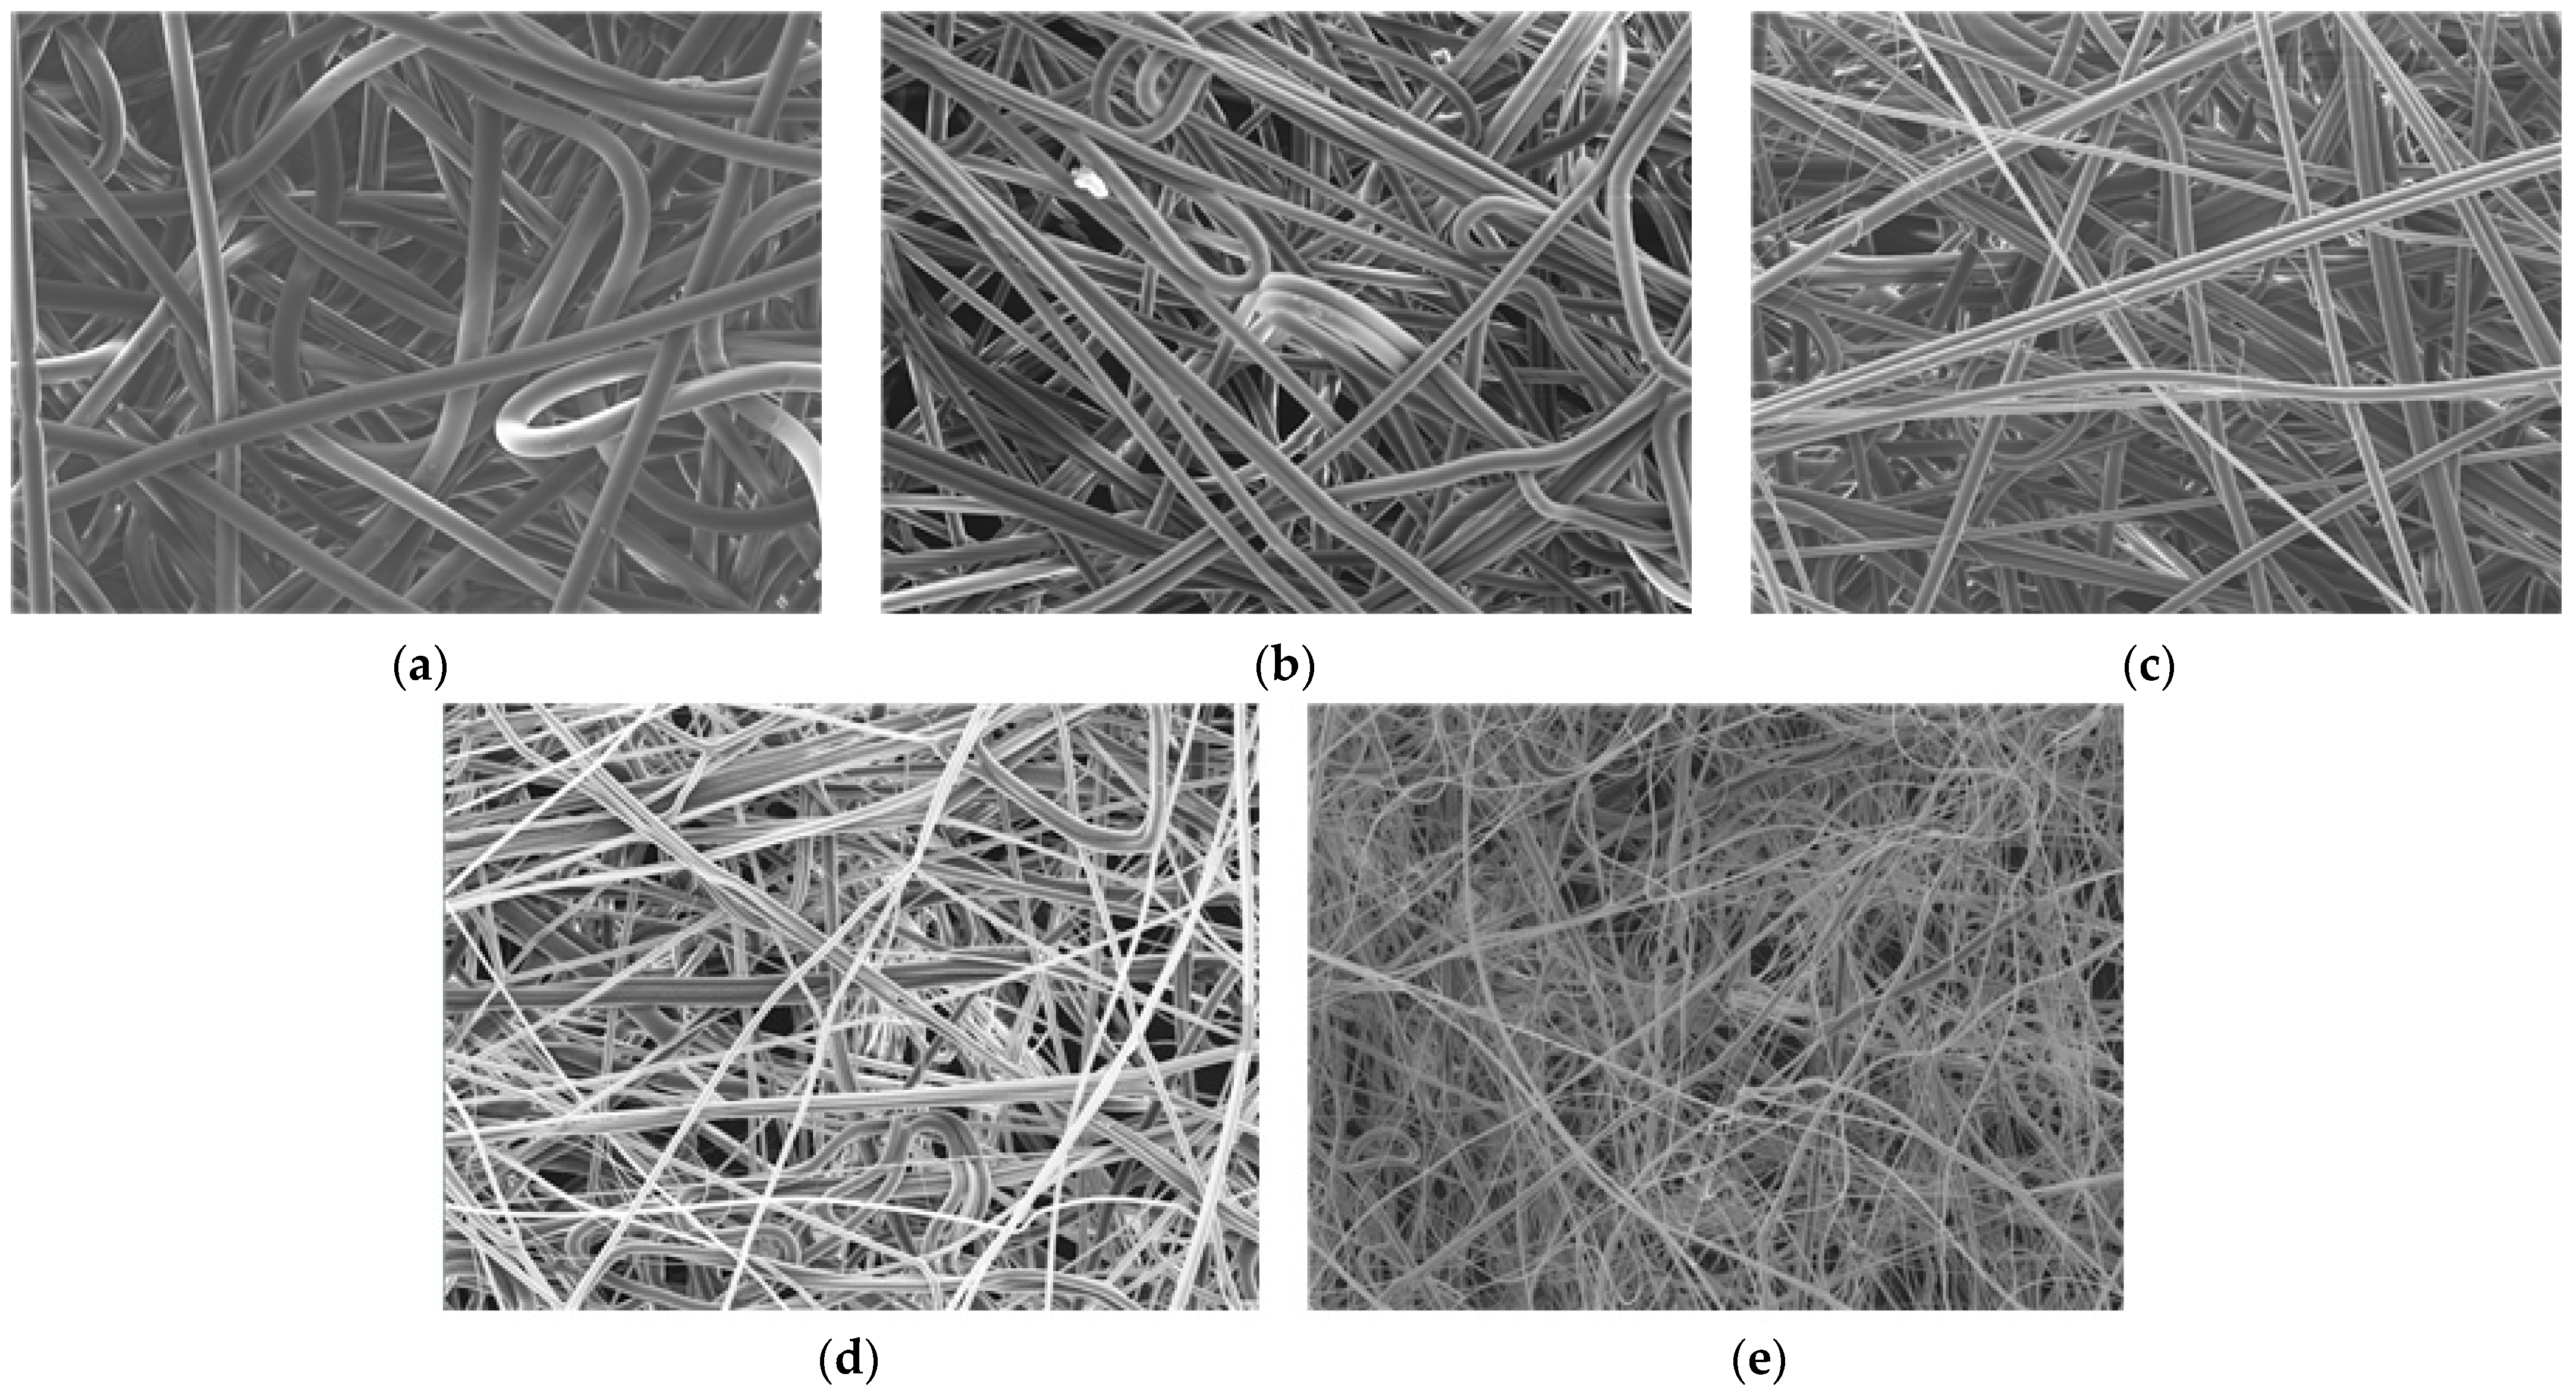
Figure 3 shows the original input images of the experimental measurement results for each variable process condition listed in
Table 1. Other process conditions, except for those listed in
Table 1, were fixed at the same conditions. The fiber diameter of Process 1 was distributed at the level of 14~17 µm, whereas Process 2, Process 3, Process 4, and Process 5 had fiber diameters ranging from 9 to 12 µm, from 8 to 12 µm, from 4 to 8 µm, and from 2 to 4 µm, respectively.
The number of images was amplified by applying left–right inversion and rotation of more than 100 SEM images for each process condition, and the insufficient number of data points was supplemented through transfer learning.
Typically, about 500 images are a very small amount of data to learn all node weights for a deep learning convolution model from scratch.
In this study, data augmentation is employed to address the limitations posed by a scarcity of data. Widely adopted in the training of Convolutional Neural Networks (CNNs), data augmentation enriches the diversity of the training dataset through the application of diverse transformations to existing images. These transformations include rotation, horizontal and vertical flipping, and translation. Notably, the exclusion of zooming, scaling, and shearing is deliberate to prevent distortion in the thickness and pore size of fabrics. In addition, pre-trained weights are used by transfer learning technique in the convolution parts in the CNN model architectures.
Transfer learning is a deep learning technique in which a model initially created for a specific task is repurposed as the starting point for a model on a different task. This approach can significantly reduce the time, cost, and data needed to train a new model, particularly in the realm of image recognition.
For this reason, 500 images are used for process prediction in this study.
The transfer learning models applied in this paper are VGG16 [
16], VGG19 [
17], ResNET50 [
18], and DenseNet121 [
19], which leverage weights from Keras Applications.
4. Result
4.1. Accuracy Analysis
According to the process parameters, five types of meltblown nonwoven fabrics (Process 1, Process 2, Process 3, Process 4, and Process 5) were produced.
Model training and validation were conducted for the training and test data at ratios of 9:1, 8:2, 7:3, and 6:4, with the highest prediction accuracy observed at the 7:3 ratio.
Additionally, we conducted model training while adjusting hyper parameters, such as batch size and execution speed. Among these adjustments, we selected a batch size of 32 and a learning rate of 0.005, considering them to be optimal. We referenced a paper [
27] that investigated the impact of hyper parameters on CNN training for hyper parameter optimization.
The images’ resolution was changed to 224 × 224 × 3 resolution to suit the VGG16, VGG19, ResNet50, and DenseNet121 models, and the accuracy of the models was compared by running each model with epoch sizes of 5, 10, 20, and 100.
The accuracy of the training data showed an accuracy of 99.8% or higher for all four models, and the accuracy of the test data showed a high accuracy in the order of DenseNet121, ResNet50, VGG19, and finally VGG16. As shown in
Table 2, at an epoch size of 100, the DenseNet121 model showed the highest accuracy of 99.0%. This indicates that the DenseNet121 model is the most suitable model among the four models for classifying meltblown SEM images by process condition. When the epoch value exceeded 10, overfitting tended to occur. In the case of the ResNet50 model and the DenseNet121 model, their accuracy was highest at an epoch 100, but since accuracy fluctuated from epoch 20 or higher, epoch 20 was the most suitable.
Figure 6 shows the learning accuracy according to epoch size for the VGG16, VGG19, ResNet50, and DenseNet121 models and the model verification accuracy using unlearned data.
Figure 7 illustrates the learning loss over epochs for each of the VGG16, VGG19, ResNet50, and DenseNet121 models, along with the verification loss using untrained data.
Notably, when the epoch value surpassed 20 for VGG16, ResNet50, and DenseNet121, the models exhibited a tendency to overfit. Similarly, the VGG19 model demonstrated a propensity for overfitting when the epoch value exceeded 10.
Figure 8 displays the ROC (Receiver Operating Characteristics) curves for each process, highlighting the performance of the VGG16, VGG19, ResNet50, and DenseNet121 models.
Table 3 presents the AUC (Area Under Curve) values for the VGG16, VGG19, ResNet50, and DenseNet121 models, with respective scores of 0.9616, 0.9944, 0.9986, and 0.9981. All four models exhibit exceptional performance in class discrimination.
The F1-Score for the models is calculated at 0.91, 0.92, 0.99, and 0.96, respectively. Notably, the ResNet50 model achieved the highest score, indicating superior reliability and a harmonious balance between precision and recall.
Figure 9 shows the color confusion matrix of the trained VGG16, VGG19, ResNet50, and DenseNet121 models.
For meltblown nonwoven fabrics produced under Process 1 conditions, the prediction accuracy of the VGG16, VGG19, ResNet50, and DenseNet121 models was 99%, 98%, 100%, and 100%, respectively. Using the SEM images, the process conditions were predicted with high accuracy, with most values being 98% to 100% under Process 3. The accuracy was 100% for all models under Process 2 and Process 4 conditions, and 90%, 95%, 97%, and 99%, respectively under Process 5 conditions.
4.2. Visualization Analysis by Model
For visualization analysis, LRP can be applied to any deep neural network model. However, in this paper, it was specifically implemented on the VGG19 model. This choice was motivated by the model’s ease of implementation, straightforward architecture, and simple interpretability, facilitating the explanation of cause-and-effect relationships.
Figure 10 shows the heat map images obtained using the VGG19 model; visualization was based on the criteria for classifying each meltblown nonwoven fabric type, and the LRP visualization model was used on the original images shown in
Figure 3 to obtain the LRP heat map images.
The heat map images use an RGB scheme, with higher relevance being displayed in a red color. When the degree of relevance is lower, a blue color is displayed, and the relevance of the input image class between pixels is displayed.
It was confirmed that the LRP model judged and predicted the characteristics of each image mainly based on the void pixels generated by the intersection between the outer line of the meltblown fiber filament and the fiber filament itself.
The heat map images, shown in
Figure 11, were visualized for each major layer using the Grad-CAM model based on the original images shown in
Figure 3 after using the VGG19 model to learn about the SEM images.
The block_conv1 layer captures the characteristics of the images based on the fiber filament outline, the block2_conv1 layer analyzes the images for the entire fiber line, and the block3_conv1 and block4_conv1 layers analyze the characteristics of the gap between the fibers and the location where a relative difference between brightness and contrast appears. The parts in the images are related, and the block5_conv4 layer shows a wide range of related parts as the last layer.
In the last block5_conv4 layer, for the heat map images obtained using the Grad-CAM model and the heat map images obtained using the LRP model, the red parts in the images show the high correlation in the intersection between fiber filaments, where the gaps between them are mainly distributed. This indicates that when the VGG19 model predicts the meltblown manufacturing process through the use of SEM images, it finds and predicts common characteristics such as voids and contrast between fiber filaments, line diameter, and pixel distribution size.
From the perspective of an AI model utilizing Grad-CAM, it is expected that Process 1 would be as-signed higher weights due to the largest diameter of fibers in the non-woven fabric structure, clearly distinguishing straight and curved lines through contrast differences in SEM images of each tissue line. Processes 2 and 3, with similar fiber diameters, are expected to be differentiated by the higher porosity of the fiber structure in Process 2, leading to enhanced depth perception in the images
The non-woven fabric structure of Process 3 is expected to be distinguishable by the well-expressed linearity of bright areas. With thinner fiber diameter compared to Processes 1 and 2, but thicker than Processes 3 and 5, the AI model is considered to make process judgments based on these features.
Process 4’s non-woven fabric structure, being the brightest with the most distinct contrast between fiber structure and porosity, along with the uneven fiber diameter, is likely to contribute to accurate process predictions. Process 5’s non-woven fabric structure, characterized by the smallest diameter, lowest porosity, and filamentous structure, is expected to be distinguished with higher weights in the model’s decision-making.
While previous theoretical studies on meltblown nonwoven fabric were limited to predicting fiber diameter, this research, utilizing a deep neural network model based on SEM images, goes beyond, predicting production processes using fiber structure outcomes. It not only predicts production processes but also analyzes the correlation between fiber diameter, porosity measurements, and the performance of nonwoven fabric products. Furthermore, it offers insights into addressing industry challenges related to process settings, minimizing trial and error, costs, and energy consumption.
5. Conclusions
In this study, the VGG16, VGG19, ResNet50, and DenseNet121 models were used as classification methods for analyzing SEM images of meltblown nonwoven fabrics produced via Process 1, Process 2, Process 3, Process 4, and Process 5. The accuracy of these models differed, depending on the characteristics of the pre-trained image-based deep neural network used in each model, and the DenseNet121 model showed a high validation accuracy of 99%; thus, the possibility of applying this model to nonwoven fabric production in the textile industry was confirmed.
The criteria for classifying nonwoven fabrics produced under different process conditions were confirmed using the LRP visualization model and the Grad-CAM visualization model. When predicting the meltblown nonwoven fabric production process using SEM images, the high-weighted part was visually displayed in relation to the diameter of the fiber filaments and the contrast characteristics of the voids caused by intersection.
Heat maps can be created in different ways for the LRP and Grad-CAM models, and both models can add value to image analysis. Grad-CAM-based heatmaps do not have negative marks, so it can be a bit difficult to interpret such images in some cases. But Grad-CAM can be useful for identifying related areas step by step, and LRP can be used to identify more subdivided related pixels and parts.
LRP-based heat maps give a pixel-by-pixel detail of what affects the output, and a detailed analysis of which parts of the model have gone wrong, whereas Grad-CAM focuses on the right areas of the image. Using Grad-CAM, it is quickly and clearly expressed in what order the image features are captured for each layer, and a wider area is marked.
When constructing a learning model using filament fiber images of non-woven fabrics, LRP and Grad-CAM can be used in combination to improve the accuracy of the learning model, and they can be useful and helpful to obtain a microscopic or macroscopic understanding of the results.
The values emphasized in this study are noteworthy. Replicating a non-woven fabric with a specific diameter and porosity often entails a series of process experiments to achieve similar product types. The optimization of these processes demands substantial effort. The core significance of this study lies in its endeavor to employ deep learning models capable of discerning intricate processes using just a single SEM image with the desired diameter and porosity.


