Article

Influence of Positive Guide Vane Geometric Parameters on the Head-Flow Curve of the Multistage Pump as Turbine

1
School of Energy and Power Engineering, Lanzhou University of Technology, Lanzhou 730050, China
2
School of Environmental and Chemical Engineering, Chongqing Three Gorges University, Chongqing 404100, China
*
Author to whom correspondence should be addressed.
Processes 2023, 11(12), 3393; https://doi.org/10.3390/pr11123393
Submission received: 4 October 2023 / Revised: 4 December 2023 / Accepted: 7 December 2023 / Published: 9 December 2023

Abstract

:
In order to reduce the impact of production changes on the performances of pumps as turbines (PATs) in the process industry, it is imperative to lessen head variations at different mass flow rates. This study established a relationship equation between theoretical head and geometric parameters for multistage PATs. The influence of these parameters on the flatness of the head-flow (H-Q) curve was determined through derivation methods. The original PAT was a two-stage pump, and 12 PAT models were designed by modifying the geometric parameters of the positive guide vanes. Fluent software was employed for numerical simulations. The study found that numerical calculations aligned well with theoretical derivations for the flat H-Q curve. Considering the geometric variations in the positive guide vane, increasing the outlet placement angle, blade number, and throat area or decreasing the base circle diameter was able to flatten the H-Q curve effectively; at the best efficiency point, the throat area had the most significant impact on a slope, followed by the outlet placement angle, blade number, and base circle diameter, respectively. The individual contributions to reducing the slope were 0.53, 0.24, 0.1, and 0.09. In terms of the best efficiency point (BEP) of PATs, increasing the throat area appropriately was able to improve the BEP of the PAT by around 1.65% and shifted its BEP towards higher flow rates. However, in other cases, the BEPs all decreased. Increasing the outlet placement angle of the positive guide vane by 3° led to the BEP being reduced by 0.79%. When the number of positive guide vane blades was increased from 8 to 10, the BEP decreased by 1.24%. When the diameter of the base circle of the positive guide vane was decreased, the BEP of the turbine decreased by 0.06%. This study provides theoretical support and can serve as a reference for the design of multistage hydraulic turbines with flatter H-Q curves.

1. Introduction

As the global economy and society continue to develop, causing increases in carbon emissions and environmental damage, the pursuit of renewable energy sources has become crucial. The significant amounts of residual high-pressure liquid energy found in process industries, such as petroleum, chemical, and steel metallurgy, can be effectively conserved by utilizing pumps as turbines (PATs) [1,2]. The process pressure usually remains constant during production, and the output can be adjusted as per demand. Furthermore, the flow rate of the PAT varies. To maintain the stability of the turbine unit and meet process requirements, the head of the PAT must remain constant despite variations in flow rates. Achieving this requires a flat head-flow (H-Q) curve for the PAT.
Currently, PAT research worldwide primarily focuses on single-stage PAT, and progress has been made in selecting the appropriate PAT and optimizing performance. Hitherto, only the performance of the pump mode has tested at the factory, while the performance of the pump reverse operation remained unknown, so numerous scholars have studied performance conversion models between pumps and PATs. These models primarily reference the best efficiency point [3,4], specific speed [5,6], loss modeling [7,8], and polynomial fitting [9,10]. Based on previous performance research, the efficiency of the PAT is always lower than that of the pump, and the high-efficiency range is relatively narrow. To enhance PAT performance, geometry optimization is critical. Current studies are primarily concerned with impeller geometry. Wang et al. [11] studied the axial vortex in a PAT with s-blade impeller by computational fluid dynamics (CFD), the results showed the power loss near the impeller inlet region was heavy due to the impact of large axial vortices. Yang et al. [12] studied the effect of impeller diameter on PAT performance and found that as the impeller diameter increased from 215 to 255 mm, the flow rate, PAT efficiency, and head increased by 10.26, 36.16, and 26.14%, respectively. In a separate study, Jain et al. [13] observed that H-Q curves became steeper, while power-flow curves remained relatively flat when the impeller was trimmed. Jain trimmed the original 250 mm impeller by 10% and 20%. The results confirmed that the best efficiency point (BEP) of the PAT initially shifted toward the partial flow rate when impeller trimming was applied, and then backshifted toward a higher flow rate with further trimming. For the PAT with guide vanes, Zhou et al. [14] studied the correlation mechanism between the flow characteristics and the fluid-induced force under the compound whirl motion in the centrifugal pump. The results showed that the trend of fluid-induced force and the pressure coefficient was similar. Shi et al. [15] analyzed the effect of the number of guide vanes on the transient performance. The installation of guide vanes resulted in both a reduction in radial force and increased symmetry and homogeneity. It is considered that the optimal number of guide vanes is nine, as this leads to the lowest and most uniform radial force, as well as minimal power loss. In experimental studies by Doshi et al. [16], it was found that rounding the blades of a PAT can significantly improve its efficiency. Wang et al. [17] analyzed the effect of impeller rounding on PATs using CFD. They found that the efficiency of the rounded impeller PAT improved under all test conditions, with the increase being more evident at higher speeds. Wang et al. [18], Jiang et al. [19], and Miao et al. [20] utilized distinct algorithms to improve blade designs and achieved a notable enhancement in efficiency post-optimization. Yang et al. [21] proposed the design of forward-curved centrifugal impellers to improve the performance of the PAT. The PAT efficiency experienced significant improvement with the forward-curved impeller, and the high-efficiency scope was extended correspondingly. In a comparison of three centrifugal pumps with different specific speeds, the data indicated that the proposed design method was superior, with a 7.15% average increase in efficiency. Madina et al. [22] researched the mechanical properties of a polycarbonate matrix composite with glass fiber reinforcements used for the manufacture of centrifugal pump impeller. Yang et al. [23] took a single-stage volute PAT as the object of study, and after analyzing the effect of various geometric parameters on the H-Q curve using CFD, it was concluded that a suitable reduction in the volute tongue angle and a suitable increase in the blade outlet angle resulted in a flatter H-Q curve. Notably, the volute tongue angle had the most notable impact on the flatness of the head among all parameters.
However, there are many occasions in the process industry where the pressure head is high and the flow rate is low; for example, in the refinery’s high-pressure hydrogenation system, in the buckling zone of the amine-rich liquid flow at the bottom of the high-pressure hydrogen desulfurization tower’s high-pressure cycle, the typical pressure difference ranges from 7 to 16 MPa [24]. In this situation, the most suitable solution is to utilize a multistage centrifugal pump that is reversed as a turbine. This method enables the recovery of this high-pressure energy. However, no studies have reported the influence of the geometric parameters of a multistage PAT on the flatness of the H-Q curve, and the study of multistage PATs is rare [25,26]. Therefore, further research is necessary to achieve a flatter H-Q curve in the process industry.
In this paper, the relationship equation between theoretical head and geometric parameters for multistage PATs was established using the conservation of velocity moment and the Euler equation. The influence of these parameters on the flatness of the H-Q curve was determined by derivation methods. Additionally, we designed a research program to verify the theoretical analysis results using CFD. This study presents the impact of geometric parameters on the H-Q curve of multistage PATs. The results provide strong theoretical support and constructive comments for the design of multistage PATs with flatter H-Q curves.

2. Theoretical Analysis

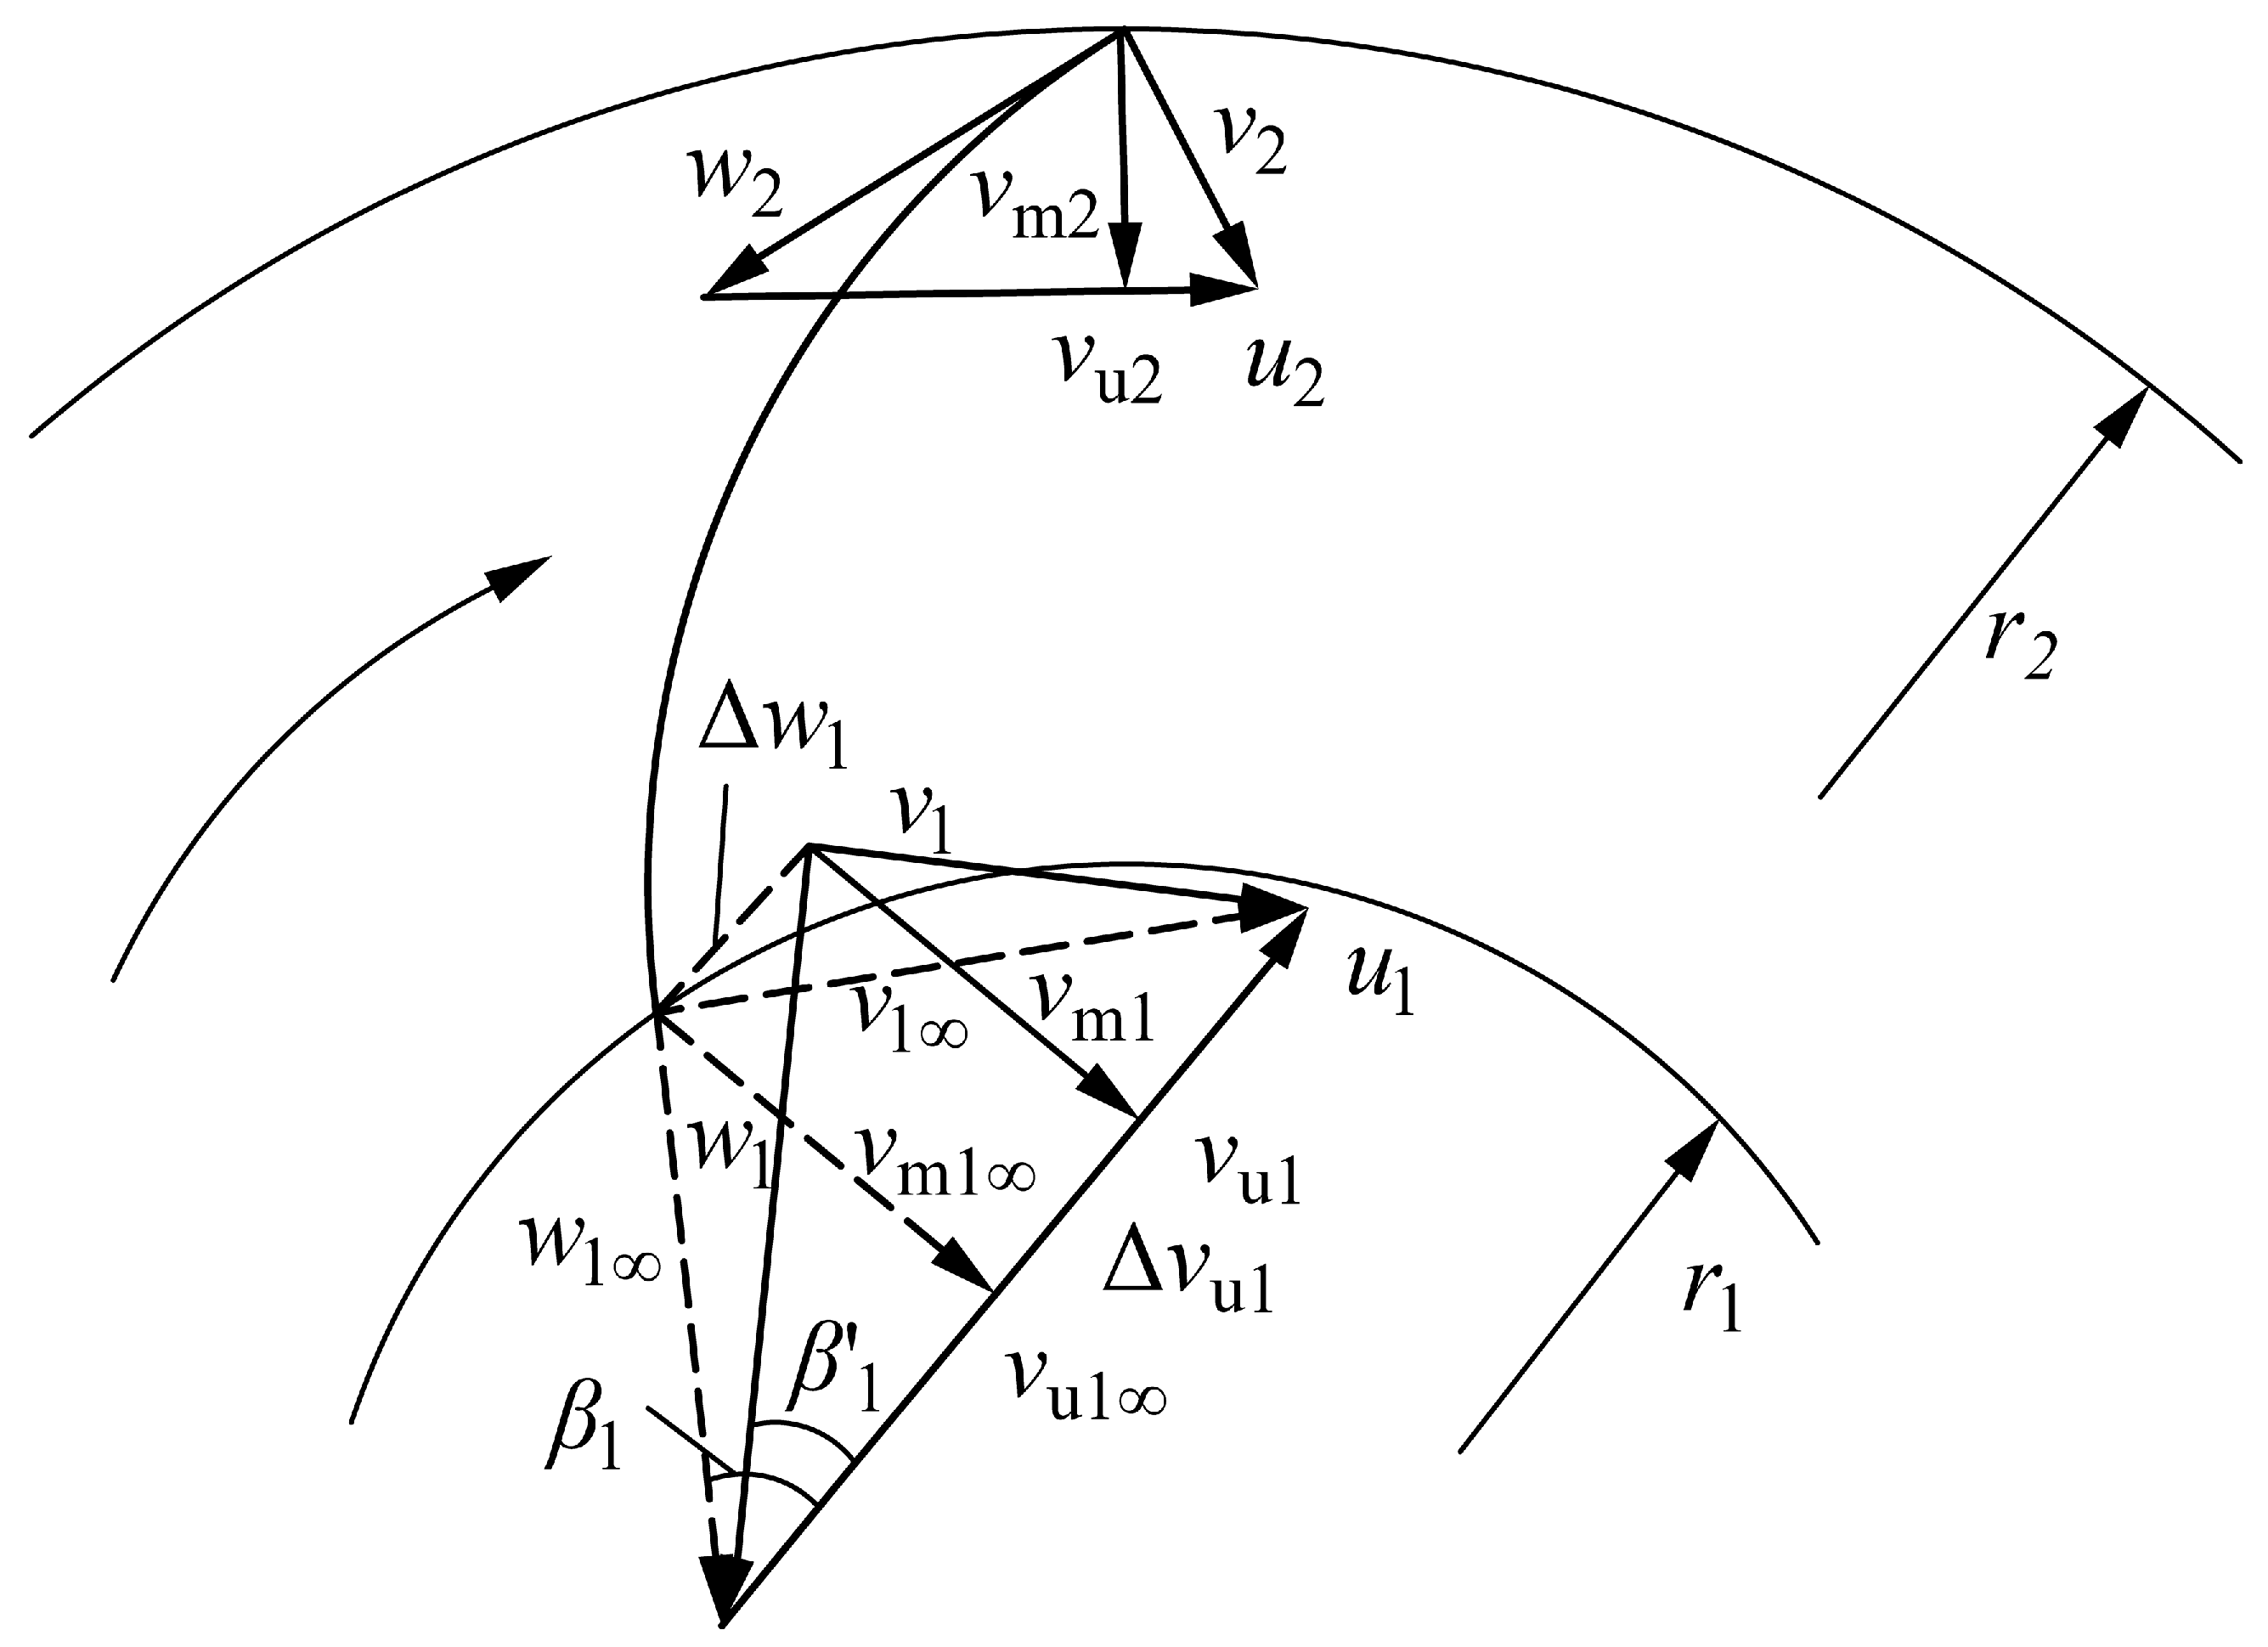
2.1. Derivation of the Theoretical Head of Guide Vane PAT

When multistage centrifugal pumps are reversed as turbines, the high-pressure liquid flows into the pump water chamber and impacts the blade after passing through the guide vane, converting the liquid energy into mechanical energy. In general, the multistage PAT at all levels of the same head, according to the Euler equation, single-stage turbine theoretical head, can be expressed as follows [27]:
H t = 1 g u 2 v u 2 u 1 v u 1
where Ht is the theoretical head.
Considering only the slip at the PAT outlet, the expected value of the theoretical head shows a slight difference from the experimental head [28]. Furthermore, the slip coefficient at the impeller outlet is defined as:
λ = u 1 v u 1 u 1 = 1 Z 0 π s i n β 1
where λ is the slip coefficient.
Velocity triangles at the impeller inlet and outlet can be shown in Figure 1, as depicted in Figure 1:
v u 1 = Δ v u 1 + v u 2 = Δ v u 1 + u 2 v m 1 c o t β 1
Substituting Equation (2) into Equation (3) yields:
v u 1 = 2 λ u 1 v m 1 c o t β 1
The outlet of the guide vane and the inlet of the impeller adhere to the conservation of velocity moments:
v u 2 r 2 = v u 3 r 3 = c o n s t a n t
Substituting Equations (4) and (5) into Equation (1) yields:
H t = 1 g u 2 v u 3 r 3 r 2 2 λ u 1 2 + u 1 v m 1 c o t β 1
where
u = π Dn 60
v m 1 = Q π b 1 D 1 ψ 1
ψ 1 = 1 Z 0 S u 1 π D 1
Figure 2 shows the velocity triangle at the guide vane outlet, as depicted in Figure 2:
v u 3 = v 3 cos α 3
where
v 3 = Q Z 1 A 3
By substituting Equations (7)–(11) into Equation (6), the theoretical head for a single stage of the multistage guide vane PAT can be obtained:
H t = π n 60 g D 3 cos α 3 Z 1 A 3 + D 1 cot β 1 b 1 π D 1 Z 0 S n 1 Q π D 1 2 n 2 π   +   Z 0 sin β 1 3600 g

2.2. Flatness Analysis of H-Q Curve of Guide Aane PAT

Assuming Q as the independent variable and Ht as the dependent variable, a first-order derivative of Ht occurs with respect to Q. This derivative reflects the slope of the H-Q curve. To evaluate the flattening of the H-Q curve of the multistage guide vane PAT, the deviation of the derivative dHt/dQ should be analyzed:
d H t d Q = π n 60 g D 3 cos α 3 Z 1 A 3 + D 1 cot β 1 b 1 π D 1 Z 0 S u 1
If the following definitions are made:
D 3 cos α 3 Z 1 A 3 = k 1
D 1 cot β 1 b 1 π D 1 Z 0 S u 1 = k 2
Substituting Equations (14) and (15) into Equation (13) yields:
d H t d Q = π n 60 g k 1 + k 2
From Equation (16), it is evident that the slope of the H-Q curve is determined by k1 and k2. Of these, k1 is determined by the geometric parameters of the guide vane, while k2 is dependent on the geometric parameters of the impeller. By substituting values for k1 and k2 from over 20 hydraulic models of multistage guide vane centrifugal pumps in certain pump factories, the ratio of k1 to k2 is obtained within the range of 2.1~4.5. The slope of the H-Q curve is primarily influenced by the geometric properties of the guide vane. Due to the limited length of this article, the discussion of the impeller’s effect on the H-Q curve will be postponed to a later date.
Derivation of Equation (12) on the geometrical parameters of the guide vane, respectively, leads to the second-order mixed partial derivatives of the Ht with respect to Q and the geometrical parameters, and judging the positive and negative values of the second-order partial derivatives leads to the monotonic variation of the slope values with respect to the geometrical parameters. Evidently,
2 H t Q α 3 < 0 2 H t Q Z 1 < 0 2 H t Q A 3 < 0 2 H t Q D 3 > 0
Therefore, in order to make the H-Q curve of the guide vane PAT flat, the outlet placement angle α3, blade number Z1, and throat area A3 should be increased or the guide vane base circle diameter D3 should be reduced for the guide vane.

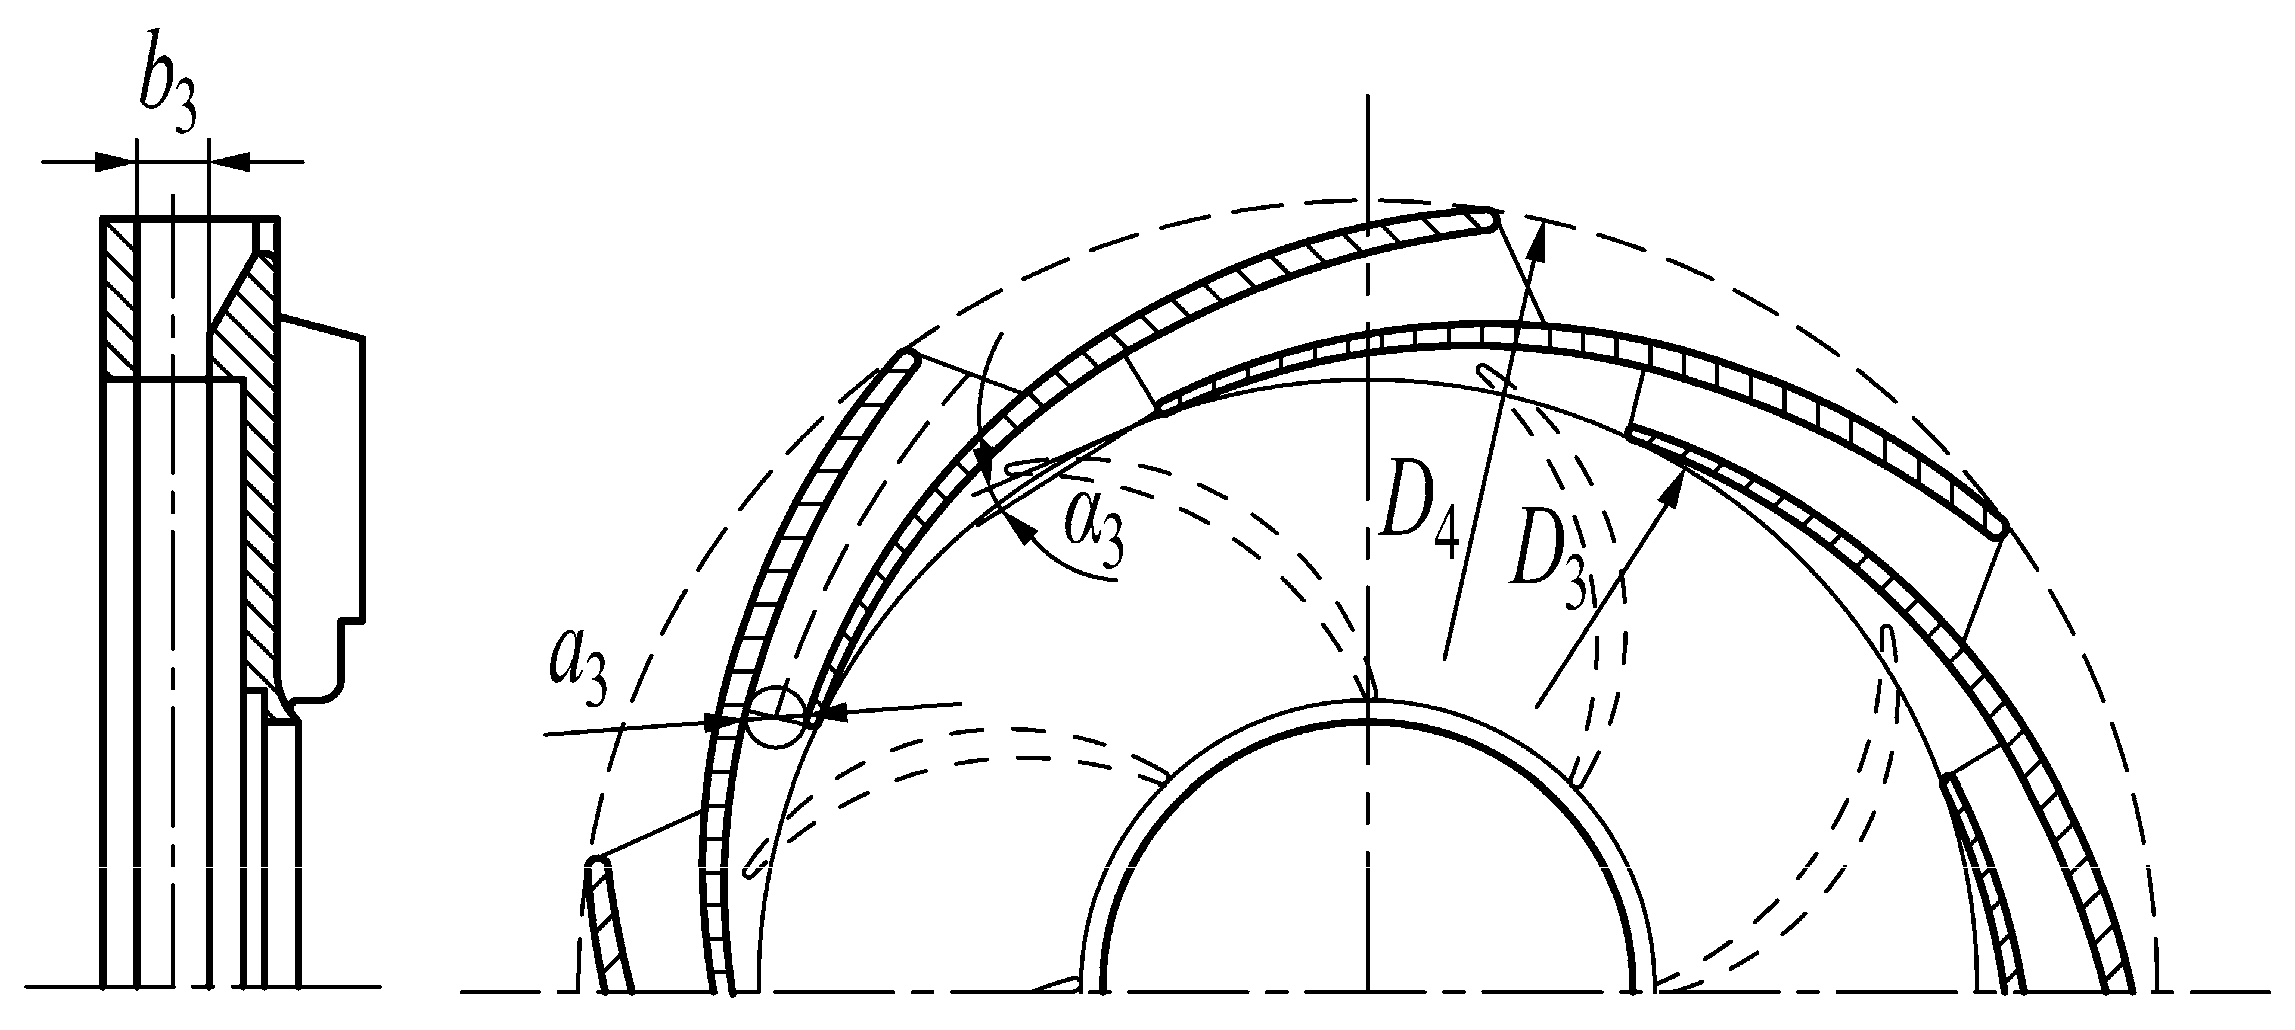
3. Original PAT and Scheme Design

Considering the computational accuracy and time, a two-stage centrifugal pump was chosen as the original PAT, abbreviated as OT. The pump had been designed for a flow rate of 85 m3/h, a single-stage head of 80 m, and a rotational speed of 2950 r/min. The relevant geometrical dimensions of OT, named after the turbine condition, are detailed in Table 1.
After substituting the geometric parameters in Table 1 into Equations (14) and (15), k1/k2 = 4.1 is obtained. This paper only considers the influence of the geometric parameters of the positive guide vane k1 on the H-Q curve. The guide vane plane diagram is shown in Figure 3.
Based on the constant size of the guide vane axial surface, four study programs were established using the control variable approach. Scheme A was to increase the placement angle of the positive guide vane outlet α3; Scheme B was to increase the number of positive guide blades Z1; Scheme C was to increase the positive guide vane throat area A3; Scheme D was to reduce the diameter of the base circle of the positive guide blade D3. All four schemes were proposed as potential improvements.
All research programs were precisely designed in AutoCAD 2016 software, with the positive guide vane geometry kept within a feasible range. Scheme A changed the blade profile and kept the throat area A3 unchanged, and appropriately reduced the outer diameter D4 of the positive guide vane; Scheme B changed the throat area A3 after changing the number of guide vanes Z1, adopting the method of adjusting the guide vane inlet width b3 to keep the throat area A3 constant, and adopted the form of the mutually prime between the number of guide vanes Z1 and the number of impeller blades Z0; Scheme C increased the throat area A3 by changing the blade profile while keeping the guide vane outlet placement angle α3 unchanged and appropriately increasing the outer diameter of the positive guide vane D4; Scheme D was consistent with the throat area A3 of the original model after changing the base circle diameter D3 of the positive guide vane. The parameters of the positive guide vanes of different research programs are shown in Table 2. A1, B1, C1, and D1 were the control groups for each program to make the H-Q curve steep.

4. Numerical Investigation
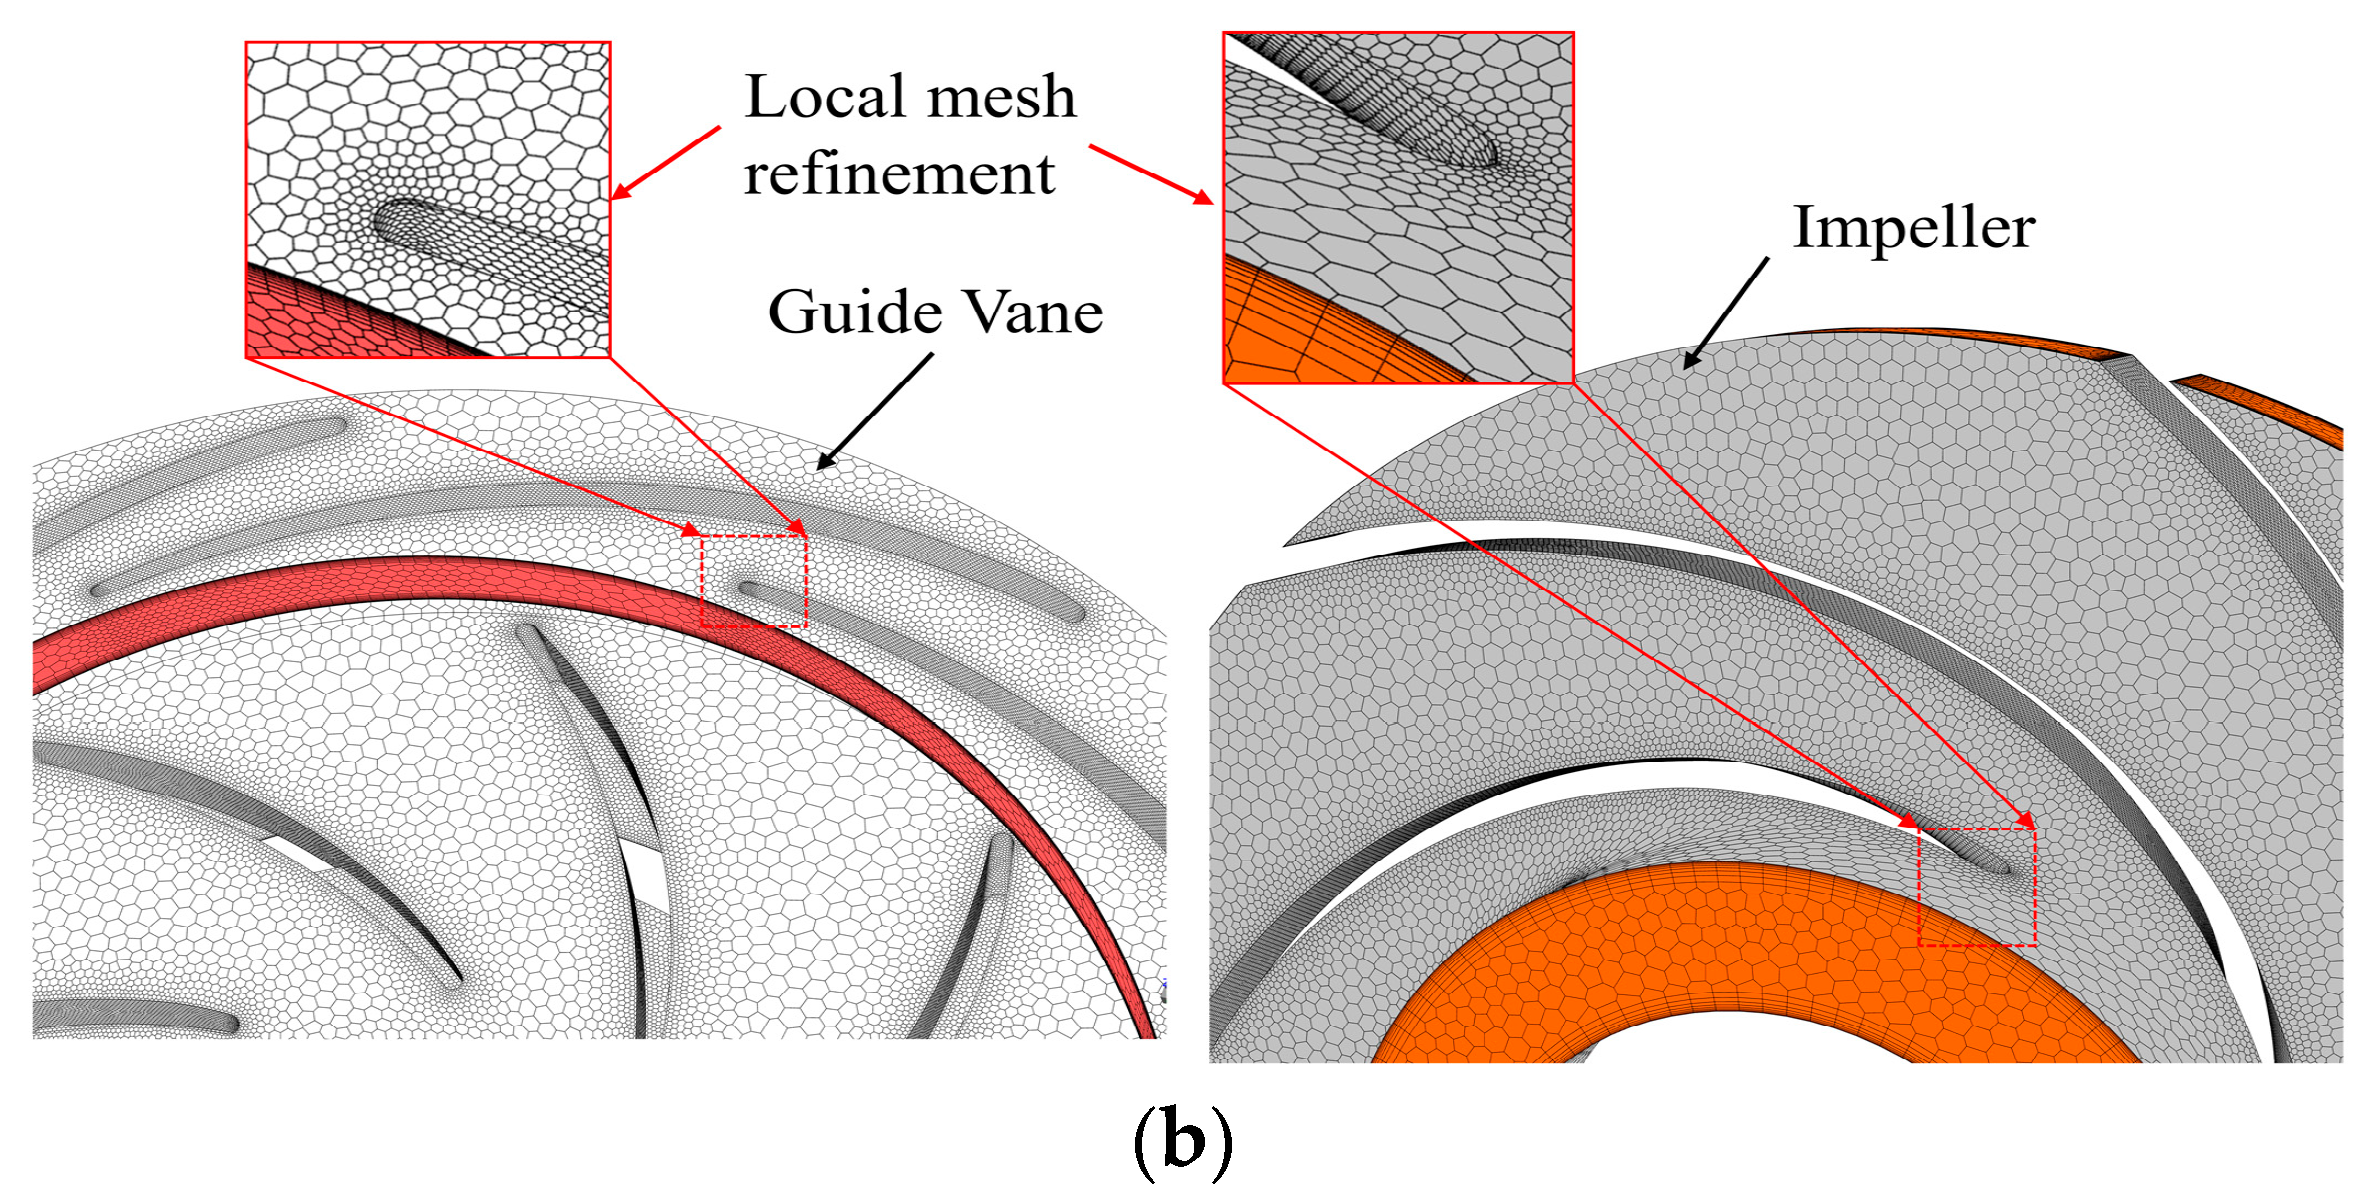
4.1. CFD Model

CFD is a much more cost-effective research method than experimental research. We set up CFD models for all research schemes. Only the original PAT was experimentally verified, while other schemes were studied by CFD. The PAT models were created on Croe 8.0 software. The geometrical model consisted of an annular inlet volute, annular outlet volute, wear ring, impeller, front and back chamber, and radial guide vanes. Hybrid meshing was performed using ICEM and ANSYS Fluent 2022R2 software. The pump chamber and wear ring with a small size were structurally meshed using ANSYS ICEM 2022R2 software, while the other parts were meshed non-structurally using the ANSYS Fluent-Meshing 2022R2 software, which has better adaptability. The guide vane and impeller were properly encrypted, and the turbine inlet and outlet were adequately extended. The original PAT geometrical model and the local meshes of its main components’ guide vanes and impellers are displayed in Figure 4.

4.2. Solution Parameters

ANSYS Fluent 2022R2 software is used to carry out stable numerical calculations. Based on the Navier–Stokes equation, the RNG k-ε model was chosen for flow analysis due to its greater precision in calculating high strain rate and intricate flows in PATs [29]. The impeller wall and adjacent chambers at the front and rear were identified as the rotating wall, while all other components were deemed static. The working fluid was clean water with a temperature of 25 °C. The surface roughness of all walls in the flow region was set to 50 μm. The inlet boundary was assigned as the velocity inlet, and the outlet boundary was the static pressure outlet. The static pressure was set at 0.5 MPa, and a convergence criterion of 10−5 was implemented for the momentum and mass equations. The corresponding simulation results were obtained by changing the mass flow. Finally, the performance curve was able to be drawn.

4.3. Mesh Independence Test

Table 3 shows the mesh independence test results for the original PAT at the best efficiency point. The head stabilized gradually as the mesh number increased. The head error of case 1 and case 2 was +2.77%, the head error of case 2 and case 3 was +0.26%, and the head error of case 3 and case 4 was −0.16%. When the number of mesh exceeded 5.16 million, the head change was less than 0.5%. Case 2 was selected as the calculation mesh, taking into account accuracy and computing resources. In case 2, the grid number of the guide vane was 1254816, the grid number of the impeller was 1554763, the grid number of the volute was 1753244, and the grid number of the chamber was 600525. The number of meshes in other research schemes was similar.

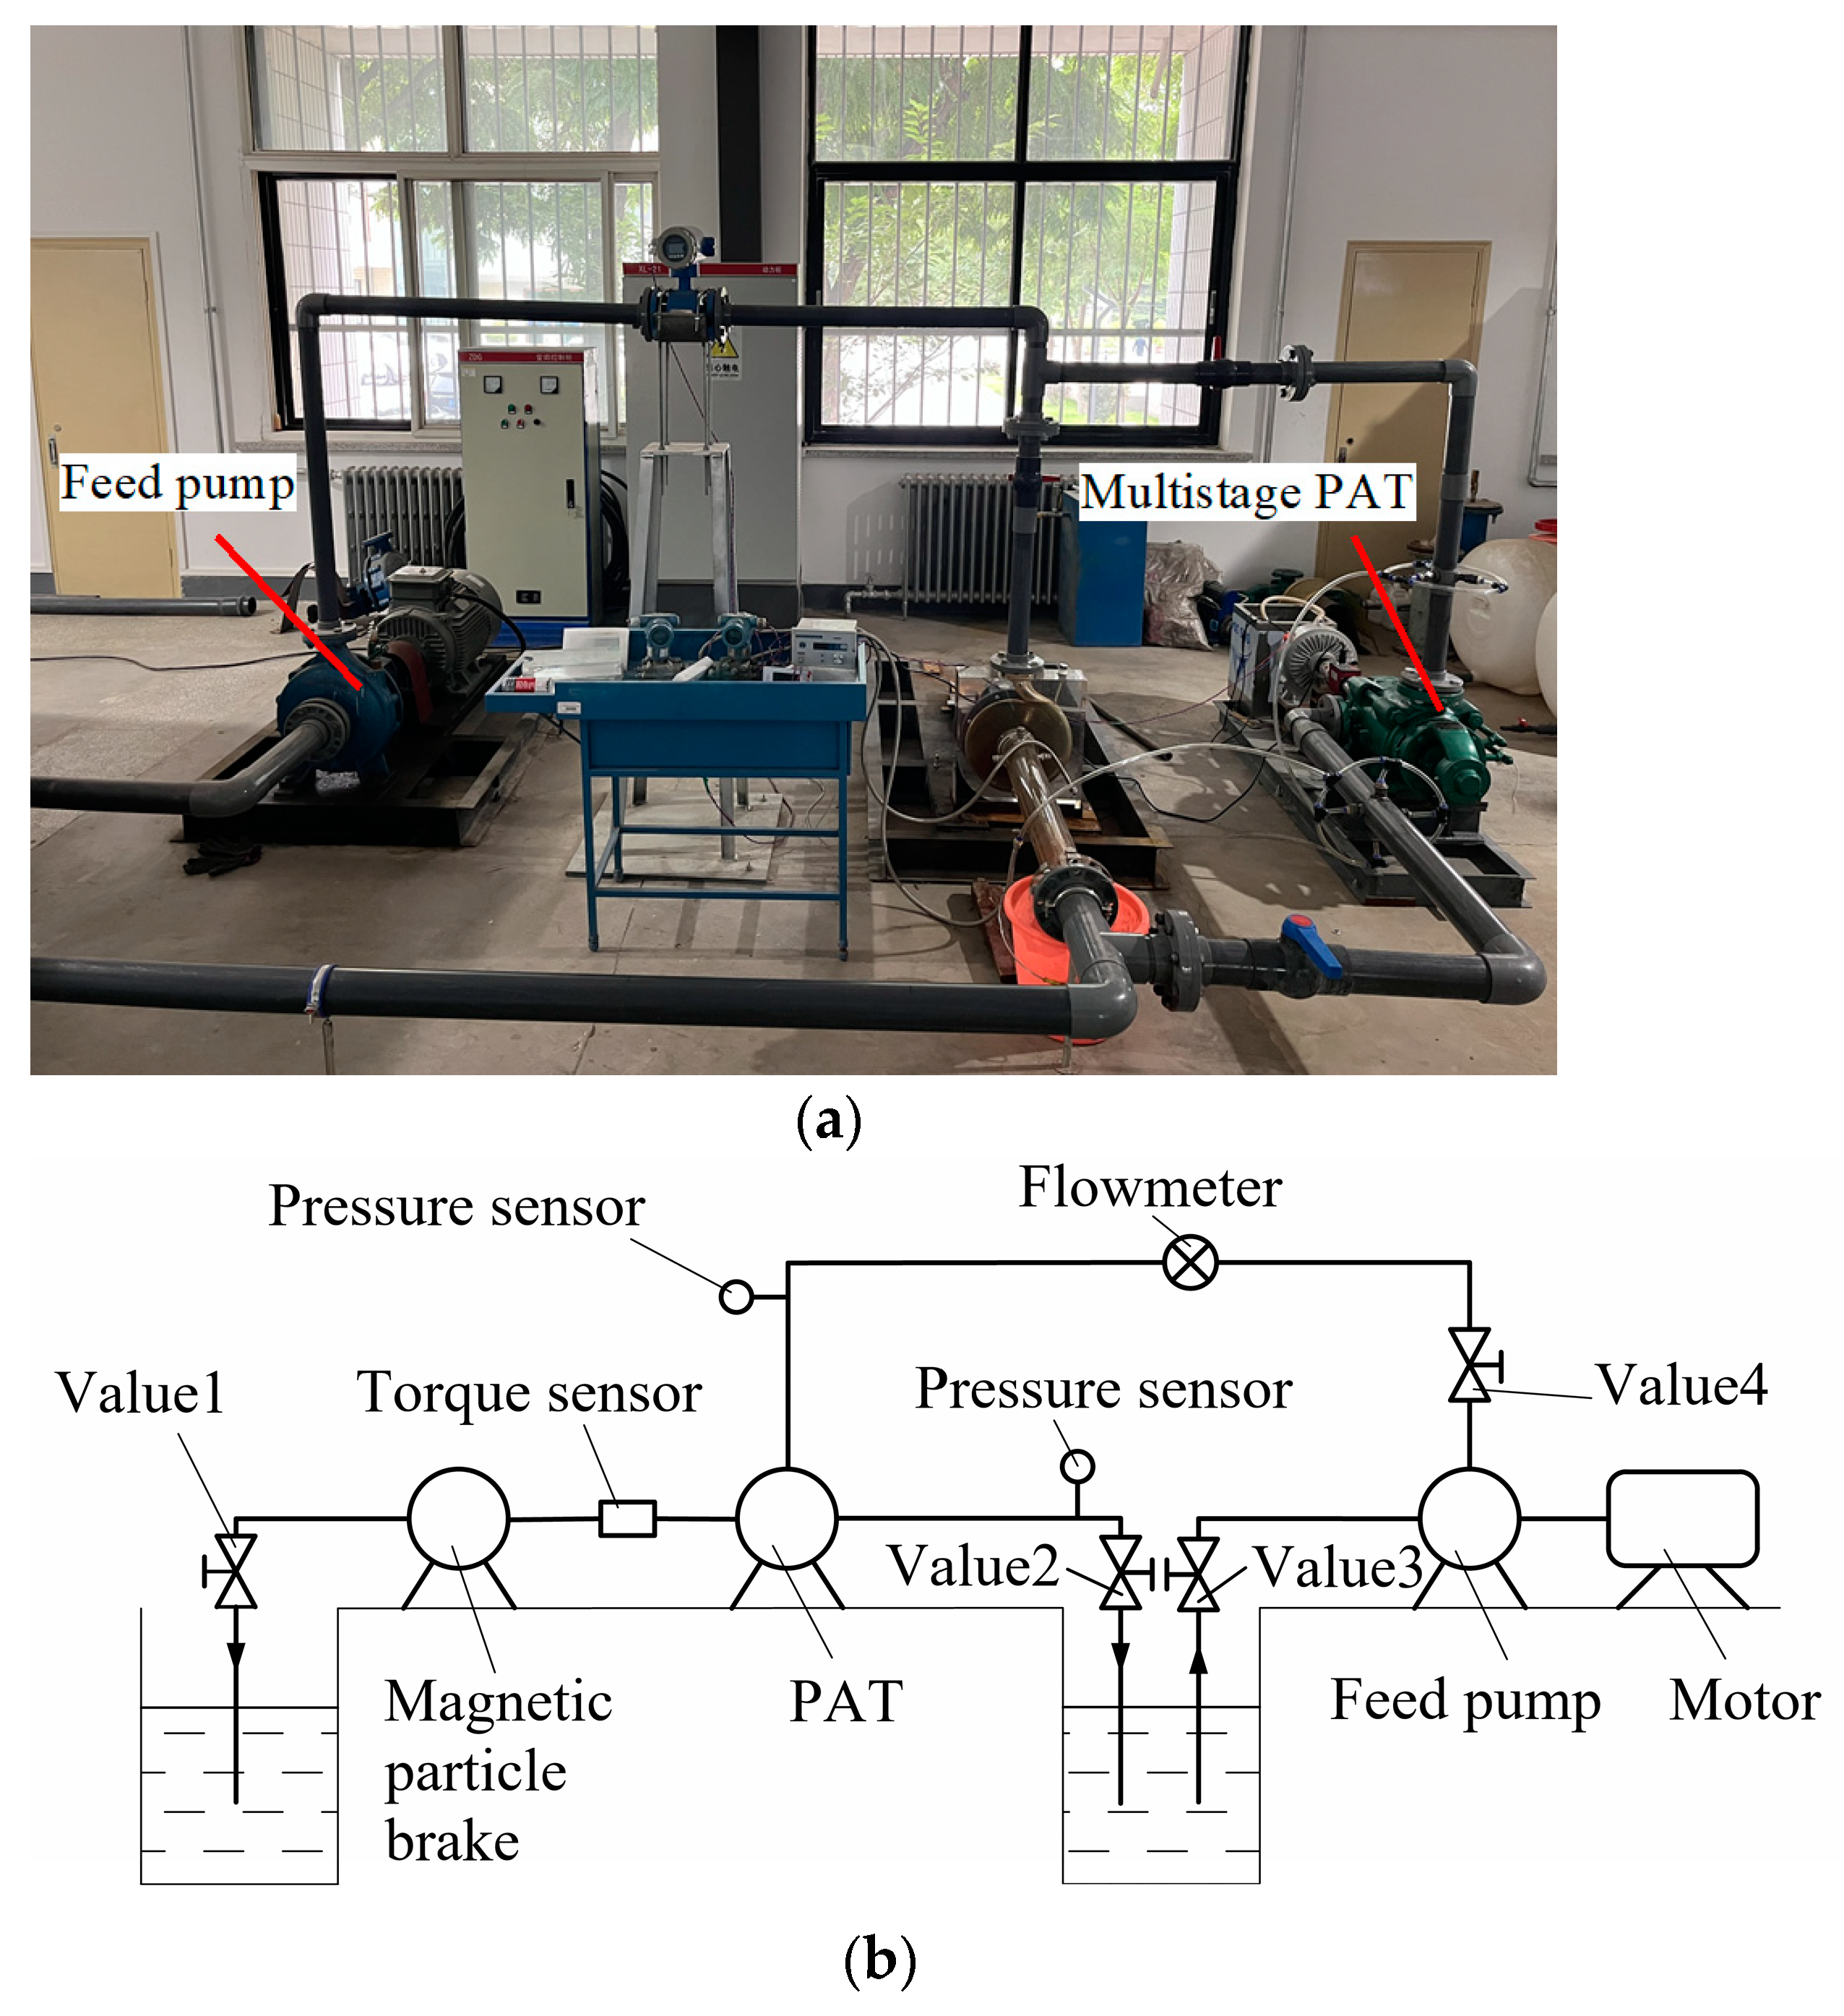
4.4. Experimental Research

To verify the accuracy of the numerical simulation, a PAT test bench was set up at Lanzhou University of Technology. The test site and schematic diagram are shown in Figure 5. A feed pump powered by a motor supplied the high-pressure liquid needed for the PAT. The magnetic particle brake absorbed the output power generated by the high-pressure fluid flowing through the PAT. Differential pressure sensors were fitted at the PAT inlet and outlet to measure the differential pressure. Additionally, an electromagnetic flow meter was fitted in the PAT inlet to determine the flow rate, and a torque meter was applied at the outlet to measure the rotational speed and torque. The electromagnetic flowmeter had a measuring range of 0.9044~217.03 m3/h with an accuracy of ±0.1%. The torque sensor had a range of 0–800 N, with an accuracy of ±0.1%. The differential pressure sensor had a range of 0~10 MPa with an accuracy of ±0.2%.
The CFD results and test results of the original PAT are shown in Figure 6. As depicted in Figure 6, the trends of the performance curves obtained through CFD were in good agreement with those obtained through experimentation. The CFD efficiency was greater than the testing value, primarily due to the disregarding of the mechanical loss from mechanical seals and bearings along with volumetric loss from balancing holes during numerical calculations. The test results for head and efficiency at the optimum efficiency point showed a deviation of within 2% from the CFD outcomes, which was well within acceptable error tolerance. Hence, it can be inferred that the method employed in this study can accurately forecast the performance of the PAT.

5. Results and Discussion

The numerical simulation comparison of H-Q and η-Q curves for PAT models of different schemes are displayed in Figure 7.
As shown in Figure 7a, with the increase in the placement angle of the positive guide vane outlet (α3), the head decreased gradually under all working conditions, which was consistent with Equation (12) of the single-stage theoretical head of the multistage guide vane PAT. The slopes of the H-Q curve also gradually decreased, while the H-Q curve became flat as α3 increased, which was consistent with the theoretical analysis. In the derived Equation (17), the second-order mixed partial derivative was used to determine the slope change, and the conclusion was that in order to flatten the H-Q curve, α3 needed to be increased. Nevertheless, as α3 continued to increase, the curve’s slope gradually decreased. Additionally, there was a significant reduction in the PAT efficiency under low flow conditions.
As shown in Figure 7b, the head decreased as the number of positive guide vanes (Z1) increased, which was also consistent with the derived Equation (12). The increase in the number of Z1 resulted in a slight decrease in the slopes of the H-Q curve, causing the curve to flatten, which was in line with the theoretical analysis. This was also the result of Equation (17). However, as Z1 changed, the slope of the curve decreased continuously, leading to a decrease in PAT efficiency and a narrowing of the high-efficiency zone.
As shown in Figure 7c, when the throat area of the positive guide vane (A3) increased, the head decreased in all cases, which was consistent with Equation (12) of the single-stage theoretical head of the multistage guide vane PAT. The slopes of the H-Q curve all decreased significantly with the increase in A3, which was consistent with the theoretical analysis, but the decreasing amplitude also gradually slowed down. In the derived Equation (17), the second-order mixed partial derivative was used to derive the change in slope, and the conclusion was that in order to flatten the H-Q curve, α3 had to be increased. Additionally, as A3 increased, the maximum PAT efficiency gradually increased at a slowing rate, and the efficiency point shifted towards a higher flow rate. Therefore, for the object of study, there was an optimal A3 that had the highest efficiency while making the power curve flatter.
As shown in Figure 7d, when the diameter of the base circle of the positive guide vane (D3) was reduced, the head of the multistage PAT was also reduced in all cases, which followed the deduction of Equation (12). The slopes of the H-Q curves decreased gradually when the diameter of the positive guide vane base circle (D3) was reduced, which was in line with the theoretical analysis of Equation (17). However, the change range was minimal, and there was little difference in efficiency near the high-efficiency zone. Turbine efficiency gradually decreased under low-flow conditions.
The best efficiency point of the original PAT (OT) was Qb = 170 m3/h, as illustrated in Figure 7. Other research schemes utilized the slope of each curve at Qb to determine the change in curve flatness. Table 4 displays the results of the H-Q curve slope and maximum efficiency for each research scheme.
The results of Table 3 indicate a decrease in the slopes of the head in Schemes A, B, C, and D, which aligns with the theoretical derivation. The theoretical results obtained from Equation (17) using the second-order mixed partial derivatives are completely consistent, which shows that for this second-order PAT, our numerical results can support the theoretical results. Specifically, the effect of each parameter varied. When the C scheme increased A3, the H-Q curve experienced significant changes, leading to a 0.53 decrease in the slope of Scheme C3 compared to the original model OT. Additionally, the slope of Scheme A slightly increased while α3 decreased, and the slope of Scheme A3 decreased by 0.24. Subsequently, the slope of the H-Q curve decreased slightly after Scheme B increased Z1, and Scheme D reduced D3, resulting in decreases in the slopes of B3 and D3 of 0.11 and 0.09, respectively. The findings demonstrate that the throat area had the greatest impact as a positive guide vane geometry parameter in maintaining a flat H-Q performance curve at best efficiency. Subsequently, the positive guide vane outlet placement angle had a significant effect. The quantity of positive guide vane blades and the size of the positive guide vane base circle had a relatively minimal influence on the slopes of the curve.
Compared to the BEP of the original model OT, the BEP of Scheme A improved by 1.65%, whereas the BEP of Schemes B, C, and D decreased by 0.79%, 1.24%, and 0.06%, respectively. Additionally, Scheme D’s best efficiency decreased to a lesser extent. This study confirms that the BEP of the multistage PAT rises with a greater area of the throat in the positive guide vane. Conversely, the BEP of the PAT decreases with the rise in the positive guide vane outlet angle and the blade number, or the reduction in the diameter of the base circle of the positive guide vane.
As a suggestion for achieving a flatter H-Q curve with a multistage PAT, we propose that the optimal method is to enlarge the throat area of the positive guide vane to create a flatter H-Q curve compared to other methods. Additionally, the outlet angle of the positive guide vane could be increased, resulting in a flatter H-Q curve. In the other two methods, when increasing the number of positive guide blades and reducing the diameter of the base circle of the positive guide vane, the H-Q curve becomes somewhat flatter, but not significantly. Increasing the throat area results in an increase in BEP and a tendency towards higher flow rates, making it ideal for the process industry where output is higher. Meanwhile, raising the outlet angle of the positive guide vane maintains the efficiency curve’s similarity to the original, with only minor alterations observed. In the actual optimization design, one can conduct an orthogonal test to modify the geometric parameters, resulting in a smoother H-Q curve and increased efficiency.

6. Conclusions

This study provides a theoretical derivation of the equation for multistage PAT geometric factors considering H-Q curve flatness, and establishes the resulting law of influence. Additionally, this work analyses the influence of positive guide vane geometric parameters on the flatness of the H-Q curve in a two-stage PAT via CFD. The results of the numerical simulations corroborate the theoretical derivation for this particular case. However, it is necessary to present further research regarding the applicability of other types of PAT in the future. Moreover, studies investigating the impact of the impeller’s geometric parameters on the flatness of the H-Q curve of the multistage PAT will need to be carried out in the future. The primary results of this paper can be summarized as follows:
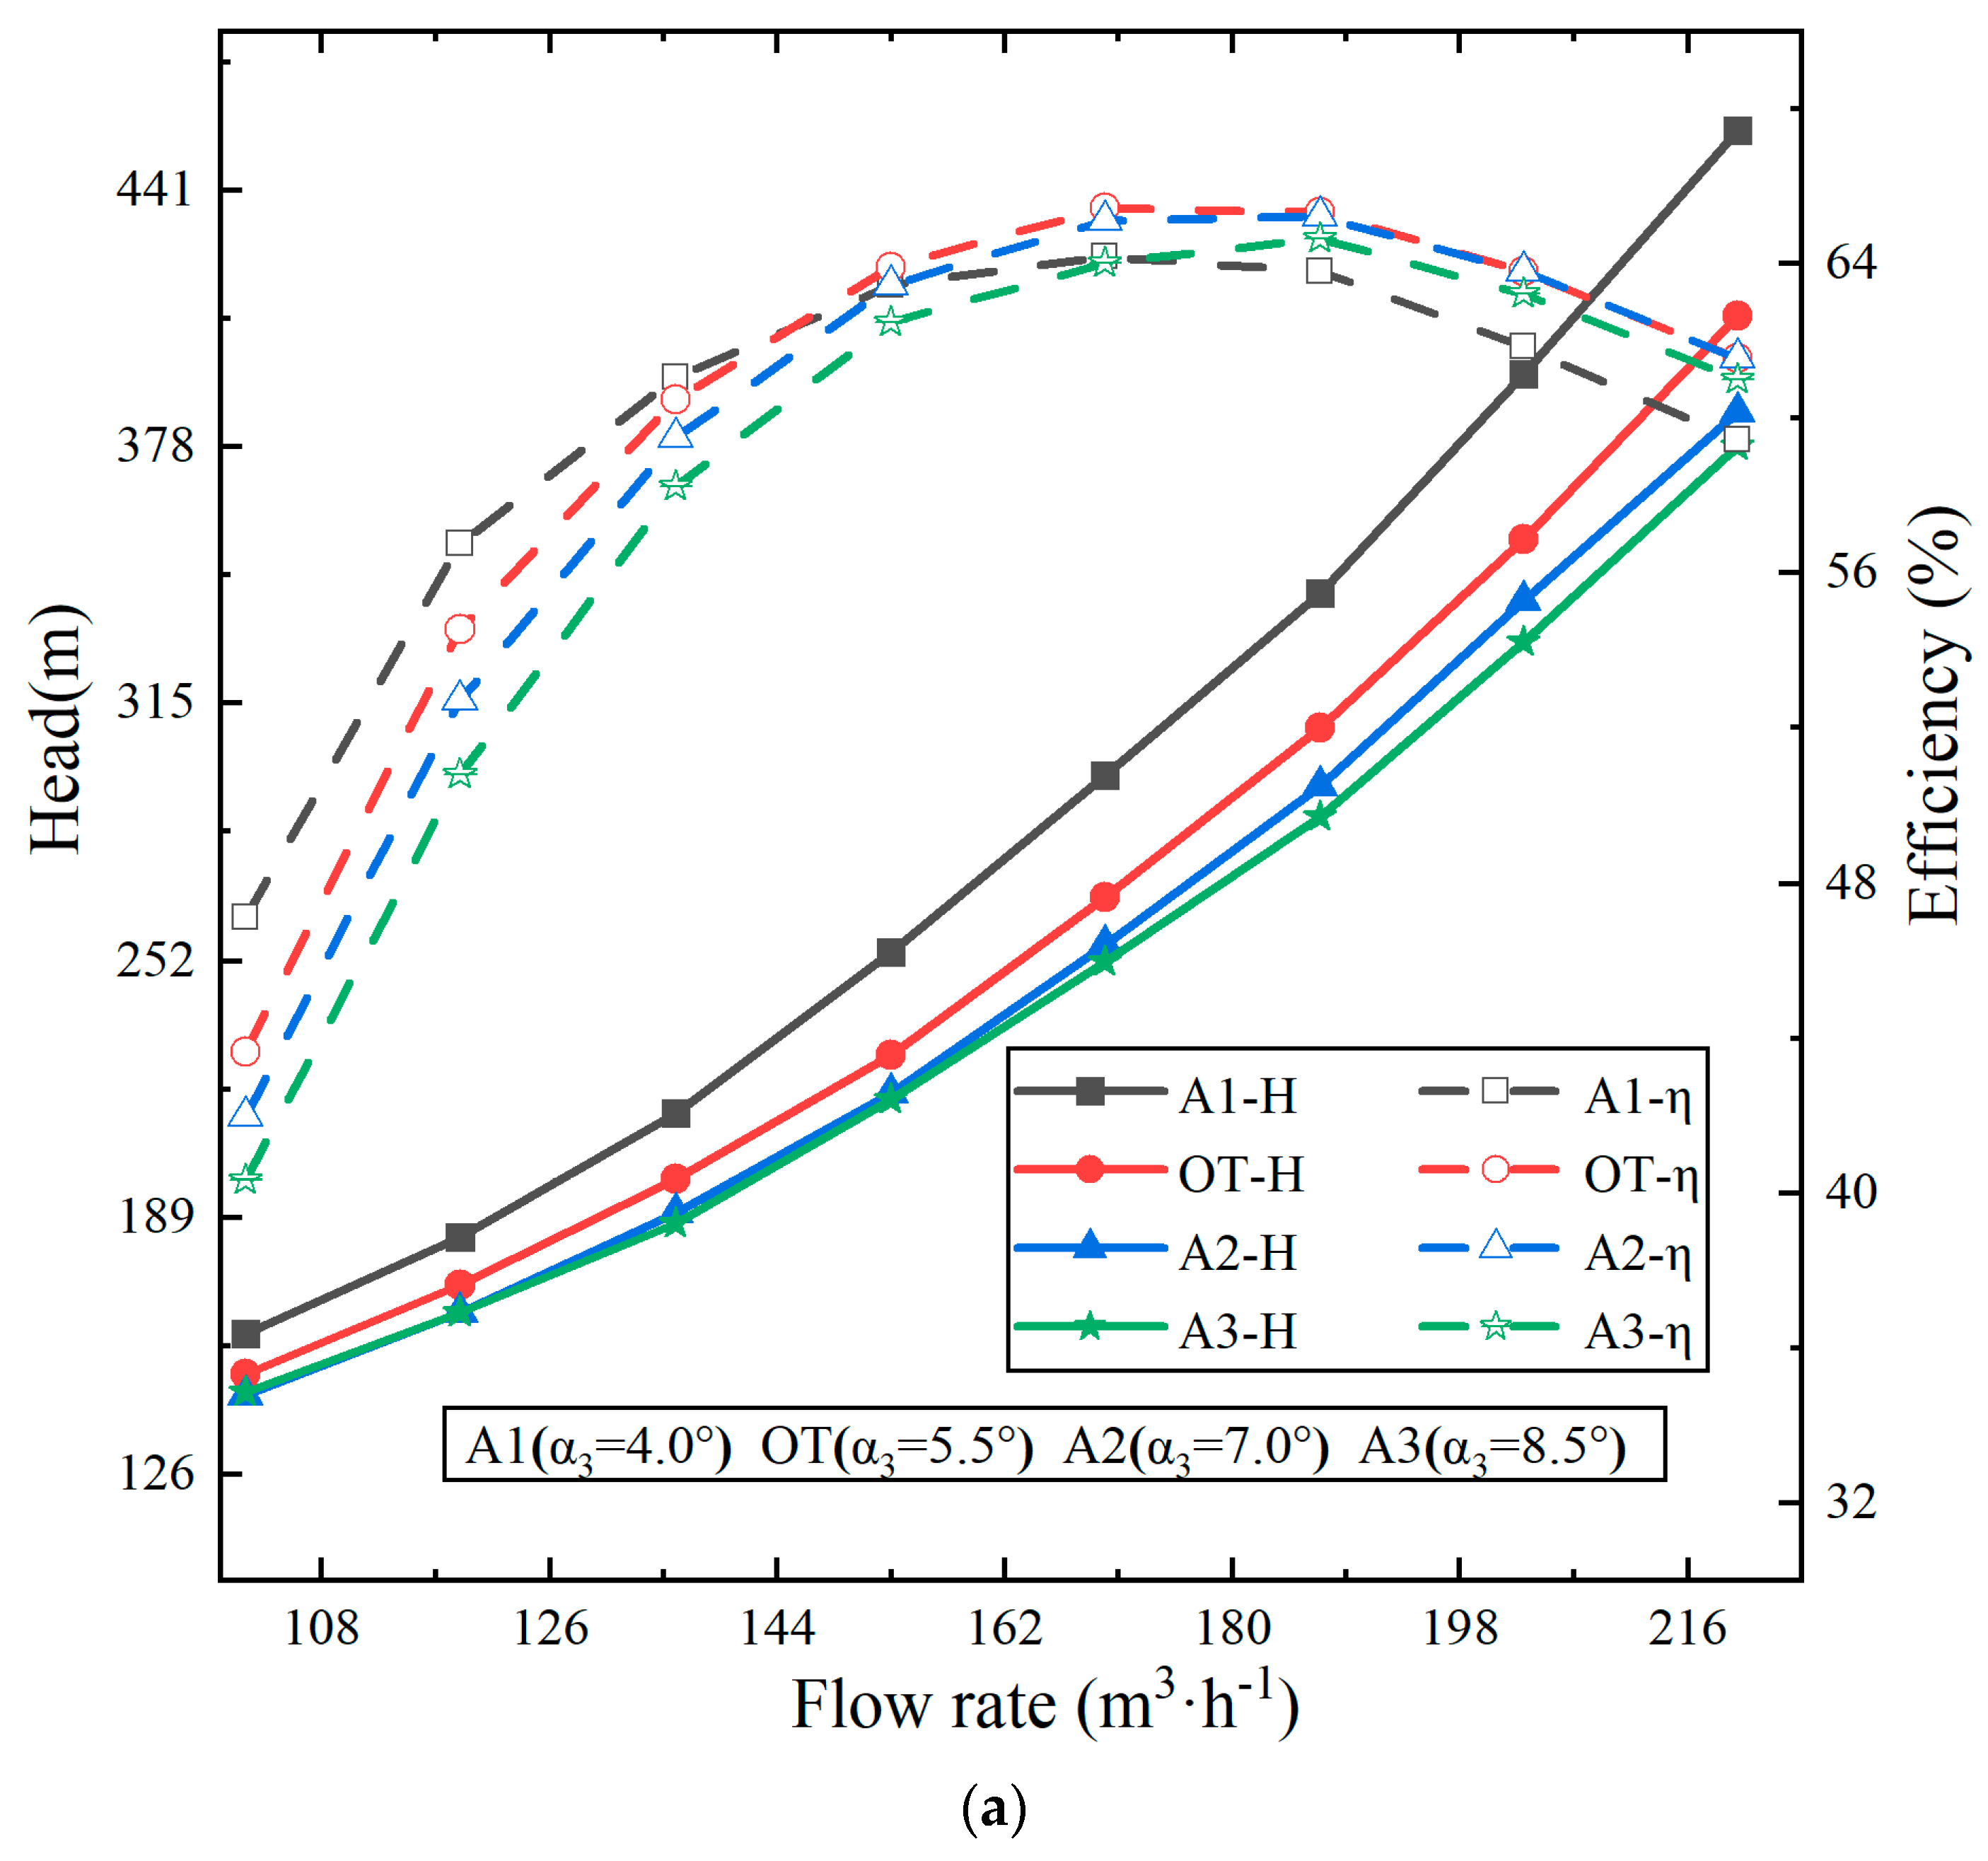
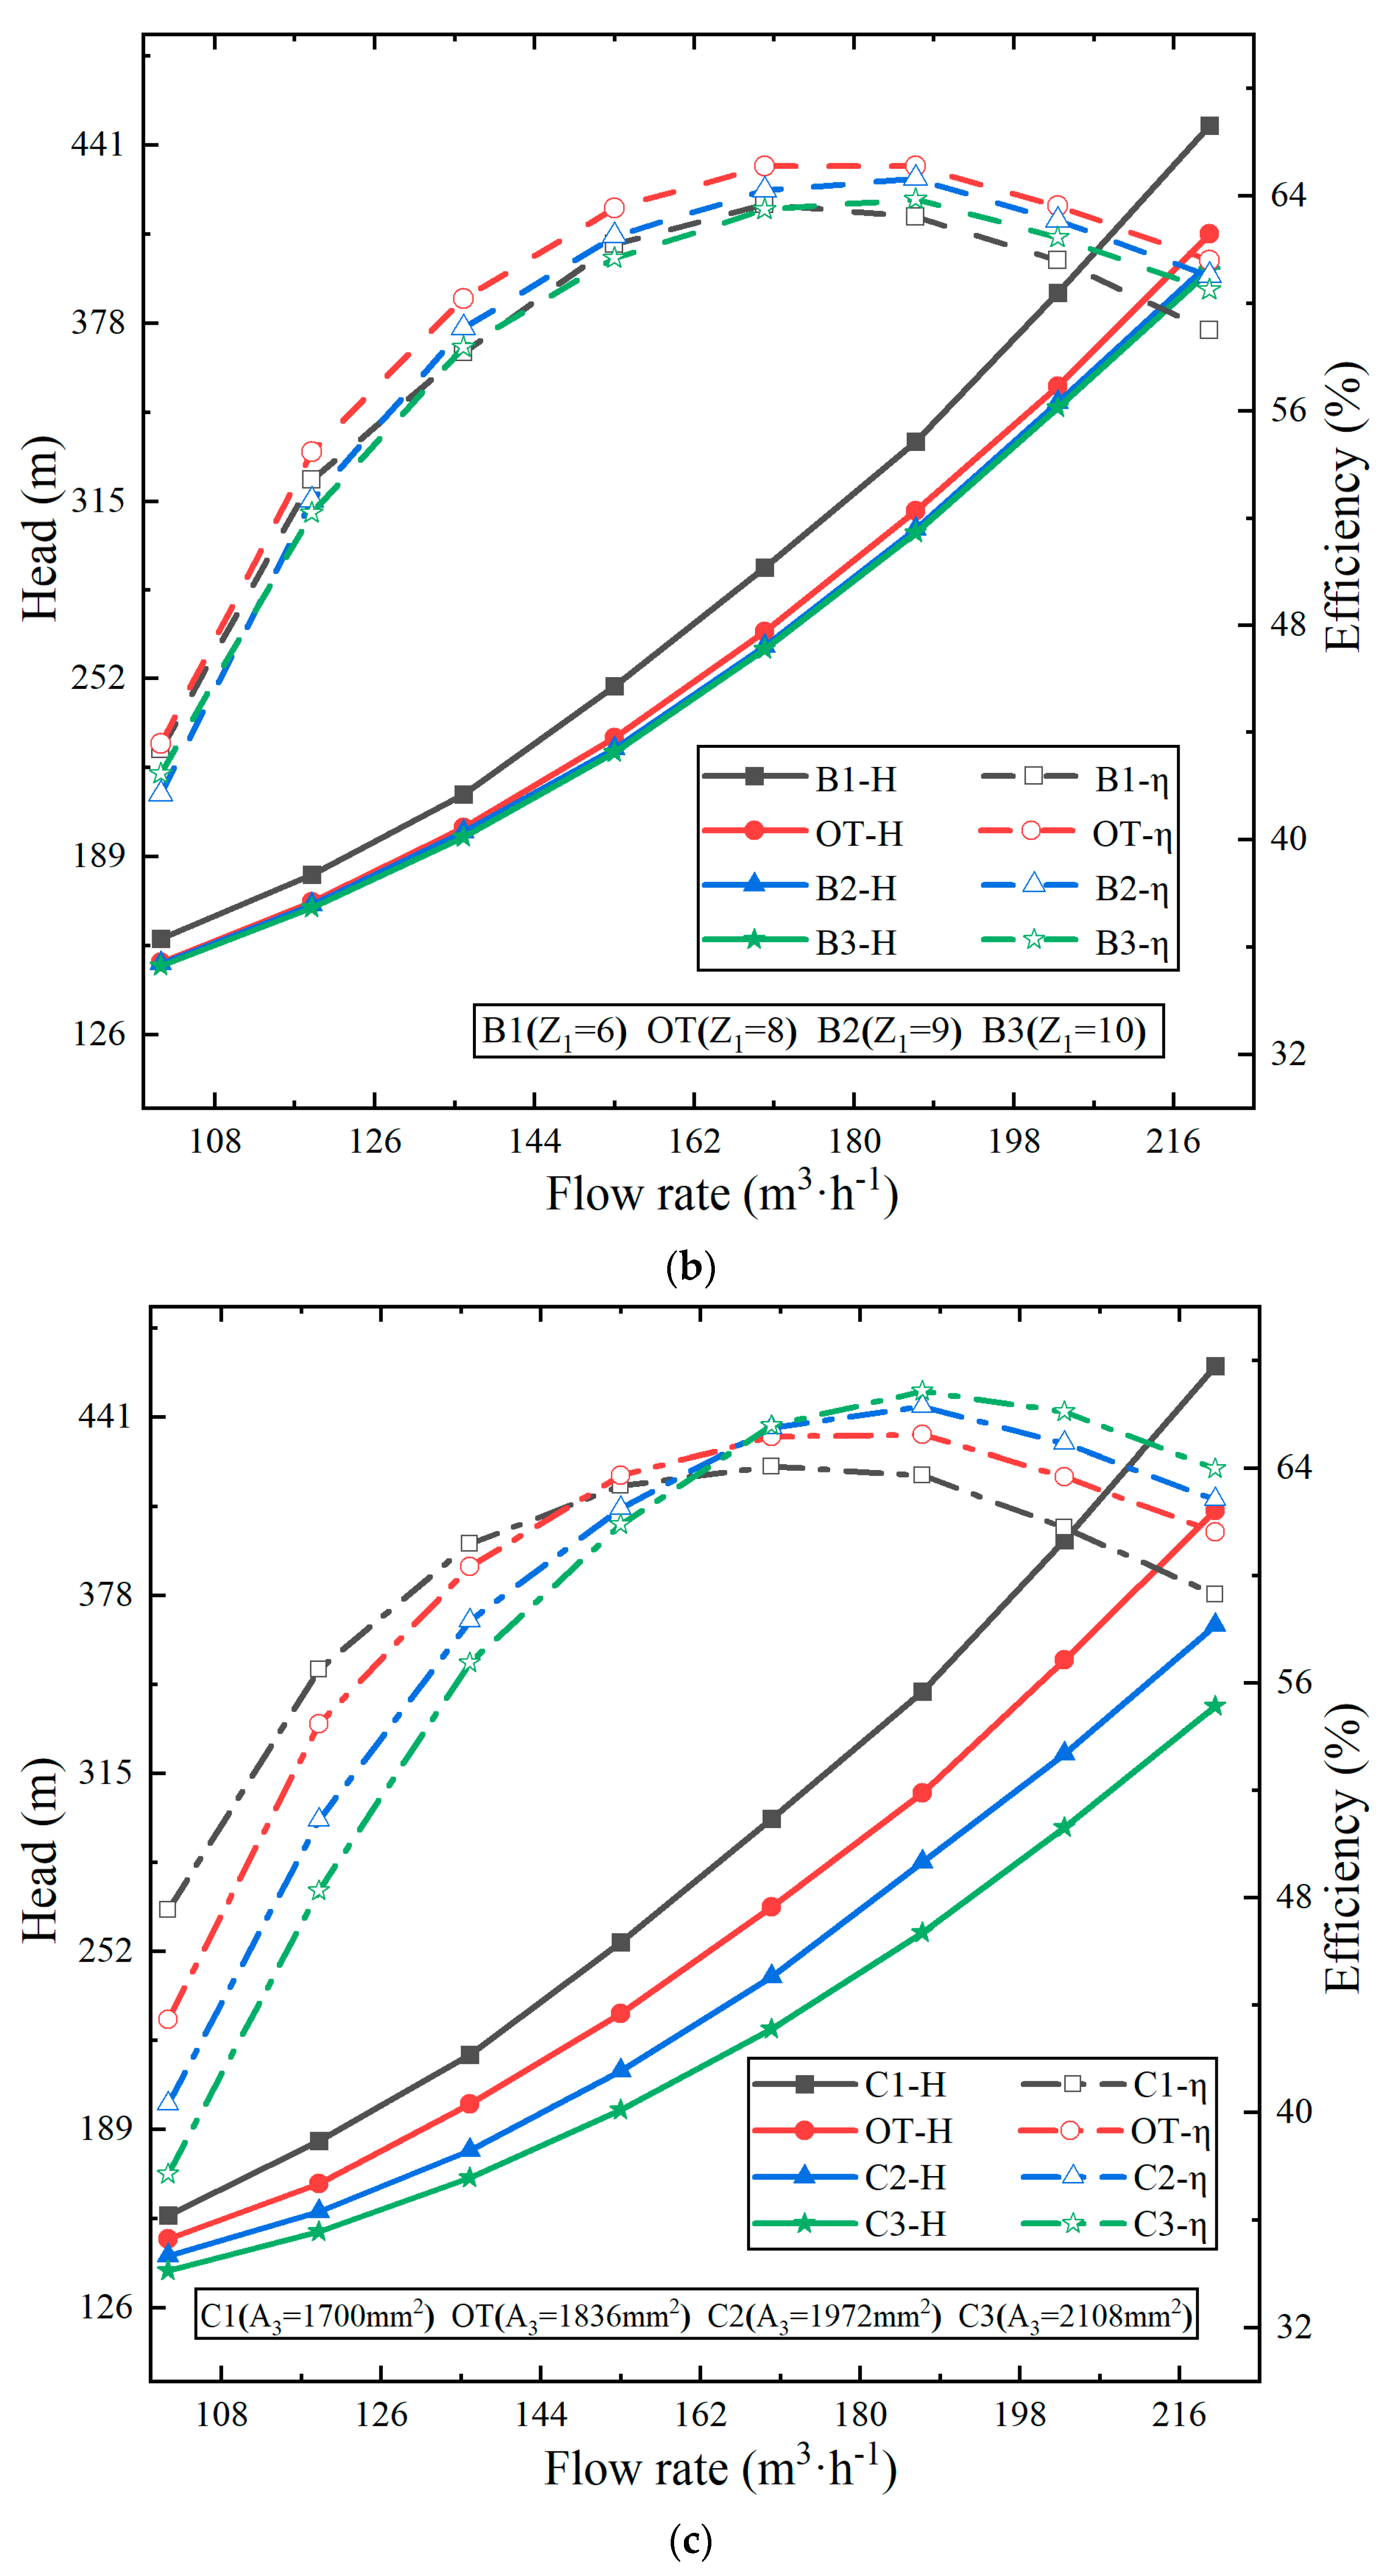
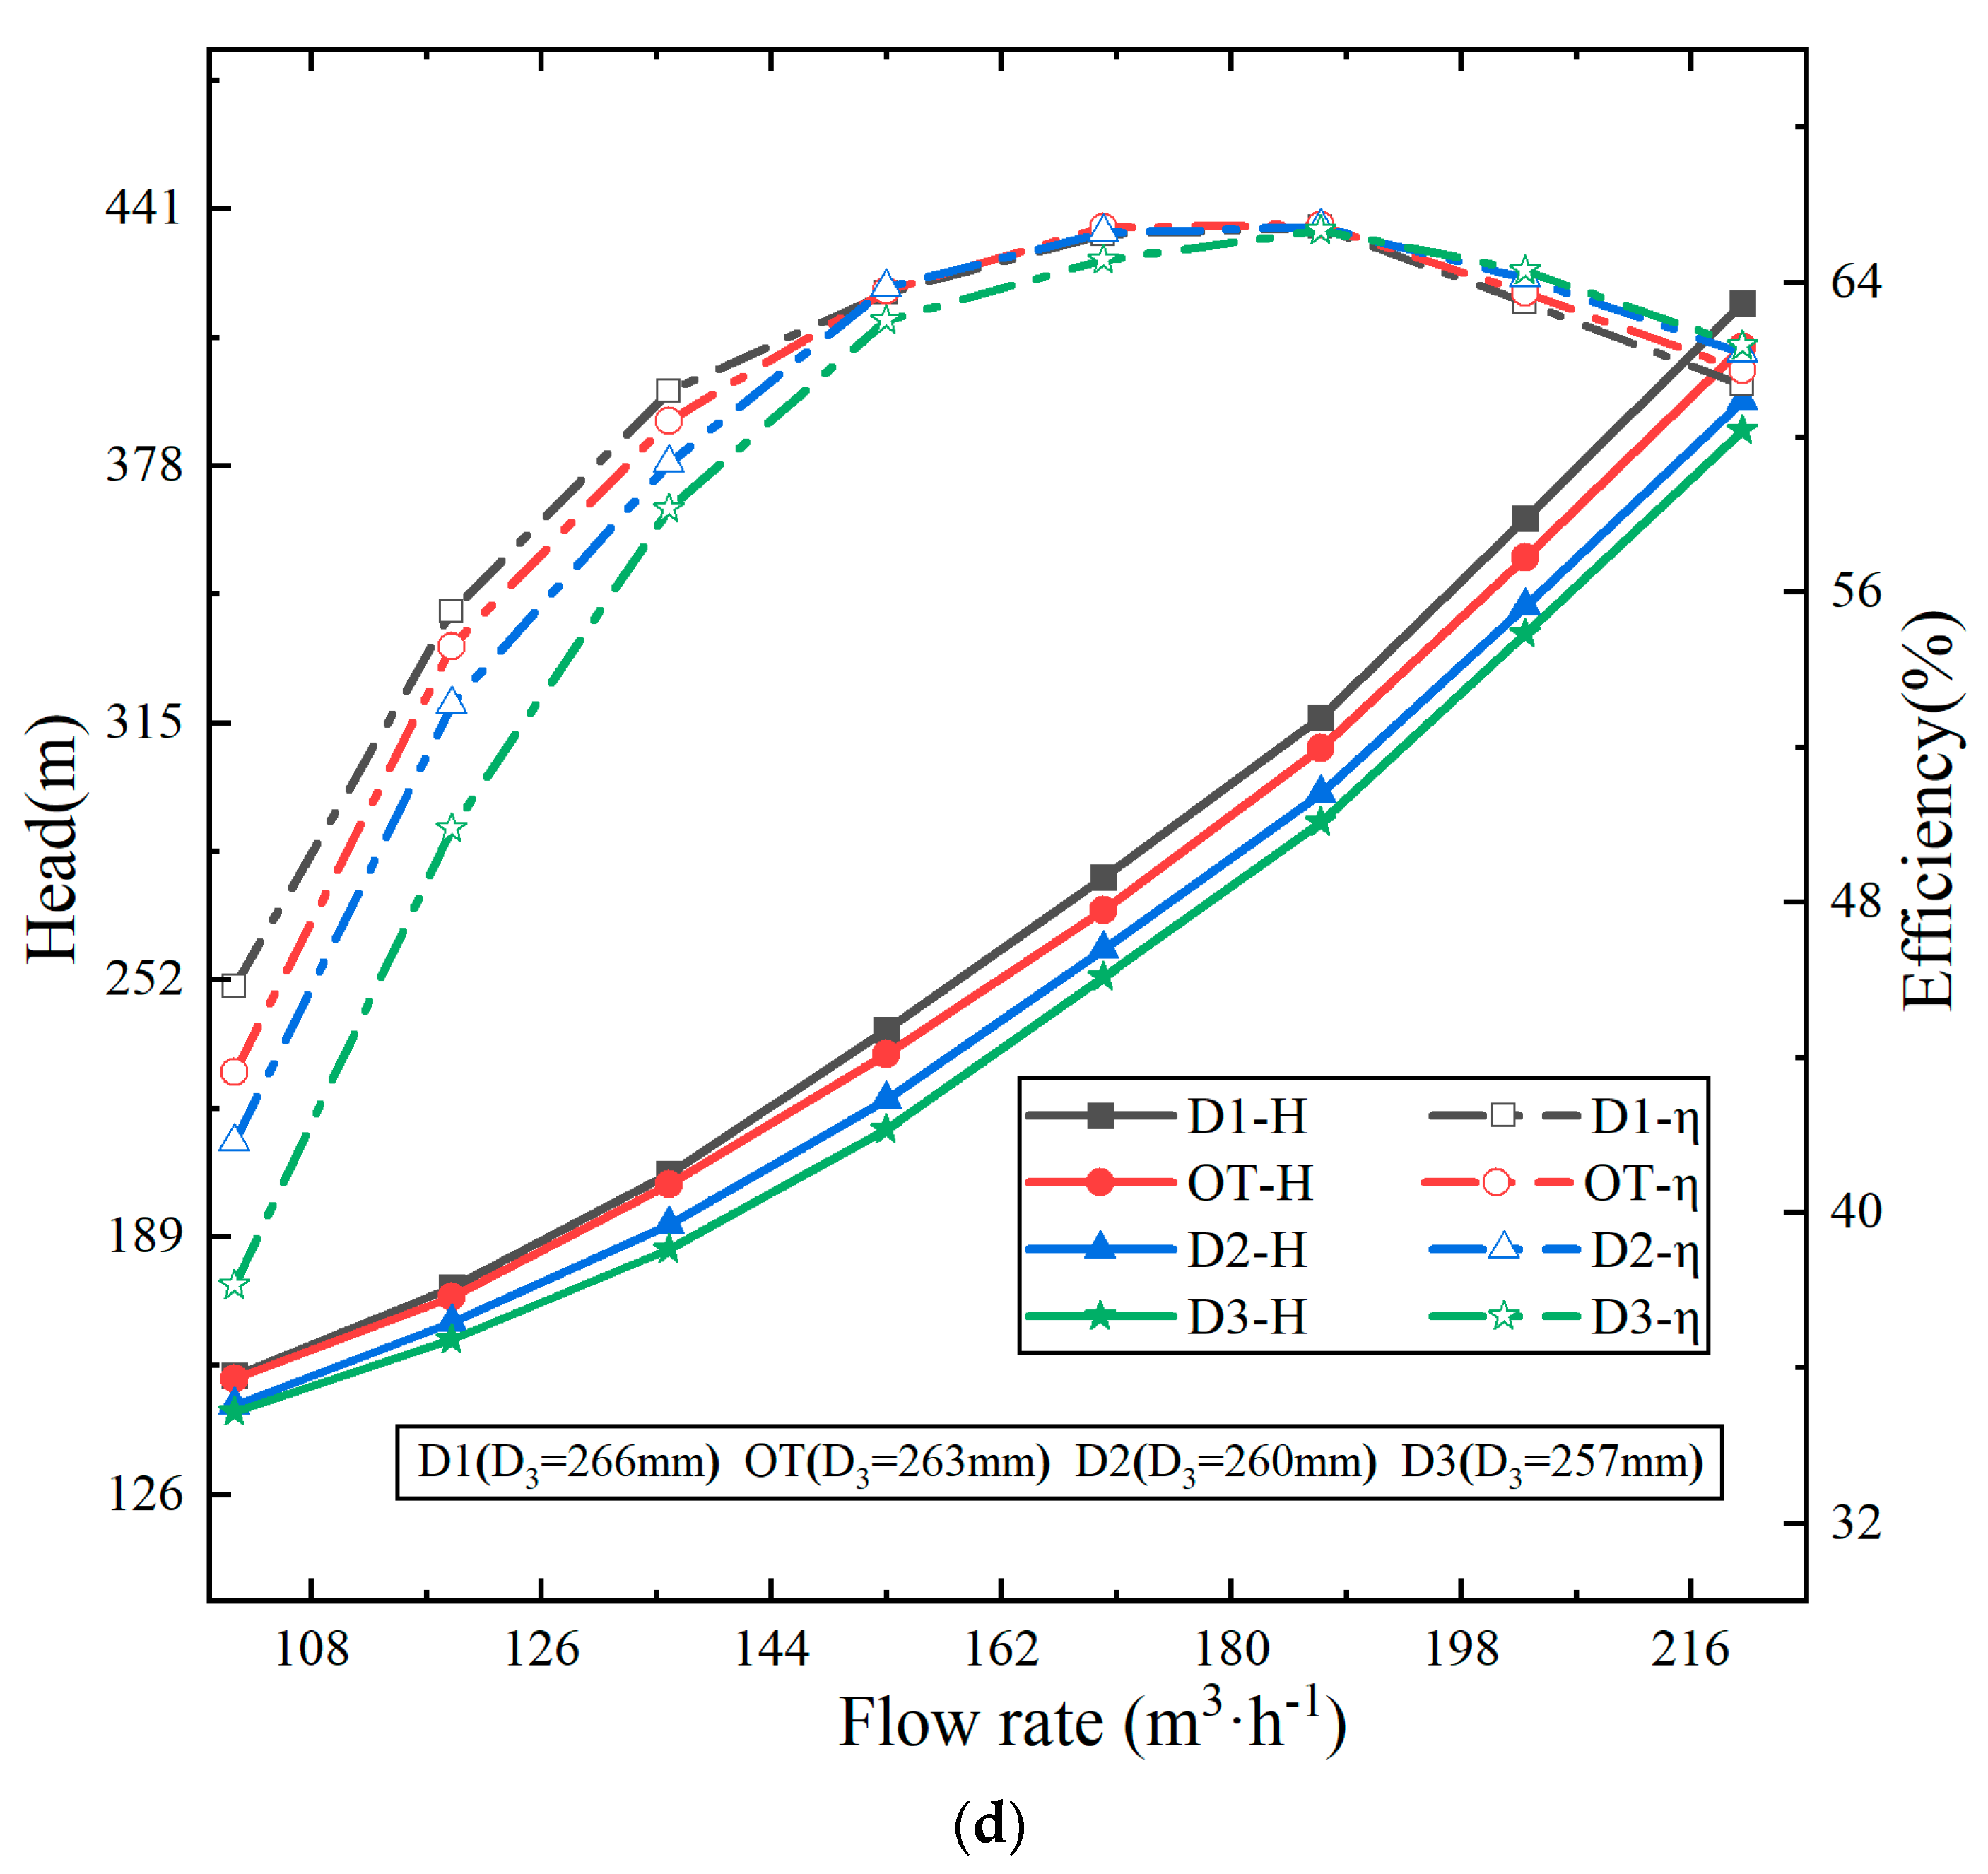
  • As a result of the theoretical derivation, the turbine H-Q curve was able to be flattened by appropriately increasing the outlet placement angle, the number of blades and the throat area of the radial guide vane, or by reducing the base circle diameter of the guide vane.
  • The positive guide vane throat area exerted the most significant impact on the slope of the H-Q curve, succeeded by the positive guide vane outlet angle, the positive guide vane blade number, and the diameter of the positive guide vane base circle. For the example of the two-stage PAT in this paper, the individual contributions to reducing the slope were 0.53, 0.24, 0.1, and 0.09.
  • Increasing the positive guide vane throat area appropriately was able to enhance the efficiency of a multistage PAT, with the BEP shifting towards high flow rates. However, in other cases, the BEP all decreased.

Author Contributions

Conceptualization, J.Y. and S.W.; methodology, S.W. and G.X.; software, G.X. and S.W.; validation, S.W.; formal analysis, S.W. and G.X.; investigation, S.W.; resources, J.Y. and S.W.; writing—review and editing, S.W., J.Y. and G.X.; visualization, S.W.; supervision, J.Y.; project administration, J.Y. and S.W.; funding acquisition, J.Y. All authors have read and agreed to the published version of the manuscript.

Funding

This work was funded by the National Natural Science Foundation of China (Grant No. 52169019), the Industry Support and Guidance Plan of Colleges in Gansu (Grant No.2020C-20), the Science and Technology Research Program of Chongqing Municipal Education Commission (Grant No. KJQN202301206).

Data Availability Statement

All the data are already in the article.

Conflicts of Interest

The authors declare no conflict of interest.

Nomenclature

A3Guide vane throat area (m2)
bFlow passage width (m)
DDiameter (m)
ZBlade number
gGravitational acceleration (m/s2)
HHead (m)
QFlow rate (m3/s)
QdFlow rate at design-point (m3/s)
rRadius (m)
nRotation speed (rpm)
vAbsolute velocity (m/s)
wRelative velocity (m/s)
ΔwSlip of w (m/s)
uPeripheral velocity (m/s)
vuPeripheral component of velocity (m/s)
vmMeridian component of velocity (m/s)
ΔvuSlip of vu (m/s)
SuBlade thickness
Z0Impeller blade number
Greeks
αAbsolute flow angle (°)
βBlade angle (°)
βRelative flow angle (°)
λSlip factor
ηEfficiency
ψBlade crowding coefficient
Subscripts
1At the impeller outlet
2At the impeller inlet
3At the guide vane outlet
4At the guide vane inlet
tTheoretical
Infinite blade number
Abbreviations
CFDComputational fluid dynamics
PATPump as turbine
OTOriginal pump as turbine

References

  1. Renzi, M.; Rudolf, P.; Stefan, D.; Nigro, A.; Rossi, M. Installation of an axial Pump-as-Turbine (PaT) in a wastewater sewer of an oil refinery: A case study. Appl. Energy 2019, 250, 665–676. [Google Scholar] [CrossRef]
  2. Hayder, G.; Ramli, M.Z.; Malek, M.A.; Khamis, A.; Hilmin, N.M. Prediction model development for petroleum refinery wastewater treatment. J. Water Process Eng. 2014, 4, 1–5. [Google Scholar] [CrossRef]
  3. Williams, A. The turbine performance of centrifugal pumps: A comparison of prediction methods. Proc. Inst. Mech. Eng. Part A J. Power 1994, 208, 59–66. [Google Scholar] [CrossRef]
  4. Huang, S.; Qiu, G.; Su, X.; Chen, J.; Zou, W. Performance prediction of a centrifugal pump as turbine using rotor-volute matching principle. Renew. Energy 2017, 108, 64–71. [Google Scholar] [CrossRef]
  5. Tan, X.; Engeda, A. Performance of centrifugal pumps running in reverse as turbine: Part Ⅱ-systematic specific speed and specific diameter based performance prediction. Renew. Energy 2016, 99, 188–197. [Google Scholar] [CrossRef]
  6. Balacco, G. Performance Prediction of a Pump as Turbine: Sensitivity Analysis Based on Artificial Neural Networks and Evolutionary Polynomial Regression. Energies 2018, 11, 3497. [Google Scholar] [CrossRef]
  7. Derakhshan, S.; Nourbakhsh, A. Theoretical, numerical and experimental investigation of centrifugal pumps in reverse operation. Exp. Therm. Fluid Sci. 2008, 32, 1620–1627. [Google Scholar] [CrossRef]
  8. Liu, M.; Tan, L.; Cao, S. Theoretical model of energy performance prediction and BEP determination for centrifugal pump as turbine. Energy 2019, 172, 712–732. [Google Scholar] [CrossRef]
  9. Novara, D.; McNabola, A. A model for the extrapolation of the characteristic curves of pumps as turbines from a datum best efficiency point. Energy Convers. Manag. 2018, 174, 1–7. [Google Scholar] [CrossRef]
  10. Li, W.-G. Optimising prediction model of centrifugal pump as turbine with viscosity effects. Appl. Math. Model. 2017, 41, 375–398. [Google Scholar] [CrossRef]
  11. Wang, X.; Kuang, K.; Wu, Z.; Yang, J. Numerical Simulation of Axial Vortex in a Centrifugal Pump as Turbine with S-Blade Impeller. Processes 2020, 8, 1192. [Google Scholar] [CrossRef]
  12. Yang, S.-S.; Liu, H.-L.; Kong, F.-Y.; Dai, C.; Dong, L. Experimental, numerical, and theoretical research on impeller diameter influencing centrifugal pump-as-turbine. J. Energy Eng. 2013, 139, 299–307. [Google Scholar] [CrossRef]
  13. Jain, S.V.; Swarnkar, A.; Motwani, K.H.; Patel, R.N. Effects of impeller diameter and rotational speed on performance of pump running in turbine mode. Energy Convers. Manag. 2015, 89, 808–824. [Google Scholar] [CrossRef]
  14. Zhou, W.; Yu, D.; Wang, Y.; Shi, J.; Gan, B. Research on the fluid-induced excitation characteristics of the centrifugal pump considering the compound whirl effect. Facta Univ. Ser. Mech. Eng. 2023, 21, 223–238. [Google Scholar] [CrossRef]
  15. Shi, F.; Yang, J.; Wang, X. Analysis on the effect of variable guide vane numbers on the performance of pump as turbine. Adv. Mech. Eng. 2018, 10, 1687814018780796. [Google Scholar] [CrossRef]
  16. Doshi, A.; Channiwala, S.; Singh, P. Inlet impeller rounding in pumps as turbines: An experimental study to investigate the relative effects of blade and shroud rounding. Exp. Therm. Fluid Sci. 2017, 82, 333–348. [Google Scholar] [CrossRef]
  17. Yang, H.; Zhu, L.; Xue, H.; Duan, J.; Deng, F. A Numerical Analysis of the Effect of Impeller Rounding on Centrifugal Pump as Turbine. Processes 2021, 9, 1673. [Google Scholar] [CrossRef]
  18. Wang, K.J.; Wang, S.L.; Meng, P.Y.; Wang, C.P.; Li, Y.H.; Zheng, W.X.; Liu, J.; Kou, J.W. Strategies employed in the design and optimization of pump as turbine runner. Renew. Energy 2023, 216, 119080. [Google Scholar] [CrossRef]
  19. Jiang, B.X.; Yang, J.H.; Wang, X.H.; Miao, S.C.; Bai, X.B. Optimization of pumps as turbines blades based on SVM-HDMR model and PSO algorithm. Adv. Mech. Eng. 2021, 13, 16878140211034364. [Google Scholar] [CrossRef]
  20. Miao, S.C.; Zhang, H.B.; Wang, T.T.; Wang, X.H.; Shi, F.X. Optimal design of blade in pump as turbine based on multidisciplinary feasible method. Sci. Prog. 2020, 103, 0036850420982105. [Google Scholar] [CrossRef]
  21. Wang, T.; Wang, C.; Kong, F.; Gou, Q.; Yang, S. Theoretical, experimental, and numerical study of special impeller used in turbine mode of centrifugal pump as turbine. Energy 2017, 130, 473–485. [Google Scholar] [CrossRef]
  22. Madina, I.; Rollan, N.; Dimitar, K.; Abilikhair, Z.; Aysen, I. Computational and Experimental Study of the Composite Material for the Centrifugal Pump Impellers Manufacturing. J. Appl. Comput. Mech. 2022, 8, 2383–4536. [Google Scholar] [CrossRef]
  23. Yang, J.H.; Ma, Q.H.; Luo, Y.T.; Ji, Y.Y.; Lin, B.; Li, Z.F. Influence of geometrical parameters on head-flow curve of pump as turbine. Trans. Chin. Soc. Agric. Mach. 2019, 50, 167–172. [Google Scholar] [CrossRef]
  24. Charbonnier, V.; Enoki, H.; Asano, K.; Kim, H.; Sakaki, K. Tuning the hydrogenation properties of Ti1+yCr2−x MnX laves phase compounds for high pressure metal-hydride compressors. Int. J. Hydrogen Energy 2021, 46, 36369–36380. [Google Scholar] [CrossRef]
  25. Li, X.; Tao, O.; Lin, Y.; Zhu, Z. Interstage difference and deterministic decomposition of internal unsteady flow in a five-stage centrifugal pump as turbine. Phys. Fluids 2023, 35, 045136. [Google Scholar] [CrossRef]
  26. Mohammadi, M.; Yasi, M.; Jamali, S.; Hajikandi, H. Experimental Study on Single- and Multi-stage Pump as Turbine on Water Supply Pipelines. Iran. J. Sci. Technol. Trans. Civ. Eng. 2022, 46, 3307–3318. [Google Scholar] [CrossRef]
  27. Gülich, J.F. Centrifugal Pumps; Springer: Berlin/Heidelberg, Germany, 2014. [Google Scholar]
  28. Memardezfouli, M.; Nourbakhsh, A. Experimental investigation of slip factors in centrifugal pumps. Exp. Therm. Fluid Sci. 2009, 33, 938–945. [Google Scholar] [CrossRef]
  29. Kan, K.; Zhang, Q.; Zheng, Y.; Xu, H.; Xu, Z.; Zhai, J.; Muhirwa, A. Investigation into Influence of Wall Roughness on the Hydraulic Characteristics of an Axial Flow Pump as Turbine. Sustainability 2022, 14, 8459. [Google Scholar] [CrossRef]
Figure 1. Velocity triangle at impeller inlet and outlet.
Processes 11 03393 g001
Figure 2. Velocity triangle at guide vane outlet.
Processes 11 03393 g002
Figure 3. Diagram of guide vane.
Processes 11 03393 g003
Figure 4. CFD model. (a) Geometrical model; (b) mesh of guide vane and impeller.
Processes 11 03393 g004aProcesses 11 03393 g004b
Figure 5. PAT test system. (a) Test site; (b) schematic diagram.
Processes 11 03393 g005
Figure 6. Performance curves of original PAT obtained by test and CFD.
Processes 11 03393 g006
Figure 7. H-Q and η-Q curves for research schemes. (a) Increasing the placement angle of the positive guide vane outlet (α3); (b) increasing the number of positive guide blades (Z1); (c) increasing the positive guide vane throat area (A3); (d) decreasing the positive guide vane base circle (D3).
Processes 11 03393 g007aProcesses 11 03393 g007bProcesses 11 03393 g007c
Table 1. Main geometric parameters of OT.
ParameterValue
Impeller inlet diameter D2(mm)252
Impeller inlet width b2(mm)15.5
Blade inlet placement angle βb2(°)24
Blade outlet edge width b1(mm)19.8
Intermediate streamline blade outlet diameter D1(mm)108.7
Intermediate streamline blade outlet placement angle βb1(°)25
Blade number Z07
Positive guide vane number Z18
Anti-guide vane number Z28
Positive guide vane outlet placement angle α3 (°)5.5
Diameter of base circle of positive guide vane D3(mm)263
Radial width of the throat of positive guide vane a3(mm)13.5
Axial width of the throat of positive guide vane b3(mm)17
Table 2. Geometrical parameter of positive guide vane for schemes.
Schemeα3 (°)Z1A3 (mm2)D3 (mm)a3 (mm)b3 (mm)D4 (mm)
OT5.581836263.013.517.0324.0
A14.081836263.013.517.0324.8
A27.081836263.013.517.0323.2
A38.581836263.013.517.0322.4
B15.561836263.020.614.9324.0
B25.591836263.011.417.9324.0
B35.5101836263.09.818.7324.0
C15.581700263.012.517.0322.8
C25.581972263.014.517.0325.2
C35.582108263.015.517.0326.4
D15.581836266.013.517.0327.0
D25.581836260.013.517.0321.0
D35.581836257.013.517.0318.0
Table 3. Mesh independence.
CaseMesh NumberHead (m)
13637854260.18
25163348267.58
36085721268.27
47125813267.96
Table 4. Slopes of the H-Q curve and best efficiency for schemes.
SchemedH/dQη (%)
OT2.3065.27
A12.5364.17
A22.1565.21
A32.0664.48
B12.4763.82
B22.2164.79
B32.1964.03
C12.5764.13
C21.9866.27
C31.7766.92
D12.3165.26
D22.2265.52
D32.2165.21
Disclaimer/Publisher’s Note: The statements, opinions and data contained in all publications are solely those of the individual author(s) and contributor(s) and not of MDPI and/or the editor(s). MDPI and/or the editor(s) disclaim responsibility for any injury to people or property resulting from any ideas, methods, instructions or products referred to in the content.

