Experimental and Numerical Simulations of Pore Structures and Seepage Characteristics of Deep Sandstones


Abstract
:
1. Introduction
- (1)
- Microscopic research on rock pore structure is relatively scarce, and engineering projects such as grouting and water blocking mostly rely on engineering experience, lacking theoretical support.
- (2)
- There have been microscopic studies on pore structure, but their research methods are singular, making it difficult to integrate multiple research methods and improve the credibility of research results.
- (3)
- Although scholars have conducted microscopic studies through mercury intrusion experiments, nuclear magnetic resonance, scanning electron microscopy, and other methods, previous studies have lacked research on the pore structure of surrounding rock in underground engineering at a depth of 1000 m, which is increasingly important as mining is developing deeper underground.
2. Materials and Methods
2.1. Material
2.2. Method
- Combined with casting thin section and X-ray data, the petrological type, clastic composition and characteristics, interstitial characteristics, and physical properties of the coal-bearing sandstone in a deep well at a depth of 1000 m in the Tangkou Coal Mine were summarized and analyzed to understand the arrangement between sandstone particles in coal-bearing strata in this area, the composition of cuttings, the volume content of interstitials, and other information.
- Scanning electron microscopy (SEM), mercury intrusion experiments and other methods of combining characterization techniques were carried out to qualitatively and quantitatively determine the type, distribution, geometric shape, size, and relationship between pores and throats in the study area. The interconnections were characterized. At the same time, the correlation between the pore structure parameters obtained in the experiment and the physical properties was established, and the influence of the pore structure on the seepage characteristics was analyzed.
- Combined with the foregoing research methods, a numerical simulation software was used to establish the actual microstructure model of the rock mass surrounding the roadway. The COMSOL Multiphysics numerical simulation software was used to study the seepage laws of fluids under different conditions in micropores.
3. Analysis of Basic Characteristics of Sandstone in Coal-Bearing Strata
3.1. Experimental Study on Petrological Characteristics of Coal-Bearing Strata
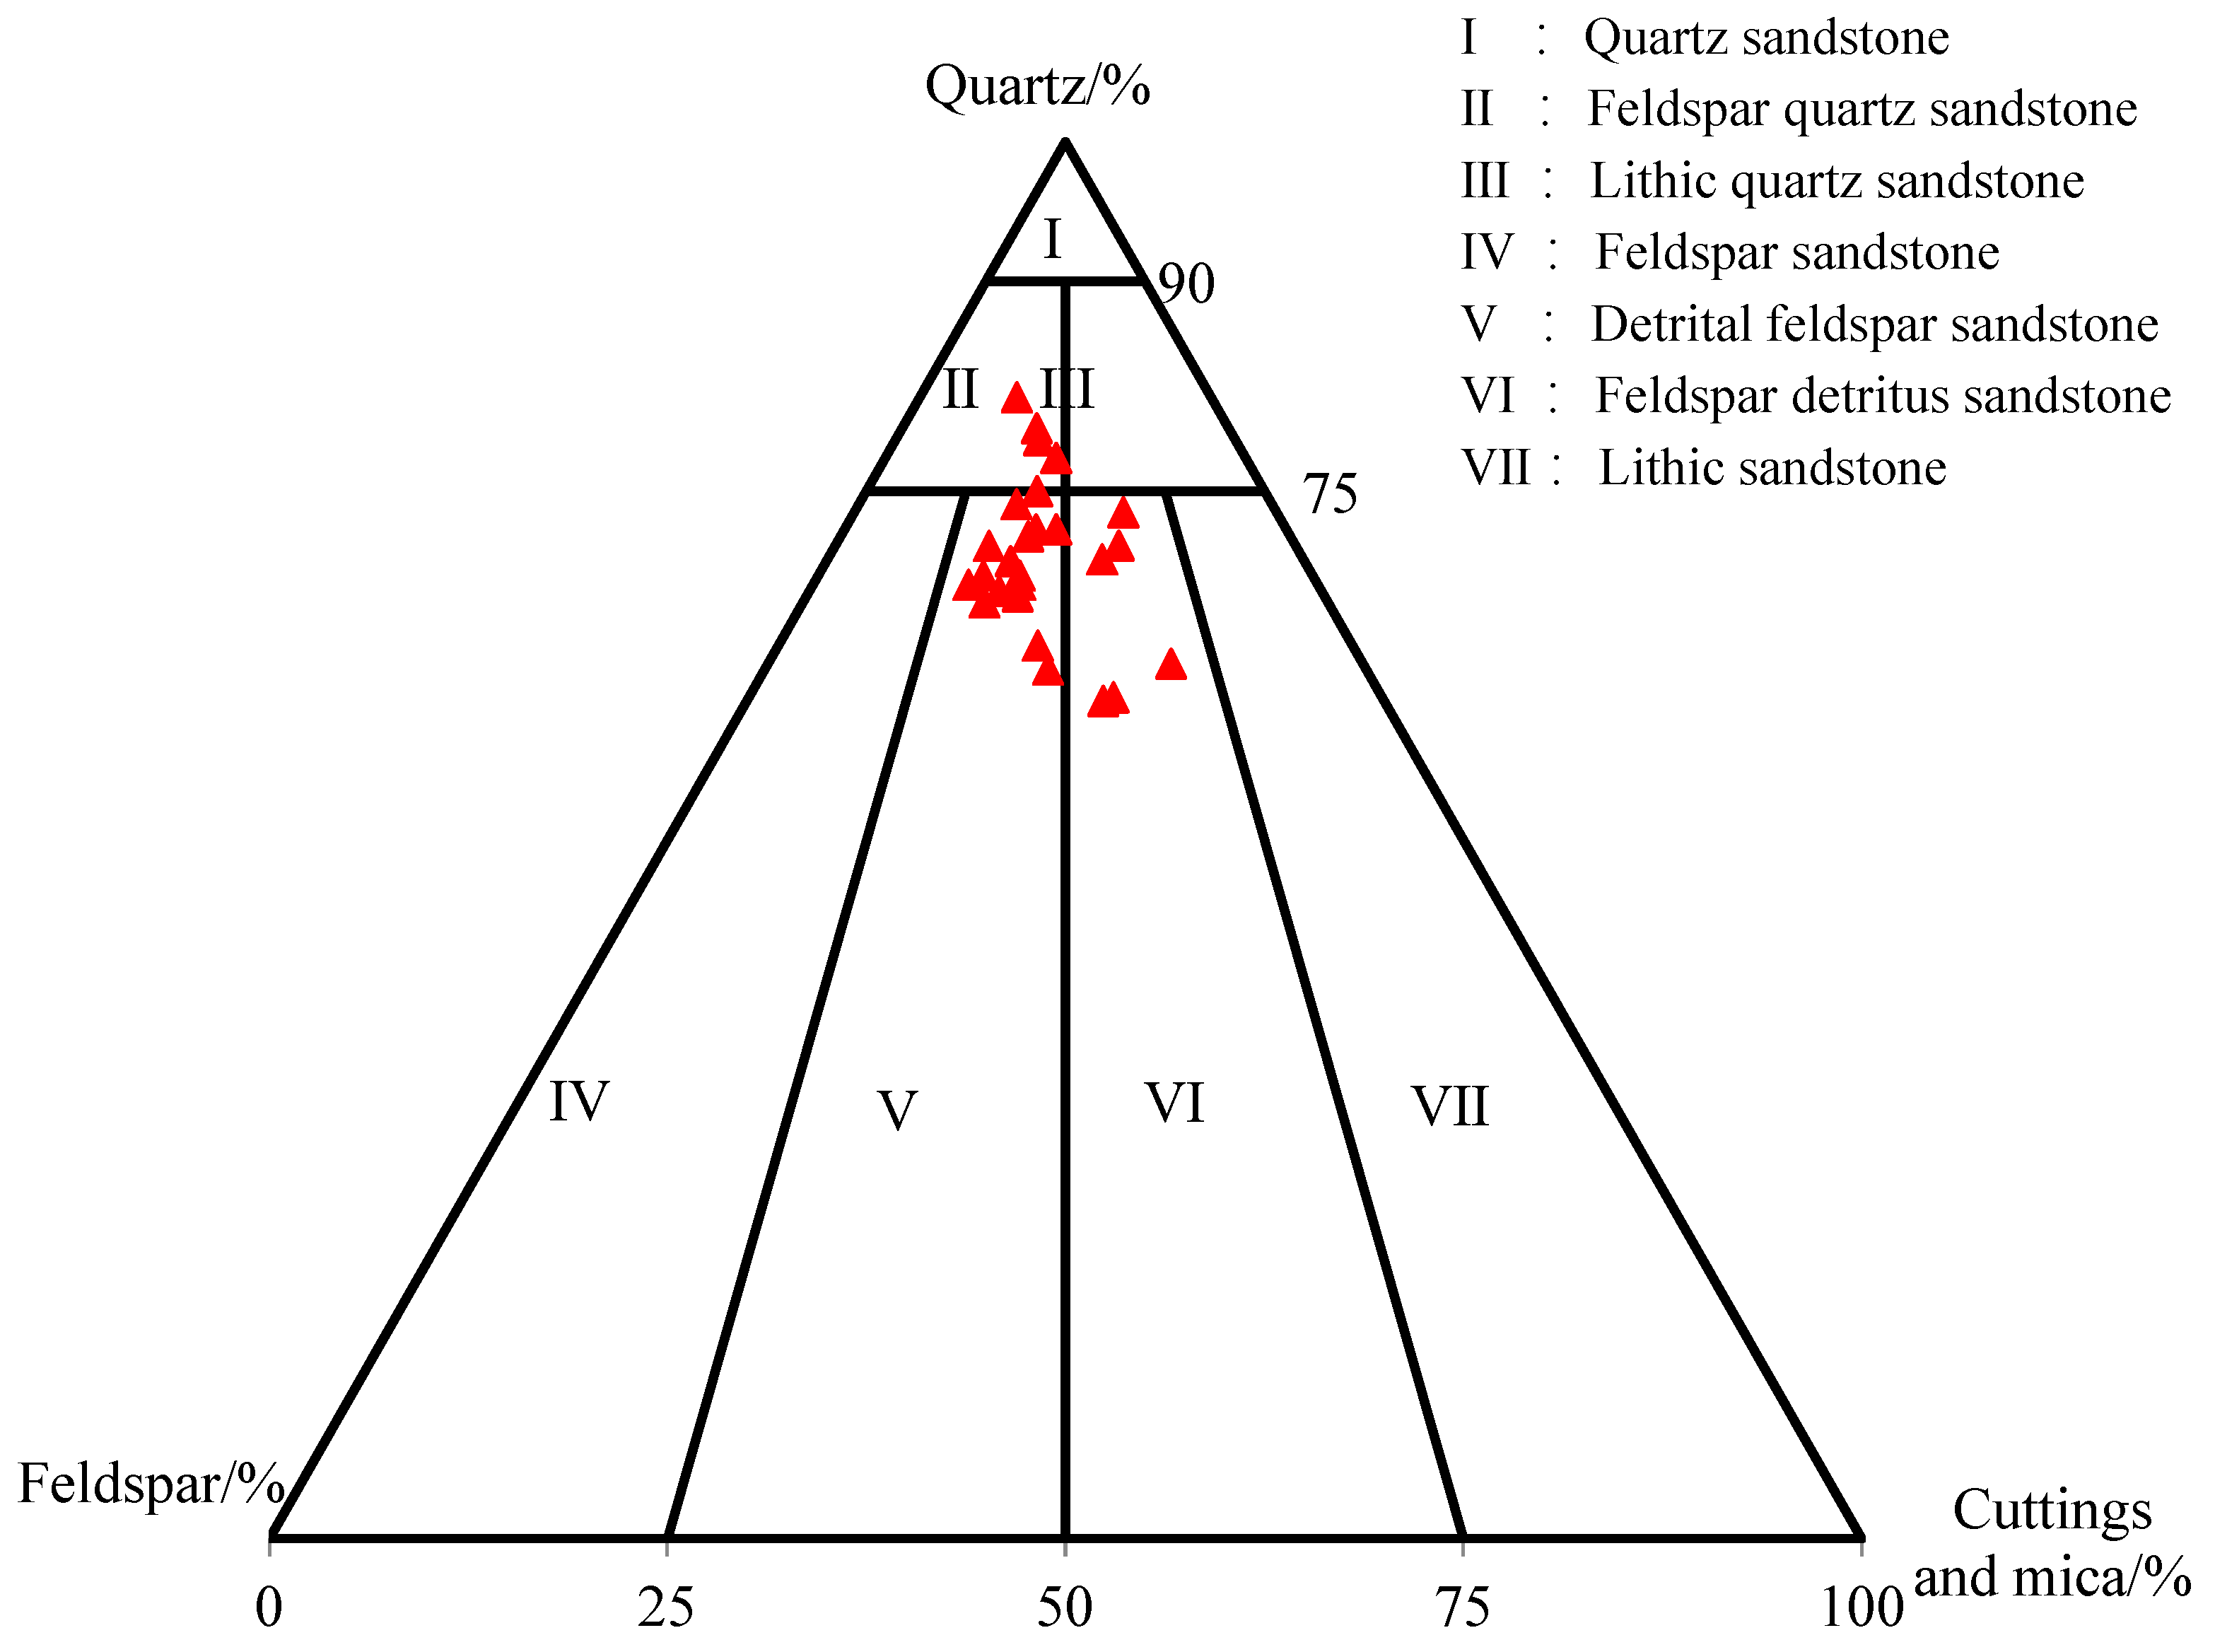
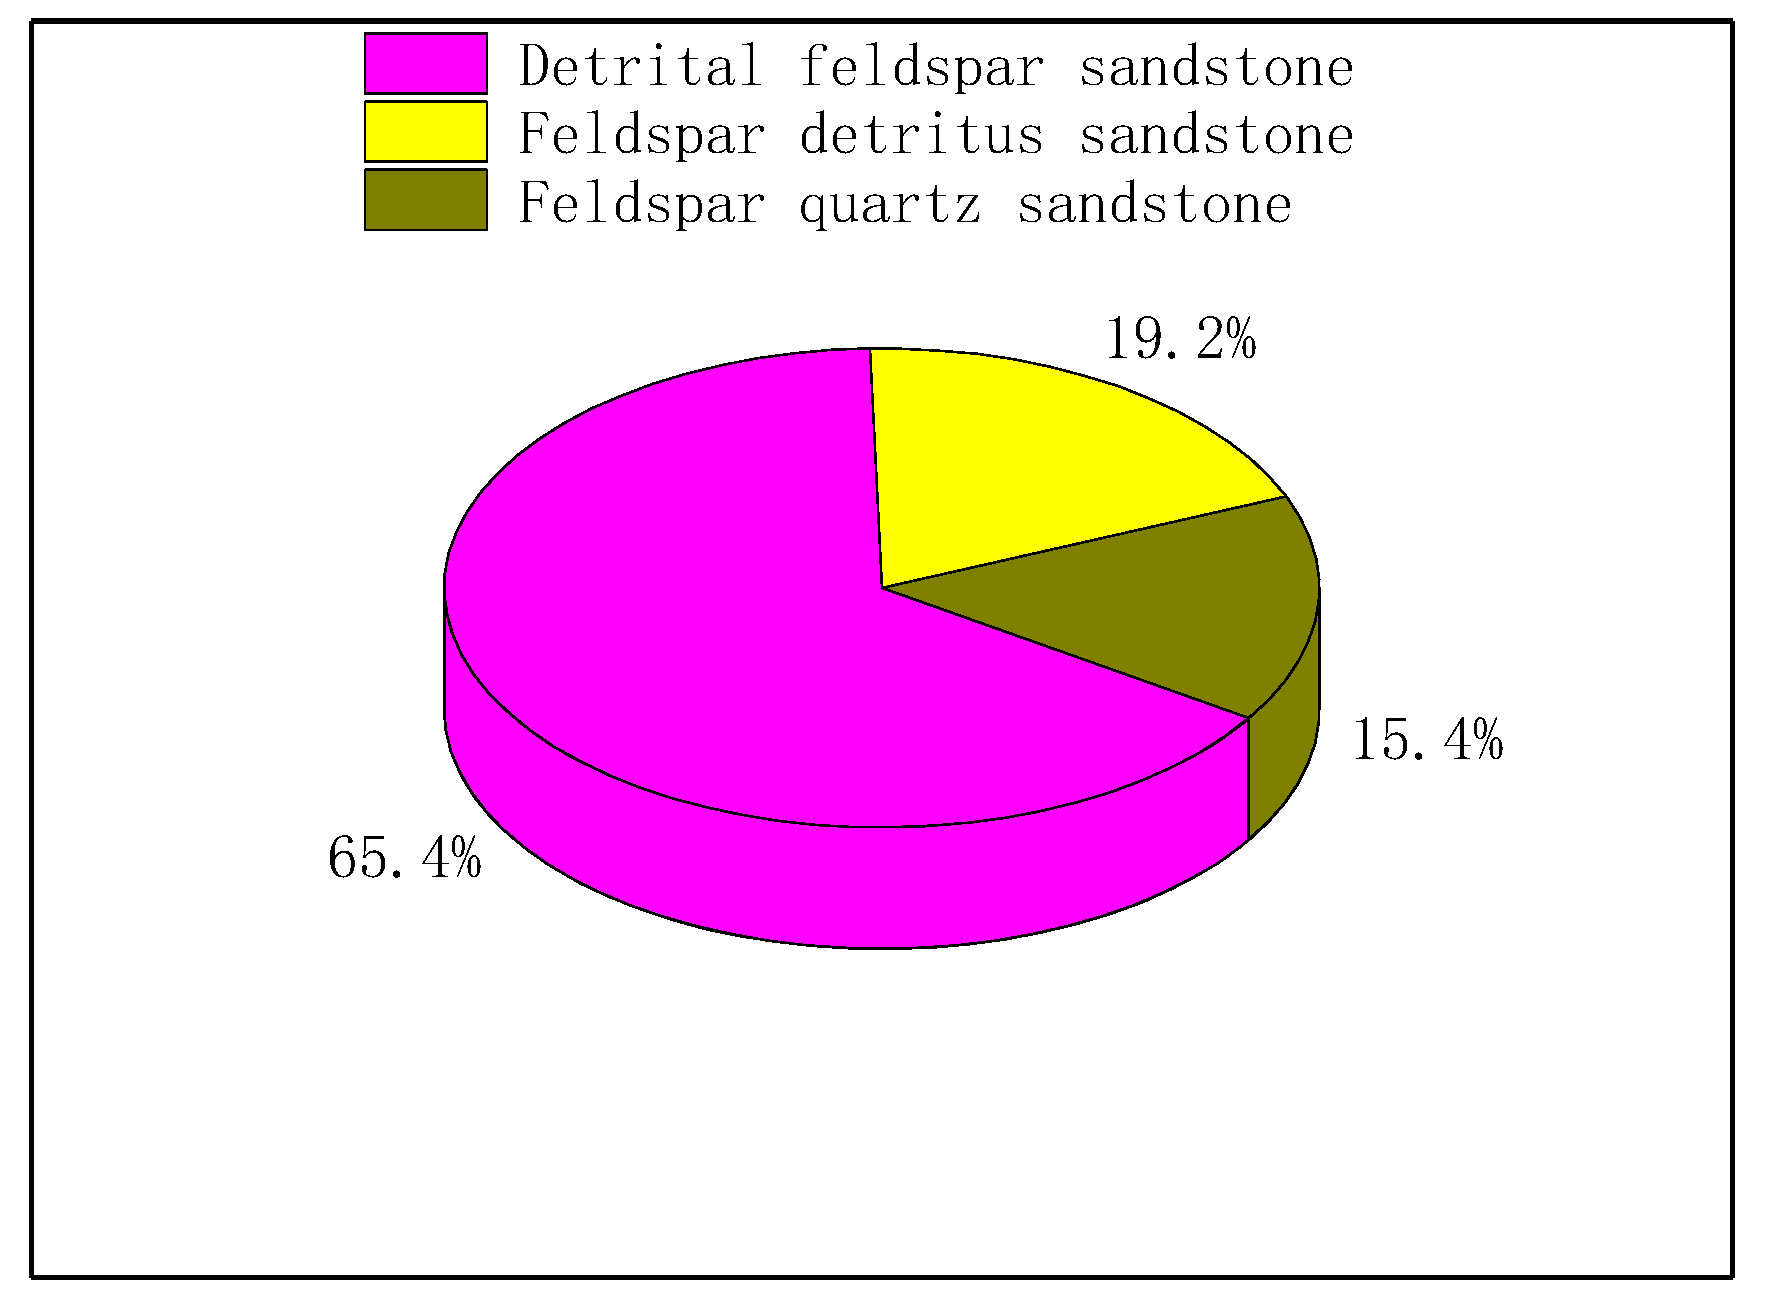
3.1.1. Analysis of Petrological Types of Coal-Bearing Strata
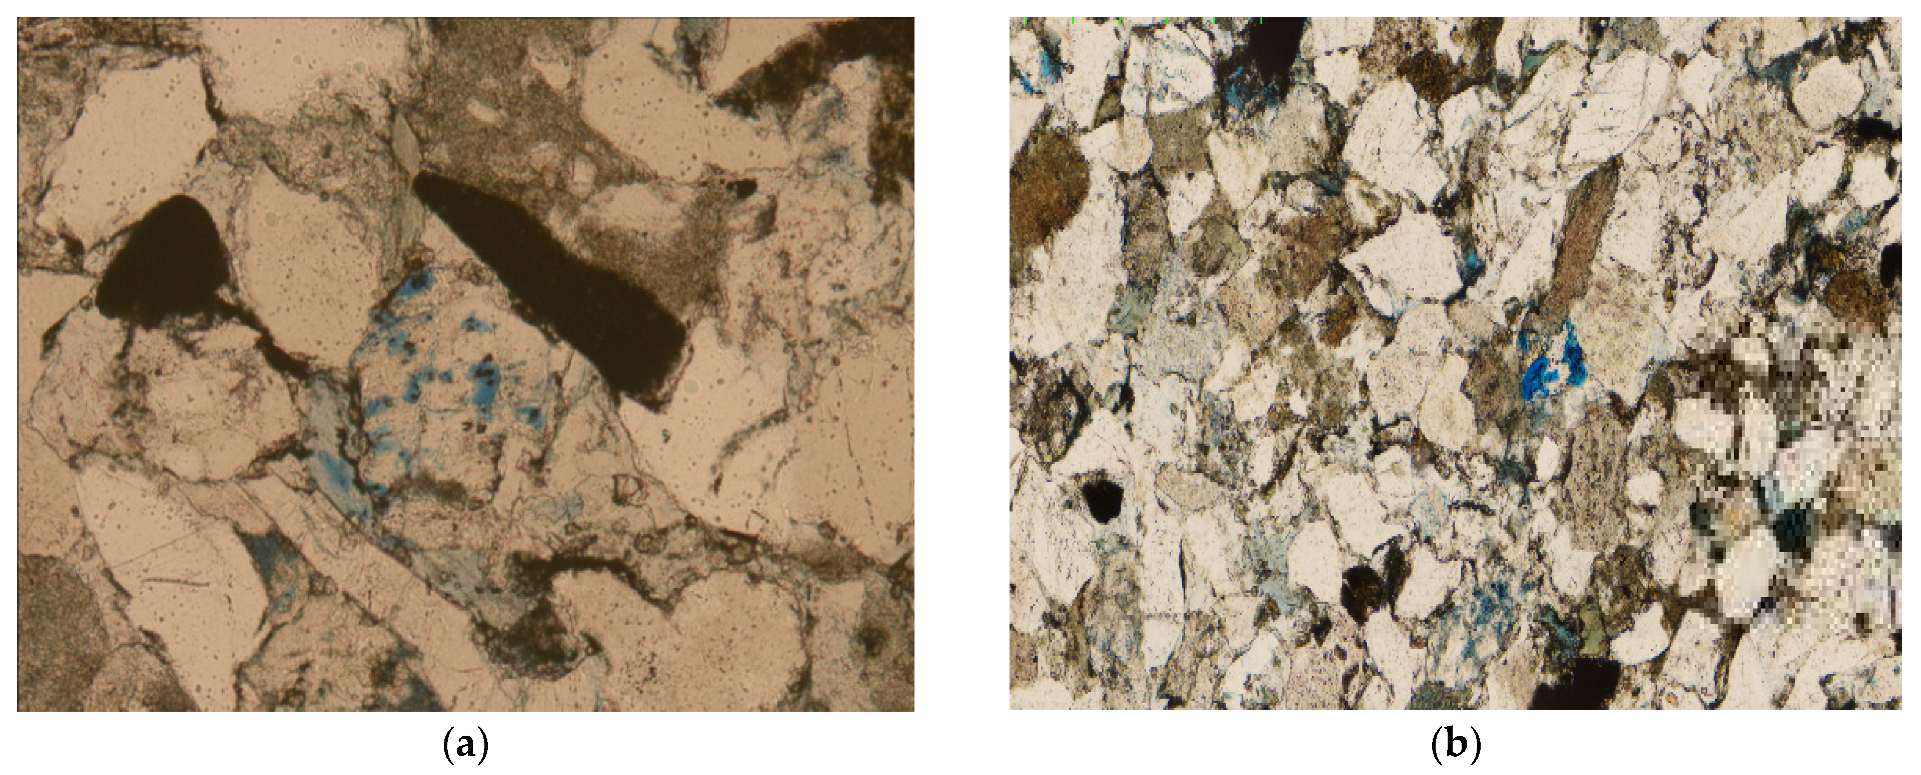
3.1.2. Analysis of the Composition and Characteristics of the Debris
- (a)
- Granularity Characteristics
- (b)
- Roundness
- (c)
- Particle Contact Method
- (d)
- Sortability
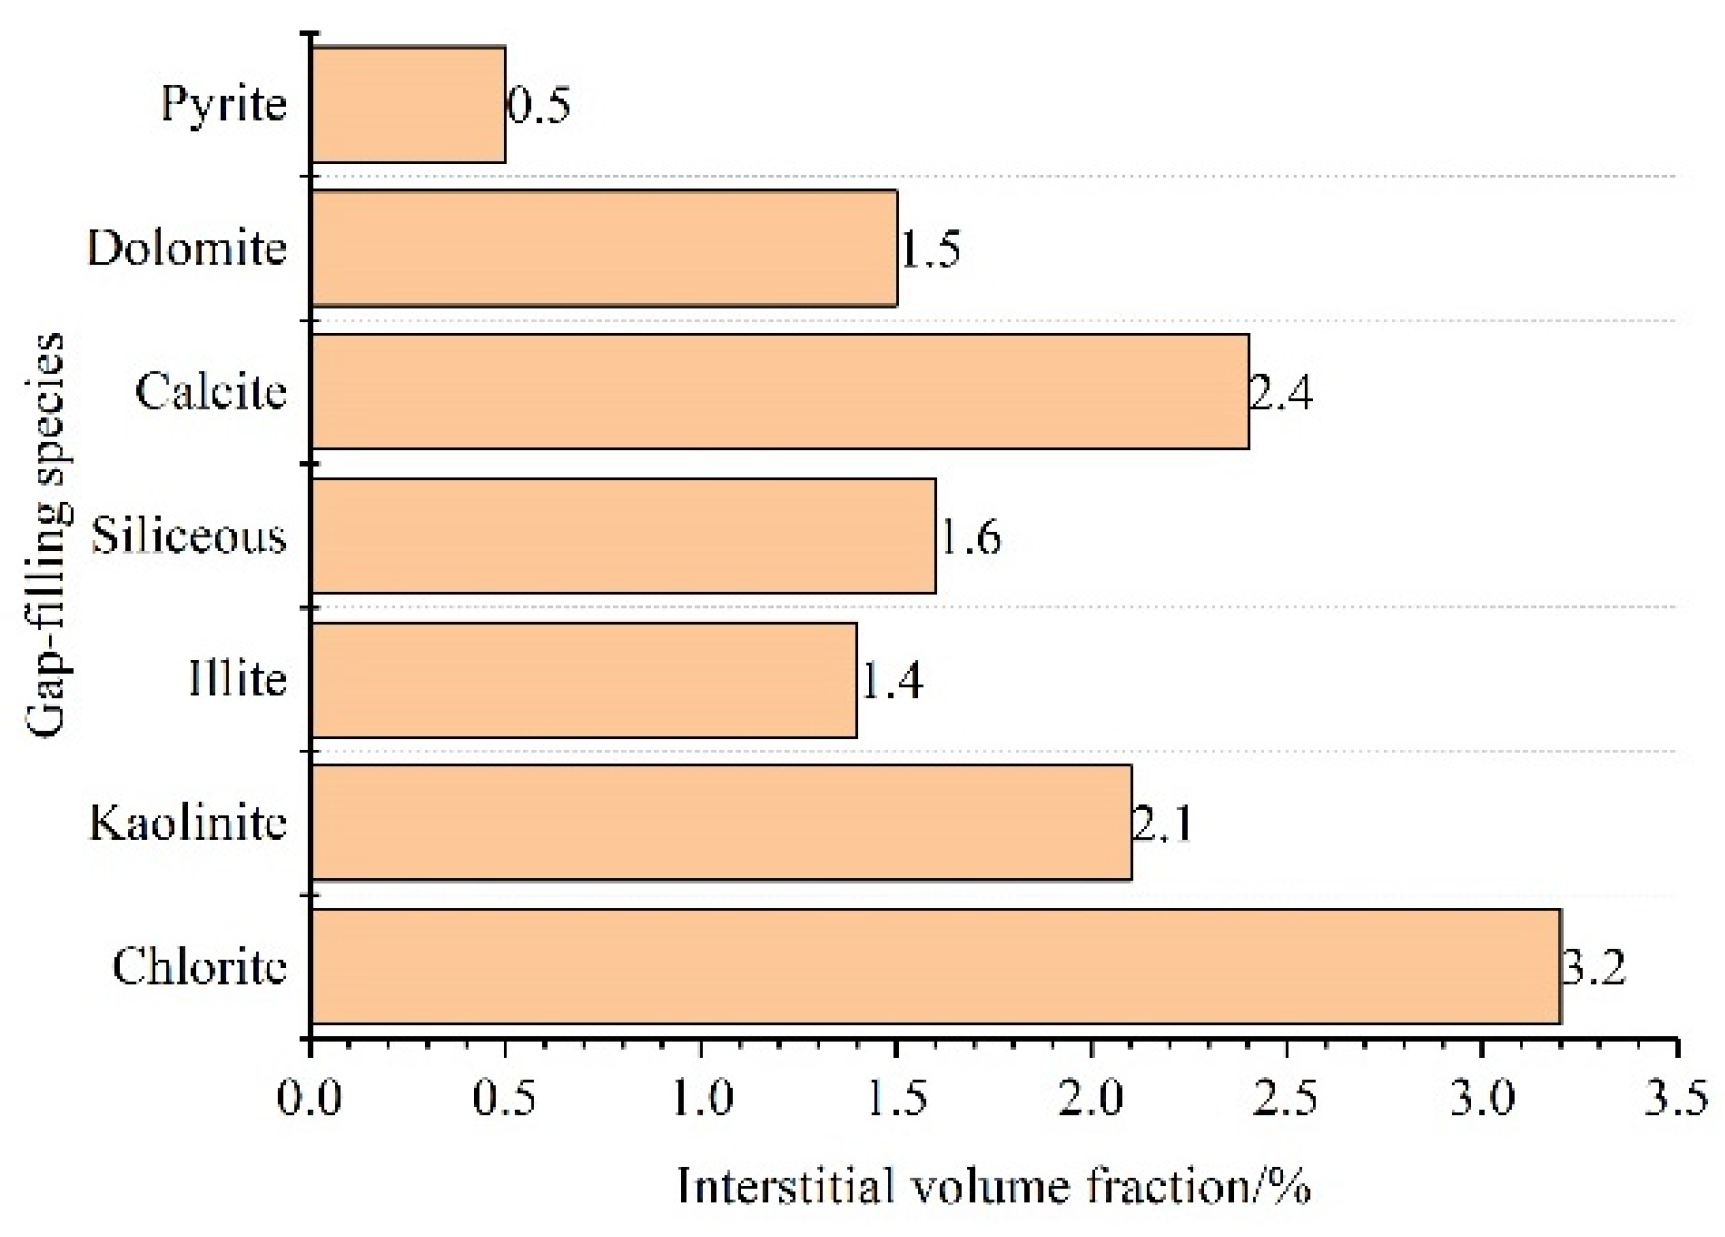
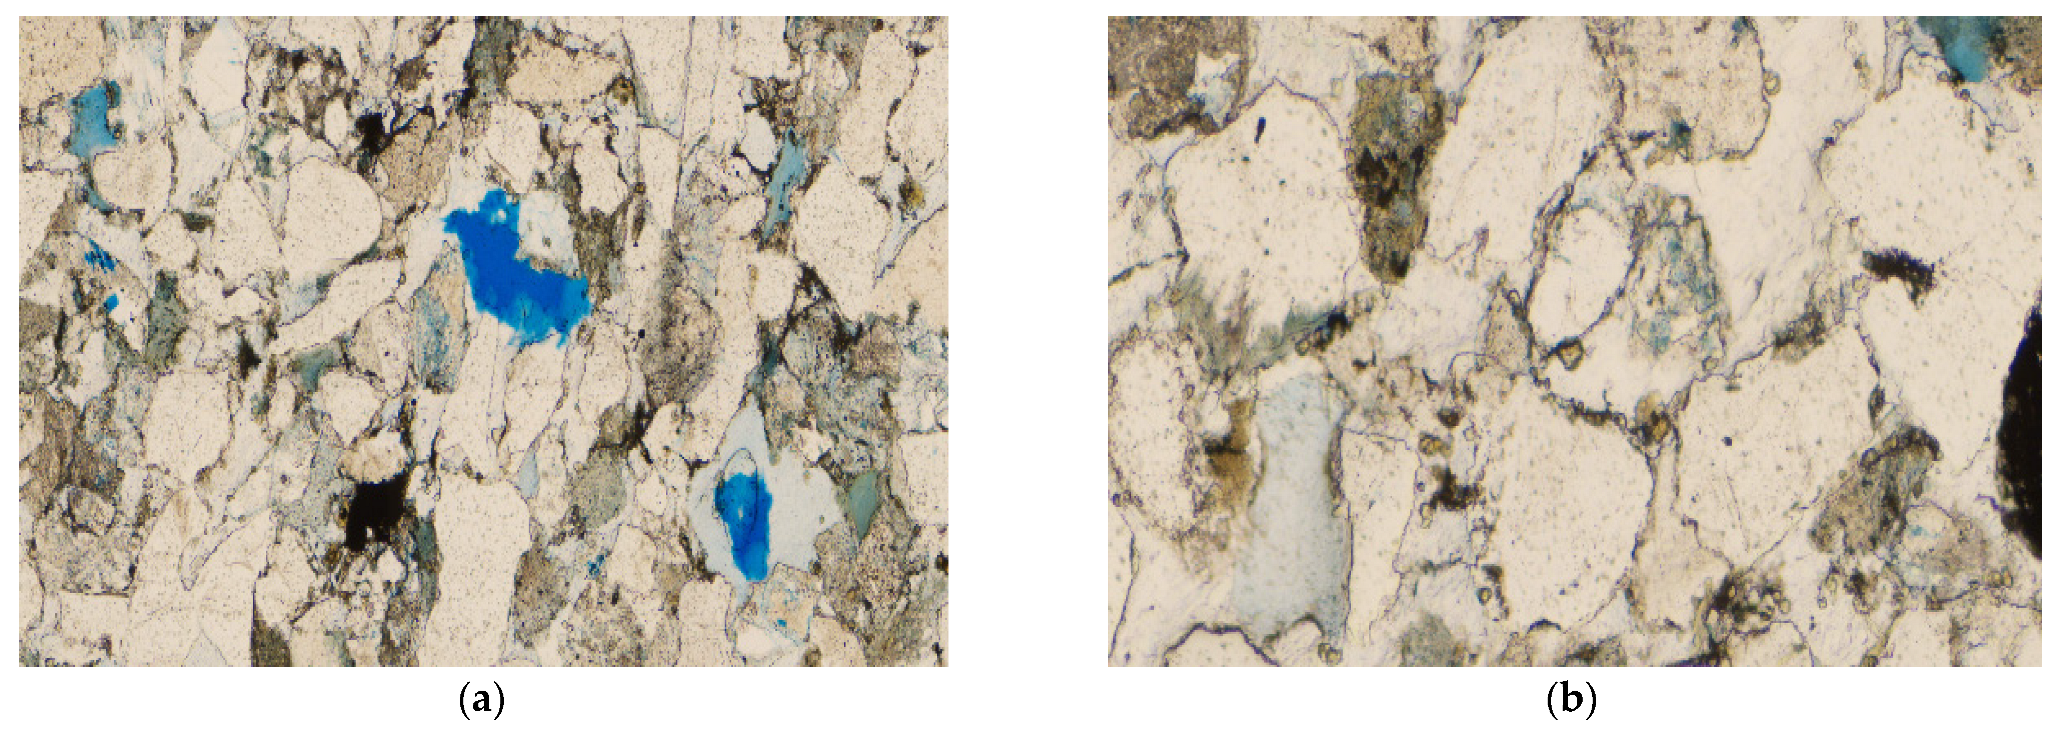
3.1.3. Analysis of Interstitial Characteristics
- (a)
- Interstitial Distribution
- (b)
- Type of Cement
3.2. Study on the Physical Properties of Coal-Bearing Strata
3.2.1. Characteristics of the Physical Parameters of Coal-Bearing Strata
3.2.2. Correlation Analysis of Physical Properties
4. Experimental Study on the Micropore Structure of Sandstone
4.1. Pore and Throat
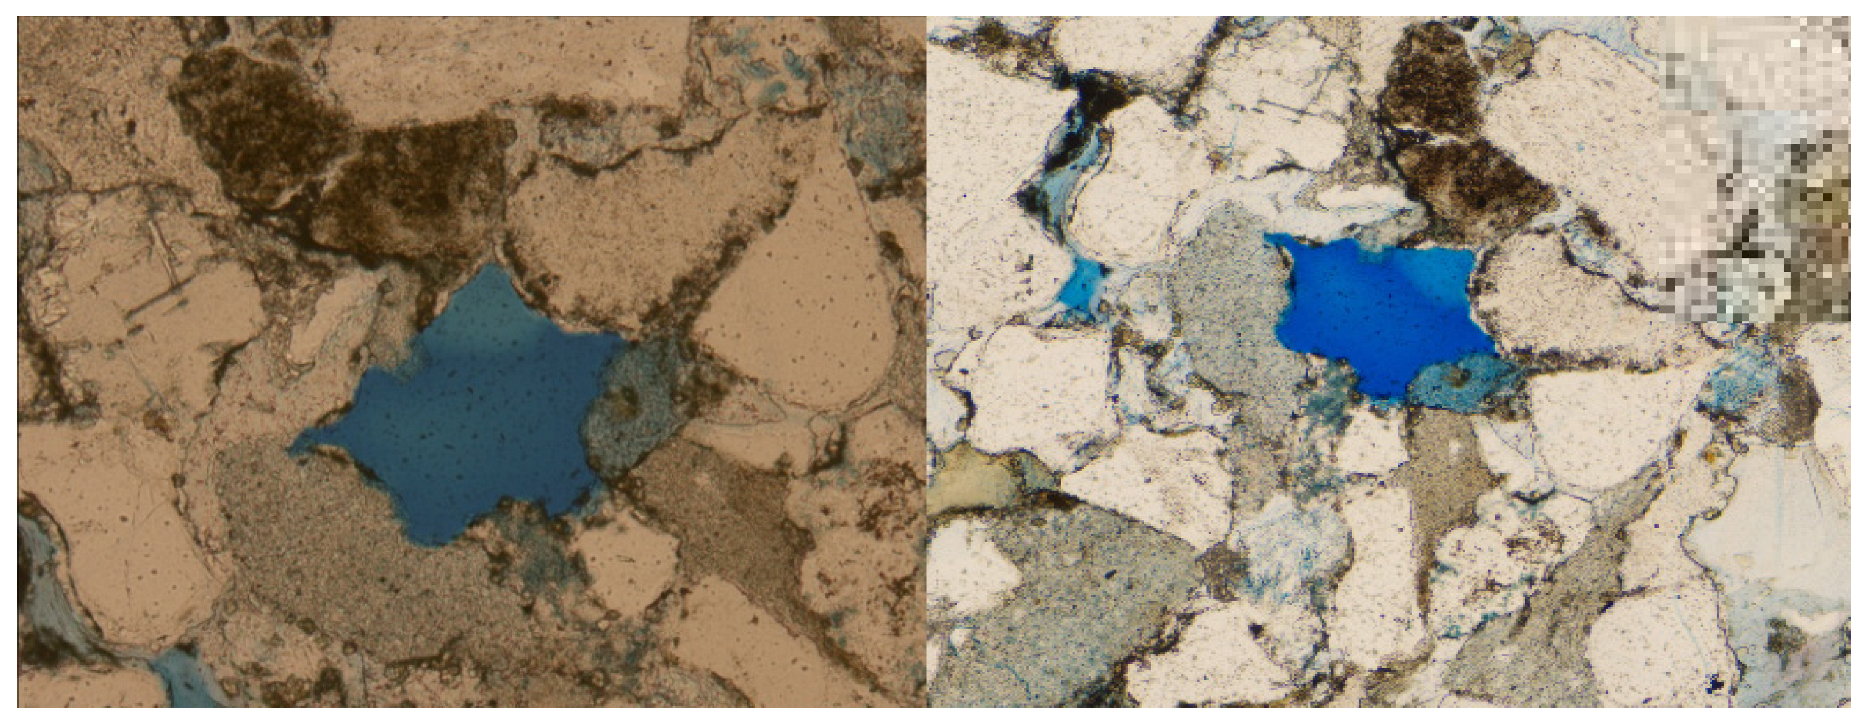
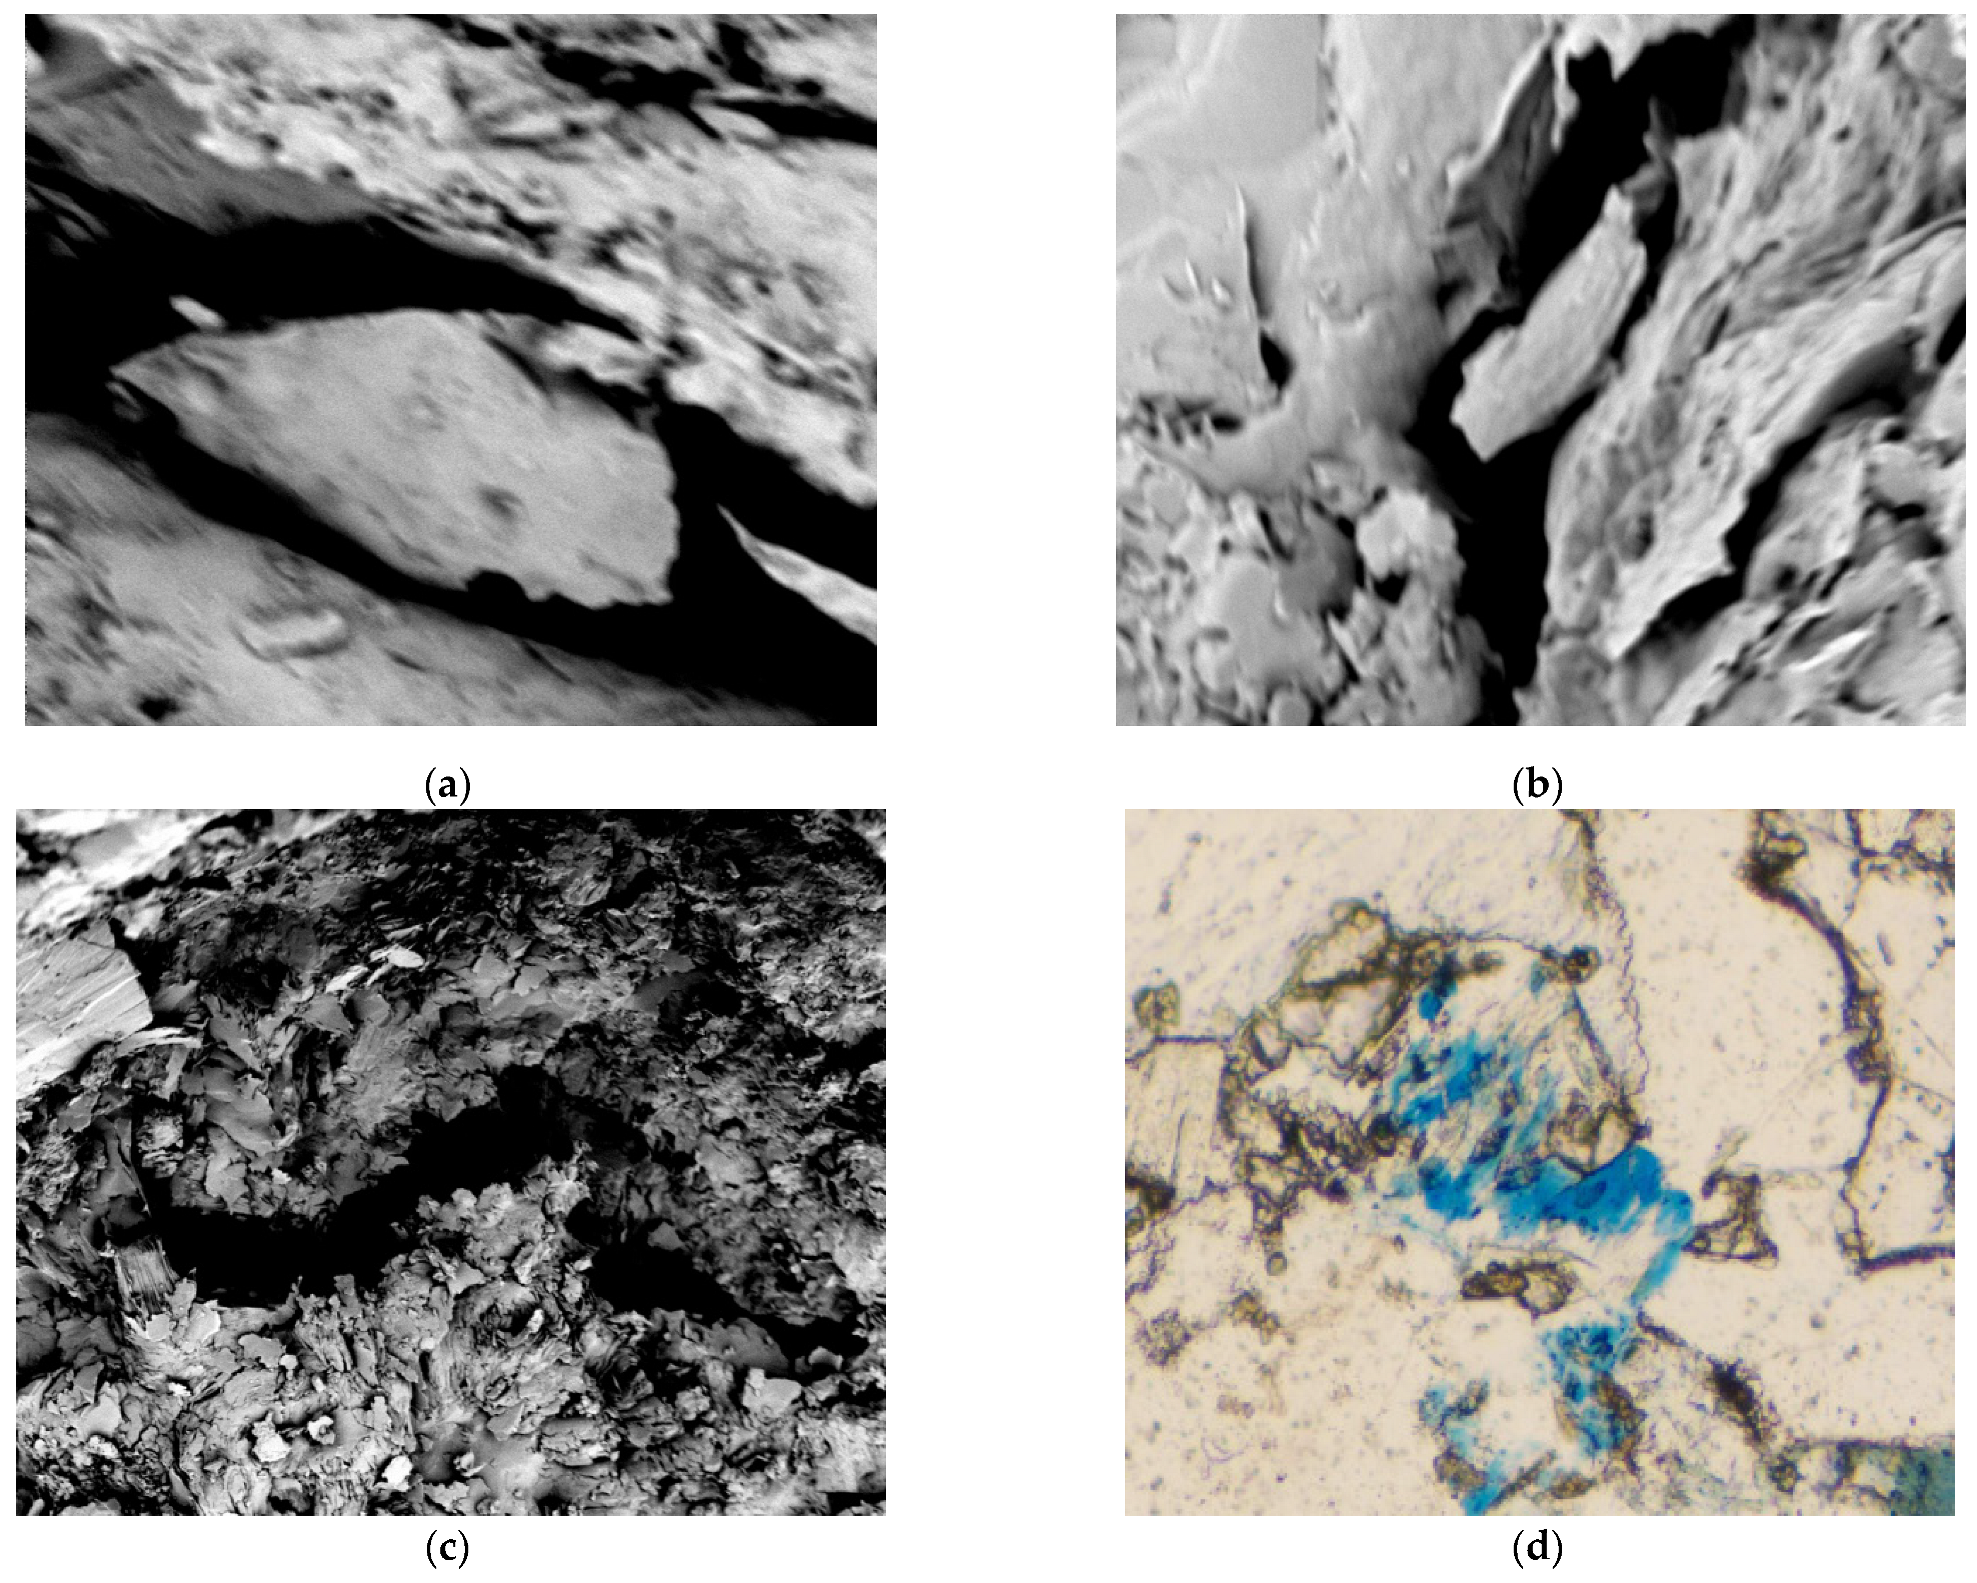
4.1.1. Pore Types
- (a)
- Intergranular Pores
- (b)
- Intragranular Dissolution Pores
- (c)
- Intercrystalline Pores
- (d)
- Fissure
4.1.2. Throat Types
- (a)
- Flaky and Curved Throats
- (b)
- Constricted Throat
- (c)
- Bundle Throat
4.2. Characterization of Pore Throat Structure based on the Mercury Intrusion Test
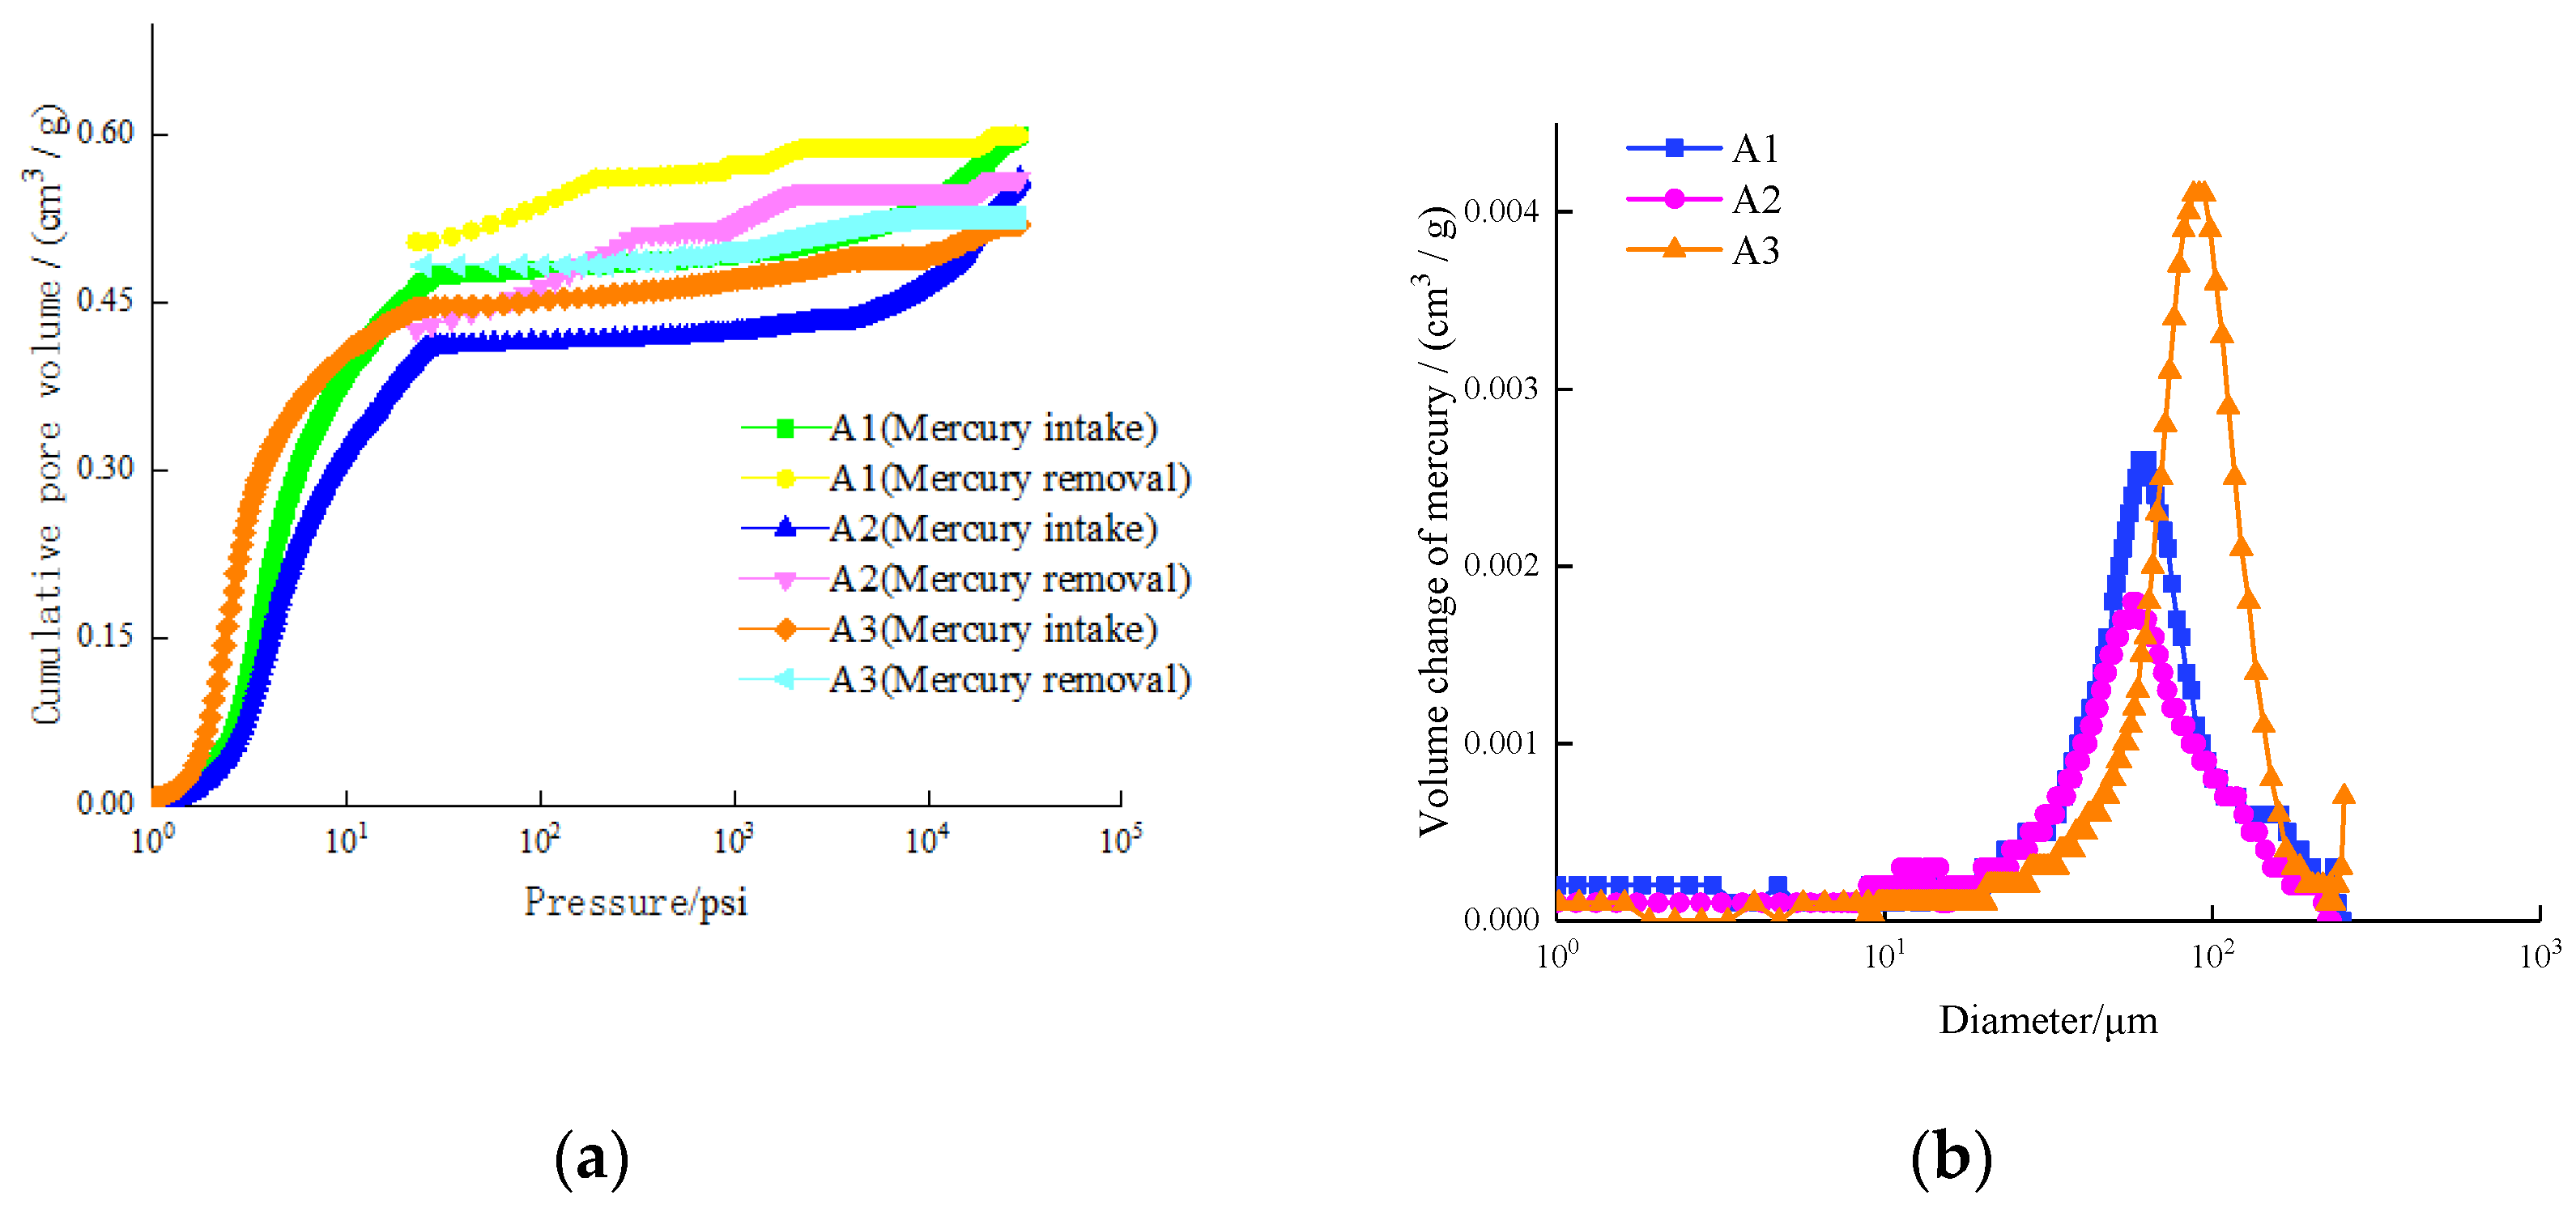
4.2.1. Capillary Pressure Curve Characteristics
- (a)
- Type I Low Mercury Inlet Pressure-Mesoporous Type
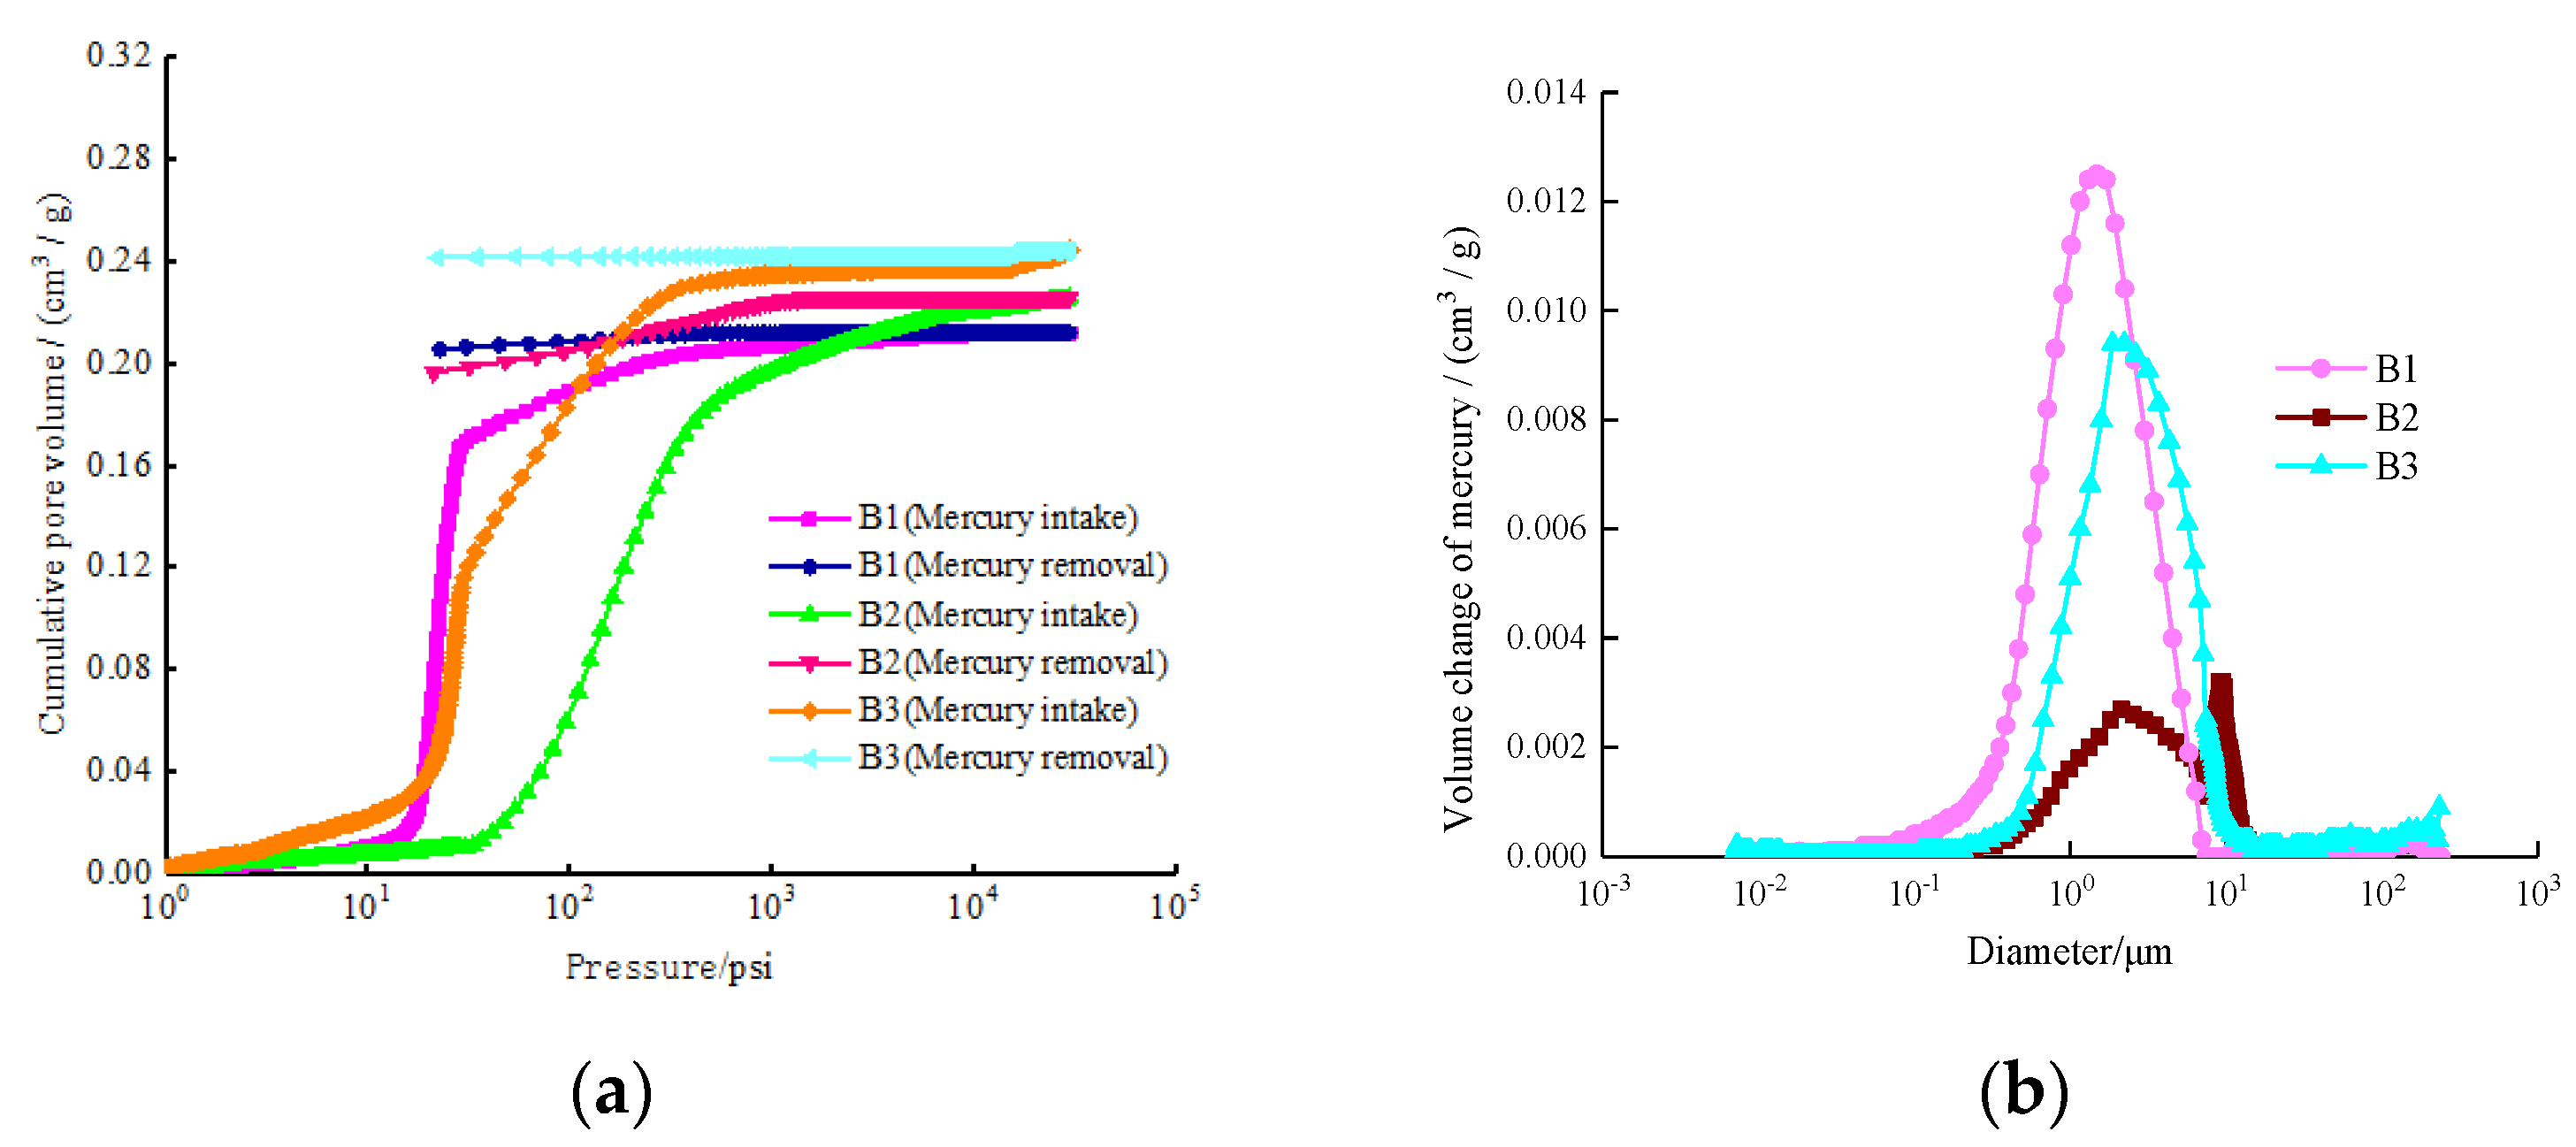
- (b)
- Type II Low Mercury Inlet Pressure-Small Hole Type
- (c)
- Type III Medium Mercury Inlet Pressure-Fine Pore Type
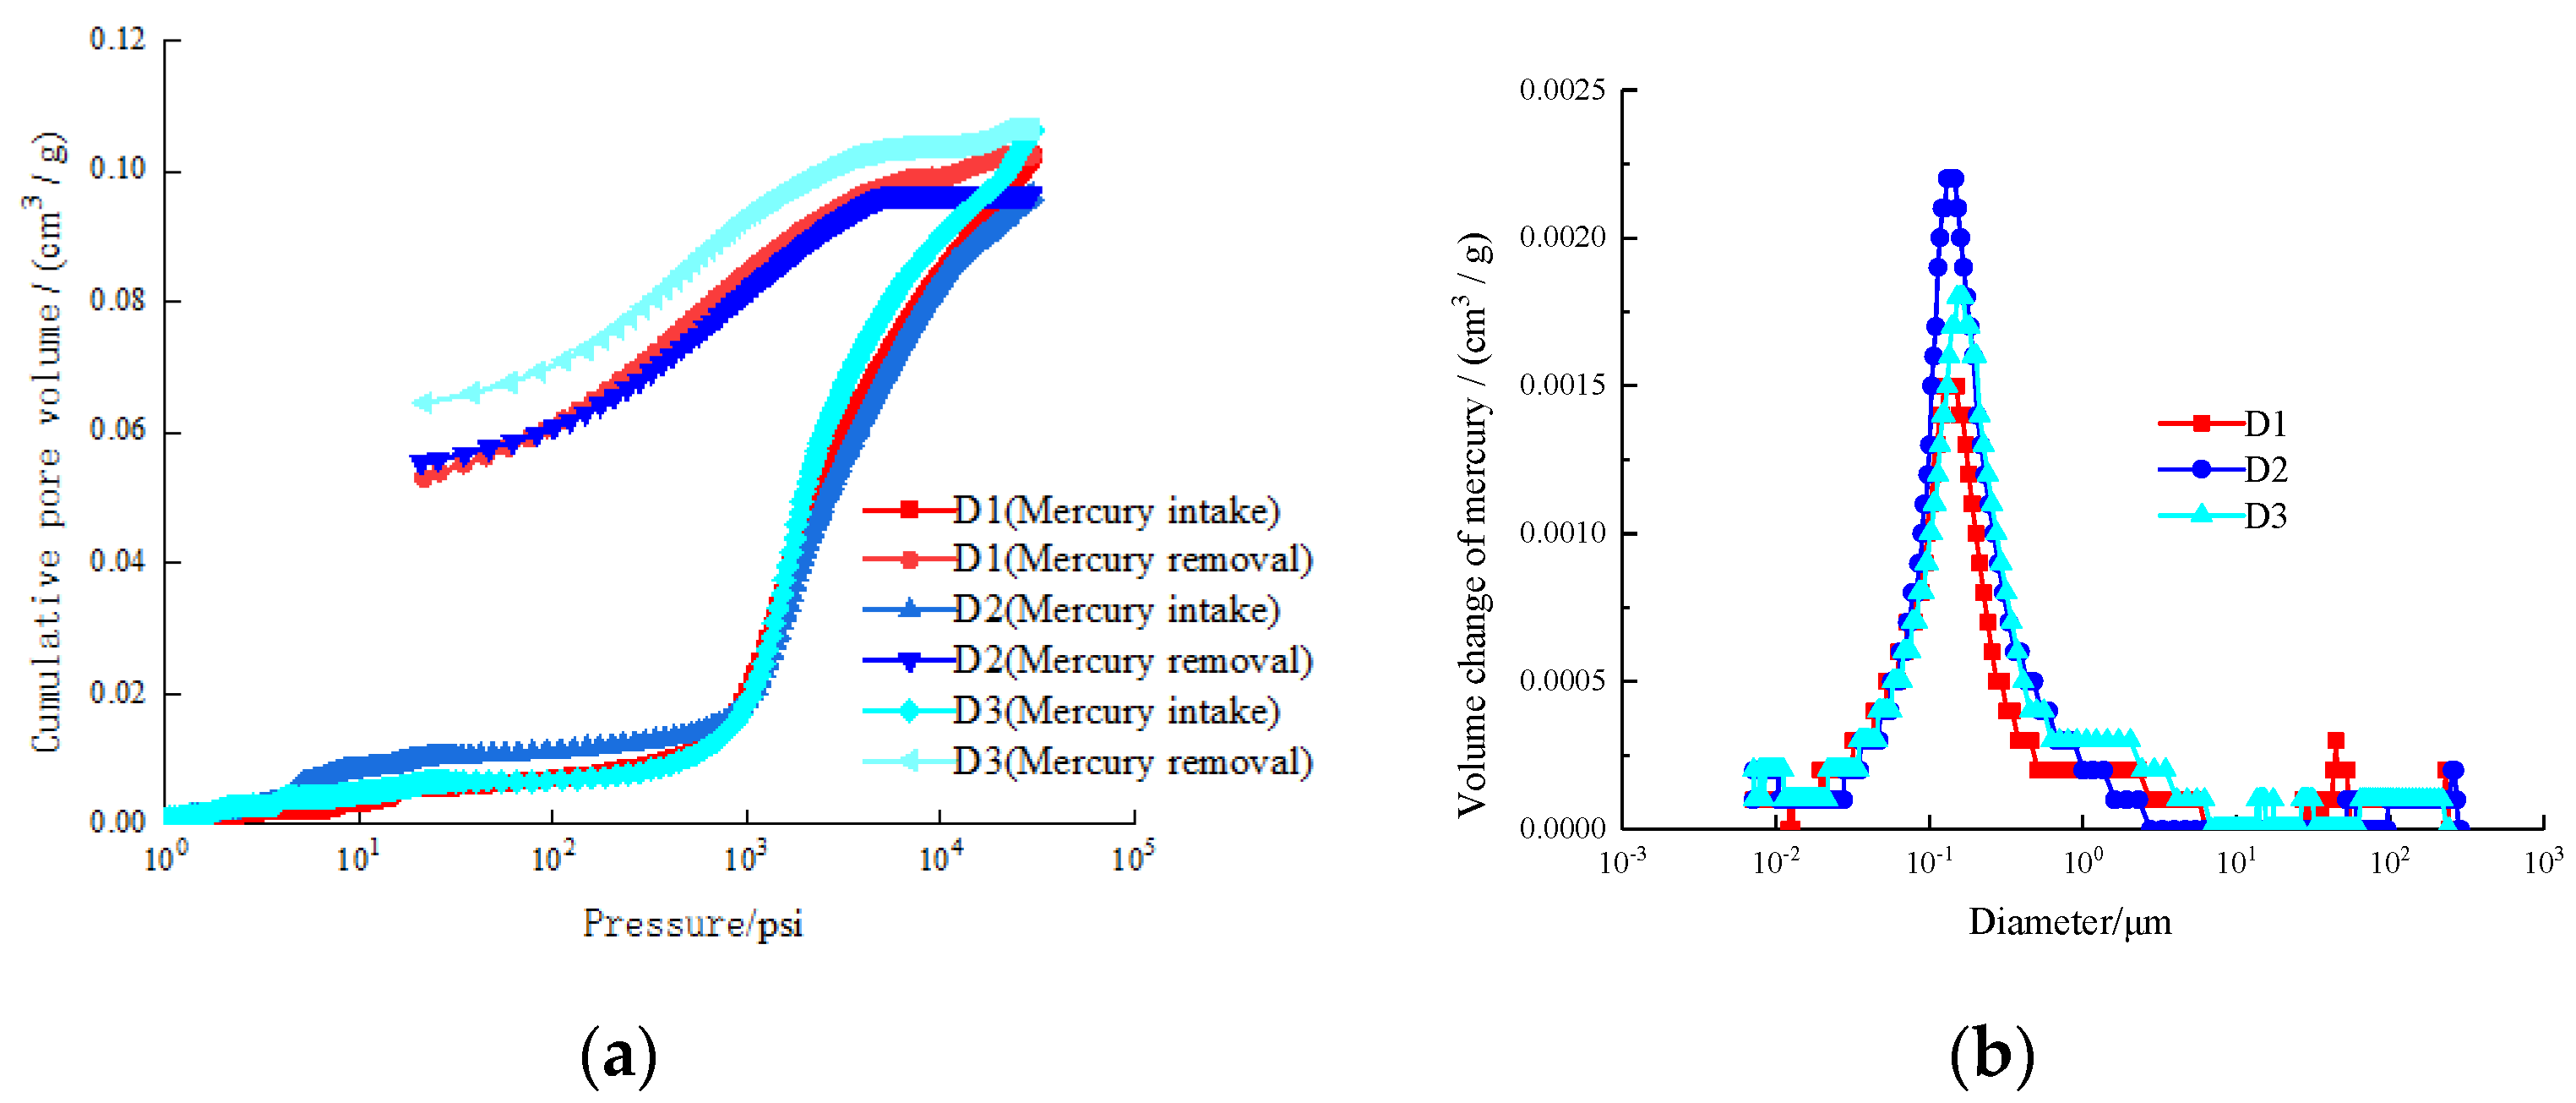
- (d)
- Type IV High Mercury Inlet Pressure-Microporous Type
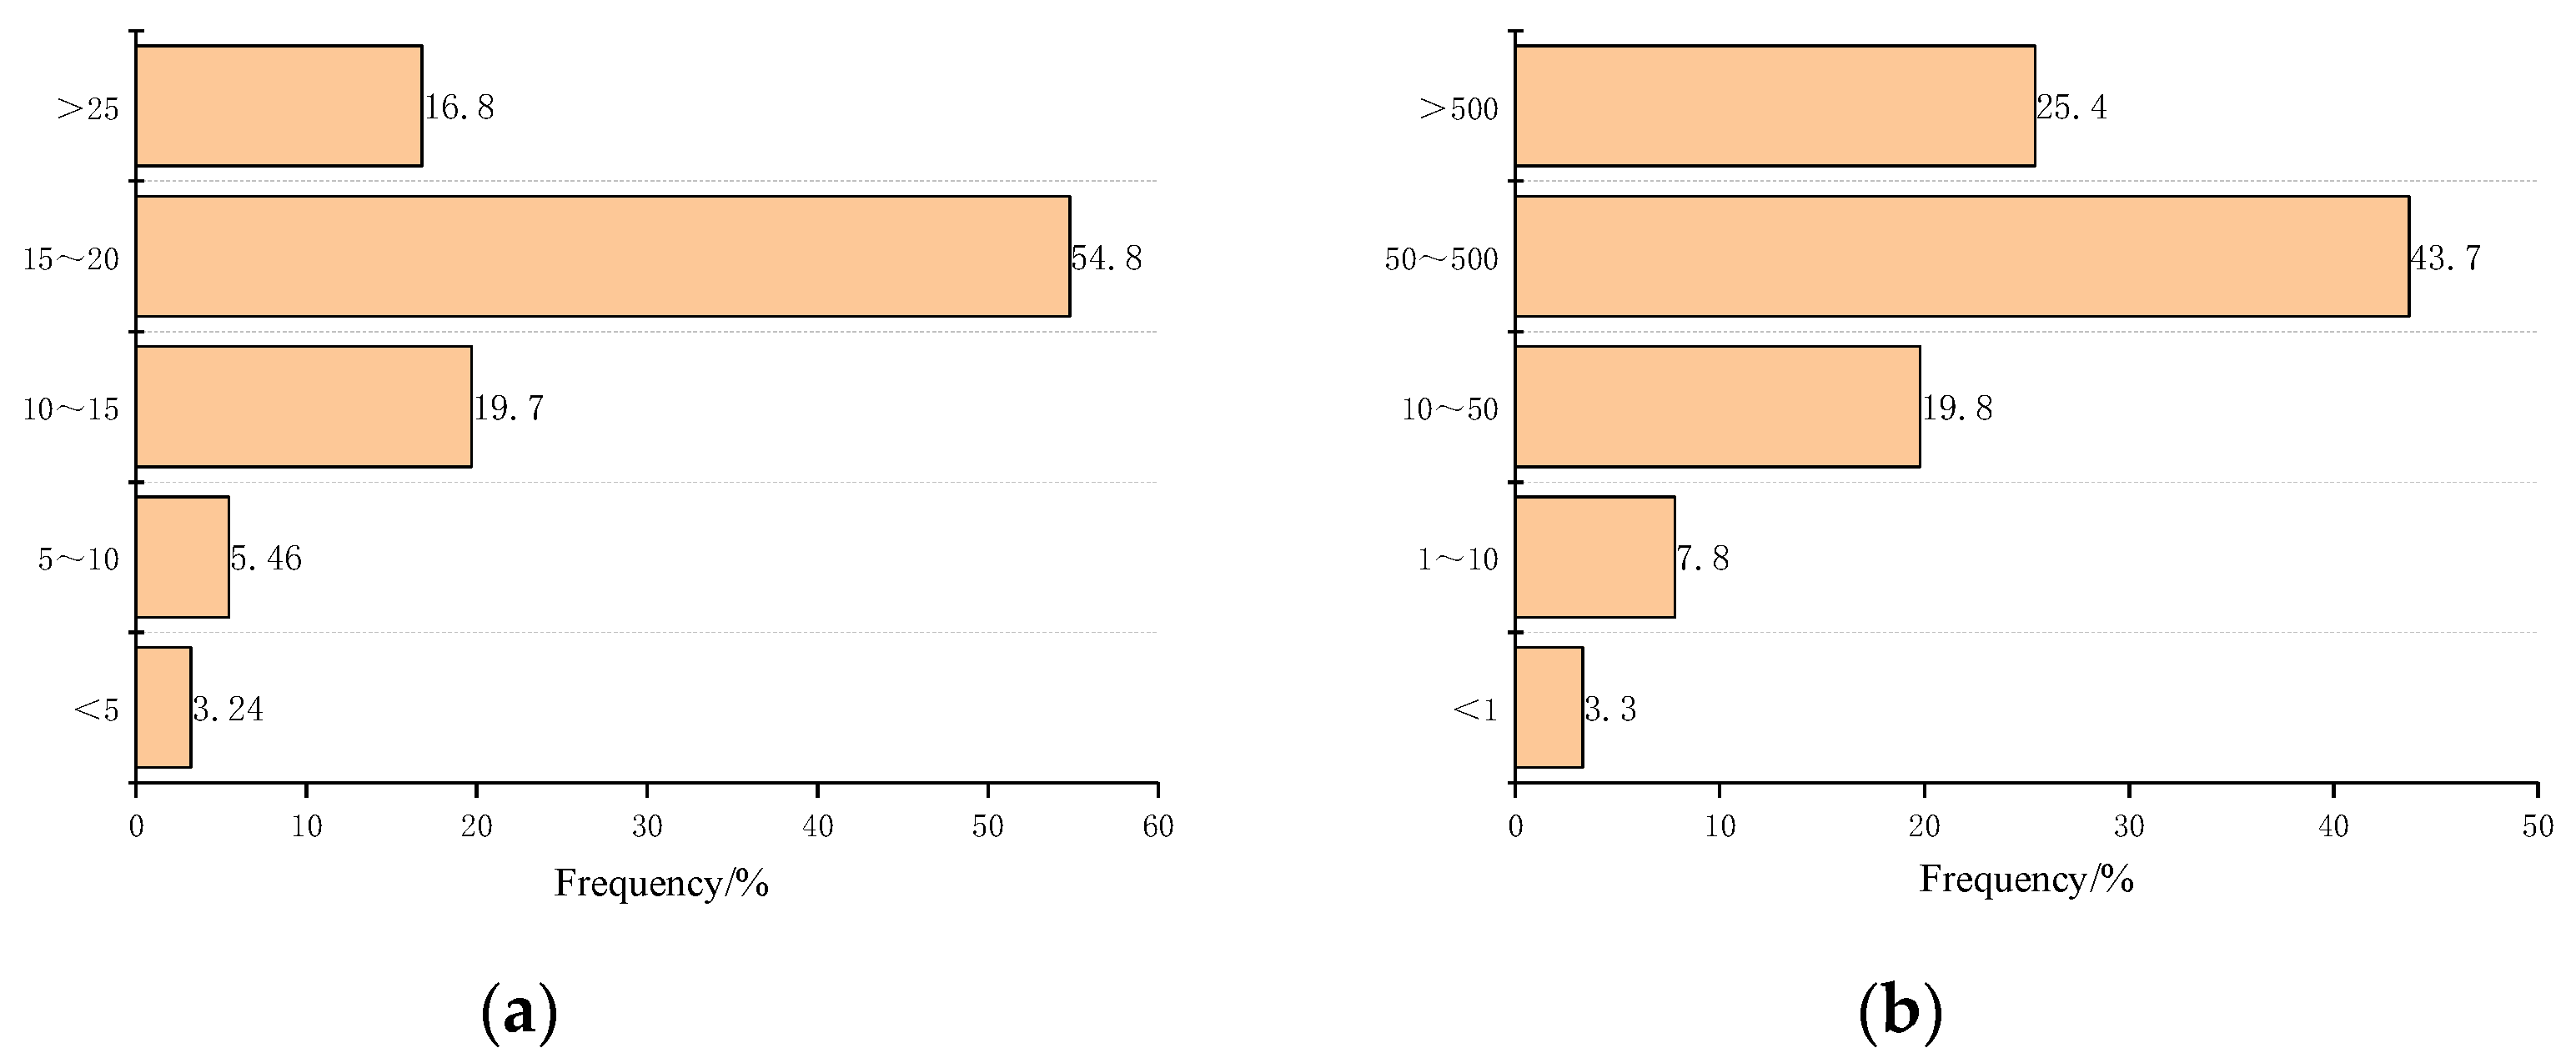
4.2.2. Characteristics of Pore Structure Parameters
- (a)
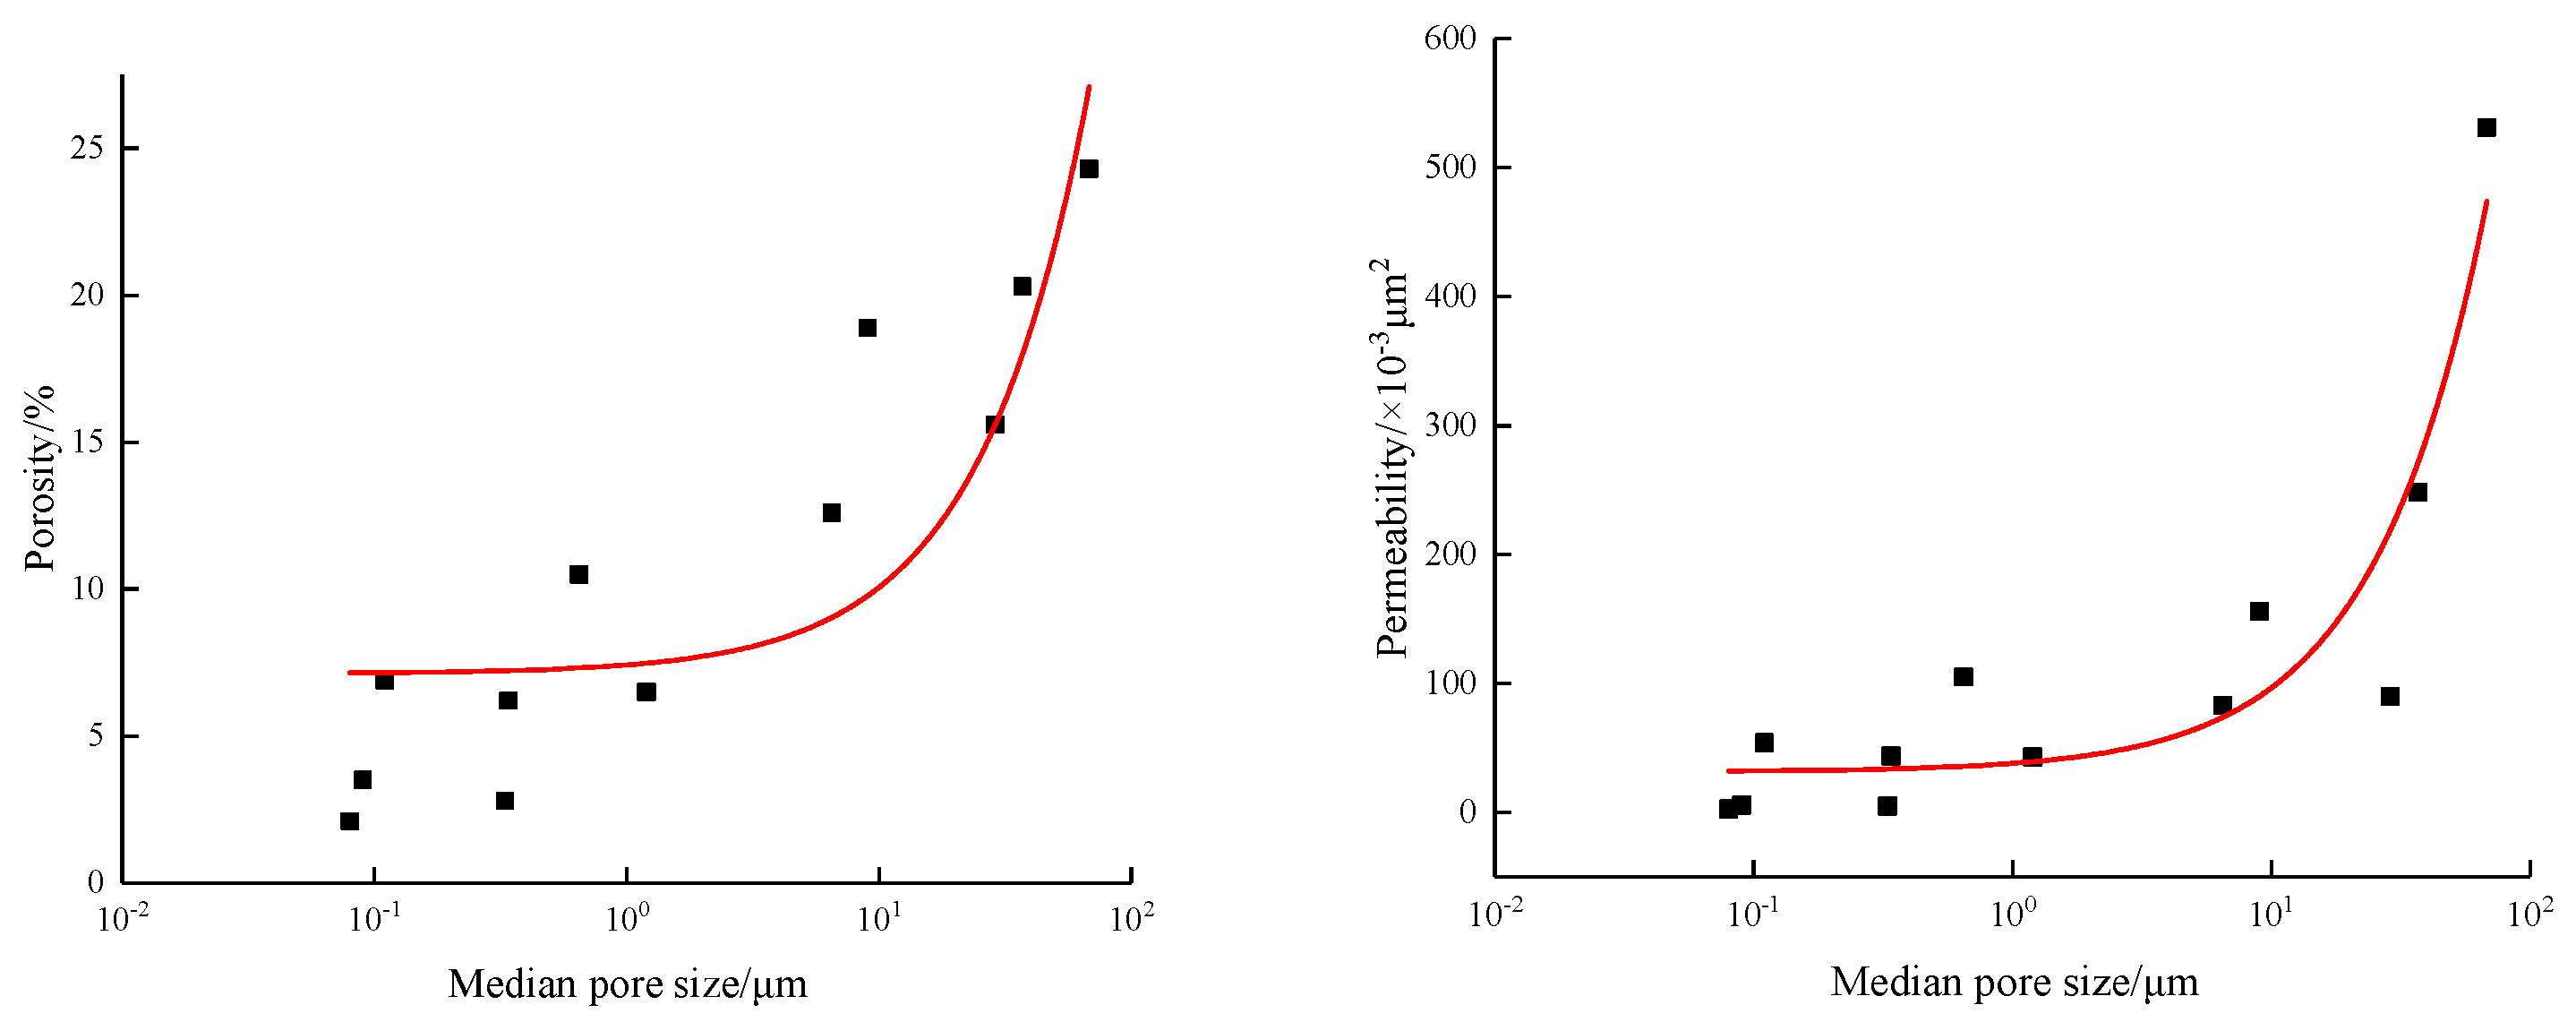
- The Impact of Pore Size on Physical Properties
- ①
- Median aperture
- ②
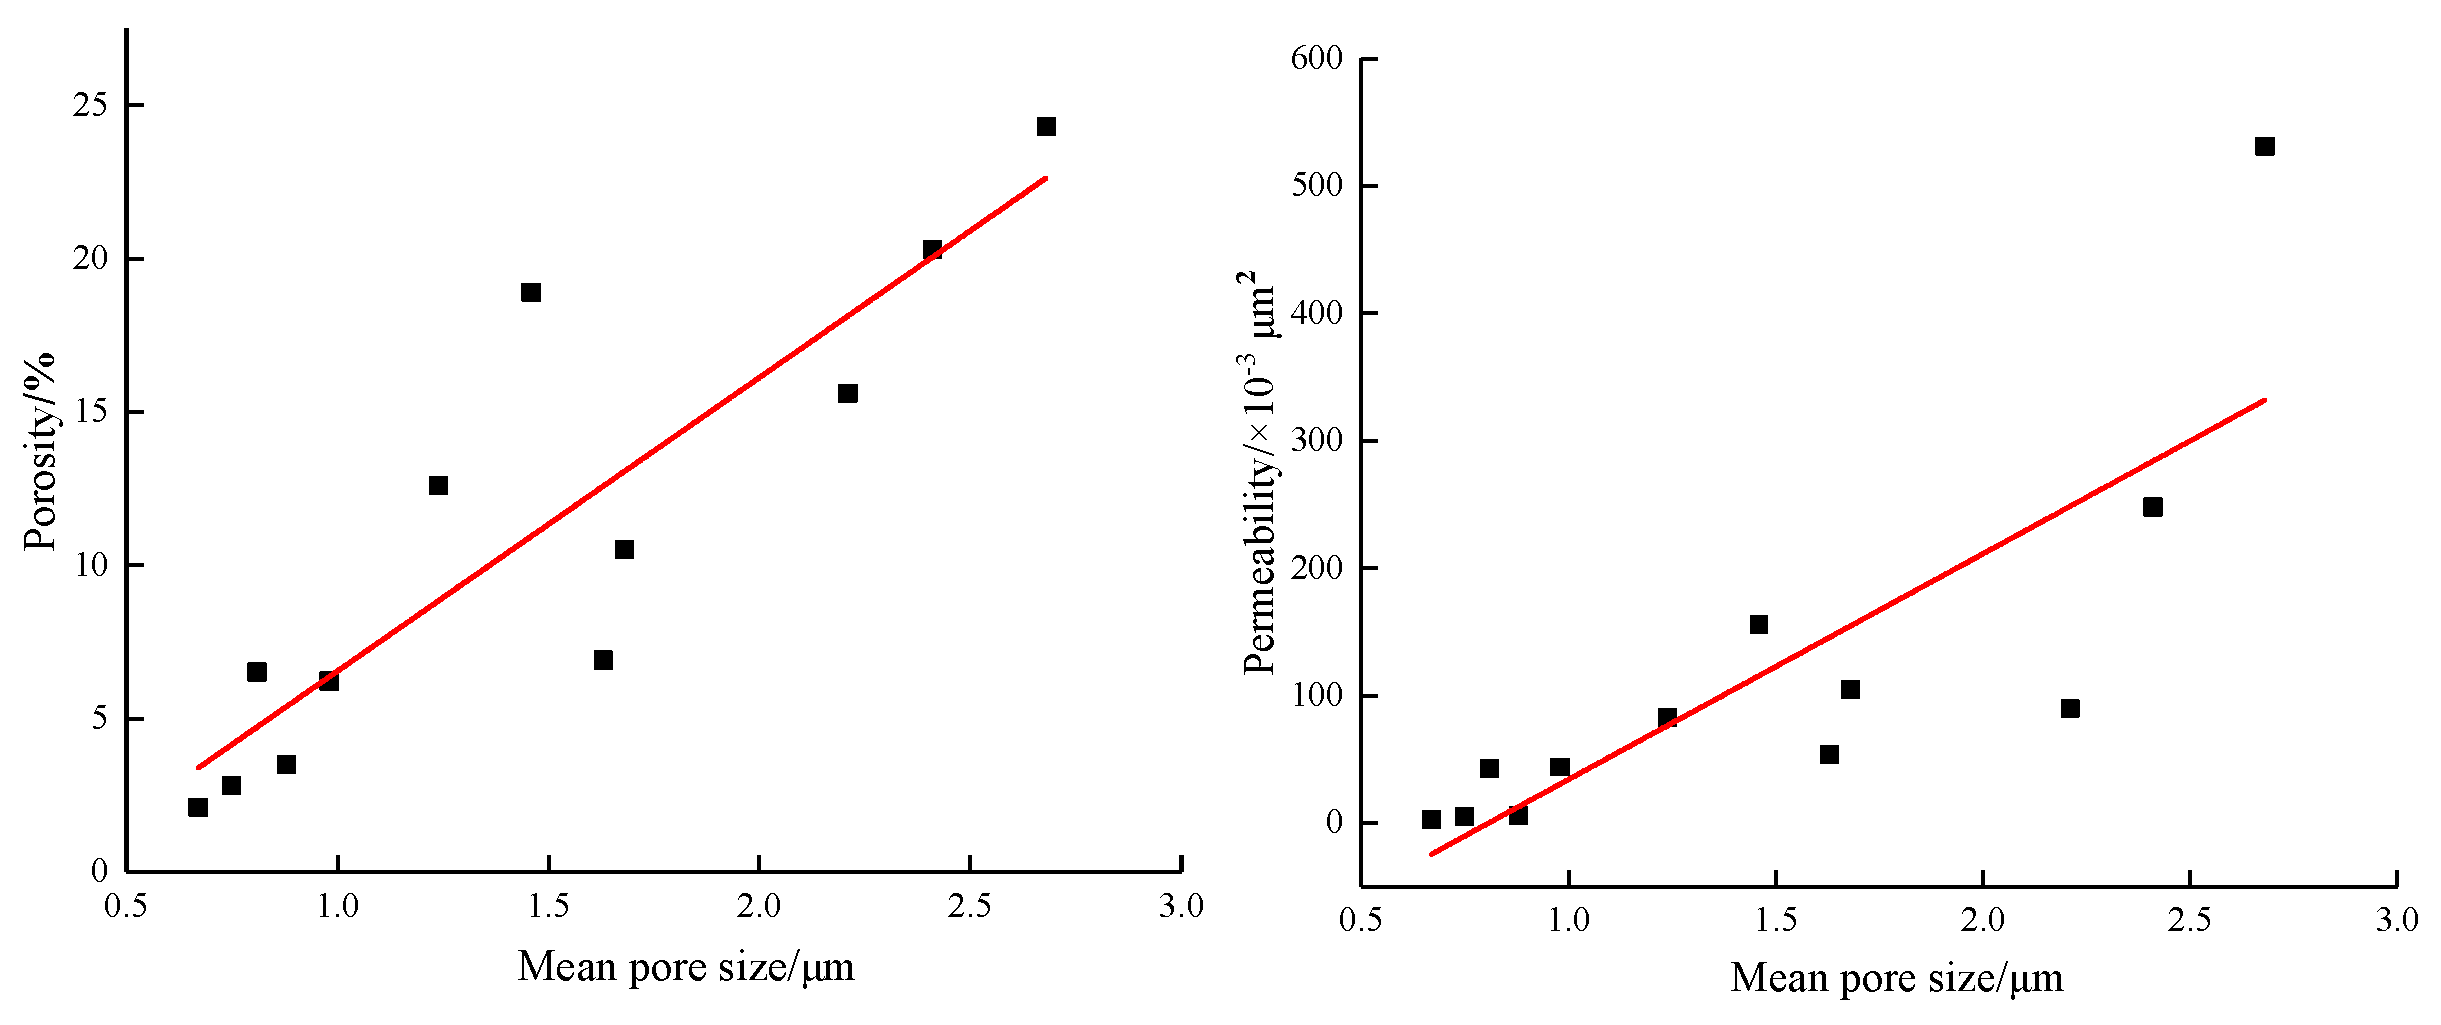
- Mean pore size
- (b)
- The Influence of Characteristic Parameters of Pore Sorting on Physical Properties
- ①
- Sorting coefficient
- ②
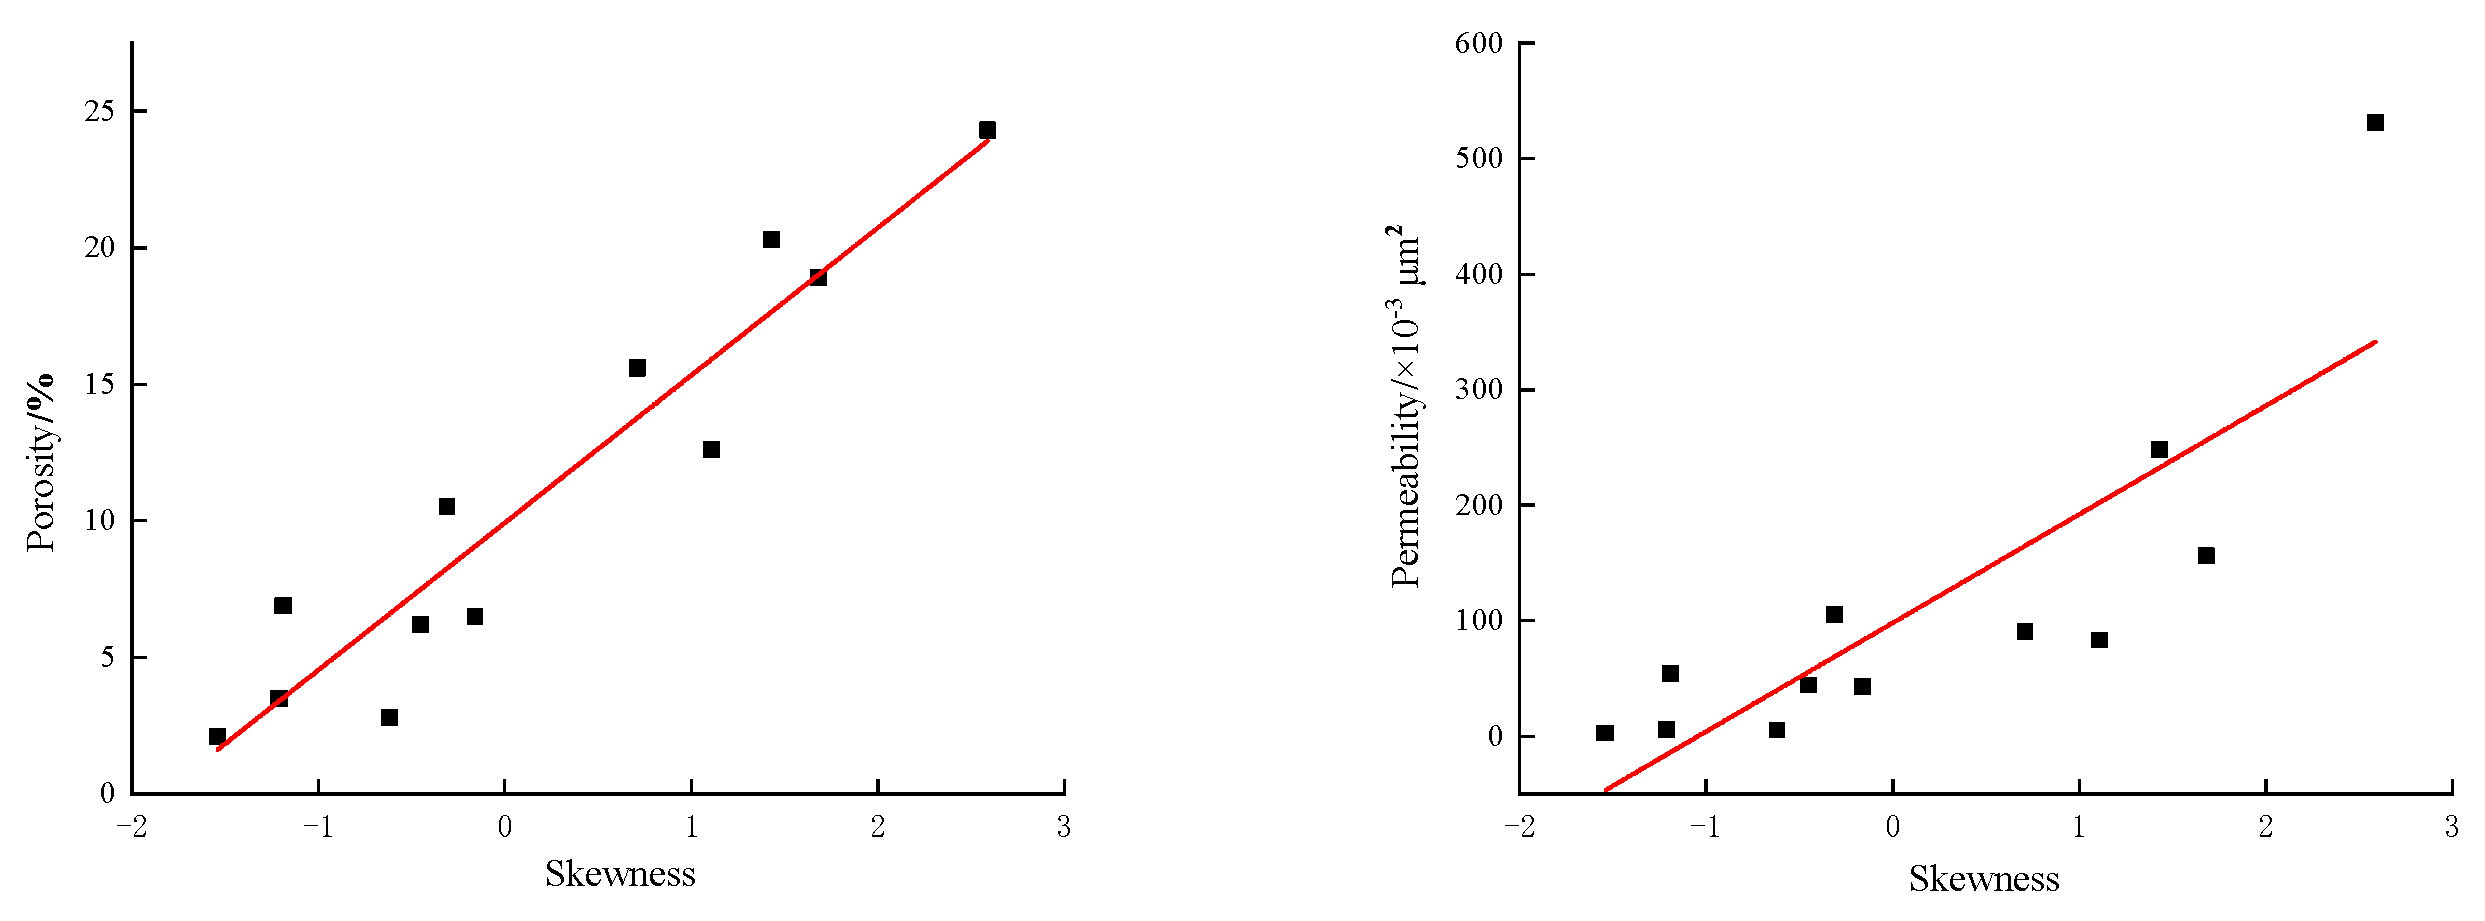
- Skewness
- (c)
- The Influence of Pore Connectivity Parameters on Physical Properties
- ①
- Mercury removal efficiency
- ②
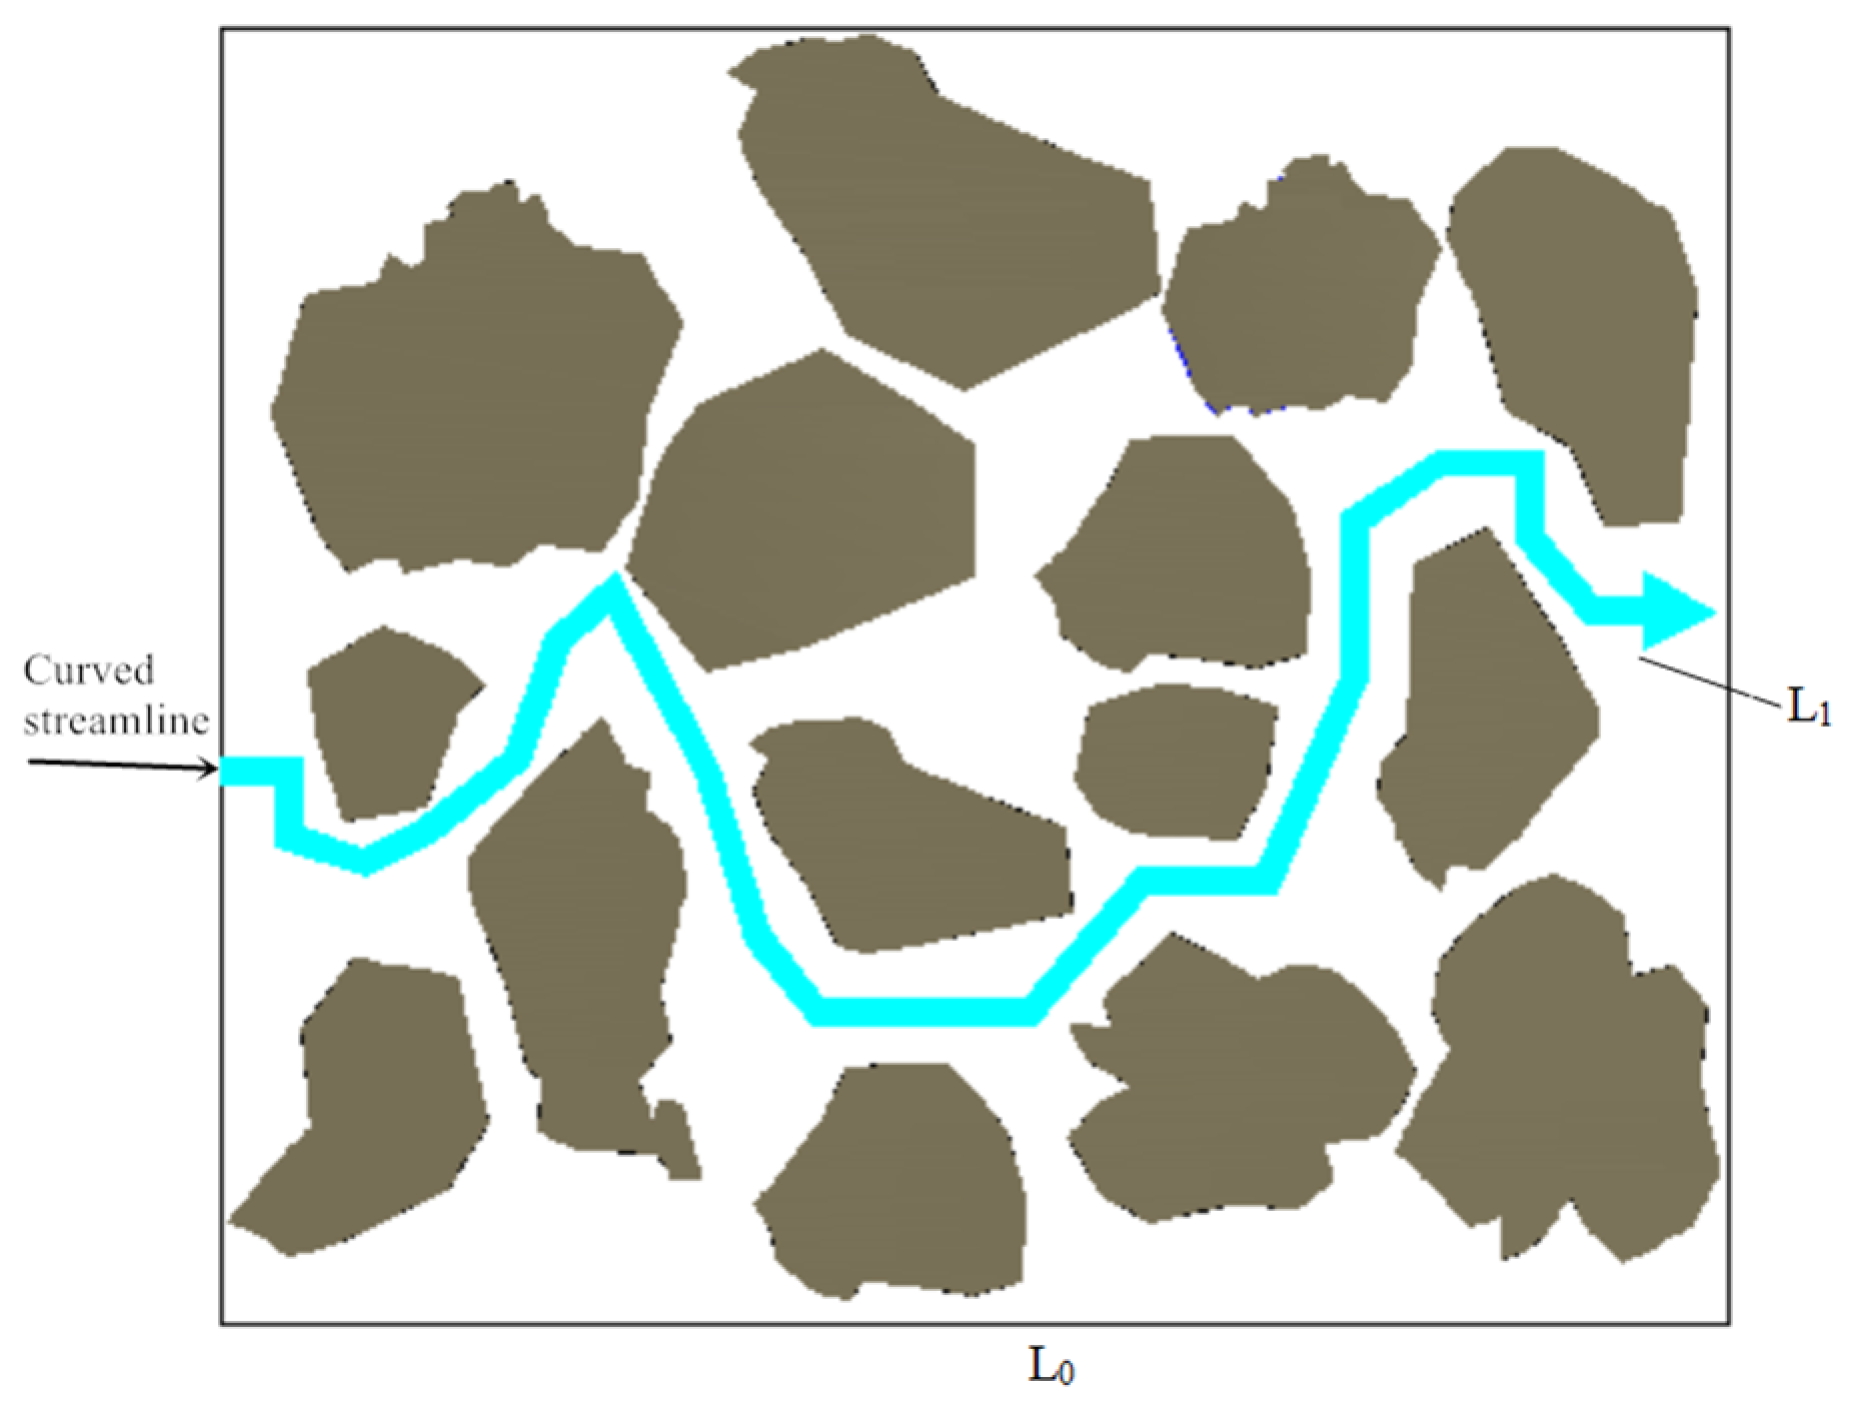
- Tortuosity
5. Establishment of Pore Structure and Seepage Flow Model of Sandstone Digital Image
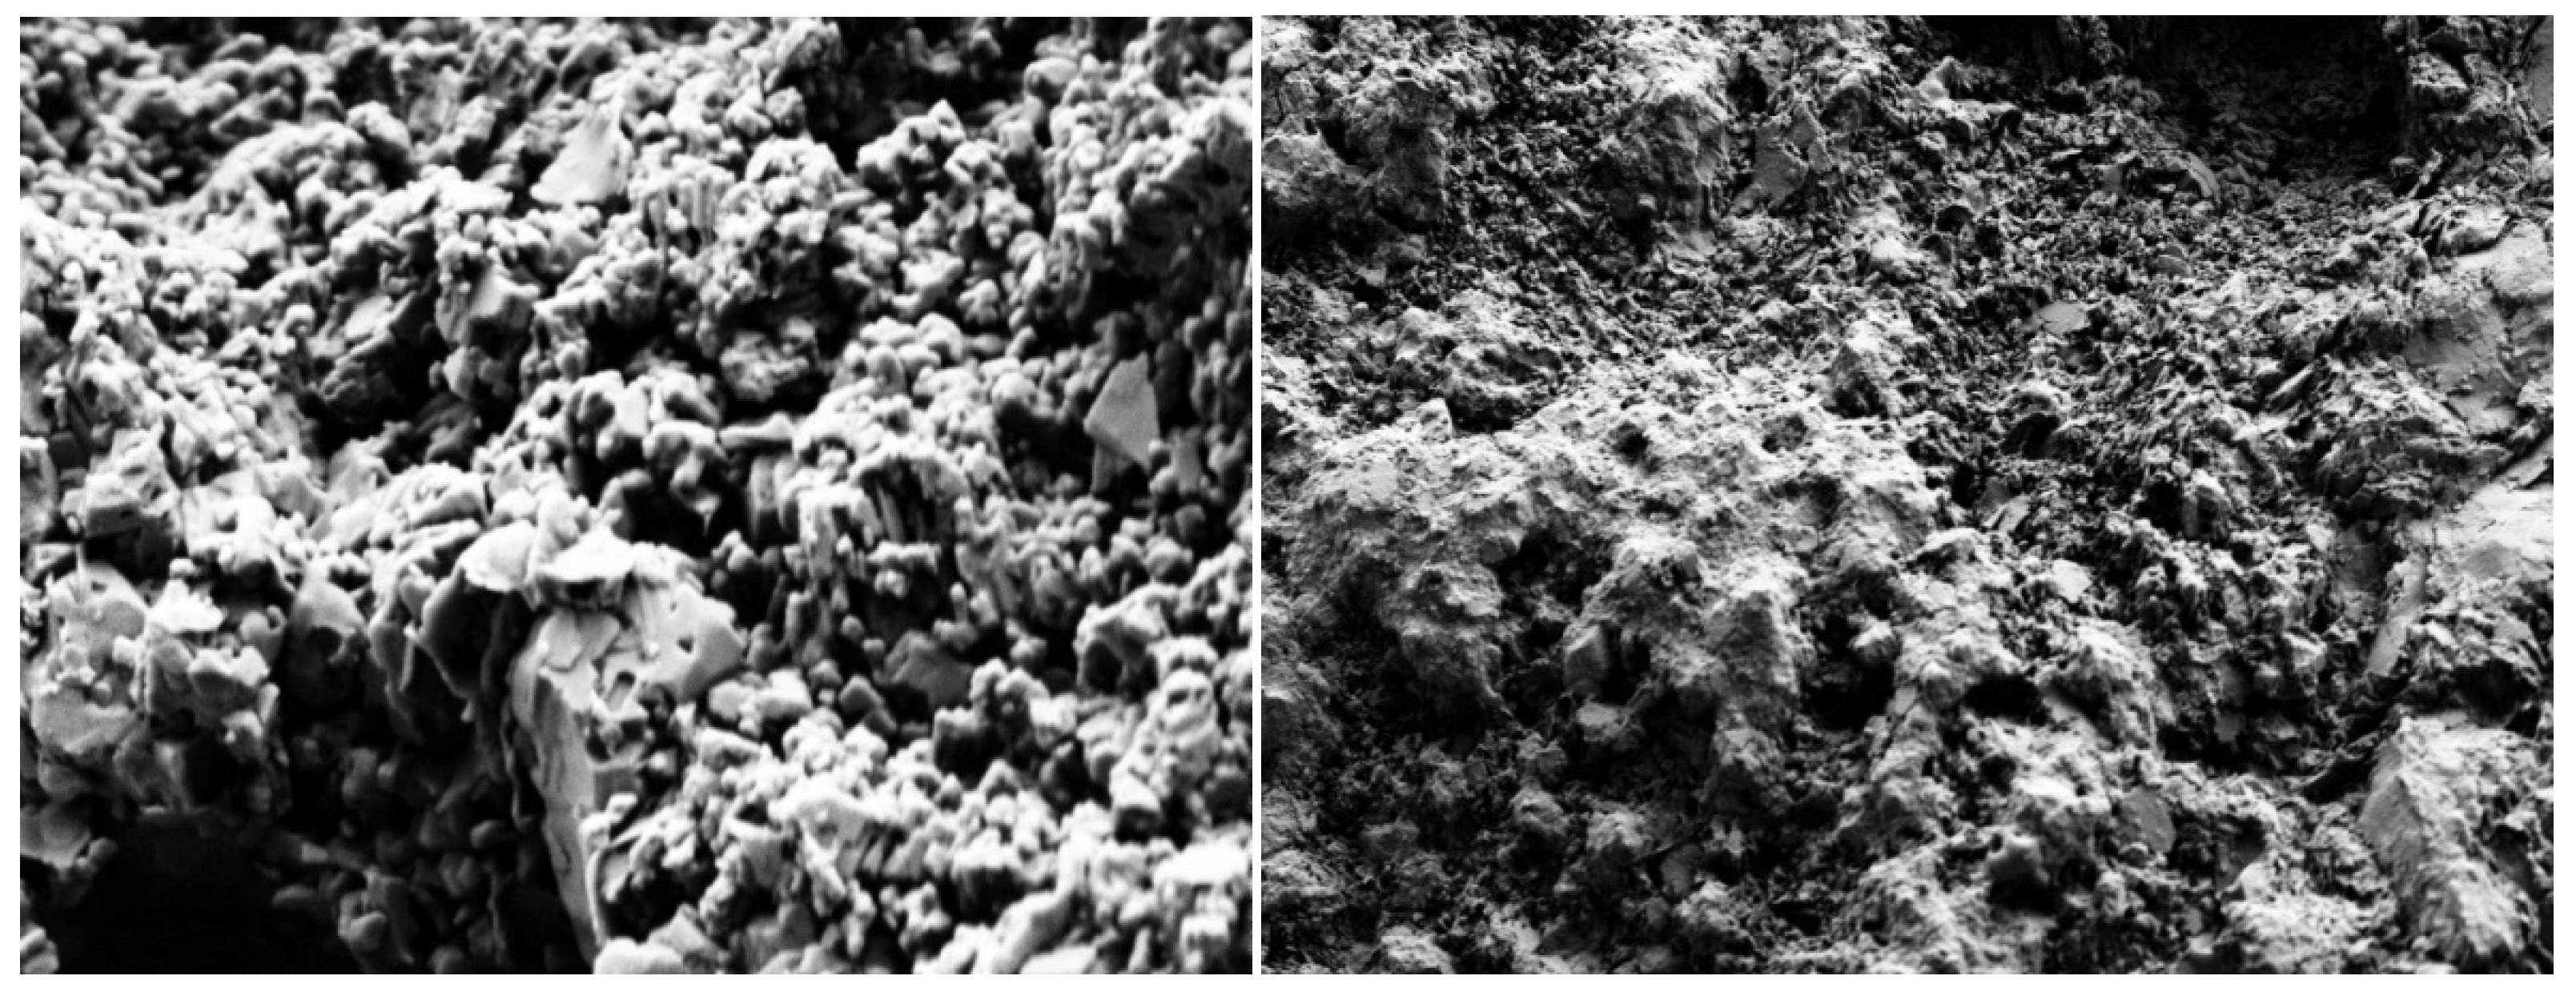
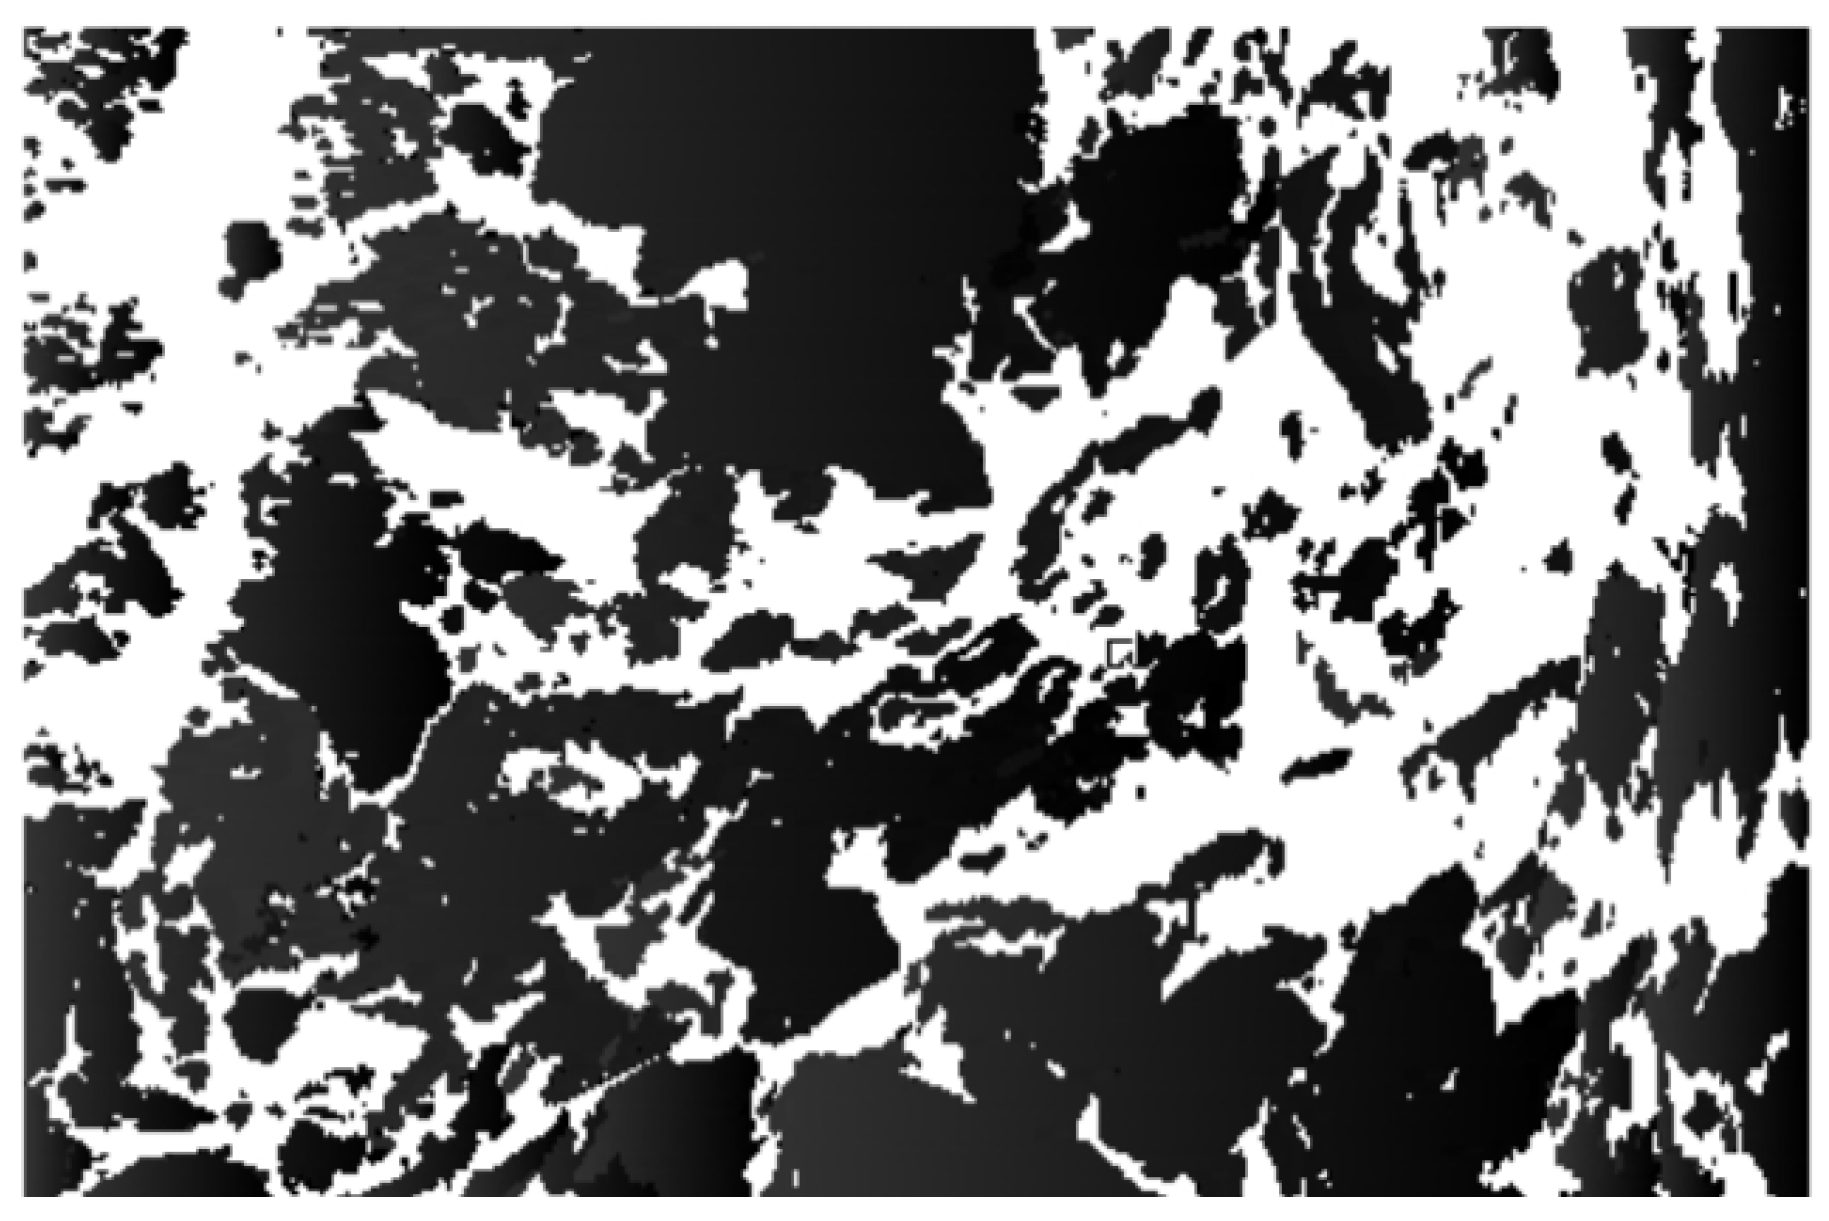
5.1. Pore Structure Modeling Based on Digital Images
- Grayscale processing of SEM images
- 2.
- Use the threshold function to distinguish the skeleton and the pores and use the filter function to process the fragmented pores and solid particles in the image to correct the morphological characteristics of the sandstone pore structure.
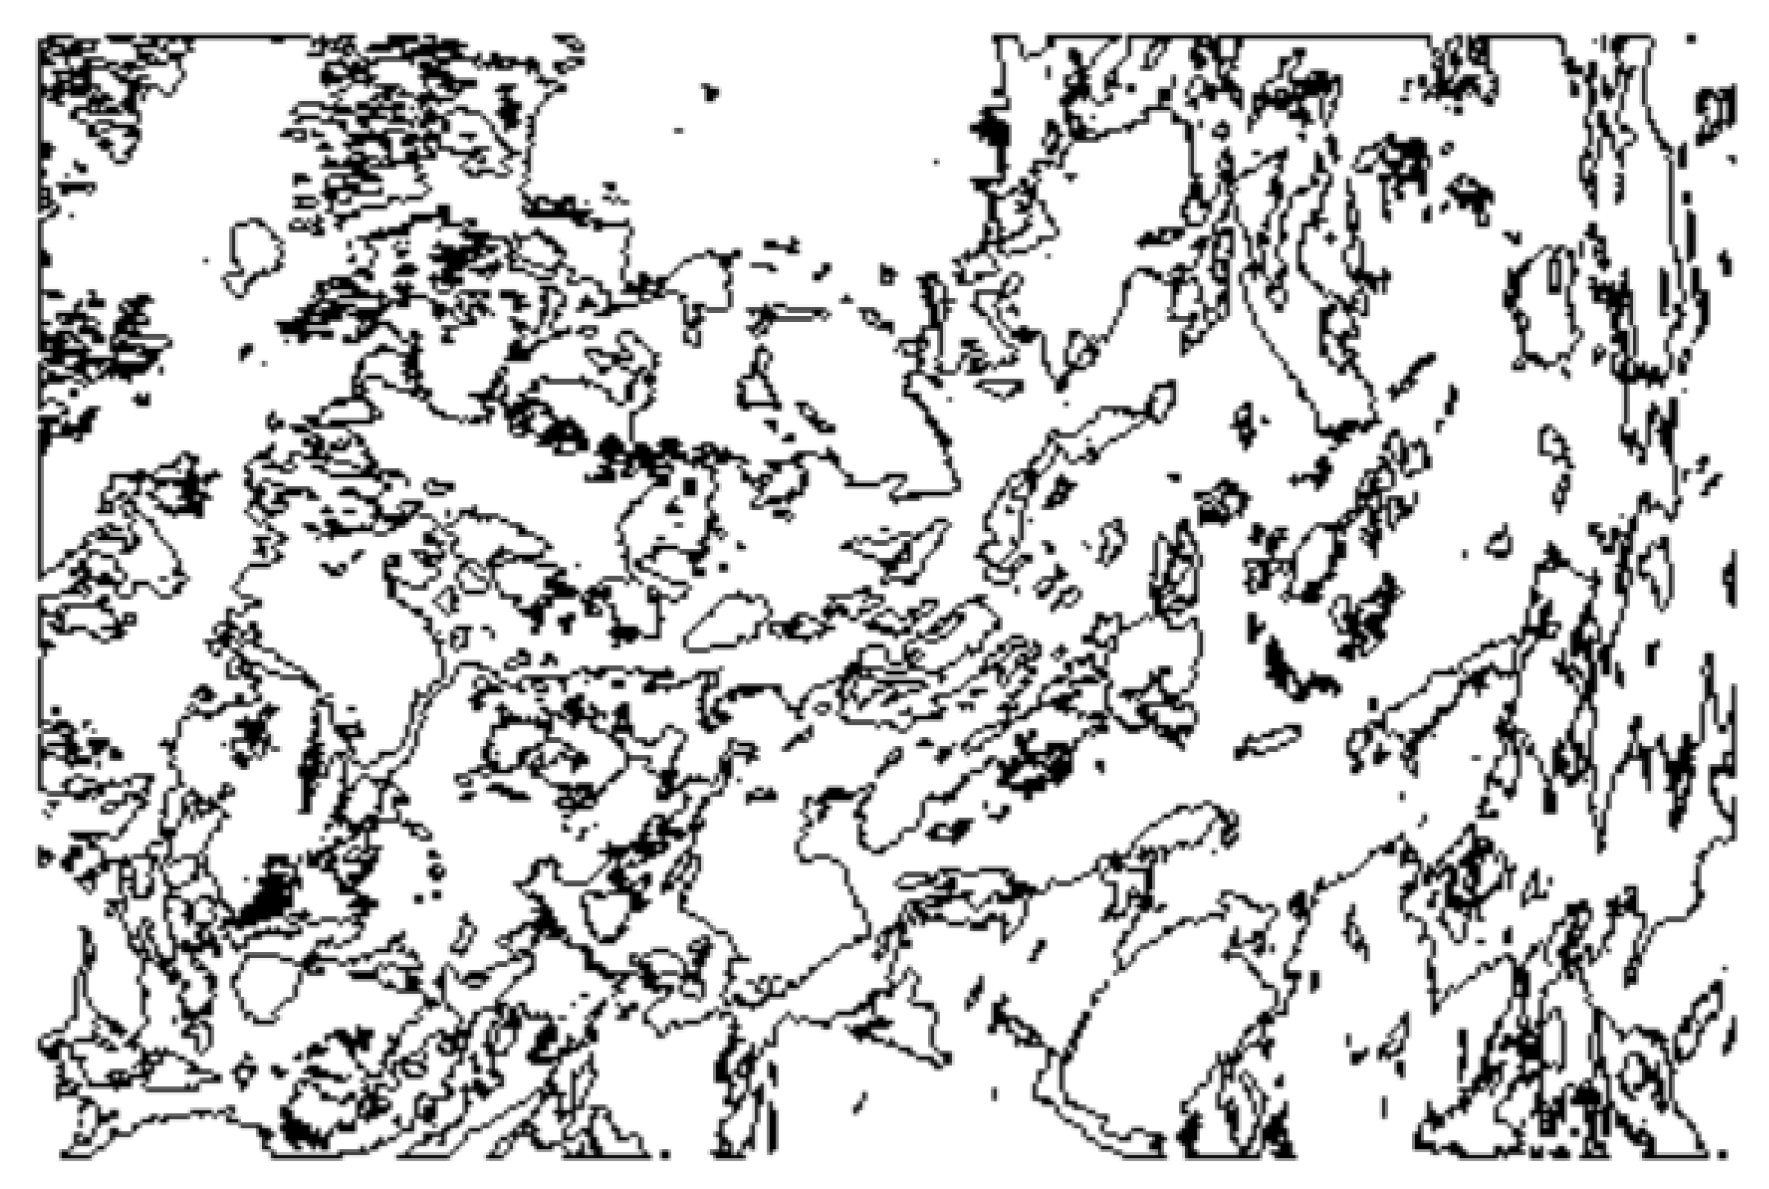
- 3.
- Digital image vectorization by importing the image into AutoCAD for drawing
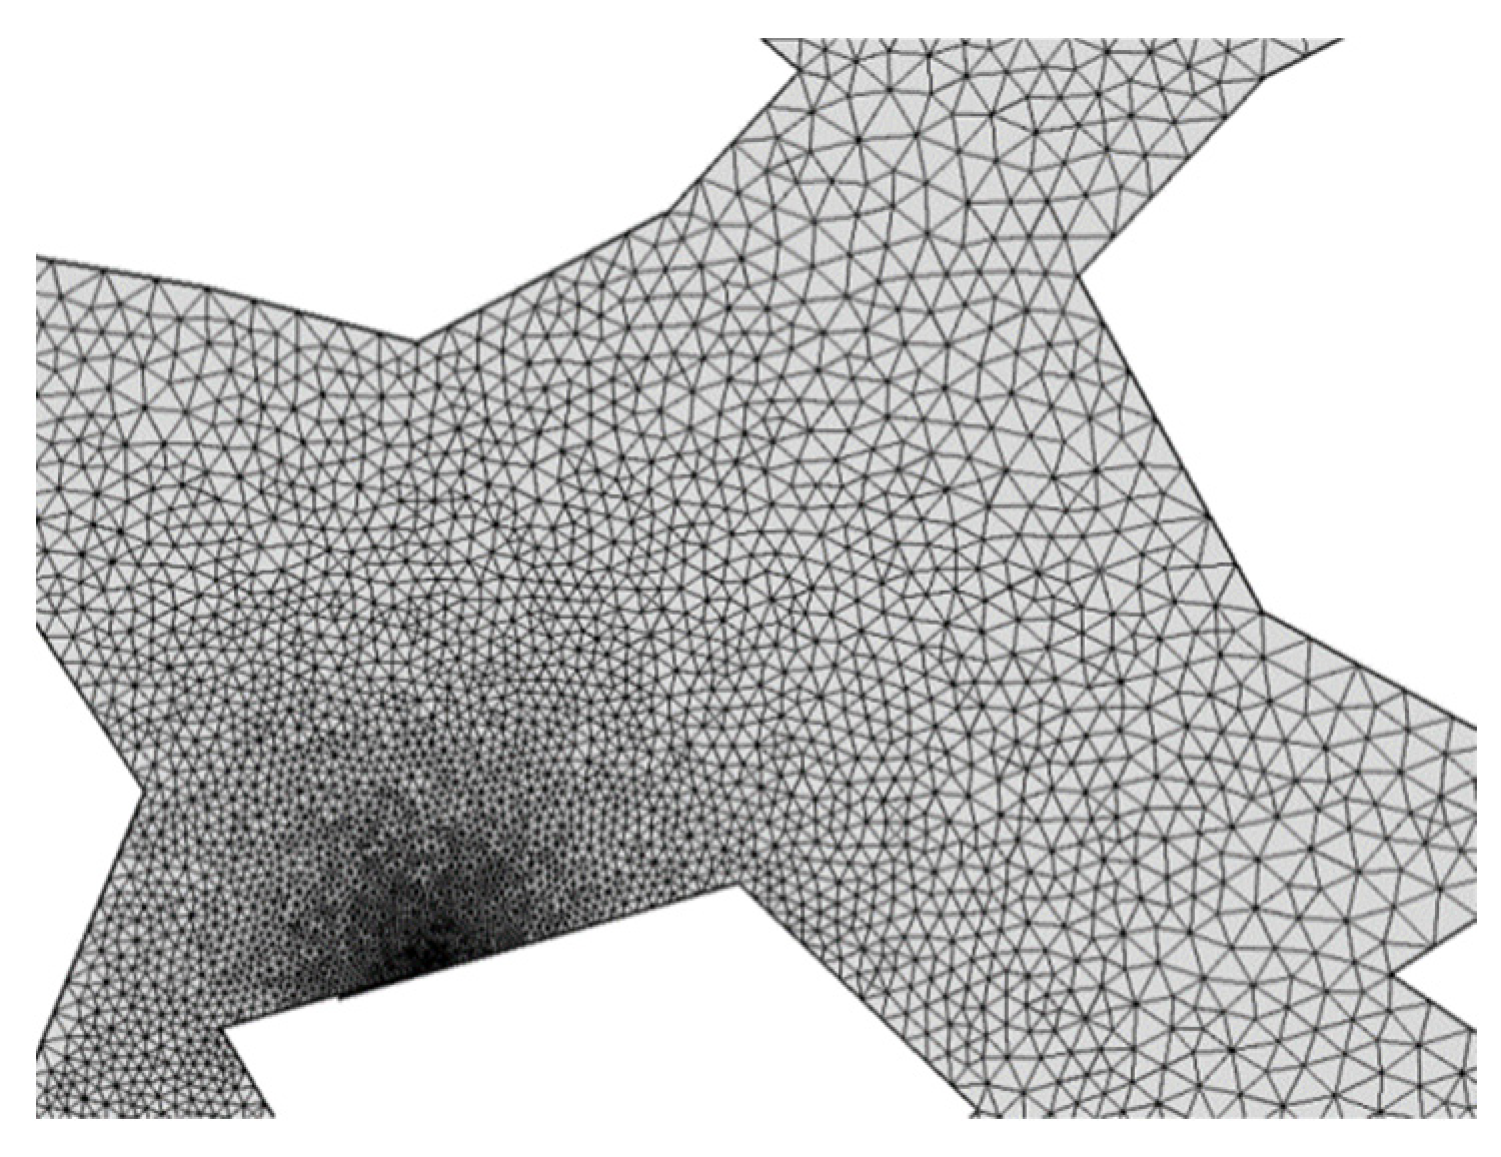
- 4.
- Import numerical simulation software to generate a finite element model
5.2. Fluid Flow Model of Sandstone Pores
- Due to the random distribution of coal-bearing strata in this area, the basic physical properties of coal-bearing sandstone are regarded as homogeneous.
- The fluid in the pores of coal-bearing stratum sandstone is groundwater single-phase fluid, and the influence of gas flow on the seepage process is not considered. The flow of groundwater in the pores of coal-bearing stratum sandstone is regarded as an isothermal and steady-state seepage process, which does not consider energy loss during the flow of groundwater.
- During the flow of groundwater in the pores of coal-bearing formations, it is assumed that the groundwater is incompressible.
- The strain of porous media only considers the strain change of the skeleton and ignores the strain change of the solid particles.
6. Numerical Simulation of Micropore Seepage Flow Characteristics in Sandstone
6.1. Establishment of the Seepage Flow Model
6.1.1. Model Boundary Conditions and Setting of Definite Solution Conditions
6.1.2. Calculation Model Parameter Settings
6.2. Analysis of Fluid Seepage Characteristics under Different Inlet Pressures
6.2.1. Selection of Model Control Equations
6.2.2. Results
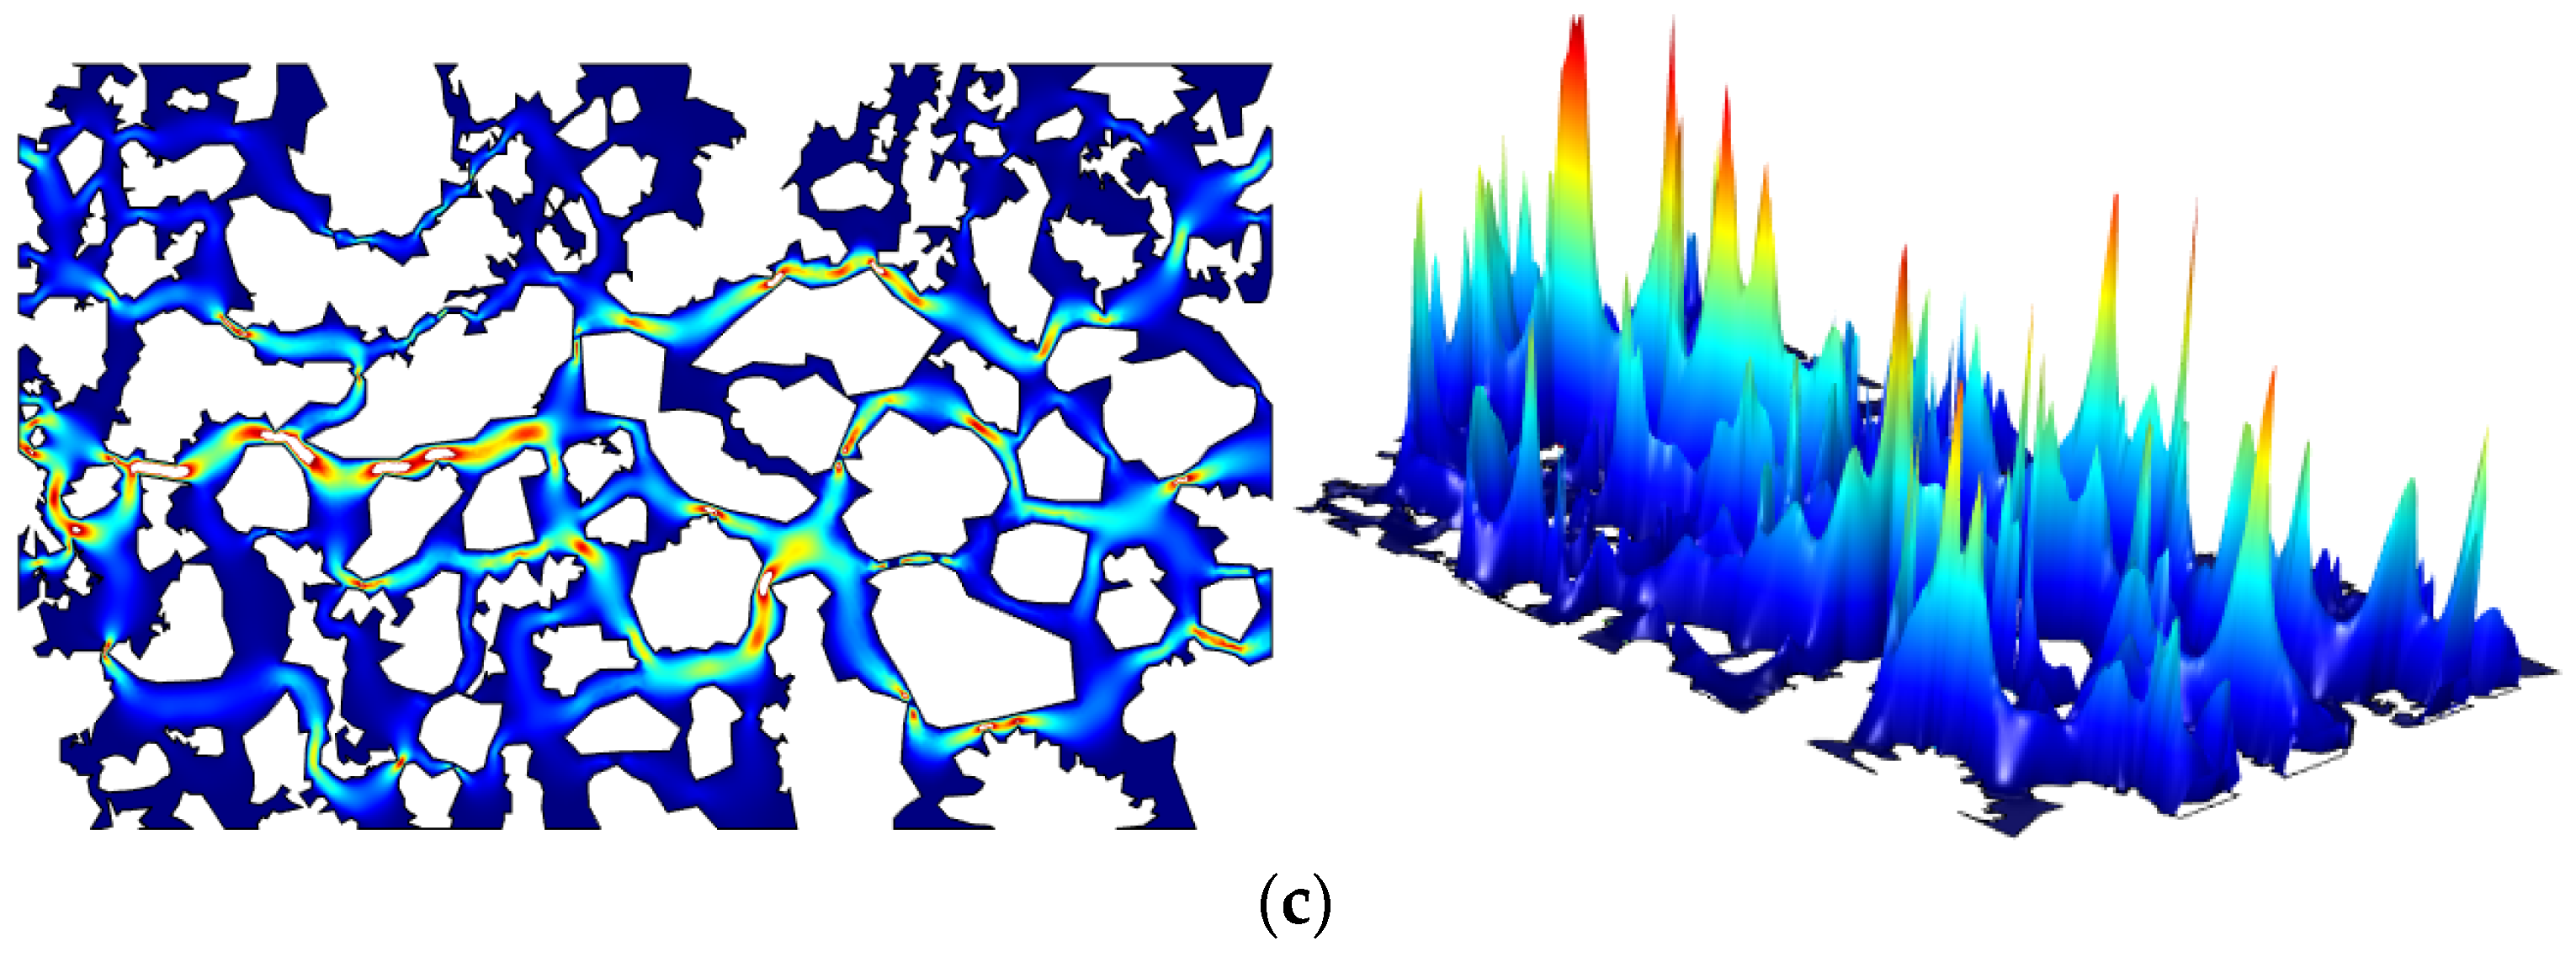
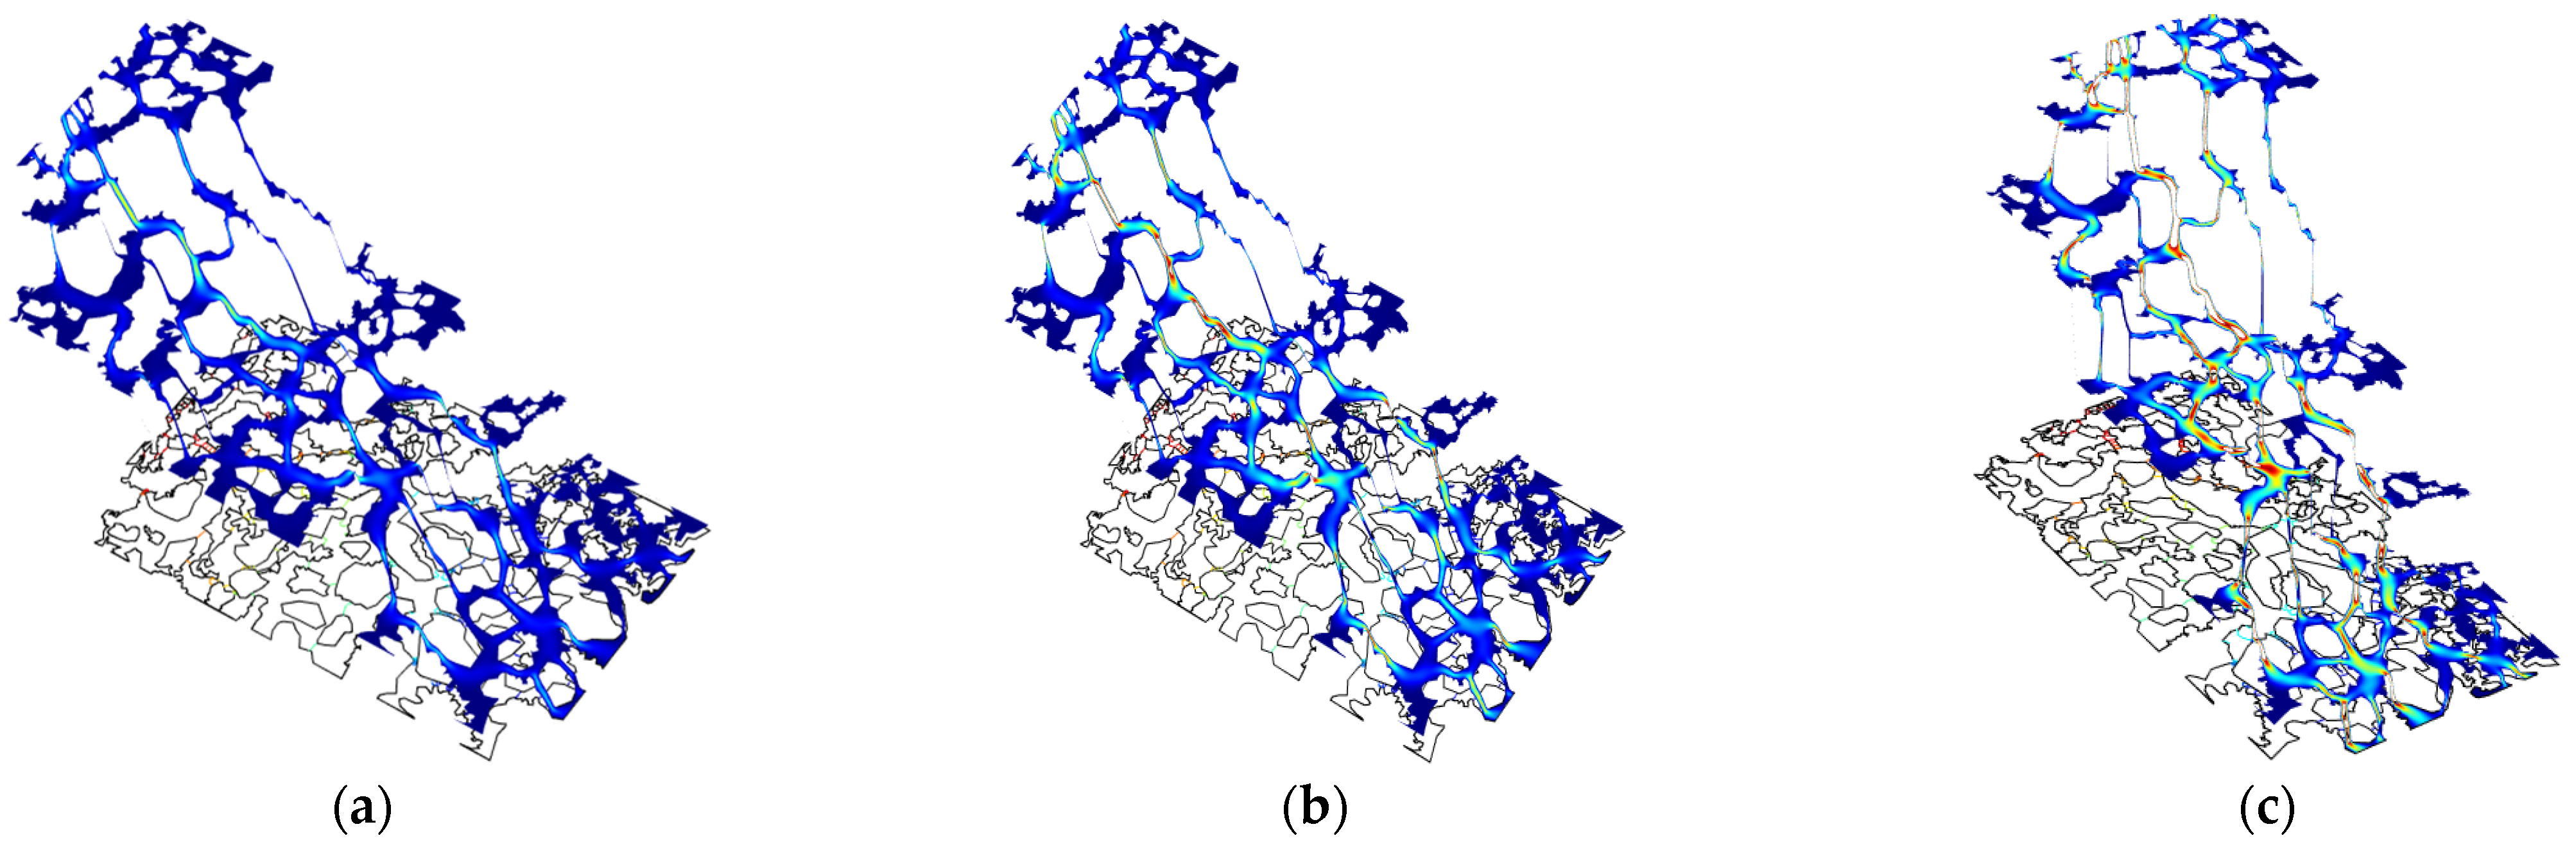
- Under similar conditions, as the inlet pressure continues to increase, the flow velocity at the outlet also increases accordingly, and there is a certain linear correlation between the two. At the same time, the overall flow velocity of the coal-bearing formation flow field also increases correspondingly with increasing inlet pressure.
- In the narrow pores, the fluid velocity is significantly faster, and the velocity of the pore flow is relatively small where the cross section of the pore flow becomes larger. Therefore, the higher pressure in the pores is mainly distributed in the areas with smaller pore diameters, indicating that, in some areas of the bellows with smaller pore diameters, larger pressure conditions are often required for the fluid to obtain a certain flow rate.
- This figure can clearly define the stagnant area where the fluid velocity is 0 in the model, indicating that there are a certain number of “dead holes” in the sandstone pore structure in the study area.
- On the two-dimensional plane model of the pore structure of coal-bearing strata, the fluid velocity distribution is extremely uneven. The larger flow velocity is mainly concentrated in the central area of the model, while the edge area has a smaller velocity. This shows that the stratum pores in the study area are more developed in the center of the rock formation, with better pore connectivity, and relatively less developed in the marginal area, with poor pore connectivity.
6.3. Analysis of Fluid Percolation Characteristics under Different Physical Properties
6.3.1. Image File Import
6.3.2. Selection of Model Control Equations
6.3.3. Results
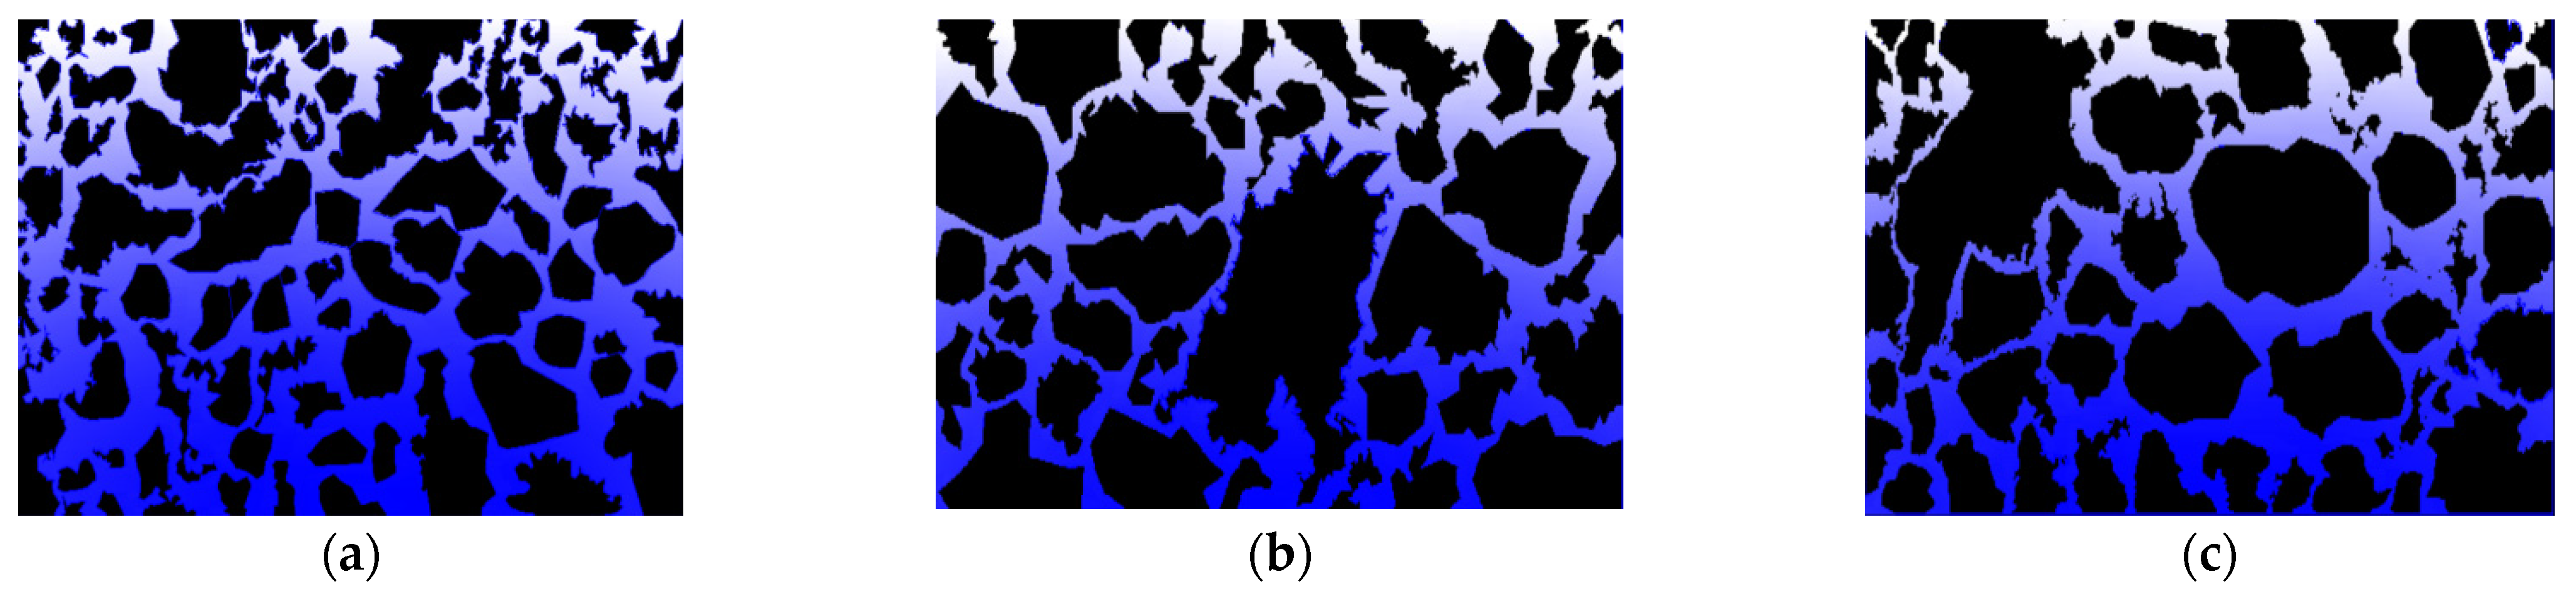
- With the decrease in porosity and permeability, the solid framework particles of sandstone increase, and the number of seepage channels in the pore structure of the rock formation shows a decreasing trend. With the deterioration of physical conditions, the distribution of pore structure inside the rock mass and the tortuous degree of fluid seepage routes gradually become more complicated.
- The velocity of fluid in coal-bearing formations is closely related to the physical conditions of the formations. With the deterioration of physical conditions, the fluid flow rate continues to decrease under the same inlet pressure.
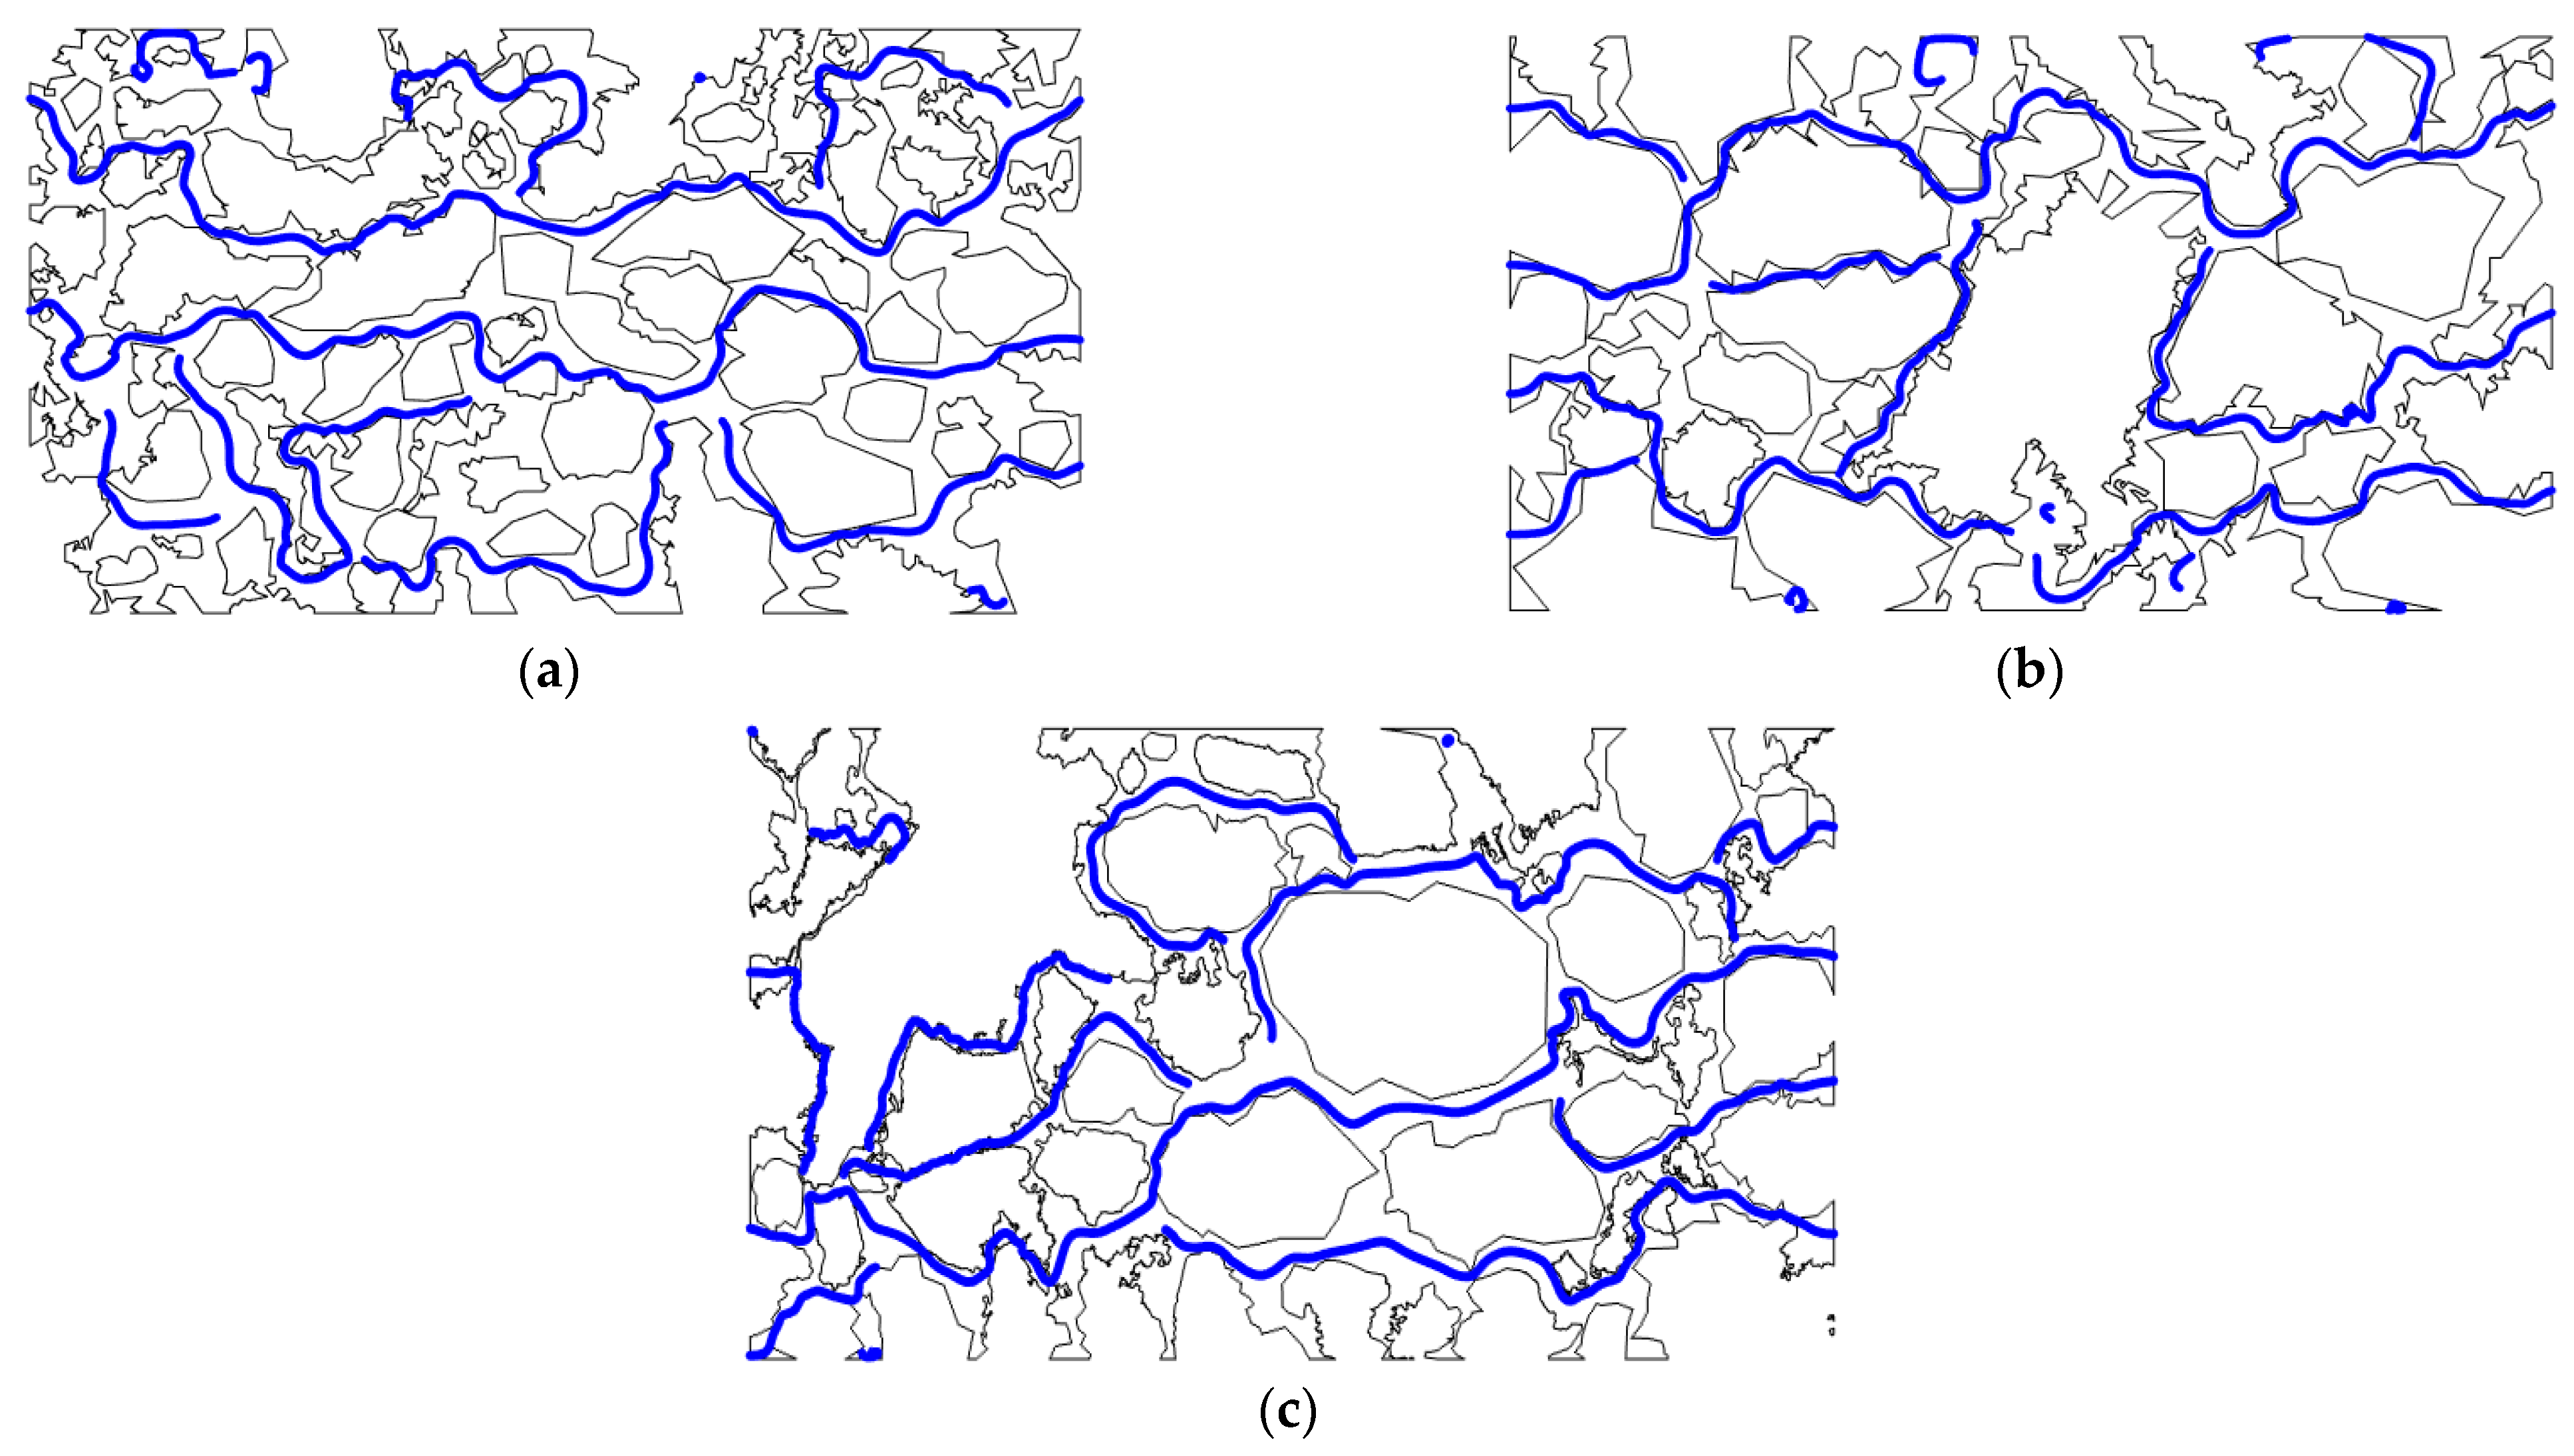
- By comparing Figure 36a–c, it is found that there is often a large number of disconnected pores in rock formations with poor physical properties. Changes in the physical conditions of coal-bearing formations have significant effects on the connectivity and seepage characteristics of the pore structure of the formation.
- The physical condition of coal-bearing strata plays a vital role in the process of fluid seepage. When the physical conditions are good, the pressure overcome by the fluid seepage process in the porous medium is smaller, and the fluid flow is easier. With the deterioration of physical conditions, the pressure to overcome fluid seepage further increases, and the fluid flow process is highly blocked.
- When the same inlet pressure is given to formations with different physical conditions, the lower the porosity and permeability of the formation, the faster the pressure attenuation. Therefore, in the actual grouting process, to spread the grout to a certain position in the rock formation, it is often necessary to increase the grouting pressure.
- The flow area of groundwater in the pores of sandstone is mainly concentrated in the middle area of the structure, and seepage is always along the narrow and long channels of large pores with better connectivity.
- There are some areas within the pores of sandstone where the groundwater flow velocity is 0, that is, there are some unconnected pore spaces in the internal pore structure of sandstone. Due to the existence of these blind-end pores, the groundwater seepage process is hindered to a certain extent. This also explains why the porosity measured by the image processing software is often greater than the actual porosity of the sandstone.
7. Conclusions
- Summary of microstructure: The matrix porosity is mainly 18.4~21.6%, the matrix permeability is mainly 123~441×10−3 μm2, the porosity and permeability have a positive correlation, and there is moderate deviation in the overall correlation. The types of pores are mainly intergranular pores and dissolved pores. The main types of throats in the coal-bearing strata are sheet-shaped, curved, and sheet-shaped throats. Through mercury intrusion experiments, the coal-bearing strata in the study area were divided into four types according to the mercury inlet pressure and pore size. The seepage capacity of coal-bearing formations is mainly controlled by factors such as the pore type, pore throat distribution, sorting ability, and overall connectivity. Therefore, strengthening the exploration of sandstone pore structure plays a decisive role in studying fluid seepage characteristics in porous media.
- A theoretical model of tortuosity applicable to the conditions of this study has been established. It provides a strong theoretical basis for the development of numerical simulations. At the same time, it further verifies the microstructure parameters. According to the numerical simulations, the pressure distribution of fluid in the process of porous media percolation is clearly not uniform, and the pressure and flow velocity of the fluid constantly attenuate.
- This study solves the three problems raised and obtains the following research rules to guide the project construction: The smaller the median pore diameter of the rock samples in the study area and the worse the pore structure characteristic parameters, the worse the overall lithofacies quality, indicating that the physical conditions and connectivity of the coal-bearing sandstone are worse, and the resistance that the fluid needs to overcome to enter the pore structure also becomes greater. The research conclusions obtained in the mine have general applicability to common sandstone in deep rock masses and can be extended to other projects with similar depths and similar geological conditions. Each characteristic pore structure parameter has a certain prerequisite relationship with the physical properties of the study area.
Author Contributions
Funding
Data Availability Statement
Acknowledgments
Conflicts of Interest
References
- Levy, D.; Roche, V.; Pasquet, G.; Combaudon, V.; Geymond, U.; Loiseau, K.; Moretti, I. Natural H2 exploration: Tools and workflows to characterize a play. Sci. Technol. Energy Transit. 2023, 78, 27. [Google Scholar] [CrossRef]
- Knez, D.; Zamani, O. Up-to-Date Status of Geoscience in the Field of Natural Hydrogen with Consideration of Petroleum Issues. Energies 2023, 16, 6580. [Google Scholar] [CrossRef]
- Wu, Y.; Qiao, W.; Zhang, S.; Zhang, Z.; Li, Y.; Fan, Z.; Zhang, L. Application of computer simulation method in deep underground engineering of complicated geological condition. IEEE Access 2020, 8, 174943–174963. [Google Scholar] [CrossRef]
- Zaheri, M.; Ranjbarnia, M.; Zareifard, M. A theoretical solution to investigate long-term behavior of pressurized tunnels in severe squeezing conditions. Comput. Geotech. 2023, 159, 105499. [Google Scholar] [CrossRef]
- Wu, Y.; Qiao, W.; Li, Y.; Jiao, Y.; Zhang, S.; Zhang, Z.; Liu, H. Application of computer method in solving complex engineering technical problems. IEEE Access 2021, 9, 60891–60912. [Google Scholar] [CrossRef]
- Sharafisafa, M.; Sato, A.; Sainoki, A.; Shen, L.; Aliabadian, Z. Combined finite-discrete element modelling of hydraulic fracturing in deep geologically complex reservoirs. Int. J. Rock Mech. Min. Sci. 2023, 167, 105406. [Google Scholar] [CrossRef]
- Plaza-Faverola, A.; Sultan, N.; Lucchi, R.; Altuna, N.; Ramachandran, H.; Singhroha, S.; Cooke, F.; Vadakkepuliyambatta, S.; Ezat, M.M.; Rasmussen, T.L. Spatial Changes in Gas Transport and Sediment Stiffness Influenced by Regional Stress: Observations From Piezometer Data Along Vestnesa Ridge, Eastern Fram Strait. J. Geophys. Res. Solid Earth 2023, 128, e2022JB025868. [Google Scholar] [CrossRef]
- Gan, L.; Xu, C.; Shen, Z.; Xu, L.; Zhang, H.; Liu, Y. Numerical investigation of seepage dissolution evolution of the bottom expansion cutoff wall in deep overburden. Constr. Build. Mater. 2023, 386, 131510. [Google Scholar] [CrossRef]
- Kacimov, A.; Obnosov, Y. Phreatic seepage around a rectilinear cutoff wall: The Zhukovsky-Vedernikov-Polubarinova-Kochina dispute revisited. Adv. Water Resour. 2023, 173, 104367. [Google Scholar] [CrossRef]
- Wu, Y.; Qiao, W.G.; Liu, H.N.; Li, Y.Z.; Zhang, S.; Xi, K.; Zhang, L. Research on sustainable development of fine-grained material cement slurry. Constr. Build. Mater. 2021, 302, 124155. [Google Scholar] [CrossRef]
- Gao, Y.; Jing, H.; Zhou, Z.; Shi, X.; Li, L.; Fu, G. Roles of carbon nanotubes in reinforcing the interfacial transition zone and impermeability of concrete under different water-to-cement ratios. Constr. Build. Mater. 2021, 272, 121664. [Google Scholar] [CrossRef]
- Hang, Y.; Sui, W.; Yuan, S. Experimental investigation of the seepage failure between bulkheads and surrounding rocks in deep underground mines. Bull. Eng. Geol. Environ. 2022, 81, 362. [Google Scholar] [CrossRef]
- Han, C.; Zhang, W.; Zhou, W.; Guo, J.; Yang, F.; Man, X.; Jiang, J.; Zhang, C.; Li, Y.; Wang, Z.; et al. Experimental investigation of the fracture grouting efficiency with consideration of the viscosity variation under dynamic pressure conditions. Carbonates Evaporites 2020, 35, 30. [Google Scholar] [CrossRef]
- Han, C.; Wei, J.; Zhang, W.; Zhou, W.; Yin, H.; Xie, D.; Yang, F.; Li, X.; Man, X. Numerical investigation of grout diffusion accounting for the dynamic pressure boundary condition and spatiotemporal variation in slurry viscosity. Int. J. Geomech. 2021, 21, 04021018. [Google Scholar] [CrossRef]
- Colas, E.; Klopries, E.; Tian, D.; Kroll, M.; Selzner, M.; Bruecker, C.; Khaledi, K.; Kukla, P.; Preusse, A.; Sabarny, C. Overview of converting abandoned coal mines to underground pumped storage systems: Focus on the underground reservoir. J. Energy Storage 2023, 73, 109153. [Google Scholar] [CrossRef]
- Kovalski, E.; Kongar-Syuryun, C.B.; Petrov, D. Challenges and prospects for several-stage stoping in potash minining. Sustain. Dev. Mt. Territ. 2023, 15, 349–364. [Google Scholar] [CrossRef]
- Rybak, J.; Kongar-Syuryun, C.; Tyulyaeva, Y.; Khayrutdinov, A.; Akinshin, I. Geomechanical substantiation of parameters of technology for mining salt deposits with a backfill. Min. Sci. 2021, 28, 19–32. [Google Scholar] [CrossRef]
- Phan, D.; Nguyen, G.; Bui, H. The work input to saturated porous media undergoing internal erosion. Int. J. Solids Struct. 2023, 283, 112487. [Google Scholar] [CrossRef]
- Wu, M.; Qin, Y.; Wang, X.; Li, G.; Zhu, C.; Zhu, S. Fluid mobility and influencing factors of tight sandstone reservoirs in China. J. Jilin Univ. 2021, 51, 35–51. [Google Scholar] [CrossRef]
- Zhang, C.; Sun, W.; Gao, H.; Xi, T.; He, Q.; Shi, J.; Qu, L. Quantitative calculation method for porosity evolutionof sandstone reservoirs based on cast thin sectiondata: Taking Chang 8 reservoir in Huanjiang area of Ordos basin as an example. Acta Sedimentol. Sin. 2014, 32, 365–375. [Google Scholar] [CrossRef]
- Johnson, J.; Jacobs, C.; Ferster, M.; Tadolini, S. Void fill and support techniques to stabilize drift excavated through a transition zone mined by a TBM at the Stillwater mine. Int. J. Min. Sci. Technol. 2017, 27, 71–76. [Google Scholar] [CrossRef]
- Liu, W.; Rostami, J.; Keller, E. Application of new void detection algorithm for analysis of feed pressure and rotation pressure of roof bolters. Int. J. Min. Sci. Technol. 2017, 27, 77–81. [Google Scholar] [CrossRef]
- Zhang, P.; Liu, X.; Wang, Y.; Sun, X. New progress in the study of shale nanopores. Adv. Earth Sci. 2014, 29, 1242–1249. [Google Scholar]
- Zhang, H. Study on the Microscopic Pore Structure and Seepage Characteristics of the First Member of the Teng 1 Reservoir in Aer Sag; Northwest University: Washington, DC, USA, 2017. [Google Scholar]
- Deng, H. Study on Pore Structure and Physical Property Characterization Methods of High-Porosity and Low-Permeability Carbonate Reservoirs; Southwest Petroleum University: Chengdu, China, 2018. [Google Scholar]
- Houseknecht, D.W. Intergranular pressure solution in four quartzose sandstones. SEPM J. Sediment. Res. 1988, 58, 228–246. [Google Scholar] [CrossRef]
- Liu, Q.; Wu, G.; Hu, J.; Hou, W. Cast thin slice image analysis method to obtain reservoir porosity. J. Surv. Mapp. Sci. Technol. 2009, 26, 69–71. [Google Scholar]
- Nabawy, B.S.; Géraud, Y.; Rochette, P.; Bur, N. Pore-throat characterization in highly porous and permeable sandstones. AAPG Bull. 2009, 93, 719–739. [Google Scholar] [CrossRef]
- Zhang, H. The genetic types of coal pores and their research. J. China Coal Soc. 2001, 1, 40–44. [Google Scholar]
- Gómez-Carracedo, A.; Alvarez-Lorenzo, C.; Coca, R.; Martínez-Pacheco, R.; Concheiro, A.; Gómez-Amoza, J.L. Fractal analysis of SEM images and mercury intrusion porosimetry data for the microstructural characterization of microcrystalline cellulose-based pellets. Acta Mater. 2009, 57, 295–303. [Google Scholar] [CrossRef]
- Ji, X.; Song, D.; Zhao, H.; Li, Y.; He, K. Experimental analysis of pore and permeability characteristics of coal by low-field NMR. Appl. Sci. 2018, 8, 1374. [Google Scholar] [CrossRef]
- Jiang, W.; Song, X.; Zhong, L. Pore characteristics of coal with different coal structure based on low-temperature liquid nitrogen experiment and its influence on gas outburst. J. China Coal Soc. 2011, 6, 609–614. [Google Scholar] [CrossRef]
- Li, Y.; Zhang, Y.; Zhang, L.; Hou, J. Characterization of pore structure of tectonic coal based on mercury injection, low-temperature N2 adsorption and CO2 adsorption. J. China Coal Soc. 2019, 44, 1188–1196. [Google Scholar] [CrossRef]
- Zhang, C. Research on the Pore Structure of Low-Permeability Reservoirs of the third Member of the Funing Formation in the South of Shanian-Huazhuang Area, Gaoyou Depression; Northwest University: Kirkland, WA, USA, 2009. [Google Scholar]
- Swanson, B.F. A simple correlation between permeabilities and mercury capillary pressures. J. Pet. Technol. 1981, 33, 2498–2504. [Google Scholar] [CrossRef]
- Yang, F.; Ning, Z.; Kong, D.; Liu, H. Analysis of shale pore structure by high-pressure mercury intrusion method and nitrogen adsorption method. Nat. Gas Geosci. 2013, 24, 450–455. [Google Scholar]
- Sun, L. A new method to study the characteristics of sandstone pore space structure. Daqing Pet. Geol. Dev. 2002, 21, 29–31. [Google Scholar]
- Pittman, E.D. Relationship of porosity and permeability to various parameters derived from mercury injection-capillary pressure curves for sandstone (1). AAPG Bull. 1992, 76, 191–198. [Google Scholar] [CrossRef]
- Wang, R.; Chen, M.; Sun, W. Classification and evaluation of micro-pore structure of ultra-low permeabilitys and stone reservoirs. Acta Geosci. 2008, 29, 213–220. [Google Scholar]
- Yuan, H.H.; Swanson, B.F. Resolving pore-space characteristics by rate-controlled porosimetry. SPE Form. Eval. 1989, 4, 17–24. [Google Scholar] [CrossRef]
- Yu, J.; Ma, J.; Lu, J.; Cao, Y.; Feng, S.; Li, W. Application of mercury intrusion—Constant rate of mercury intrusion in quantitative characterization of micro-pore throat structure of tight reservoirs—Taking Huachi-Heshui area Chang 7 in Ordos basin reservoir as an example. Pet. Geol. Exp. 2015, 37, 789–795. [Google Scholar]
- Guo, C.; Qin, Y.; Yang, Z.; Lu, L.; Yan, Q. NMR T2 spectrum and gas-water permeability characteristics and controlling factors of coal reservoirs in the Bide-Santang Basin in West Guizhou. J. China Univ. Min. Technol. 2014, 43, 841–852. [Google Scholar] [CrossRef]
- Li, X.; Kang, Y.; Haghighi, M. Investigation of pore size distributions of coals with different structures by nuclear magnetic resonance (NMR) and mercury intrusion porosimetry (MIP). Measurement 2018, 116, 122–128. [Google Scholar] [CrossRef]
- Zhou, C.; Liu, T.; Ma, Z.; Liu, Z.; Liu, G. Application of tube model to evaluate rock pore structure. Acta Pet. Sin. 2006, 27, 92–96. [Google Scholar]
- Zhu, L.; Zhang, C.; He, X.; Chen, Y.; Wei, C.; Yuan, S. Permeability prediction method of nuclear magnetic resonance logging based on dynamic pore structure efficiency. Xinjiang Pet. Geol. 2015, 36, 607–611. [Google Scholar]
- Fan, Y.; Liu, J.; Ge, X.; Deng, S.; Liu, H.; Gu, D. A new method for evaluating the permeability of tight sandstone based on dual cutoff values of nuclear magnetic resonance. Chin. J. Geophys. 2018, 61, 1628–1638. [Google Scholar]
- Wu, Z.; Lu, H.; Weng, L.; Liu, Q.; Shen, J. Research on seepage characteristics of fractured sandstone based on real-time nuclear magnetic resonance imaging technology. Chin. J. Rock. Mech. Eng. 2021, 40, 263–275. [Google Scholar] [CrossRef]
- He, Y.; Mao, Z.; Xiao, L.; Zhang, Y. Improved method for evaluating rock pore size distribution by nuclear magnetic resonance T2 distribution. Chin. J. Geophys. 2005, 2, 373–378. [Google Scholar] [CrossRef]
- He, Y.; Mao, Z.; Xiao, L.; Ren, X. A new method of constructing capillary pressure curve using nuclear magnetic resonance T2 distribution. J. Jilin Univ. 2005, 35, 177–181. [Google Scholar] [CrossRef]
- Liu, J.; Liu, X. The effect of effective pressure on the porosity and permeability of low-permeability porous media. Chin. J. Geomech. 2001, 1, 41–44. [Google Scholar]
- Cai, Y.; Zhao, L.; Xiao, S.; Zhang, L.; Gong, J.; Sun, L.; Sun, Y.; Kang, L. Pore structure characteristics of ultra-low-ultra-low permeability reservoirs based on constant-rate mercury intrusion: Taking Chang 3 oil layer group in Fuxian exploration area of Ordos basin as an example. Oil Gas Geol. Recovery Effic. 2013, 20, 32–35. [Google Scholar] [CrossRef]
- Zhou, S. The mechanism of gas flow in coal seams. J. China Coal Soc. 1990, 1, 15–24. [Google Scholar]
- Zhang, Z.; Jan, N.; Ren, T.; Zhang, J. Influence of void space on microscopic behavior of fluid flow in rock joints. Int. J. Min. Sci. Technol. 2014, 24, 335–340. [Google Scholar] [CrossRef]
- Chen, G.; Liu, Y.; Guo, N.; Wang, A.; Chang, H.; Zhang, T. Fractalcharacterization of cast thin sections: Taking Kunbei new area in Qaidam basin as an example. Lithol. Reserv. 2016, 28, 72–76. [Google Scholar]
- Liu, Y.; Xie, R.; Chai, X.; Li, G.; Ge, X.; Chen, Y. Quantitative extraction technology of pore microscopic parameters of tight sandstone reservoirs based on cast thin sections. Henan Sci. 2017, 35, 134–138. [Google Scholar]
- SY/T5368-2000; Thin Section Examination of Rock. State Administration of Petroleum and Chemical Industry; Petroleum Geological Exploration Standard Committee: Beijing, China, 2000.
- Yao, M. Research on the Microstructure Characteristics and Permeability Coefficient Change Mechanism of Soft Soil in the Chongming Dongtan Hydraulic Reclamation Area; Jilin University: Changchun, China, 2020. [Google Scholar]
- Hu, Z. Research and Application of Micro-Pore Structure Characteristics of Low-Permeability Reservoirs; Graduate University of Chinese Academy of Sciences, Institute of Percolation Fluid Mechanics: Huairou, China, 2006. [Google Scholar]
- Meng, Q.; Zhao, Y.; Hu, Y.; Feng, Z.; Yu, Y. Experimental study on the pore structure of coking coal. Coal News 2011, 36, 487–490. [Google Scholar] [CrossRef]
- Prill, T.; Schladitz, K.; Jeulin, D.; Faessel, M.; Wieser, C. Morphological segmentation of FIB-SEM data of highly porous media. J. Microsc. 2013, 250, 77–87. [Google Scholar] [CrossRef] [PubMed]
- Zhang, P. Research on Pore Structure and Microscopic Seepage Mechanics Model of Rock and Soil Media; Tsinghua University: Beijing, China, 2017. [Google Scholar]
- Shan, Y.; Cui, B.; Huang, S.; Luo, Z. Analysis and research examples of formation damage of clastic oil and gas reservoirs. J. Chengdu Inst. Geol. 1993, 2, 69–77+124. [Google Scholar]
- SY/T5324-2005; Petroleum Tractor Hoist. State Administration of Petroleum and Chemical Industry; Petroleum Geological Exploration Standard Committee: Beijing, China, 2005.
- Rahimpour-Bonab, H.; Aliakbardoust, E. Pore facies analysis: Incorporation of rock properties into pore geometry based classes in a Permo-Triassic carbonate reservoir in the Persian Gulf. J. Geophys. Eng. 2014, 11, 035008. [Google Scholar] [CrossRef]
- Gong, J. Research on Three-Dimensional Reconstruction and Seepage Simulation of Coal Based Porous Media; China University of Mining and Technology: Xuzhou, China, 2020. [Google Scholar]
- Biot, M.A. Theory of propagation of elastic waves in a fluid-saturated porous solid. I. low-frequency range. J. Acoust. Soc. Am. 1956, 28, 168–178. [Google Scholar] [CrossRef]
- Wang, R.; Zhang, Q.; Shao, X.; He, R.; Li, B.; Wang, G.; Zheng, S. Multi-scale CT imaging technology to identify nano-scale pore throats in ultra-low permeability sandstone reservoirs. Prog. Geophys. 2019, 34, 1–10. [Google Scholar]
- Li, W.; Yao, H.; Liu, H.; Kang, Z.; Song, X.; Feng, Z. Fine characterization of three-dimensional pores of coal with different coal body structures based on micro-CT. J. China Coal Soc. 2014, 39, 1127–1132. [Google Scholar] [CrossRef]
- Liu, Q.; Wang, Z. Research progress of rock numerical simulation based on digital image processing. Chin. J. Rock. Mech. Eng. 2020, 39, 3286–3296. [Google Scholar] [CrossRef]
- Chen, L.; Wang, X.; Wang, Y. Making vector data and 3D display from relief map by R2V and ArcGIS. J. Guizhou Univ. Nat. Sci. 2012, 29, 30–33. [Google Scholar] [CrossRef]
- Cui, C.; Li, C. The application of R2V vectorization in AutoCAD. Light Ind. Technol. 2015, 31, 75+103. [Google Scholar]
- Yan, H. How to use R2V software to convert manual drawings into digital graphics. China Sci. Technol. Inf. 2009, 12, 149. [Google Scholar]


| Types | Terrigenous Debris Volume Fraction/% | |||||
|---|---|---|---|---|---|---|
| Quartz and Flint | Feldspar | Rock Debris | Mica | |||
| Igneous Rock | Metamorphic Rock | Sedimentary Rock | ||||
| Maximum | 70.7 | 19.5 | 5.8 | 9.4 | 6.1 | 5.9 |
| Minimum | 50.8 | 8.2 | 0.4 | 3.2 | 1.5 | 1.1 |
| Average | 59.8 | 13.6 | 1.4 | 5.9 | 3.8 | 1.9 |
| Parameter Types | Percentage Content/% | ||
|---|---|---|---|
| Subedges/% | Subcircle-Subedge/% | Subround/% | |
| Tangkou deep well | 85.4 | 11.5 | 3.1 |
| Parameter Types | Percentage Content/% | ||||
|---|---|---|---|---|---|
| Poor | Medium-Poor | Medium | Good-Medium | Good | |
| Tangkou deep well | 12.33 | 18.43 | 47.86 | 15.77 | 5.61 |
| Classification of Porosity Types in Clastic Coal-Bearing Strata | Classification of Permeability Types of Clastic Coal-Bearing Strata | ||||
|---|---|---|---|---|---|
| Porosity Types | Porosity (Φ/%) | Permeability Types | Permeability (k/10−3 μm2) | Subcategory | |
| Ultra high hole | Φ ≥ 30 | Extra high osmosis | k ≥ 2000 | ||
| High hole | 25 ≤ Φ < 30 | High osmosis | 500 ≤ k < 2000 | ||
| Medium hole | 15 ≤ Φ < 25 | Medium osmosis | 50 ≤ k < 500 | ||
| Low hole | 10 ≤ Φ < 15 | Low osmosis | 10 ≤ k < 50 | I | |
| Extra low hole | 5 ≤ Φ < 10 | Extra low osmosis | 1 ≤ k < 10 | 5 ≤ k < 10 | IIa |
| 1 ≤ k < 5 | IIb | ||||
| Ultra low hole | 5 < Φ | Ultra low osmosis | k < 1 | 0.5 ≤ k < 1 | IIIa |
| 0.1 ≤ k < 0.5 | IIIb | ||||
| k < 0.1 | IIIc | ||||
| Research Area | Parameter Type | Absolute Content/% | |||
|---|---|---|---|---|---|
| Intergranular Pores | Feldspar Pores | Karst Pores | Intercrystalline Pores | ||
| Tangkou Coal Mine | Maximum | 6.7 | 2.4 | 1.1 | 0.6 |
| Minimum | 1.4 | 0.7 | 0.1 | 0.05 | |
| Average | 2.1 | 1.0 | 0.3 | 0.15 | |
| Curve Type | Range | Porosity/% | Permeability/10−3 μm2 | Aperture/μm |
|---|---|---|---|---|
| I | Maximum | 24.3 | 521 | 300 |
| Minimum | 15.6 | 90 | 30 | |
| Average | 20.3 | 248 | 100 |
| Curve Type | Range | Porosity/% | Permeability/10−3 μm2 | Aperture/μm |
|---|---|---|---|---|
| II | Maximum | 18.9 | 156 | 26 |
| Minimum | 6.5 | 43 | 0.1 | |
| Average | 12.6 | 83 | 7 |
| Curve Type | Range | Porosity/% | Permeability/10−3 μm2 | Aperture/μm |
|---|---|---|---|---|
| III | Maximum | 10.5 | 105 | 10 |
| Minimum | 2.8 | 5 | 0.05 | |
| Average | 6.2 | 44 | 1.6 |
| Curve Type | Range | Porosity/% | Permeability/10−3 μm2 | Aperture/μm |
|---|---|---|---|---|
| IV | Maximum | 6.9 | 54 | 100 |
| Minimum | 2.1 | 2.6 | 0.01 | |
| Average | 3.5 | 5.8 | 0.1 |
| I | II | III | IV | |||||
|---|---|---|---|---|---|---|---|---|
| Pressure | Aperture | Pressure | Aperture | Pressure | Aperture | Pressure | Aperture | |
| Maximum | 7.4 | 68 | 170 | 9 | 605 | 0.65 | 2451 | 0.11 |
| Minimum | 3.1 | 28.8 | 23 | 1.2 | 310 | 0.33 | 2121 | 0.08 |
| Average | 5.4 | 44.6 | 75 | 5.5 | 503 | 0.44 | 2314 | 0.09 |
| Mean Pore Size/μm | ||||
|---|---|---|---|---|
| I | II | III | IV | |
| Maximum | 31.5 | 4.15 | 0.47 | 0.0655 |
| Minimum | 15.9 | 0.75 | 0.25 | 0.058 |
| Average | 21.8 | 2.67 | 0.36 | 0.0605 |
| Sorting Coefficient | ||||
|---|---|---|---|---|
| I | II | III | IV | |
| Maximum | 2.68 | 1.46 | 1.68 | 1.33 |
| Minimum | 2.21 | 0.81 | 0.75 | 0.67 |
| Average | 2.41 | 1.24 | 0.98 | 0.88 |
| Skewness | ||||
|---|---|---|---|---|
| I | II | III | IV | |
| Maximum | 2.59 | 2.47 | −0.31 | −1.201 |
| Minimum | 0.71 | −0.16 | −0.62 | −1.54 |
| Average | 1.43 | 0.65 | −0.45 | −1.48 |
| Mercury Removal Efficiency | ||
|---|---|---|
| III | IV | |
| Maximum | 68.52 | 60.66 |
| Minimum | 56.15 | 51.75 |
| Average | 64.96 | 57.41 |
| Tortuosity | ||||
|---|---|---|---|---|
| I | II | III | IV | |
| Maximum | 1.907 | 2.778 | 3.011 | 3.288 |
| Minimum | 1.566 | 2.214 | 2.172 | 2.907 |
| Average | 1.732 | 2.379 | 2.673 | 3.013 |
| Condition Setting | Definite Solution Condition |
|---|---|
| Initial displacement | |
| Displacement boundary | |
| Stress boundary condition | |
| Initial pressure | |
| Pressure boundary condition | |
| Flow boundary conditions |
| Calculation Parameters | Value | Unit | |
|---|---|---|---|
| Assignment parameters | Model height | H = 500 | μm |
| Model width | L = 280 | μm | |
| Water inlet pressure | P1 | MPa | |
| Outlet pressure | P2 | MPa | |
| Fluid flow rate | m/s | ||
| Fluid density | = 1 | g/cm3 | |
| Fluid modulus of elasticity | 6 | Gpa | |
| Dynamic viscosity | = 0.001 | Pa·s | |
| Rock density | = 2.27 | g/cm3 | |
| Rock elastic modulus | 40 | Gpa | |
| Poisson’s ratio | = 0.21 | / |
| Boundary Type | Boundary Setting | Value | Mathematical Model |
|---|---|---|---|
| Entrance | Pressure, viscous stress | ||
| Exit | Pressure, viscous stress | P = 0 Pa | |
| Wall | Wall surface | — | |
| Symmetrical boundary | Symmetry | — | , |
| Fixed wall boundary | Fixed | — | — |
| Variable | Symbol | Unit | Model One | Model Two | Model Three | |
|---|---|---|---|---|---|---|
| Assignment parameters | Porosity | n | % | 25 | 20 | 15 |
| Permeability | 400 × 10−3 | 100 × 10−3 | 25 × 10−3 |
Disclaimer/Publisher’s Note: The statements, opinions and data contained in all publications are solely those of the individual author(s) and contributor(s) and not of MDPI and/or the editor(s). MDPI and/or the editor(s) disclaim responsibility for any injury to people or property resulting from any ideas, methods, instructions or products referred to in the content. |
© 2023 by the authors. Licensee MDPI, Basel, Switzerland. This article is an open access article distributed under the terms and conditions of the Creative Commons Attribution (CC BY) license (https://creativecommons.org/licenses/by/4.0/).
Share and Cite
Zhu, Y.; Wu, Y.; Zhang, L.; Zhang, S. Experimental and Numerical Simulations of Pore Structures and Seepage Characteristics of Deep Sandstones. Processes 2023, 11, 3411. https://doi.org/10.3390/pr11123411
Zhu Y, Wu Y, Zhang L, Zhang S. Experimental and Numerical Simulations of Pore Structures and Seepage Characteristics of Deep Sandstones. Processes. 2023; 11(12):3411. https://doi.org/10.3390/pr11123411
Chicago/Turabian StyleZhu, Yinge, Yue Wu, Lei Zhang, and Shuai Zhang. 2023. "Experimental and Numerical Simulations of Pore Structures and Seepage Characteristics of Deep Sandstones" Processes 11, no. 12: 3411. https://doi.org/10.3390/pr11123411
APA StyleZhu, Y., Wu, Y., Zhang, L., & Zhang, S. (2023). Experimental and Numerical Simulations of Pore Structures and Seepage Characteristics of Deep Sandstones. Processes, 11(12), 3411. https://doi.org/10.3390/pr11123411